full year results presentation 12 months ended 31 …
TRANSCRIPT

FULL YEAR RESULTS PRESENTATION 12 Months ended 31 December 2013
13 March 2014

FU
LL Y
EA
R R
ES
ULT
S P
RE
SE
NT
AT
ION
DISCLAIMER
2
This document may contain certain forward-looking statements with respect to certain of The British
United Provident Association Limited group’s (“Bupa’s”) plans and its current goals and expectations
relating to future financial condition, performance and results. By their nature forward-looking
statements involve risk and uncertainty because they relate to future events and circumstances which
are beyond Bupa’s control, including, among others, global economic and business conditions, market
related risks such as fluctuations in interest rates and exchange rates, the policies and actions of
governmental and regulatory authorities, the impact of competition, the timing, impact and other
uncertainties of future mergers or combinations within relevant industries. As a result, Bupa’s actual
future condition, performance and results may differ materially from the plans, goals and expectations
set out in Bupa’s forward-looking statements. Bupa does not undertake to update forward-looking
statements contained in this document or any other forward-looking statement it may make.
CAUTIONARY STATEMENT CONCERNING FORWARD-LOOKING STATEMENTS

FU
LL Y
EA
R R
ES
ULT
S P
RE
SE
NT
AT
ION
AGENDA
3
Introduction and Highlights Stuart Fletcher, CEO
Financial Review Evelyn Bourke, CFO
Group Financial Review
Segmental Results
Cash, Debt and Solvency
Operating Priorities and Outlook Stuart Fletcher, CEO
Q&A
1.0
2.0
2.1
2.2
2.3
3.0
4.0

FU
LL Y
EA
R R
ES
ULT
S P
RE
SE
NT
AT
ION
FY 2013 GROUP HIGHLIGHTS:
ACCELERATED GLOBAL EXPANSION DRIVES INTERNATIONAL GROWTH
4
Good growth in customers, revenue and underlying profit
– Revenues up 8%
– Underlying profit before taxation up 5%(1)
– Customer numbers up 57%(2)
Significant M&A and capital investment
Leverage increased to fund acquisitions
Strong financial position and confidence in future direction
Driving quality, affordable healthcare for our customers
(1) To reflect the trading performance of the business in a consistent manner, we adjust profit before taxation for a number of one-off items. See slide 12
(2) We have changed our definition of customers to be an individual or party from whom Bupa derives revenue and who can elect to use our services. 2012
comparatives have also been restated. This includes joint ventures and associates. In 2013, customers increased by 5.4m (39%) as a result of acquisitions,
and 1.2m (9%) as a result of growth in our Indian micro insurance scheme customers.

FU
LL Y
EA
R R
ES
ULT
S P
RE
SE
NT
AT
ION
EMERGING GLOBAL HEALTHCARE TRENDS
5
CHANGING NATURE OF HEALTHCARE
NEEDS
Greater prevalence of age-related and
long-term conditions, driven by ageing
population and lifestyle choices
PERSON-CENTRED CARE
Integrating care to provide a connected service
focused around the individual can deliver
better quality care, but is challenging across
fragmented health systems
MOVING CARE OUT OF THE HOSPITAL
Growing trend, alongside changing healthcare
needs, to move to delivery of care outside
the hospital to more appropriate and effective
settings
CHANGES IN PATIENT EXPECTATIONS
Populations are increasingly expecting more
from their healthcare providers and becoming
empowered by easier access to information.
With this, follows demand for more
personalised care
PAYING FOR OUTCOMES RATHER
THAN SERVICE
Some governments are now considering new
payment systems based on outcomes and
different funding models, recognising that
radical reforms may be necessary to deliver
quality outcomes in a sustainable way
PROACTIVE RATHER THAN REACTIVE
Healthcare systems increasingly recognise
the importance of shifting focus from reactive
to preventative solutions. Prevention
and wellness are crucial to addressing
long-term conditions

FU
LL Y
EA
R R
ES
ULT
S P
RE
SE
NT
AT
ION
BUPA 2020
6
In 2012 we created an ambitious strategic
vision for what Bupa will look like in 2020
Bupa 2020 is defined by our enduring purpose
of longer, healthier, happier lives
One year on we are building momentum as our
people embrace and seek to deliver our vision

FU
LL Y
EA
R R
ES
ULT
S P
RE
SE
NT
AT
ION
Country Bupa
participation
Bupa in Joint
Venture /
Partnership
Bupa distributes
3rd party products
New/Significant
expansion
UK Spain IPMI HK Thai. India Aus NZ US(2) Arabia Poland
Funding
Healthcare
Provision
Care Mgt.
& Comm.
Aged Care
Provision
PMI
Dental
Hospital
Home
Healthcare
Dental
Optical
Travel
Health
Dialog
Other
Wellness
Care Home
Medical
Alarms
Care
Villages
Med. Sub-
scriptions
Clinics(3)
7
GROWING OUR FOOTPRINT AND PRESENCE ACROSS
THE VALUE CHAIN IN LINE WITH BUPA 2020
Brain
Rehab
Market
Unit UK SLA
Chile(1)
Aus & NZ IDM BGMU
7
(1) Completed February 2014
(2) Bupa’s stake in Highway to Health enables access to the Blue Cross and Blue Shield system and ability to sell to US outbound customers
(3) Including primary care, diagnostic and wellness clinics

FU
LL Y
EA
R R
ES
ULT
S P
RE
SE
NT
AT
ION
2013 – ACHIEVEMENTS
8
M&A investment totalling £1.3bn, including the execution of six major acquisitions
H1 acquisitions performing well
Acquired Richmond Care Villages in UK in August
Acquired Quality HealthCare in October, complementing our existing Hong Kong business
Acquired a 49% stake in Highway to Health, in December, forming a partnership with Blue Cross
and Blue Shield system that will create the largest global healthcare provider network
In December announced decision to tender for up to 56% of Cruz Blanca to create a domestic
platform in Chile and the Andean region. Transaction completed in February 2014
EXPANDING OUR PARTICIPATION
Significant management activity taken to mitigate challenging external operating environment
Created global expert networks and platforms around health and benefits management,
aged care and sales and marketing, to share best practice
Solvency II capital now the reference for all strategic investment decisions
Large scale, global quantitative consumer study leading to the new global brand proposition for Bupa
De-risked the DB pension scheme
Successful bond issue
BUILDING CAPACITY AND DISCIPLINE

FU
LL Y
EA
R R
ES
ULT
S P
RE
SE
NT
AT
ION
2013 – ACHIEVEMENTS (CONTINUED)
9
Market Unit structure and operating model now in place
Selective external recruitment and new members to the Executive Team
Significant investment in leadership
First private healthcare company to be awarded Carbon Trust Standard certification
ALIGNING THE ORGANISATION
REACHING MILLIONS MORE
Partnering with:
– World Heart Federation to develop and launch Ground Miles
– Alzheimer’s Disease International to launch 10 point dementia charter
– UICC to improve risk assessment, screening and early detection of cancer at the workplace
– WHO/ITU to deliver mHealth
– IDF: launched a 2nd research project in September 2013 – a Global Diabetes Scorecard

FU
LL Y
EA
R R
ES
ULT
S P
RE
SE
NT
AT
ION
AGENDA
1.0
2.0
2.1
2.2
2.3
3.0
4.0
10
Introduction and Highlights Stuart Fletcher, CEO
Financial Review Evelyn Bourke, CFO
Group Financial Review
Segmental Results
Cash, Debt and Solvency
Operating Priorities and Outlook Stuart Fletcher, CEO
Q&A

FU
LL Y
EA
R R
ES
ULT
S P
RE
SE
NT
AT
ION
FY 2013 FINANCIAL OVERVIEW
(Up 8%)
11
REVENUES
FY2012 £8.4bn
FY2013 £9.1bn
(Down 12%)
PROFIT BEFORE TAX(1)
FY2012 £585.1m
FY2013 £514.4m
(Up 5%)
UNDERLYING PROFIT BEFORE
TAX(2)
FY2012 £609.5m
FY2013 £638.5m
(Down 37%)
NET CASH GENERATED FROM
OPERATING ACTIVITIES
FY2012 £742.9m
FY2013 £467.6m
(Up 10% pts)
LEVERAGE(3)
FY2012 19%
FY2013 29%
(Down 16%)
IGD COVERAGE
FY2012 367%
FY2013 309%
(1) 2012 restated to reflect revised IAS19
(2) 2012 restated to exclude £4.0m of transaction costs and the impact of IAS19
(3) Gross debt (including hybrid debt) / gross debt plus equity

FU
LL Y
EA
R R
ES
ULT
S P
RE
SE
NT
AT
ION
UNDERLYING PROFIT
12
FY 2013 FY 2012
£m £m
Summary of results
Total revenues 9,058.7 8,373.9
Underlying profit before taxation 638.5 609.5
Non-underlying items (124.1) (24.4)(1)
Profit before taxation 514.4 585.1
Taxation (103.0) (134.9)
Profit for the period 411.4 450.2
NON-UNDERLYING PROFIT ITEMS
FY 2013 FY 2012(1)
£m £m
Amortisation of intangible assets arising on business combinations 37.3 26.8
Impairment of goodwill and intangible assets 33.5 -
Restructuring costs 21.7 17.9
Transaction costs on acquisitions and disposals 28.6 4.0
Realised and unrealised foreign exchange gains and losses 16.1 4.4
Loss on disposal of fixed assets 2.3 0.2
Net property revaluation (gain)/loss (6.4) 4.5
Gains on return seeking assets, net of hedging - (26.1)
Other (9.0) (7.3)
Total non-underlying profit items 124.1 24.4
(1) 2012 restated to include £4.0m of transaction costs

FU
LL Y
EA
R R
ES
ULT
S P
RE
SE
NT
AT
ION
AGENDA
1.0
2.0
2.1
2.2
2.3
3.0
4.0
13
Introduction and Highlights Stuart Fletcher, CEO
Financial Review Evelyn Bourke, CFO
Group Financial Review
Segmental Results
Cash, Debt and Solvency
Operating Priorities and Outlook Stuart Fletcher, CEO
Q&A

FU
LL Y
EA
R R
ES
ULT
S P
RE
SE
NT
AT
ION
4.9m
AUSTRALIA AND NEW ZEALAND
14
Good growth continues and customer numbers increase despite
economic and regulatory headwinds
Health Insurance
Revenue flat in an environment where regulatory changes stimulate customer
downgrades
New, more affordable, tailored products developed to mitigate this trend
Health Services Health Services achieved double digit increase in revenue and strong profit growth
Dental Corporation has contributed significant revenue and profit since the acquisition
in May
Care Services Homes acquired from Innovative Care contributed to revenue growth
Double digit profit growth
Occupancy levels remain consistently high at 92.2%
Largest provider of Care Services in New Zealand with 11% market share
CUSTOMERS
(FY 2012: 4.1m Up 19%)
£284.1m
Underlying PROFIT
(FY 2012: £274.6m Up 3%)
£3,791.8m
REVENUES
(FY 2012: £3,554.0m Up 7%)
REVENUES BY BUSINESS

FU
LL Y
EA
R R
ES
ULT
S P
RE
SE
NT
AT
ION
3.9m
UNITED KINGDOM
15
UK on a better trajectory with stable revenues and customer
numbers with growth in profits
Health Insurance
Much needed profit growth year-on-year as a result of initiatives to reduce operating costs
and tackle medical inflation
Improved operating margins put the business on sustainable footing for the long term
Bupa welcomes regulatory reform that ensures longevity of the market
Care Services Revenue and occupancy remained flat
Publicly funded residents increased which, combined with higher running costs, put
pressure on margins
We invested £59m in our UK care home network
Acquisition of Richmond Care Villages marked an expansion of our offering
Health Clinics Revenue and customer numbers increased year-on-year, driven by the expansion
of dental centres
Home Healthcare & Hospital Services Significant revenue growth on 2012 was mitigated by public sector pricing pressure,
pushing this segment to a small loss
Revenue and customer numbers increased at Bupa Cromwell Hospital whilst disciplined
cost control led to an increase in profitability
CUSTOMERS
(FY 2012: 3.9m Flat)
£139.5m
Underlying PROFIT
(FY 2012: £110.9m Up 26%)
£2,573.5m
REVENUES
(FY 2012: £2,528.8 Up 2%)
REVENUES BY BUSINESS

FU
LL Y
EA
R R
ES
ULT
S P
RE
SE
NT
AT
ION
2.4m
SPAIN AND LATIN AMERICA DOMESTIC
16
Good revenue and profit growth in a very challenging macro
environment in Spain. First tangible moves in Latin America in 2014
Health Insurance
Revenues up with good growth in customer numbers
Ongoing initiatives to manage medical costs against backdrop of higher claims
Hospitals & Provision Double-digit growth driven by PPP performance including the acquisition of Torrejon
Hospital, in late 2012
Dental Sale of dental products was strong, driven by new product launches, with 80,000 new
customers compared to 2012
Care Services Growth in residency and occupancy, which partially offset the impact of lower fees
Latin America Domestic Announced tender offer to acquire up to 56% in Cruz Blanca in December. Transaction
completed February 2014
CUSTOMERS
(FY 2012: 2.3m Up 8%)
£126.5m
Underlying PROFIT
(FY 2012: £113.4m Up 12%)
£1,363.5m
REVENUES
(FY 2012: £1,190.8m Up 15%)
REVENUES BY BUSINESS
FU
LL Y
EA
R R
ES
ULT
S P
RE
SE
NT
AT
ION
8.7m
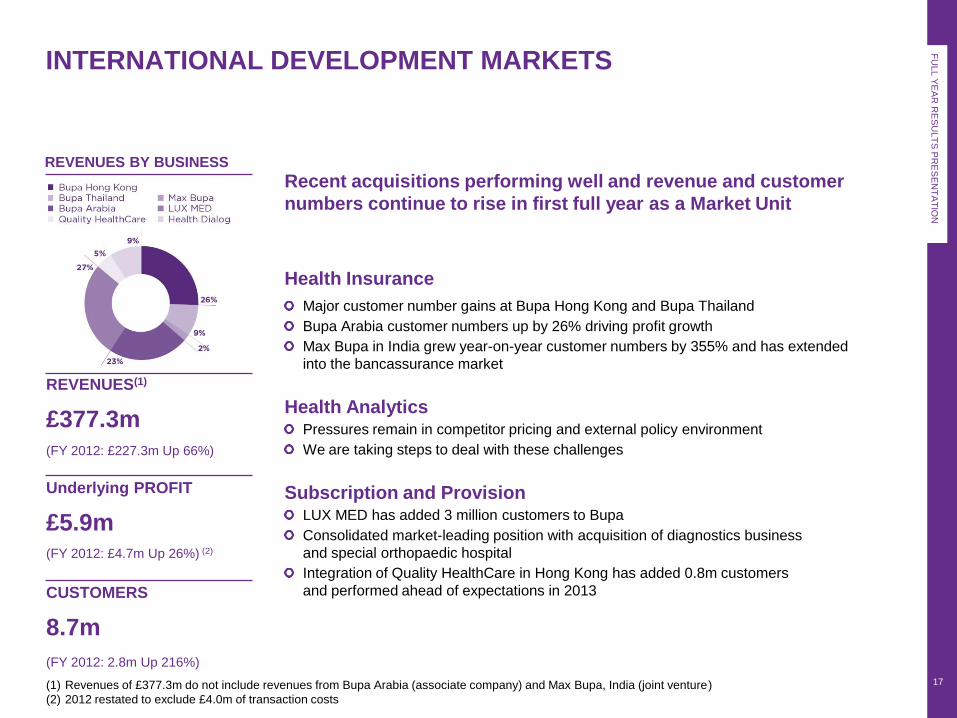
INTERNATIONAL DEVELOPMENT MARKETS
17
Recent acquisitions performing well and revenue and customer
numbers continue to rise in first full year as a Market Unit
Health Insurance
Major customer number gains at Bupa Hong Kong and Bupa Thailand
Bupa Arabia customer numbers up by 26% driving profit growth
Max Bupa in India grew year-on-year customer numbers by 355% and has extended
into the bancassurance market
Health Analytics Pressures remain in competitor pricing and external policy environment
We are taking steps to deal with these challenges
Subscription and Provision LUX MED has added 3 million customers to Bupa
Consolidated market-leading position with acquisition of diagnostics business
and special orthopaedic hospital
Integration of Quality HealthCare in Hong Kong has added 0.8m customers
and performed ahead of expectations in 2013 CUSTOMERS
(FY 2012: 2.8m Up 216%)
£5.9m
Underlying PROFIT
(FY 2012: £4.7m Up 26%) (2)
£377.3m
REVENUES(1)
(FY 2012: £227.3m Up 66%)
REVENUES BY BUSINESS
(1) Revenues of £377.3m do not include revenues from Bupa Arabia (associate company) and Max Bupa, India (joint venture)
(2) 2012 restated to exclude £4.0m of transaction costs

FU
LL Y
EA
R R
ES
ULT
S P
RE
SE
NT
AT
ION
1.9m
BUPA GLOBAL (FORMERLY IPMI(1))
18
Meaningful increase in corporate contract wins drive revenues
and profitability
New executive team driving new initiatives including a global customer focused strategy
Performance was particularly strong across UAE, Singapore and Hong Kong
Ministry of Foreign Affairs (MOFA) contracts were won in Saudi Arabia, Mexico and Peru
Bupa became market leader in Egypt with 46% market share
Acquisition of 49% of Highway to Health (HTH) gives Bupa access to US healthcare
system for the global customer proposition
A strategic partnership with Blue Cross and Blue Shield, America’s largest health system,
giving it access to 11,500 hospitals and 750,000 medical professionals worldwide
CUSTOMERS
(FY 2012: 0.9m Up 117%)
£114.0m
Underlying PROFIT
(FY 2012: £100.7m Up 13%)
£953.0m
REVENUES
(FY 2012: £872.0m Up 9%)
REVENUES BY BUSINESS
(1) International Private Medical Insurance
(2) Bupa Global Business Unit was formerly Bupa International
(2)

FU
LL Y
EA
R R
ES
ULT
S P
RE
SE
NT
AT
ION
AGENDA
1.0
2.0
2.1
2.2
2.3
3.0
4.0
19
Introduction and Highlights Stuart Fletcher, CEO
Financial Review Evelyn Bourke, CFO
Group Financial Review
Segmental Results
Cash, Debt and Solvency
Operating Priorities and Outlook Stuart Fletcher, CEO
Q&A

FU
LL Y
EA
R R
ES
ULT
S P
RE
SE
NT
AT
ION
20
CASH GENERATION
GOOD OPERATING CASHFLOW AND SIGNIFICANT FUNDING FOR ACQUISITIONS
FY 2013 FY 2012
£m £m
Profit before taxation 514.4 585.1(1)
Financial income (82.1) (124.6)
Financial expenses 88.0 69.8
Depreciation, amortisation and impairment 259.6 196.8
Other non-cash items 18.6 1.2
Changes in working capital and provisions/Other (215.6) 135.7(1)
Taxation paid (115.3) (121.1)
Net cash generated from operating activities 467.6 742.9
Capital expenditure(2) (330.9) (264.9)
Net acquisitions/disposals of businesses (976.6) (4.1)
Net interest income received/paid (2.4) (7.0)
Repayment of borrowings (334.5) (26.7)
Proceeds from new borrowings 868.5 -
FX/Other (197.8) 8.2
Net increase/(decrease) in cash and financial investments (506.1) 448.4
Closing cash and financial investments(3) 3,053.8 3,559.9
(1) 2012 restated to reflect revised IAS19
(2) Includes purchase of investment properties
(3) Includes restricted assets

FU
LL Y
EA
R R
ES
ULT
S P
RE
SE
NT
AT
ION
CASH AND FINANCIAL INVESTMENTS
21
CASH AND INVESTMENT
PORTFOLIO
£3.1bn cash and financial investments
Decrease in cash due to funding acquisitions
Conservative investment portfolio
Approximately 87% of portfolio held in investments rated
>=A-/A3 by 1 or more agency
£250m return seeking asset portfolio in UK insurance entity:
equivalent to 8% of Group cash and financial investments
FY13 CASH AND INVESTMENTS
BY CREDIT RATING (%)
£3.6bn
£3.1bn
FY12
FY13
Return seeking assets
Cash (e.g. deposits, liquidity funds)
BUPA CONTINUES TO PURSUE A LOW RISK INVESTMENT STRATEGY

FU
LL Y
EA
R R
ES
ULT
S P
RE
SE
NT
AT
ION
BORROWINGS
22
LEVERAGE (%)
Higher levels of borrowing to fund growth with £500m subordinated bond issued in H1 2013
£300m bank facility put in place at year-end to provide prudent liquidity for acquisitions
Bupa Finance Plc senior debt ratings re-affirmed at A- (Fitch) and Baa2 (Moody’s)
20.3
19.5
19.2
25.4
29.1
Dec-11
Jun-12
Dec-12
Jun-13
Dec-13
BUPA MANAGES ITS LEVERAGE WITHIN RATING AGENCY TOLERANCES
FY 2013 FY 2012
£m £m
Borrowings under £1.1bn bank facilities 375 –
£500m subordinated bond due 2023 499 –
£330m hybrid bond (perpetual) 386 420
£350m senior bond due 2016 365 361
£235m care homes securitisation due 2029 / 2031 238 238
£50m debenture due 2014 51 53
Other borrowings 69 74
Total borrowings 1,983 1,146

FU
LL Y
EA
R R
ES
ULT
S P
RE
SE
NT
AT
ION
SOLVENCY
23
Acquisitions reduced solvency surplus by £1.1bn
Although the implementation of Solvency II has been delayed, it is a key factor
in all long term decisions
THE GROUP MAINTAINS STRONG REGULATORY SOLVENCY LEVELS
Group Solvency Position (IGD) FY2013 FY2012
£m £m
Capital Resources 2,462.7 2,901.9
Capital Requirement 797.1 790.4
Solvency Surplus 1,665.6 2,111.5
Solvency Coverage 309% 367%
£446M REDUCTION IN SURPLUS SINCE FY12 FOLLOWING SIGNIFICANT ACQUISITIONS
Group Solvency Movements
£m
2012 Year end solvency surplus 2,111.5
Profits 405.8
Issue of subordinated debt 500.0
Acquisitions (1,102.0)
Foreign Exchange (150.1)
Other movements (92.9)
Change in requirement (6.7)
2013 Year end solvency surplus 1,665.6

FU
LL Y
EA
R R
ES
ULT
S P
RE
SE
NT
AT
ION
SOLVENCY II
24
We expect Solvency II to be fully effective from 1 January 2016
We are currently in the Solvency II preparation period that started 1 January 2014
Bupa will be regulated as a mixed activity Group, with Bupa Insurance Ltd and Sanitas Seguros
regulated as Solo entities
Their National Supervisors have confirmed their reporting requirements for Bupa Insurance Ltd
and Sanitas Seguros during the preparation phase
Programme of implementation underway across Bupa
We will remain comfortably capitalised under Solvency II, both as a Group and at each Solo
entity level
BUPA REMAINS COMFORTABLY SOLVENT UNDER THE NEW REGIME

FU
LL Y
EA
R R
ES
ULT
S P
RE
SE
NT
AT
ION
AGENDA
1.0
2.0
2.1
2.2
2.3
3.0
4.0
25
Introduction and Highlights Stuart Fletcher, CEO
Financial Review Evelyn Bourke, CFO
Group Financial Review
Segmental Results
Cash, Debt and Solvency
Operating Priorities and Outlook Stuart Fletcher, CEO
Q&A

FU
LL Y
EA
R R
ES
ULT
S P
RE
SE
NT
AT
ION
CURRENT OPERATING PRIORITIES
26
Transformation – in health funding, enhancing end
to end customer experience and operating
efficiency
Expanding our care home portfolio while creating
additional services, e.g. care hubs
Growing dental business and leveraging increased
Bupa customer traffic (cross-selling)
Growing the newly created Health Services
business and delivering public sector opportunities
Australia
& New
Zealand
United
Kingdom
Spain & Latin
America
Domestic
International
Development
Markets
Bupa
Global
Bupa-wide
priorities
In Hong Kong, successfully integrating Quality
HealthCare and delivering bancassurance plans
Accelerating the growth of LUX MED
Resolving Health Dialog performance
Transformation – creating a flexible operating
system that will be used in multiple insurance
markets
Transformation - delivering operational
efficiencies and brand coherence by operating
as a single Market Unit
Targeting under-served self-pay segments and
maximising opportunities in public sector
integrated care contracts
Optimising portfolios in care homes and clinics
Shifting distribution focus to admitted markets,
individual / SME and direct corporate
Partnering with SisCos to utilise joint scale and
local market expertise to grow in domestic
markets
Regionalising operations in priority markets
(e.g. US, Greater China)
Develop distinctive and profitable set of tiered
branded global healthcare propositions
Expanding owned dental provision network
Capturing new PMI customers which generate
acceptable returns, while reducing lapse rates
Executing domestic market entry strategy
for Latin America
Setting and implementing our global brand
direction
Continue to strengthen risk and governance
capabilities
Transforming PMI/PHI
Integrating acquisitions for delivery
Focus on further driving cash generation
Invest in leadership and talent capability

FU
LL Y
EA
R R
ES
ULT
S P
RE
SE
NT
AT
ION
OUTLOOK
27
2014 will be a year of consolidating acquisitions and driving growth from all our businesses
2014 is about making our business even more customer-centred, setting and implementing
our global brand direction and continuing to streamline our operations and cost base
Trading conditions in some key markets will remain challenging, however, our businesses
are focused on delivering sustained growth
We expect good growth from both our existing and acquired businesses whilst realising further
benefits of integration
We will continue to build on our diversified international platform to deliver on our purpose of longer,
healthier, happier lives

FU
LL Y
EA
R R
ES
ULT
S P
RE
SE
NT
AT
ION
AGENDA
1.0
2.0
2.1
2.2
2.3
3.0
4.0
28
Introduction and Highlights Stuart Fletcher, CEO
Financial Review Evelyn Bourke, CFO
Group Financial Review
Segmental Results
Cash, Debt and Solvency
Operating Priorities and Outlook Stuart Fletcher, CEO
Q&A

FU
LL Y
EA
R R
ES
ULT
S P
RE
SE
NT
AT
ION
QUESTIONS
AND ANSWERS
29

FU
LL Y
EA
R R
ES
ULT
S P
RE
SE
NT
AT
ION
30
APPENDIX: DETAILED ORGANISATION STRUCTURE
MARKET UNITS
Australia and
New Zealand
United
Kingdom
Spain and
Latin America
Domestic
International
Development
Markets Bupa
Global
Bupa Australia Health
Insurance
Bupa Aged Care
Australia
Bupa Care Services
New Zealand
Bupa Health Services
Australia
Bupa Health Funding
Bupa Health Clinics
Bupa Care Services
UK
Bupa Home Healthcare
Bupa Cromwell Hospital
Sanitas Seguros
Sanitas Hospitales and
New Services
Sanitas Dental
Sanitas Residencial
Latin America Domestic
Development
Cruz Blanca
Bupa Hong Kong
Bupa Thailand
Bupa Arabia
Max Bupa
LUX MED
Quality HealthCare
Health Dialog
Bupa China
Bupa
Global Business Unit
Bupa Global Latin
America
Bupa Global North
America

FU
LL Y
EA
R R
ES
ULT
S P
RE
SE
NT
AT
ION
APPENDIX: BUPA’S EXECUTIVE TEAM
31
Stuart Fletcher
Chief Executive Officer
Evelyn Bourke
Chief Financial Officer
Dean Holden
Managing Director,
Australia and New
Zealand
Richard Bowden
Managing Director, UK
Iñaki Ereño
Managing Director,
Spain and Latin
America Domestic
Alison Platt
Managing Director,
International
Development Markets
Robert Lang
Managing Director,
Bupa Global
Denise Collis
Chief People Officer
Yasmin Jetha
Chief Information
Officer
Paul Zollinger-Read
Chief Medical Officer
Theresa Heggie
Chief Strategy and
Marketing Officer
Steve John
Director, Corporate
Affairs
Paul Newton
Chief Legal Officer