functional analysis of the architecture of the oro-facial ... · functional analysis of the...
TRANSCRIPT

Functional Analysis of the Architecture of the Oro-facial and Hyoid Musculature: A Comparative 3D Modelling
Study.
by
Zhi Li
A thesis submitted in conformity with the requirements for the degree of Master of Science
Institute of Medical Science University of Toronto
© Copyright by Zhi Li 2015

ii
Functional Analysis of the Architecture of the Oro-facial and
Hyoid Musculature: A Comparative 3D Modelling Study.
Zhi Li
Master of Science
Institute of Medical Sciences
University of Toronto
2015
Abstract
The functions of the oro-facial and hyoid muscles are poorly understood, despite their
importance in mastication and communication. Muscle architecture is an important determinant
of function, but the lack of an architectural database is impeding understanding of the individual
and coordinated activities of these muscles. The purpose was to digitize, model and analyze the
architecture of the oro-facial and hyoid muscles to compare their force-generating and excursion
capabilities, as determined by the muscle architectural parameters, at the muscle group, whole
muscle, and muscle partition levels. In total, 9600 fibre bundles were digitized and modelled in
46 muscles. The functional characteristics of each muscle and its component parts were
determined from the architectural parameters, line(s) of action, and force indices. Correlation of
the volumetric musculotendinous data with the functional characteristics of a muscle provides a
comprehensive approach to assessing the implications of muscle geometry in normal and
pathological states.
iii
Acknowledgments
In completing my research project and writing my thesis, I benefited greatly from the
expertise, guidance, and kindness of many people. Foremost, I owe my sincerest gratitude to my
supervisors Dr. Anne Agur and Dr. Nancy McKee for providing me with an amazing
opportunity for me to grow and mature as a scientist and as a well-rounded individual. To Dr.
Anne Agur, I am deeply indebted in your kindness, dedication and guidance. I am very fortunate
to have you as my mentor, someone who always found the time to listen and provide advice on
problems that arose during my academic and personal journey over the last four years. To Dr.
Nancy McKee, thank you for all of the thought-provoking discussions and for sharing your
clinical experiences with me which allowed me to see the importance of my research.
Many thanks to my Program Advisory Committee members Dr. Karl Zabjek and Dr.
Denyse Richardson for their guidance, encouragement and assistance every step along the way,
from the development of ideas to the final editing of my thesis. I also thank my Examination
Committee members Dr Cathy Amara, Dr Scott Lozenoff and Dr Paulo Koeberle for their
stimulating and thoughtful questions and comments.
My sincere appreciation also goes out to my fellow graduate students. Special thanks to
Shannon Roberts for meticulously and painstakingly reading over the many drafts of my thesis.
Your help and editorial advice was invaluable in elevating the quality of this dissertation. To
Dongwoon Lee, thank you for all the timely assistance in helping me troubleshoot the various
obstacles in the data analysis process. I also greatly appreciate your guidance in developing my
understanding of geometric analysis and computer sciences concepts. To Kate Sauks, thank you
for all of your support, advice and your uplifting spirit.

iv
To the members of Parametric Human Project Azam Khan, Dr. Sid Fels, Jeremy Mogk,
Jacky Bibliowicz, Antonio Sanchez, Dr. Alan Hannam and many others. Thank you for enabling
me to see how my research fit into the grand picture, and for providing me with a supportive and
stimulating research environment.
To my parents, who showed me the importance of courage, hard work and persistence, I
owe my deepest gratitude for all the sacrifices you made and the life you have created for me.
To my sister, “yes, brother has finished grade eighteen!”
Last but not least, to my wonderful partner Marianne Pasiliao. Thank you for all your
tireless support, and unyielding love. I am very lucky to have you accompanying me on my
journey.
Acknowledgement is also made to Ontario Graduate Scholarship Program, Natural
Science and Engineering Research Council Canada Graduate Scholarship for their support, and
Autodesk Inc. for providing research license for Autodesk® Maya® 2013 (Autodesk Inc. San
Rafael, CA, USA:http://www.autodesk.com/maya).
v
Table of Contents
Acknowledgments ......................................................................................................................... iii
Table of Contents ............................................................................................................................. v
List of Abbreviations ...................................................................................................................... ix
List of Tables ................................................................................................................................... x
List of Figures ................................................................................................................................xii
Chapter 1 .......................................................................................................................................... 1
1 Introduction ................................................................................................................................. 1
1.1 Contents of thesis ................................................................................................................. 2
Chapter 2 .......................................................................................................................................... 3
2 Literature review ......................................................................................................................... 3
2.1 Introduction.......................................................................................................................... 3
2.2 Contractile elements ............................................................................................................ 3
2.2.1 Macroscopic structure .............................................................................................. 3
2.2.2 Microscopic structure .............................................................................................. 4
2.2.3 Contractile mechanism ............................................................................................ 5
2.2.4 Length-tension relationship ..................................................................................... 8
2.3 Connective tissue elements ................................................................................................ 11
2.3.1 Macroscopic structure ............................................................................................ 11
2.3.2 Microscopic structure ............................................................................................ 13
2.4 Muscle Architecture........................................................................................................... 14
2.4.1 Fibre bundle length ................................................................................................ 16
2.4.2 Pennation angle ...................................................................................................... 16
2.4.3 Muscle volume....................................................................................................... 18
2.4.4 Physiological cross-sectional area and force index ............................................... 19

vi
2.4.5 Sarcomere length ................................................................................................... 19
2.4.6 Tendon geometry ................................................................................................... 20
2.5 Measurement of architectural parameters .......................................................................... 20
2.5.1 Two-dimensional measurements ........................................................................... 21
2.5.2 Three-dimensional measurement ........................................................................... 24
2.6 Architecture of the oro-facial and hyoid muscles .............................................................. 25
2.6.1 Cadaveric studies ................................................................................................... 25
2.6.2 Imaging studies ...................................................................................................... 31
2.7 Muscle modelling .............................................................................................................. 34
2.7.1 Line segment models ............................................................................................. 34
2.7.2 Volumetric muscle models .................................................................................... 35
2.8 Summary ............................................................................................................................ 36
Chapter 3 ........................................................................................................................................ 38
3 Objectives and hypothesis ........................................................................................................ 38
3.1 Objectives .......................................................................................................................... 38
3.2 Hypothesis ......................................................................................................................... 39
Chapter 4 ........................................................................................................................................ 40
4 Material and Methods ............................................................................................................... 40
4.1 Scanning of specimen ........................................................................................................ 41
4.2 Dissection and digitization ................................................................................................ 42
4.2.1 Digitization of fibre bundles .................................................................................. 42
4.2.2 Digitization of tendinous elements ........................................................................ 43
4.3 Digitization of oro-facial and hyoid musculature .............................................................. 44
4.3.1 Muscles of facial expression .................................................................................. 44
4.3.2 Muscles of mastication .......................................................................................... 45
4.3.3 Supra- and infrahyoid muscles .............................................................................. 45

vii
4.4 Three-dimensional modelling of digitized data ................................................................. 46
4.5 Quantification of architectural parameters ........................................................................ 47
4.5.1 Fibre bundle length ................................................................................................ 48
4.5.2 Pennation angle ...................................................................................................... 48
4.5.3 Muscle volume....................................................................................................... 50
4.5.4 Physiological cross-sectional area and force index ............................................... 50
4.6 Sarcomere length ............................................................................................................... 51
Chapter 5 ........................................................................................................................................ 54
5 Results ....................................................................................................................................... 54
5.1 3D model ........................................................................................................................... 54
5.1.1 3D models of muscle groups ................................................................................. 57
5.1.2 Muscles of mastication .......................................................................................... 58
5.1.3 Suprahyoid muscles ............................................................................................... 60
5.1.4 Infrahyoid muscles................................................................................................. 61
5.2 Muscle morphology and architecture ................................................................................ 62
5.2.1 Muscles of facial expression .................................................................................. 62
5.2.2 Muscles of mastication .......................................................................................... 70
5.2.3 Suprahyoid muscles ............................................................................................... 90
5.2.4 Infrahyoid muscles............................................................................................... 102
Chapter 6 ...................................................................................................................................... 109
6 Discussion ............................................................................................................................... 109
6.1 Modelling ......................................................................................................................... 112
6.2 Muscles of facial expression ............................................................................................ 113
6.3 Muscle architecture .......................................................................................................... 114
6.3.1 Muscles of mastication ........................................................................................ 115
6.3.2 Suprahyoid muscles ............................................................................................. 119

viii
6.3.3 Infrahyoid muscles............................................................................................... 121
6.3.4 Comparison of architecture across muscle groups .............................................. 122
6.4 Limitations ....................................................................................................................... 124
6.5 Summary .......................................................................................................................... 124
Chapter 7 ...................................................................................................................................... 125
7 Conclusions ............................................................................................................................. 125
Chapter 8 ...................................................................................................................................... 126
8 Future directions ..................................................................................................................... 126
References.................................................................................................................................... 128
Copyright Acknowledgements .................................................................................................... 139

ix
List of Abbreviations
CT Computed tomography
dtMRI Diffusion tensor magnetic resonance imaging
FBL Fibre bundle length
FE Finite element
LLSAN Levator labii superioris alaeque nasi
MRI Magnetic resonance imaging
MV Muscle volume
PA Pennation angle
PCSA Physiological cross-sectional area
SL Sarcomere length

x
List of Tables
Chapter 2
Table 2.1. Stages of the cross-bridge cycle.
Table 2.2. The effect of pennation angle on fibre bundle force.
Table 2.3. Overview of methodologies used to measure architectural parameters of
supra/infrahyoid and masticatory muscles.
Table 2.4. Summary of architectural parameter of muscles of mastication.
Table 2.5. Summary of architectural parameters of suprahyoid muscles.
Table 2.6. Summary of architectural parameters of suprahyoid muscles.
Table 2.7. Summary of imaging studies of oro-facial and supra- and infrahyoid
muscles, and quantified muscle parameters.
Table 2.8. Summary of thickness (mm) of muscles of expression as reported in
ultrasound studies.
Table 2.9. Summary of parameters of muscles of mastication as reported by imaging
studies.
Table 2.10. Change in length in suprahyoid muscles during swallowing.
Chapter 4
Table 4.1. Computed tomography scan parameters.
Chapter 5
Table 5.1. List of modelled muscles including the number of digitized fibre bundles per
muscle.
Page
6
17
26
adfadf
28
30
31
31
adfaaa
32
adfaaa
33
adfaaa
34
41
54
adfaaa

xi
Table 5.2. Architectural parameters of the muscles of the oral region.
Table 5.3. Architectural parameters of the muscles of the nasal region.
Table 5.4. Architectural parameters of the muscles of orbital region and scalp.
Table 5.5. Architectural parameters of temporalis and its parts.
Table 5.6. Summary of fibre bundle attachment sites in each lamina (1-8) of masseter.
Table 5.7: Architectural parameters of the right and left masseter muscles as a whole,
superficial and deep heads, and individual laminae.
Table 5.8. Architectural parameters of the medial pterygoid.
Table 5.9. Architectural parameters of the lateral pterygoid.
Table 5.10. Summary of mean architectural parameters of muscles of mastication.
Table 5.11. Architectural parameters of digastric.
Table 5.12. Architectural parameters of stylohyoid and its parts.
Table 5.13. Architectural parameters of mylohyoid and its parts.
Table 5.14. Architectural parameters of geniohyoid.
Table 5.15. Summary of architectural parameters of suprahyoid muscles and their parts.
Table 5.16. Summary of architectural parameters of the infrahyoid muscles and their
parts.
66
68
70
72
77
80
adsfa
84
86
87
91
93
96
99
100
105

xii
List of Figures
Chapter 2
Figure 2.1. Overview of skeletal muscle structure.
Figure 2.2. Sarcomere structure.
Figure 2.3. Sarcomere in relaxed and contracted states.
Figure 2.4. Length-tension relationship of a frog sarcomere.
Figure 2.5. Sarcomere force-length curves. Blue, frog; red, human.
Figure 2.6. Tendon morphology in various muscles.
Figure 2.7. Micrograph showing collagen fibre matrix of a tendon; haematoxylin and
eosin staining.
Figure 2.8. Tendon structure.
Figure 2.9. Fibre bundle arrangement and shape of various human skeletal muscle.
Figure 2.10. Graph showing the relationship of cosine pennation angle (θ).
Figure 2.11. Relationship between (cos θ) -1
and pennation angle.
Chapter 4
Figure 4.1. Workflow pipeline summarizing the steps involved in this study.
Figure 4.2. Aquilion ONE™ CT scanner.
Figure 4.3. Digitization of fibre bundles.
Figure 4.4. Digitization of tendinous elements.
Figure 4.5. Spline transformation of digitized fibre bundles.
Page
4
5
8
9
11
12
13
fasdfasdf
14
15
17
18
40
41
43
44
47

xiii
Figure 4.6. Quantification of fibre bundle length.
Figure 4.7. Determination of average tangent vector (i.e. fibre bundle orientation).
Figure 4.8. 2D schematic showing computation of the line of action of a suspensory
muscle.
Figure 4. 9. Axioplan 2 Imaging Microscope system.
Figure 4.10. Location of photomicrographs of each biopsy.
Figure 4.12. Measurements of ten sarcomeres in series (63x objective lens).
Chapter 5
Figure 5.1. Three-dimensional model of the digitized muscles, anterior view.
Figure 5.2. Three-dimensional model of the digitized muscles, lateral view.
Figure 5.3. Three-dimensional model of the muscles of facial expression, anterior
and lateral views.
Figure 5.4. Three-dimensional model of the muscles of mastication, lateral and
anterior views.
Figure 5.5. Three-dimensional model of the suprahyoid muscles.
Figure 5.6. Three-dimensional model of the infrahyoid muscles, anterior views.
Figure 5.7. Three-dimentional model of orbicularis oris, anterior views.
Figure 5.8. Oral muscles surrounding the orbicularis oris (brown), anterior and
lateral views.
Figure 5.9. Three-dimensional model of zygomaticus major and minor in relation to
orbicularis oris, anterior view.
Figure 5.10. Three-dimensional model of the muscles of the nasal region.
48
49
50
adfadfa
52
52
53
55
56
57
adsfaad
59
aadfad
60
61
62
64
adfasdf
65
asdfadsf
67

xiv
Figure 5.11. Muscles of the orbital region and scalp.
Figure 5.12. Three-dimensional model of temporalis.
Figure 5.13. Three-dimensional model of the aponeurosis of temporalis.
Figure 5.14. Principal fibre bundle orientations (lines of action) of the superficial
and deep parts of temporalis, lateral views.
Figure 5.15. Sarcomere length variation within the volume of temporalis.
Figure 5.16. Three-dimensional model of masseter.
Figure 5.17. Laminae of masseter.
Figure 5.18. Aponeurotic attachment sites of laminae (1-4) of the superficial head of
masseter.
Figure. 5.19. Aponeurotic attachment sites of laminae (5-8) of the deep head of
masseter.
Figure 5.20. Architectural parameters of the superficial and deep heads of masseter.
Figure 5.21. Mean FBL of individual laminae of right masseter.
Figure 5.22. Mean PA of individual laminae of right masseter.
Figure 5.23. Principal fibre bundle orientations (lines of action) of the superficial
and deep heads of masseter.
Figure 5.24. Three-dimensional model of the medial pterygoid.
Figure 5.25. Three-dimensional model of the medial pterygoid.
Figure 5.26. Principal fibre bundle orientations (lines of action) of the anterior and
posterior parts of the medial pterygoid.
Figure 5.27. Three-dimensional model of the lateral pterygoid, anterolateral views.
69
71
72
73
asdfaa
74
75
76
78
adsfaa
79
adfadf
79
81
81
82
adfaaa
83
84
85
adsfaa
86

xv
Figure 5.28. Principal fibre bundle orientations (lines of action) of the superior and
inferior heads of the lateral pterygoid.
Figure 5.29. Similarities in principal fibre bundle orientations of the parts of the
muscles of mastication, lateral and anterior views.
Figure 5.30. Three-dimensional model of digastric.
Figure 5.31. Principal fibre bundle orientations (lines of action) of the anterior and
posterior bellies of digastric, lateral views.
Figure 5.32. Three-dimensional model of stylohyoid, lateral view.
Figure 5.33. Principal fibre bundle orientations (lines of action) of the superficial
and deep parts of stylohyoid.
Figure 5.34. Three-dimensional model of mylohyoid.
Figure 5.35. Principal fibre bundle orientations and resultant lines of action of the
individual parts of mylohyoid.
Figure 5.36. Three-dimensional model of geniohyoid.
Figure 5.37. Principal fibre bundle orientations (lines of action) of the left and right
geniohyoid muscles.
Figure 5.38. Similarities in principal fibre bundle orientations (lines of action) of the
parts of the suprahyoid muscles, lateral and anterior views.
Figure 5.39. Three-dimensional models of the infrahyoid muscles.
Figure 5.40. Principal fibre bundle orientations (lines of action) of the superior and
inferior bellies of omohyoid.
Figure 5.41. Principal fibre bundle orientations (lines of action) of the medial and
lateral parts of sternothyroid.
87
asdfaa
89
adsfaa
90
92
asdfaa
93
94
asdfaa
95
97
adfadf
98
99
adfaaa
102
adfadf
103
106
107
adfaa

xvi
Figure 5.42. Principal fibre bundle orientations (lines of action) of the superficial
and deep parts of thyrohyoid.
Chapter 6
Figure 6.1. Comparison of fibre bundle length of mascles of mastication between the
current study and previous literature.
Figure 6.2. Comparison of pennation angle of muscles of mastication between the
current study and previous literature.
Figure 6.3. Comparison of muscle volume of muscles of mastication between the
current study and previous literature.
Figure 6.4. Comparison of physiological cross-sectional area of muscles of
masticaton between the current study and previous literature.
Figure 6.5. Comparison of fibre bundle length of suprahyoid muscles between the
current study and previous literature.
Figure 6.6. Comparison of pennation angle of suprahyoid muscles between the
current study and previous literature.
Figure 6.7. Comparison of physiological cross-sectional area between the current
study and previous literature.
Figure 6.8. Comparison of architectural parameters of thyrohyoid muscle between
the current study and previous literature.
Figure 6.9. Comparison of the FBL and PCSA of muscles of mastication, and supra-
and infrahyoid muscles.
108
adsfa
115
asdfa
116
adfaa
117
asdfa
118
asdfa
119
adfaa
120
adfad
121
adsfa
122
asdfa
123
1
Chapter 1
1 Introduction
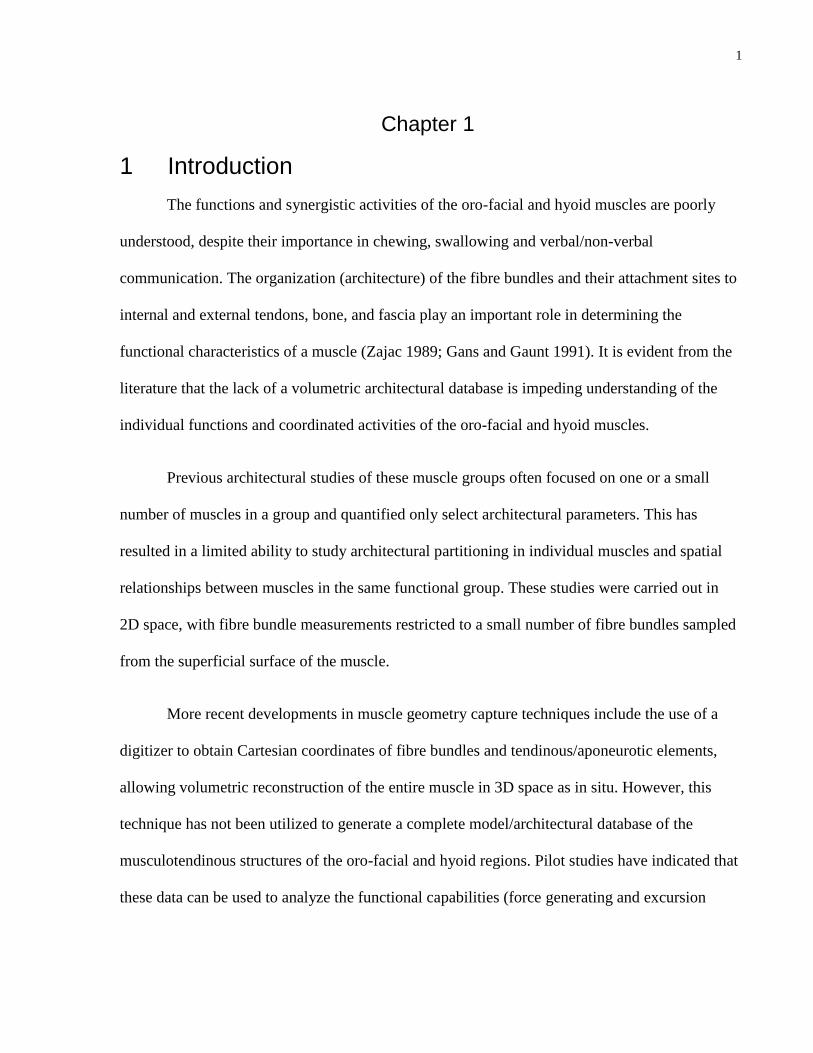
The functions and synergistic activities of the oro-facial and hyoid muscles are poorly
understood, despite their importance in chewing, swallowing and verbal/non-verbal
communication. The organization (architecture) of the fibre bundles and their attachment sites to
internal and external tendons, bone, and fascia play an important role in determining the
functional characteristics of a muscle (Zajac 1989; Gans and Gaunt 1991). It is evident from the
literature that the lack of a volumetric architectural database is impeding understanding of the
individual functions and coordinated activities of the oro-facial and hyoid muscles.
Previous architectural studies of these muscle groups often focused on one or a small
number of muscles in a group and quantified only select architectural parameters. This has
resulted in a limited ability to study architectural partitioning in individual muscles and spatial
relationships between muscles in the same functional group. These studies were carried out in
2D space, with fibre bundle measurements restricted to a small number of fibre bundles sampled
from the superficial surface of the muscle.
More recent developments in muscle geometry capture techniques include the use of a
digitizer to obtain Cartesian coordinates of fibre bundles and tendinous/aponeurotic elements,
allowing volumetric reconstruction of the entire muscle in 3D space as in situ. However, this
technique has not been utilized to generate a complete model/architectural database of the
musculotendinous structures of the oro-facial and hyoid regions. Pilot studies have indicated that
these data can be used to analyze the functional capabilities (force generating and excursion
2
capabilities) of a muscle (Ravichandiran et al. 2009; Li et al. 2014), and to provide a basis for
finite element modelling at the fibre bundle level (Sanchez et al. 2014).
This thesis will focus on the architecture and spatial arrangements of the oro-facial and
hyoid muscles. The oro-facial muscles include the muscles of facial expression and the muscles
of mastication, whereas the hyoid muscles are divided by the hyoid bone into supra- and
infrahyoid muscle groups. The main objective of this thesis is to digitize, model and analyze the
architecture of the oro-facial and hyoid muscles to compare their force-generating and excursion
capabilities. At the same time, a comprehensive database of the musculotendinous parameters of
these muscles will be established for use in modelling, imaging and clinical studies.
1.1 Contents of thesis
A synopsis of the content of each of the eight chapters of this thesis is outlined below.
Chapter 1 provides a brief rationale and relevance of this work.
Chapter 2 is a review of literature, including: structure and architecture of skeletal
muscle, quantification of architectural parameters, results of previous architectural
studies of oro-facial and hyoid musculature, and skeletal muscle modelling.
Chapter 3 presents the hypothesis and specific objectives of this thesis.
Chapter 4 outlines the methods used to achieve the objectives.
Chapter 5 summarizes the results of this study. This section is divided into two main
parts: 3D modelling of the oro-facial and hyoid muscles, and their architectural
parameters.
Chapter 6 is a discussion of the results as related to the previous literature, and innovative
findings of this thesis.
Chapter 7 outlines of the conclusions of this thesis.
Chapter 8 discusses possible future directions of this work.
3
Chapter 2
2 Literature review
2.1 Introduction
Skeletal muscle, due to its contractile properties, result in mechanical force generation
that is used to move or stabilize the body. In humans, skeletal muscle consists of contractile
elements (fascicles or fibre bundles) and connective tissue elements (aponeuroses, tendons and
coverings of the muscle fibre), together comprising about half of the body weight of an adult.
The macroscopic and microscopic structures of each of the contractile and connective tissue
elements determine the functional capabilities of a muscle (Zajac, 1989; Lieber and Ward, 2011).
2.2 Contractile elements
The macroscopic structure of the contractile elements will be discussed first, followed by
the microscopic structure.
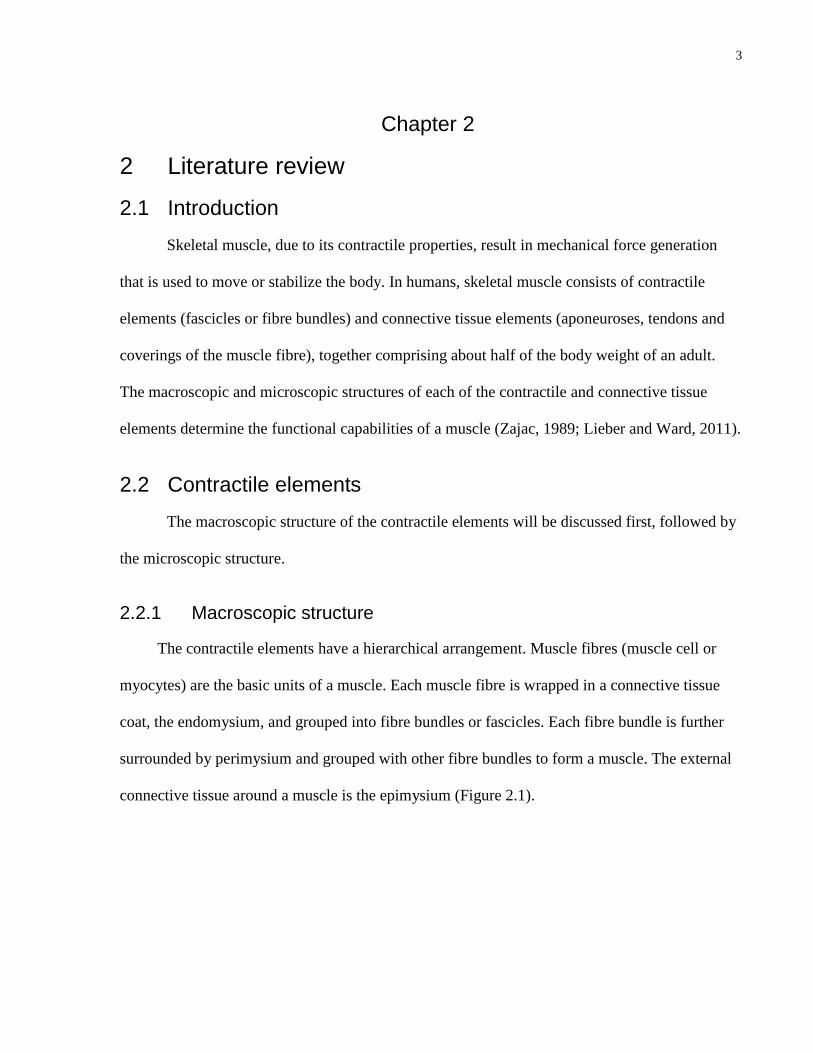
2.2.1 Macroscopic structure
The contractile elements have a hierarchical arrangement. Muscle fibres (muscle cell or
myocytes) are the basic units of a muscle. Each muscle fibre is wrapped in a connective tissue
coat, the endomysium, and grouped into fibre bundles or fascicles. Each fibre bundle is further
surrounded by perimysium and grouped with other fibre bundles to form a muscle. The external
connective tissue around a muscle is the epimysium (Figure 2.1).

4
Figure 2.1. Overview of skeletal muscle structure. Essential Clinical Anatomy, 5th
Ed. Reproduced
with permission from Lippincott Williams & Wilkins.
2.2.2 Microscopic structure
Muscle fibres are specialized contractile multinucleated cells. Each muscle fibre contains
myofibrils, which are composed of a series of sarcomeres. Sarcomeres are the basic contractile
units of a muscle fibre, consisting of myosin filaments centrally and laterally placed actin
filaments extending between the myosin filaments (Figure 2.1). When viewed using
conventional light microscopy, skeletal muscle fibres exhibit a striation pattern of alternating
light and dark bands (Figure 2.2A).

5
Figure 2.2. Sarcomere structure. A. Light and dark striation pattern of skeletal muscle
fibres; light micrograph. B. Schematic illustration of the banding pattern of the actin and
myosin filaments. The sarcomere is bounded by the Z-disk. Myosin filaments (orange),
actin filaments (grey lines). C. Electron micrograph of banding pattern. A. A-band; H. H-
zone; I. I-band; M. M-line. Histology, 7th
Ed. Reproduced with permission from Dr Cormack.
The dark band, consisting of partially overlapping actin and myosin filaments, is the A-
(anisotropic) band, and the light band, consisting of only actin filaments, is the I-(isotropic) band
(Figure 2.2B and C). The actin filaments are anchored to the Z-disk (line), which delineates the
borders of the sarcomere (Hanson and Huxley, 1953; Huxley, 1953). In the center of the A-band,
there is a slightly lighter region consisting of thick filaments only, the H-zone, at the midpoint of
which is the M-line (Figure 2.2B).
2.2.3 Contractile mechanism
The sliding filament theory describes the interaction between the thin actin and thick
myosin filaments that results in shortening of the sarcomeres. The summation of the shortening
6
of each sarcomere results in muscle contraction (Huxley and Hanson, 1954; Huxley and
Niedergerke; 1954; Sosa et al., 1994; Huxley, 1999). When a muscle actively contracts, it
shortens and thickens.
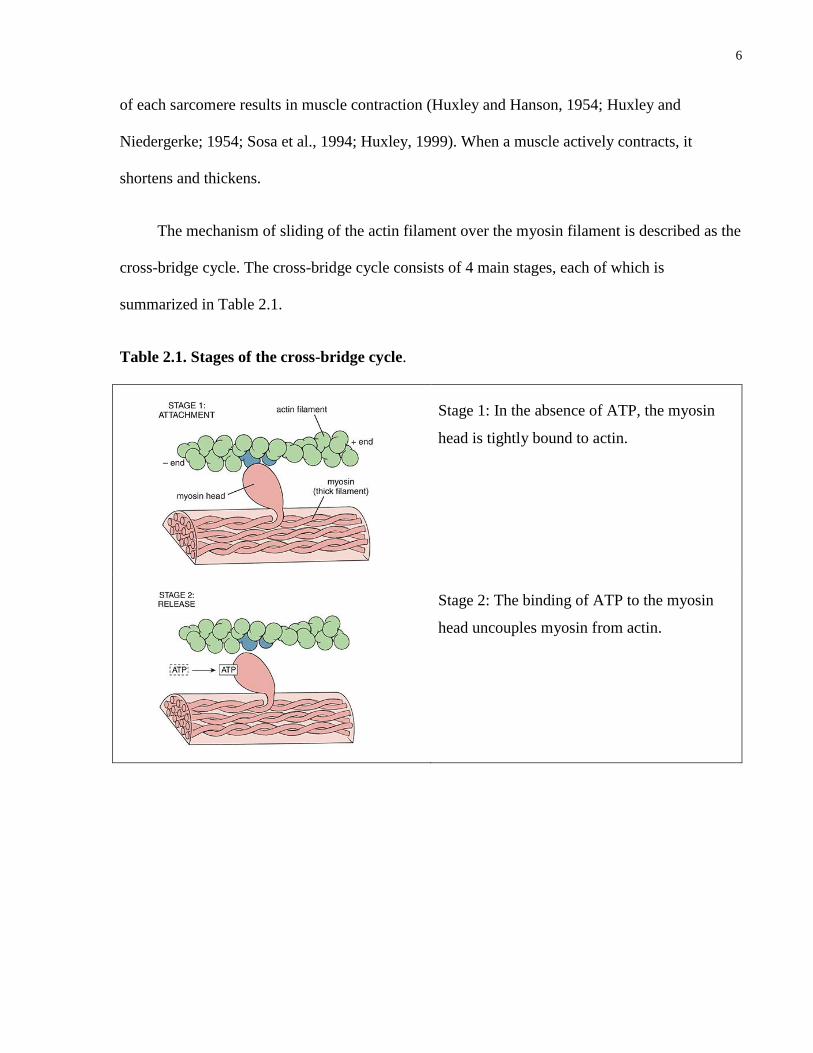
The mechanism of sliding of the actin filament over the myosin filament is described as the
cross-bridge cycle. The cross-bridge cycle consists of 4 main stages, each of which is
summarized in Table 2.1.
Table 2.1. Stages of the cross-bridge cycle.
Stage 1: In the absence of ATP, the myosin
head is tightly bound to actin.
Stage 2: The binding of ATP to the myosin
head uncouples myosin from actin.

7
Stage 3: ATP is hydrolyzed; the energy
released from hydrolysis bends the myosin
head, causing it to advance a short distance
along the actin filament.
Stage 4: The myosin head binds to actin. The
release of Pi and ADP causes the myosin head
to straighten, and results in movement of the
thin filament along the thick filament (power
stroke).
Cycle begins again at stage 1.
Histology: A Text and Atlas, 6th
Ed. Reproduced with permission from Lippincott Williams & Wilkins
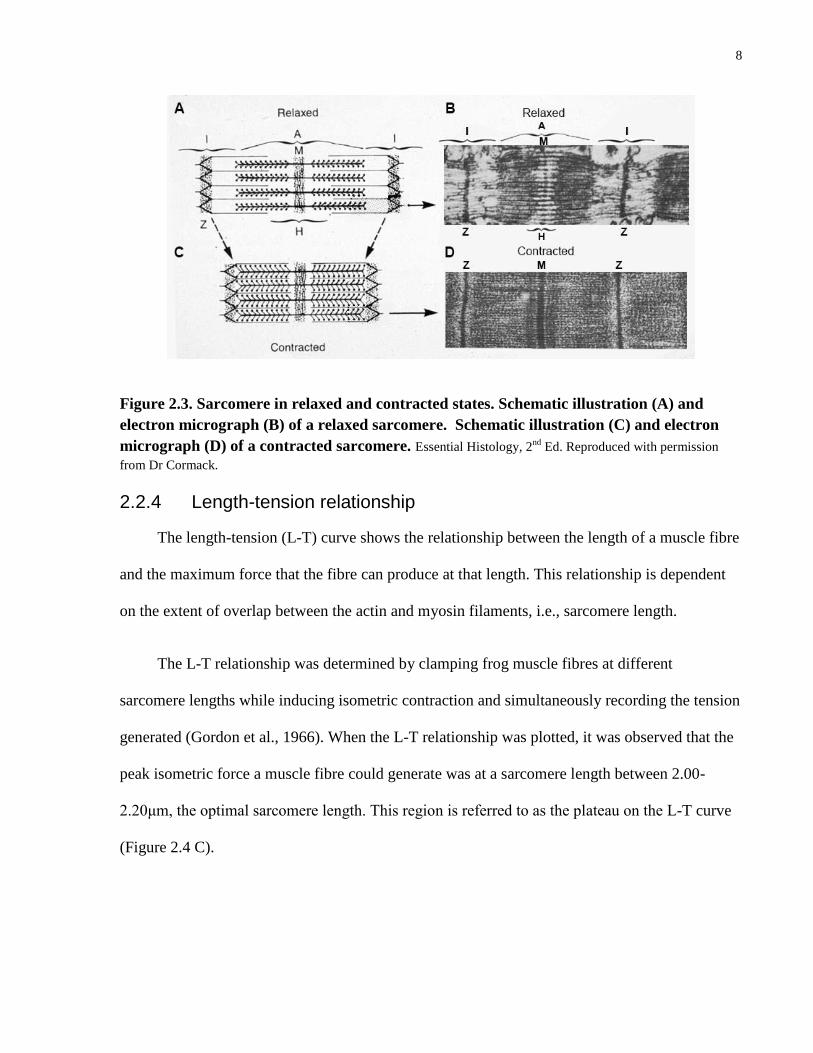
As muscle fibres contract, the actin filaments slide over the myosin filaments, increasing
their overlap. The Z-lines defining the lateral borders of the sarcomere move closer to one
another, i.e., sarcomere shortens (Figure 2.3). Shortening of the sarcomere does not result in a
length change in either the thick or thin filaments. When relaxed and contracted muscle fibres are
compared, in the contracted state the H-zone disappears and the length of the I-band markedly
decreases, while the A-band remains the same length (Figure 2.3 C and D).
8
Figure 2.3. Sarcomere in relaxed and contracted states. Schematic illustration (A) and
electron micrograph (B) of a relaxed sarcomere. Schematic illustration (C) and electron
micrograph (D) of a contracted sarcomere. Essential Histology, 2nd
Ed. Reproduced with permission
from Dr Cormack.
2.2.4 Length-tension relationship
The length-tension (L-T) curve shows the relationship between the length of a muscle fibre
and the maximum force that the fibre can produce at that length. This relationship is dependent
on the extent of overlap between the actin and myosin filaments, i.e., sarcomere length.
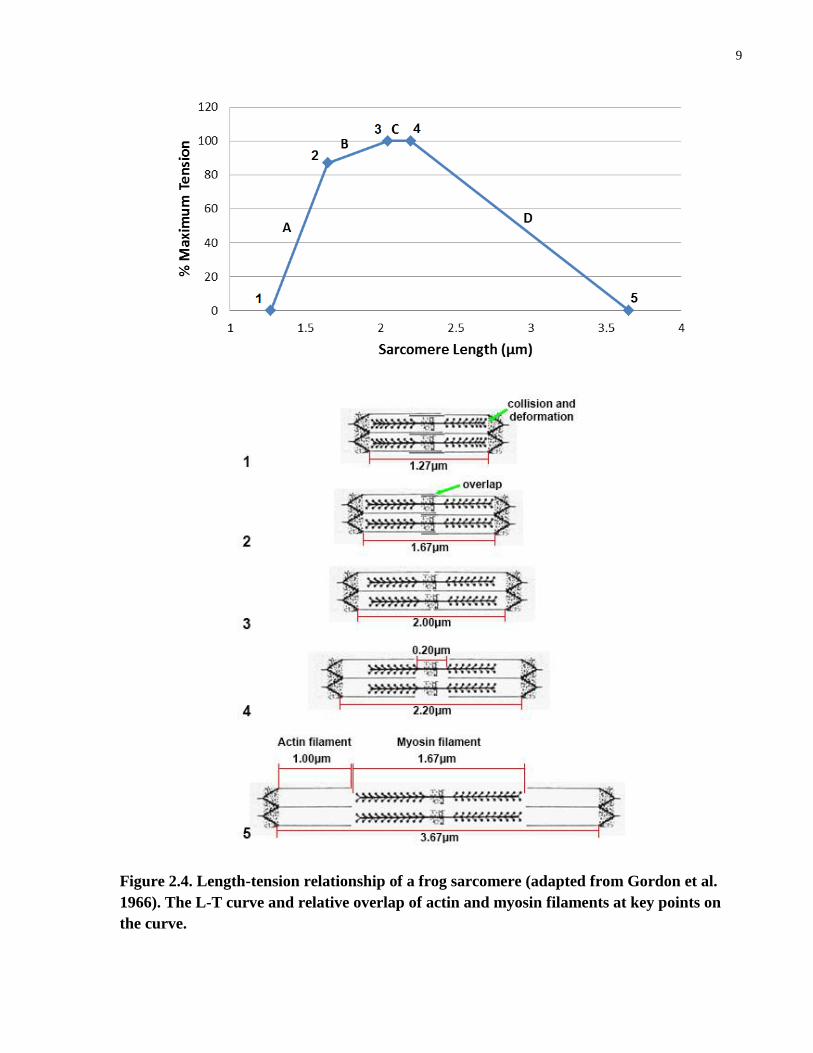
The L-T relationship was determined by clamping frog muscle fibres at different
sarcomere lengths while inducing isometric contraction and simultaneously recording the tension
generated (Gordon et al., 1966). When the L-T relationship was plotted, it was observed that the
peak isometric force a muscle fibre could generate was at a sarcomere length between 2.00-
2.20μm, the optimal sarcomere length. This region is referred to as the plateau on the L-T curve
(Figure 2.4 C).
9
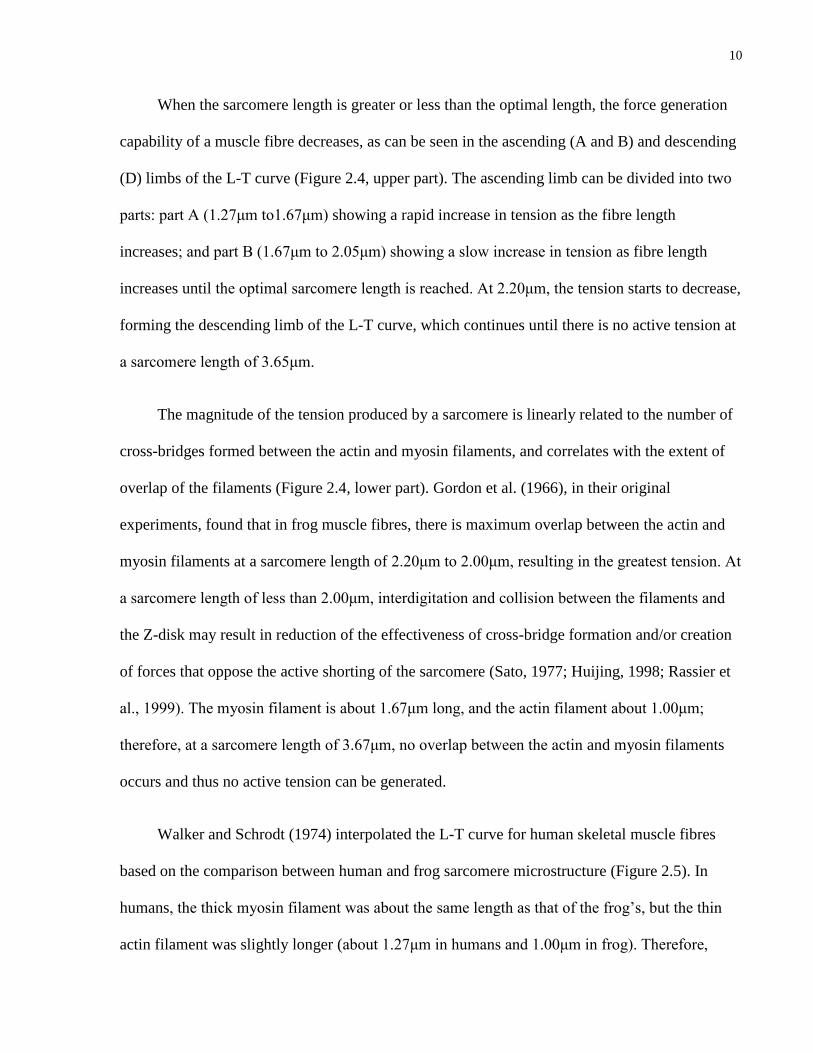
Figure 2.4. Length-tension relationship of a frog sarcomere (adapted from Gordon et al.
1966). The L-T curve and relative overlap of actin and myosin filaments at key points on
the curve.
10
When the sarcomere length is greater or less than the optimal length, the force generation
capability of a muscle fibre decreases, as can be seen in the ascending (A and B) and descending
(D) limbs of the L-T curve (Figure 2.4, upper part). The ascending limb can be divided into two
parts: part A (1.27μm to1.67μm) showing a rapid increase in tension as the fibre length
increases; and part B (1.67μm to 2.05μm) showing a slow increase in tension as fibre length
increases until the optimal sarcomere length is reached. At 2.20μm, the tension starts to decrease,
forming the descending limb of the L-T curve, which continues until there is no active tension at
a sarcomere length of 3.65μm.
The magnitude of the tension produced by a sarcomere is linearly related to the number of
cross-bridges formed between the actin and myosin filaments, and correlates with the extent of
overlap of the filaments (Figure 2.4, lower part). Gordon et al. (1966), in their original
experiments, found that in frog muscle fibres, there is maximum overlap between the actin and
myosin filaments at a sarcomere length of 2.20μm to 2.00μm, resulting in the greatest tension. At
a sarcomere length of less than 2.00μm, interdigitation and collision between the filaments and
the Z-disk may result in reduction of the effectiveness of cross-bridge formation and/or creation
of forces that oppose the active shorting of the sarcomere (Sato, 1977; Huijing, 1998; Rassier et
al., 1999). The myosin filament is about 1.67μm long, and the actin filament about 1.00μm;
therefore, at a sarcomere length of 3.67μm, no overlap between the actin and myosin filaments
occurs and thus no active tension can be generated.
Walker and Schrodt (1974) interpolated the L-T curve for human skeletal muscle fibres
based on the comparison between human and frog sarcomere microstructure (Figure 2.5). In
humans, the thick myosin filament was about the same length as that of the frog’s, but the thin
actin filament was slightly longer (about 1.27μm in humans and 1.00μm in frog). Therefore,

11
based on the structural differences, the optimal length of the human sarcomere was predicted to
be between 2.64 and 2.81μm, and the active operating range between 1.27 and 4.24μm (Walker
and Schrodt, 1974; Rassier et al., 1999). However, no study was found that examined the L-T
relationship in human muscle fibres.
Figure 2.5. Sarcomere force-length curves. Frog (blue) and human (red).
2.3 Connective tissue elements
2.3.1 Macroscopic structure
The contractile and connective tissue elements are closely associated with each other. The
muscle fibres are bound to the endomysium via protein anchors (Petrof et al., 1993; Ehmsen et
al., 2002). The endomysium is in turn continuous with the perimysium, which surrounds fibre
bundles, and the epimysium, which surrounds the muscle as a whole. This close integration
between the muscle fibres and the connective tissue network is important for the protection of
cellular integrity during contraction, and effective force transmission (Street and Ramsey, 1965;
Petrof et al., 1993; Jarvinen et al., 2002).
12
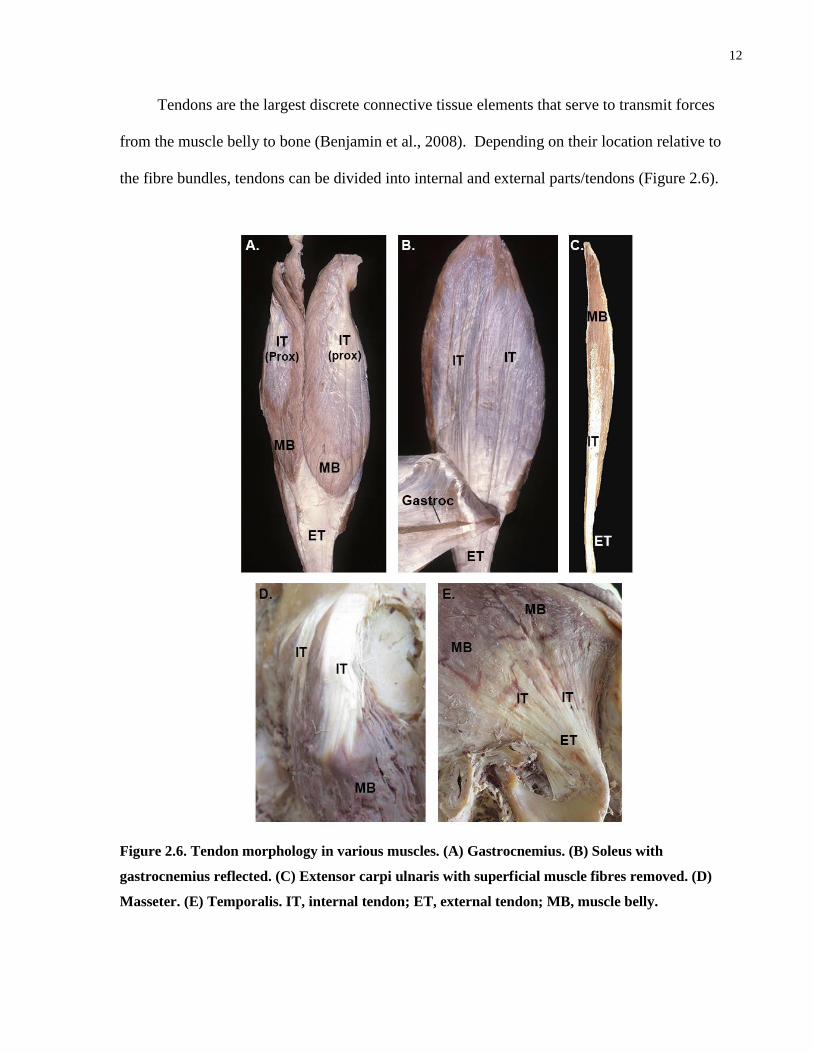
Tendons are the largest discrete connective tissue elements that serve to transmit forces
from the muscle belly to bone (Benjamin et al., 2008). Depending on their location relative to
the fibre bundles, tendons can be divided into internal and external parts/tendons (Figure 2.6).
Figure 2.6. Tendon morphology in various muscles. (A) Gastrocnemius. (B) Soleus with
gastrocnemius reflected. (C) Extensor carpi ulnaris with superficial muscle fibres removed. (D)
Masseter. (E) Temporalis. IT, internal tendon; ET, external tendon; MB, muscle belly.

13
An internal tendon often forms an aponeurosis, a thin sheet of dense connective tissue. The
majority of the collagen fibres in an aponeurosis are arranged in parallel to permit unidirectional
transmission of forces along the fibre bundles. An internal tendon is often continuous with the
external tendon, the part of the tendon that lies outside of the muscle belly. The external tendon
is often a thick, cord-like structure that serves to bridge the muscle belly and its attachment site.
2.3.2 Microscopic structure
Tendons are comprised of dense regular connective tissue, consisting primarily of type I
collagen fibres that run in the same direction and plane (Figure 2.7).
Figure 2.7. Micrograph showing collagen fibre matrix of a tendon; haematoxylin and eosin
staining.
This gives tendons great tensile strength and thus the ability to withstand the forces generated
during muscle contraction. The fibroblasts are the cellular components of tendons that lie
between the parallel collagen fibres.
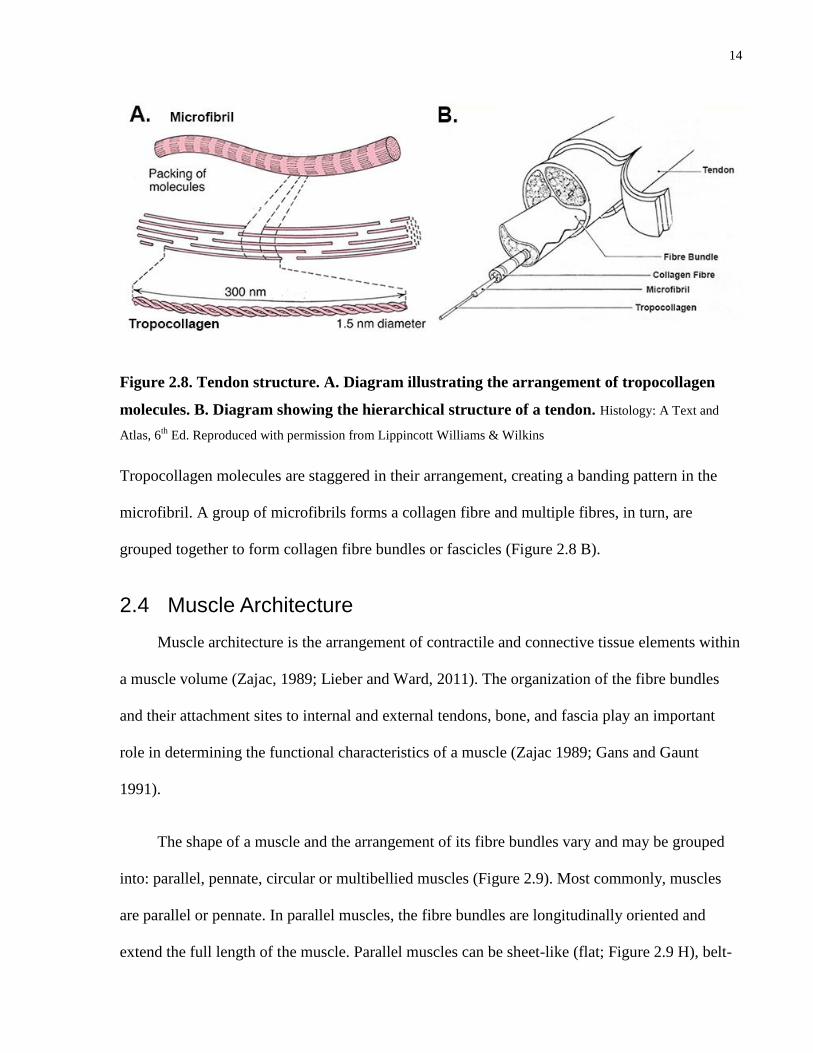
Similar to the contractile elements in the muscle belly, the collagen in tendons is also
arranged hierarchically, beginning with tropocollagen molecules that are cross-linked to form
microfibrils (Figure 2.8 A).
14
Figure 2.8. Tendon structure. A. Diagram illustrating the arrangement of tropocollagen
molecules. B. Diagram showing the hierarchical structure of a tendon. Histology: A Text and
Atlas, 6th
Ed. Reproduced with permission from Lippincott Williams & Wilkins
Tropocollagen molecules are staggered in their arrangement, creating a banding pattern in the
microfibril. A group of microfibrils forms a collagen fibre and multiple fibres, in turn, are
grouped together to form collagen fibre bundles or fascicles (Figure 2.8 B).
2.4 Muscle Architecture
Muscle architecture is the arrangement of contractile and connective tissue elements within
a muscle volume (Zajac, 1989; Lieber and Ward, 2011). The organization of the fibre bundles
and their attachment sites to internal and external tendons, bone, and fascia play an important
role in determining the functional characteristics of a muscle (Zajac 1989; Gans and Gaunt
1991).
The shape of a muscle and the arrangement of its fibre bundles vary and may be grouped
into: parallel, pennate, circular or multibellied muscles (Figure 2.9). Most commonly, muscles
are parallel or pennate. In parallel muscles, the fibre bundles are longitudinally oriented and
extend the full length of the muscle. Parallel muscles can be sheet-like (flat; Figure 2.9 H), belt-
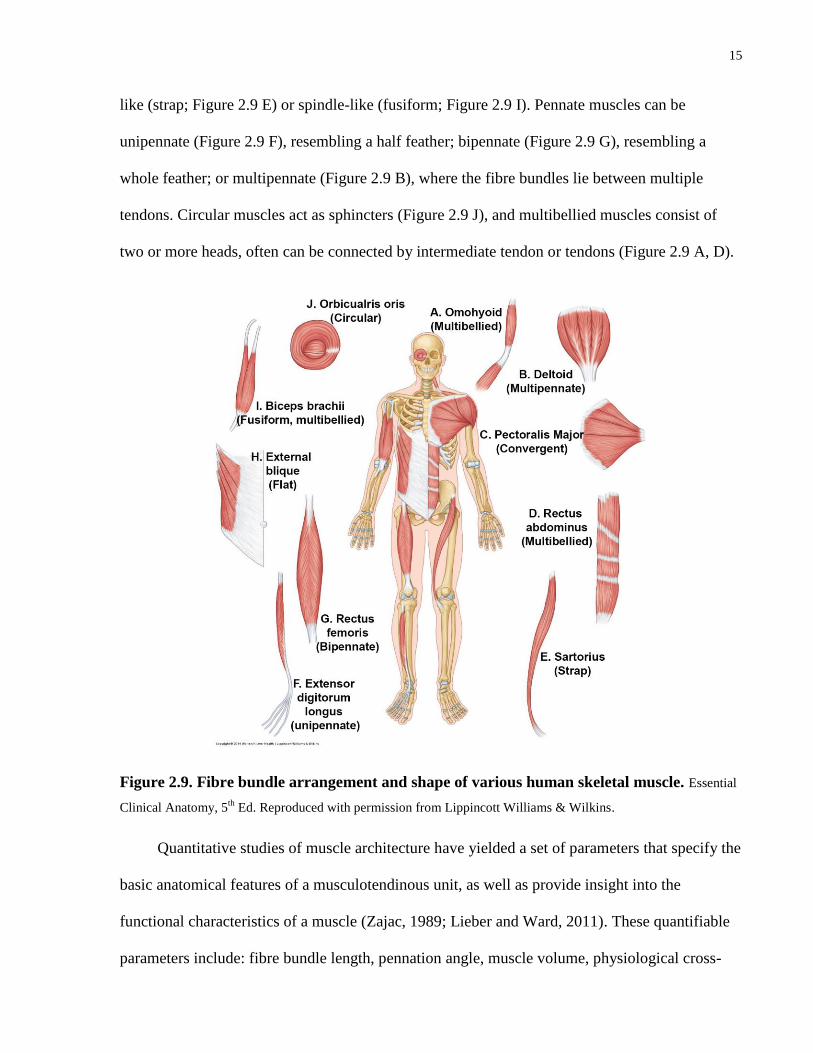
15
like (strap; Figure 2.9 E) or spindle-like (fusiform; Figure 2.9 I). Pennate muscles can be
unipennate (Figure 2.9 F), resembling a half feather; bipennate (Figure 2.9 G), resembling a
whole feather; or multipennate (Figure 2.9 B), where the fibre bundles lie between multiple
tendons. Circular muscles act as sphincters (Figure 2.9 J), and multibellied muscles consist of
two or more heads, often can be connected by intermediate tendon or tendons (Figure 2.9 A, D).
Figure 2.9. Fibre bundle arrangement and shape of various human skeletal muscle. Essential
Clinical Anatomy, 5th
Ed. Reproduced with permission from Lippincott Williams & Wilkins.
Quantitative studies of muscle architecture have yielded a set of parameters that specify the
basic anatomical features of a musculotendinous unit, as well as provide insight into the
functional characteristics of a muscle (Zajac, 1989; Lieber and Ward, 2011). These quantifiable
parameters include: fibre bundle length, pennation angle, muscle volume, physiological cross-

16
sectional area, sarcomere length, and tendon geometry (Gans and Gaunt 1991; Zajac, 1992;
Lieber and Ward, 2011). The definition and functional significance of these parameters are
outlined below.
2.4.1 Fibre bundle length
Fibre bundle length (FBL) is the length of a fibre bundle between its attachment sites. In
relation to muscle function, FBL influences both the excursion capacity and maximum
shortening velocity of a muscle (Gans and de Vree, 1987; Zajac, 1992; Ranssier, 1999; Lieber
and Ward, 2011). A muscle with longer fibre bundles will have greater excursion and speed of
contraction.
This relationship between FBL and the distance and velocity of excursion of a muscle can
be accounted for by the arrangement of the sarcomeres within a fibre bundle. The length of a
muscle fibre, and therefore a fibre bundle, is determined by the number of sarcomeres arranged
in series. Upon contraction, all of the sarcomeres in a muscle fibre shorten simultaneously and by
a proportional amount (Lieber and Friden, 2000). This means that the greater the FBL, the
greater the change in FBL and muscle length (excursion) during muscle contraction (Stevens et
al. 2014).
2.4.2 Pennation angle
Skeletal muscles exert a linear force on their attachment sites and the direction of the
resultant force vector is referred to as the muscle’s line of action. Pennation angle (PA) is the
angle between a fibre bundle and the muscle’s line of action. In the literature, many synonymous
terms have been used to describe the muscle’s “line of action”, including performance line (Gans
and de Vree, 1987), force-generating axis (Lieber et al., 1992), and tendon axis (Gans and Bock,
1965).

17
Pennation angle influences the force-generating capability of a muscle (Table 2.2).
Table 2.2. The effect of pennation angle on fibre bundle force.
As a fibre bundle contracts:
1. A force vector is generated in the direction of the fibre
bundle.
2. Due to its pennation angle (θ), the force vector is
broken down into x-and y-components.
3. The force transmitted along the x component (line of
action) is reduced by the cosine of the pennation angle.
4. The y-component is perpendicular to the muscle’s line
of action and does not directly contribute to the
resultant force, but produces a translational shift at the
muscle’s insertion site, altering the orientation of the
line of action if not opposed.
At the fibre bundle level, only a portion of the force generated by each fibre bundle is transmitted
along the line of action to the muscle’s attachment site. The force transmitted by each fibre
bundle is reduced by the cosine of the pennation angle (Figure 2.10). Therefore, as the pennation
angle increases, the proportion of the force contributed by individual fibre bundles decreases.
Figure 2.10. Graph showing the relationship of cosine pennation angle (θ).

18
This effect is mitigated at the muscle level, since increased pennation allows more fibre
bundles to be packed into a given muscle volume, at the expense of FBL and thus excursion. Due
to the overall greater number of fibre bundles, pennate muscles generally have a greater force-
generating capability than parallel-fibred muscles of equal volume (Gans and de Vree, 1987;
Gans and Gaunt, 1991; Lieber et al., 1990; Zajac, 1992).
Pennation angle not only influences force production, but also excursion. The distance of
excursion of a muscle relative to its fibre bundles is described by the reciprocal of cosine of the
mean pennation angle (cos θ)-1
.
For example, a muscle with a mean pennation angle of:
50°, the excursion of the muscle is about 1.5 times that of its fibre bundles.
10°, the excursion of the muscle is about 1.02 times that of its fibre bundles.
The reciprocal cosine graph in figure 2.11. illustrates this relationship.
Figure 2.11. Relationship between (cos θ) -1
and pennation angle.
2.4.3 Muscle volume
Muscle volume (MV) is defined as the amount of space a muscle occupies. Although
volume can, on a gross level, influence a muscle’s functional capability, the force generation or

19
the excursion characteristics of a muscle are more closely related to its fibre bundle
arrangement/geometry. For example, two muscles of an equal volume but different fibre bundle
architecture can have significant differences in their force-generating or excursion capabilities.
2.4.4 Physiological cross-sectional area and force index
Physiological cross-section area (PCSA) is a comparative estimate of a muscle’s force-
generating capability. Physiological cross-sectional area is defined as the sum of cross-sectional
areas of all of the fibre bundles within a muscle. However, summation of the cross-sectional area
of each fibre bundle is difficult, if not impossible, using direct cadaveric measurements.
Theoretically, the peak isometric force that a muscle can generate is estimated by
multiplying the muscle’s PCSA with a maximum stress constant (Lemay and Crago, 1996).
However, the value of this constant remains controversial, with different values reported in the
literature, e.g., 35 N/cm2 (Zajac, 1992), 45 N/cm
2 (Hermann and Delp, 1999), and 22.5 N/cm
2
(Lieber and Belvin, 2011). In addition, there is doubt whether the maximum stress value is
consistent across all human skeletal muscles (Buchanan, 1995).
Force index is a further indicator of the functional characteristics of a muscle. This index is
the ratio between muscle’s PCSA and its volume, and normalizes the parameters between small
and large muscles.
2.4.5 Sarcomere length
Sarcomere length (SL) is the distance between two consecutive Z-disks (lines). It is an
indicator of the degree of contraction/stretch of the muscle fibres. The length-tension curve
shows that muscle with a sarcomere length within the optimal range (2.64-2.81μm) produces the
greatest isometric tension (Lieber et al. 1994).

20
2.4.6 Tendon geometry
Since the external tendon is usually cylindrical in shape and ellipsoidal in cross-section,
the length, cross-sectional area and volume have been used to characterize its geometry (Murry
et al., 2000; Langenderfer et al., 2004). In contrast, internal tendons/aponeuroses have not been
extensively studied. Only a few large aponeuroses have been quantified, e.g., for masseter.
Parameters studied included maximum length and width, surface area and volume (van Eidjen et
al., 1997; Langenderfer et al., 2004; Cioffi et al., 2012).
Long, thin external tendons are more compliant than short, wider tendons, enabling
stretch and recoil during muscle contraction or passive joint movement. Long, external tendons
have been postulated to enhance the excursion of the muscle, especially during cyclic stretch-
shortening activities such as running (Zajac, 1992; Biewener and Roberts, 2000). In contrast,
broad internal tendons/aponeuroses, i.e., large surface area, significantly increase the overall
stiffness of the muscle tissue, which can augment the muscle’s force-generating capability
(Zajac, 1992; Cioffi et al., 2012).
2.5 Measurement of architectural parameters
Musculotendinous architectural parameters have most commonly been obtained from
cadaveric studies, but increasingly, data have been acquired from in vivo medical imaging
modalities such as ultrasound, if appropriate. When using any of these methods, the measurable
architectural parameters have been quantified in 2D space, making it difficult to interpret the
volumetric arrangement of fibre bundles and connective tissue elements. Cadaveric studies
enable quantification of FBL, PA, MV, PCSA, and superficial tendon morphology. Each
imaging modality enables documentation of only a small number of architectural parameters. For

21
example, ultrasound cannot be used to calculate MV but can be used to determine regional FBL
and PA.
More recently, 3D methodologies have been developed to model the contractile and
connective tissue elements of skeletal muscle throughout the entire muscle volume and quantify
the architectural parameters of cadaveric specimens in 3D space (Kim et al., 2007; Rosatelli et
al., 2008; Ravichandiran et al., 2009). Imaging technologies such as MRI and CT can capture
muscle volume and the extent of some aponeuroses, but not internal fibre bundle architecture
(Holzbaur et al. 2007; Smeulders et al. 2010; Cioffi et al. 2013). Diffusion tensor MRI with
tractography, can capture general fibre bundle direction but not throughout the muscle volume.
In addition the data-to-noise ratio is high and this technique cannot differentiate between
connective and contractile elements (Froeling et al. 2012; Levin et al. 2011; Schenk et al. 2013).
In this section, the measurement techniques used in the 2D and 3D approaches will be
discussed.
2.5.1 Two-dimensional measurements
2.5.1.1 Fibre bundle length
In most architectural studies, FBL was measured manually from cadaveric specimens using
rulers or calipers (Sacks and Roy, 1982; Lieber et al., 1992; van Eijden et al., 1997). Only a
limited number of fibre bundles (2-70) were quantified in each study. The location of sampling
of fibre bundles was either from the surface of the muscle or undefined. Furthermore, the
measurements were commonly taken from excised fibre bundles, increasing the possibility of
change in their length from in situ (Schumacker, 1961; Weijs and Hillen, 1984). When using
ultrasonography, the FBL was measured from the images using the measurement tool in the
equipment, other software or manually.

22
2.5.1.2 Pennation angle
Pennation angle has been quantified directly from cadaveric specimens using a protractor
or goniometer (Lieber et al., 1992; van Eijden et al., 1997). Pennation angle was measured at one
or both attachment site(s), as the angle of the fibre bundle makes at its attachment site to
aponeurosis, tendon or bone. On ultrasound scans, the angles at attachment site(s) were
quantified using software or manually with a protractor (Kim et al., 2013; Kwah et al., 2013).
Although the definition of “pennation angle” states that the angle should be measured to
the muscle’s line of action, this has not been possible because this line cannot be visualized on a
specimen or ultrasound scan. In earlier studies, the line of action was estimated as a line joining
the centre point of the origin of the muscle to the attachment site of the tendon of insertion, or
was based on the estimated centre of the tendon of insertion only (Jensen and Davy, 1975; Lieber
et al., 1992; Arnold and Delp, 2011).
2.5.1.3 Muscle volume
Traditionally, MV has been measured using water displacement (Mendez and Keys, 1960;
Friederich and Brand, 1990). Due to the methodological difficulties of the water displacement
technique, MV was derived indirectly by dividing muscle mass with a standard muscle density
(1.0597g/cm3) obtained from fresh canine and rabbit muscles (Mendez and Keys, 1960).
More recently, computed tomography (CT) and magnetic resonance imaging (MRI) have
been used to determine MV, but both techniques have limitations due to the inability to capture
the entire muscle when the ends are tapered or have narrow tendinous attachments (Blemker and
Delp 2005; Gilles et al., 2006; Holzbaur et al., 2007; Smeulders et al., 2010).

23
2.5.1.4 Physiological cross-sectional area
Direct measurement of PCSA was attempted in some of the early muscle architectural
studies. First, all of the fibre bundles in a muscle were removed and placed in parallel in a U-
shaped trough. Then, the stack of fibre bundles was compacted gently with pressure until the
density reached roughly the same level as in the original specimen. The measured cross-sectional
area of the fibre bundle stack provided an estimation of the muscle’s PCSA (Buchner, 1877;
Schumacher, 1966). However, the direct measurement method is complex and susceptible to
error.
More commonly, PCSA is derived mathematically from the MV, mean FBL, and more
recently, the mean PA using the equation below (Brand et al., 1986; Lieber et al., 1992; Zajac,
1992):
Accurate PCSA estimation requires detailed knowledge of the architectural parameters of a
muscle (Zajac, 1989; Lieber and Ward, 2011). However, this methodology of PCSA calculation
has several limitations:
1) The equation relies on one average value for each architectural parameter, and thus does
not take architectural variability within the muscle volume into consideration.
2) The mean architectural parameters have been obtained from a limited number of fibre
bundles usually sampled from the superficial surface of the muscle, which can result in
over-generalization of the parameters.

24
3) Architectural parameters have been obtained using 2D manual measurement techniques,
which are subject to bias and cannot be correlated to the line of action or a specific
location within the muscle volume.
2.5.1.5 Sarcomere length
Sarcomere length has been measured using light microscopy or laser diffraction. When
light microscopy is ultilized, a muscle biopsy is viewed using a 63 or 100x objective lens to
measure the length of a striation consisting of adjacent light and dark bands (Sack and Roy,
1986; Pearson et al., 2012). When using laser diffraction, a laser beam (a coherent light source)
is passed through a muscle fibre, producing a regularly spaced interference pattern. From this
interference pattern, SL can be quantified (Lieber et al., 1984; Murray et al., 2000).
2.5.2 Three-dimensional measurement
Digitization and high resolution 3D modeling of cadaveric specimens enables visualization
and quantification of both the contractile and connective tissue elements of a muscle in greater
detail than was previously possible.
The contractile elements, i.e., the fibre bundles, are digitized throughout the entire volume
of the muscle. Using this technique, depending on the size of the muscle, up to 2000 fibre
bundles have been digitized (Li et al., 2014). The large number of fibre bundles digitized will
capture architectural variation within the muscle volume. The density of points digitized on each
fibre bundle can be increased or decreased depending on the length, complexity and curvature of
the fibre bundle. Data point collection, in situ, throughout the length of the muscle fibre captures
the course of the fibre bundle in much greater detail than when measuring between attachment
sites in 2D.

25
Using digitization, it is possible to capture the relationships of the connective tissue
elements, i.e., external and internal tendons/aponeuroses, to the fibre bundles. The external
tendon can be reconstructed in 3D using digitized cross-sectional data, and its continuity with
internal tendons documented. The internal tendons and aponeuroses can be captured to their full
extent in the muscle volume.
Quantification of the architectural parameters, using the digitized Cartesian coordinate
data, makes it possible to calculate the parameters in 3D space, incorporating complex geometry.
Most notably, this can be done at the fibre bundle level, rather than using means of parameters.
Volumetric data, such as muscle volume and PCSA, can be extracted from the digitized fibre
bundle data using geometric tessellation (Lee et al., 2012).
2.6 Architecture of the oro-facial and hyoid muscles
This thesis will focus on the architecture and spatial arrangement of the oro-facial and
hyoid muscles. The oro-facial muscles include the muscles of facial expression and the muscles
of mastication, whereas the hyoid muscles are divided by the hyoid bone into supra- and
infrahyoid muscle groups. All of these muscles work together, in a coordinated fashion, to
produce facial expression, mastication, swallowing and speaking. The few previous architectural
studies found in the literature were cadaveric or in vivo, using ultrasound, CT or MRI. Most of
the studies were descriptive and quantified only select architectural parameters. An overview of
these studies will be provided in the next sections of this thesis.
2.6.1 Cadaveric studies
Previous cadaveric studies of the oro-facial and hyoid musculature all quantified the
architectural parameters in 2D. The 2D measurement techniques were discussed in section 2.5.1

26
of this thesis. The specific methodology used in each cadaveric architectural study of the oro-
facial and hyoid musculature is summarized in Table 2.3.
Table 2.3. Overview of methodologies used to measure architectural parameters of
supra/infrahyoid and masticatory muscles.
Study FBL PA Mass/volume (MV) PCSA
Van Eijden
et al.
1997
Caliper Muscle longitudinal
section
Tendon plate and
FBs traced on
acetate paper
PA protractor
Contractile-tissue
(hand dissected)
weight / muscle
density (1g/cm3).
Weijs and
Hillen,
1984
Manual.
FBs not in situ.
Not measured. Contractile-tissue
(hand dissected)
weight / muscle
density (1g/cm3).
Schumacher,
1961
Manual.
FBs not in situ. Muscle longitudinal
section
Tendon plate and
FBs on plexiglass
PA protractor (<10°
not reported)
Contractile-tissue
(hand dissected)
weight / muscle
density (1g/cm3)
Pearson,
et al.
2011, 2013
Half head on
2D grid.
FBL from
digital
image.
Half head on 2D
grid.
Line of action and
PA from digital
image.
Total muscle weight
/ muscle density
(1g/cm3)
FBL, fibre bundle length; PA, pennation angle; MV, muscle volume; PCSA, physiological cross-
sectional area.
The remainder of this section of this thesis will focus on comparing the quantified
architectural parameters of the muscles of mastication, muscles of facial expression, and supra-
and infrahyoid muscles reported in these studies.
2.6.1.1 Muscles of facial expression
The architectural parameters of the muscles of facial expression have not been
investigated. Only two cadaveric studies were found that reported the mean length and width of
these muscles (Balogh et al., 1988; Happak et al., 1997). Balogh et al. (1988) investigated

27
thirteen muscles of facial expression and Happak et al. (1997) investigated eight. Other studies
were descriptive and focused on muscle shape and location of attachment (Gassner et al. 2008;
Hutto and Vattoth, 2015). Thus, the architecture of the muscles of facial expression is largely
unknown.
2.6.1.2 Muscles of mastication
Three cadaveric studies were found that investigated the architectural parameters of all
four muscles of mastication, including masseter, temporalis, medial pterygoid and lateral
pterygoid. The documented architectural parameters of each study are summarized in Table 2.4.
In two studies, the architectural parameters were summarized for the muscle as a whole, whereas
in the van Eijden et al. (1997) study, each muscle was further subdivided using attachment
criteria or visual definition of superficial changes in fibre bundle direction. Sarcomere length
and pennation angle were only measured in one of the three studies (Eijden et al., 1997); thus, it
is not possible to compare these parameters using the previous literature.
When considering the results of these three studies, FBL was relatively consistent when
reported for the muscle as a whole, but van Eidjen et al. (1997), studying sub-divisions of the
muscles, found large differences in FBL throughout the volume of the muscle. This was most
evident when comparing the superficial and deep parts of the masseter muscle.
Muscle volume, which is included in the PCSA calculation, was the most variable
parameter in the three studies. For example, the average volume of masseter (24.58±4.37 cm3)
reported by van Eijden et al. (1997) was 3 times greater (7.99 cm3) than that reported by
Shumacher (1961). Physiological cross-sectional area therefore also varied; for example, in the
three studies the PCSA for temporalis ranged from 3.81 cm2 (Schumacher, 1961) to 13.25±3.30
cm2 (van Eijden et al. 1997).

28
Table 2.4. Summary of architectural parameter of muscles of mastication.
Study Muscle n
nFB
MV (cm3) FBL
(mm)
SL (μm) PA (°) PCSA
(cm2)
Van Eijden
et al. 1997
Temporalis
(anterior)
8 24.35±5.70 27.1±3.8 2.35±0.14 15.3±2.0 7.70±2.12
Temporalis
(posterior)
8 16.55±3.23 25.7±3.3 2.31±0.12 11.6±1.9 5.55±1.27
Temporalis
(Total)
8
60FB
40.9±8.41 26.4±3.4 X X 13.25±3.30
Weijs and
Hillen; 1984
Temporalis 6
50FB
20.58±7.12 31.0±0.43 X X 7.11±2.12
Schumacher,
1961
Temporalis 30 12.37 33.34 X X 3.81
Van Eijden
et al. 1997
Masseter
(superficial)
8 18.5±4.10 24.6±4.1 2.47±0.27 16.5±4.5 6.82±1.04
Masseter
(deep)
8 12.23±1.26 18.0±2.8 2.44±0.22 6.7±3.2 3.49±0.82
Masseter
(total)
8
70FB
24.58±4.37 21.3±2.9 X X 10.31±1.41
Weijs and
Hillen; 1984
Masseter 6
25FB
14.27±5.35 22.2±0.13 X X 6.60±2.69
Schumacher,
1961
Masseter 30 7.99 25.8 X X 3.02
Van Eijden
et al. 1997
Med. Pterygoid
(anterior)
8
4.16±0.89 13.5±1.9 2.48±0.36 12.0±3.4 2.47±0.57
Med. Pterygoid
(posterior)
8 5.96±1.61 12.4±1.5 2.54±0.38 11.9±3.0 3.53±0.97
Med Pterygoid
(total)
8
20FB
10.12±2.26 12.9±1.6 X X 6.00±1.24
Weijs and
Hillen; 1984
Med. Pterygoid 6
25FB
5.95±1.44 13.9±0.08 X X 4.27±1.08
Schumacher,
1961
Med. Pterygoid 30 3.15 16.02 X X 1.97
Van Eijden
et al. 1997
Lat. Pterygoid
(inferior)
8 6.88±1.71 23.0±2.7 2.83±0.10 13.3±3.3 2.82±0.66
Lat. Pterygoid
(superior)
8 2.12±0.70 21.1±2.2 2.72±0.11 X 0.95±0.35
Lat. Pterygoid
total
8
20FB
9.00±1.77 22.2±2.2 X X 3.78±0.71
Weijs and
Hillen; 1984
Lat. Pterygoid 6
FB
6.42±1.82 24.2±0.27 X X 2.31±1.00
Schumacher,
1961
Lat. Pterygoid 30 3.98 22.02 X X 1.83
n- number of specimens used. nFB- number of fibre bundles sampled/muscle. FBL, fibre
bundle length; MV, muscle volume; PA, pennation angle; PCSA, physiological cross-
sectional area; SL, sarcomere length. Med. Pterygoid- medial pterygoid. Lat. Pterygoid-
lateral pterygoid. X, no available data.

29
Previous anatomical studies were descriptive and only provided an overview of the
structure and organization of a particular muscle without quantifying architectural parameters.
For example, the laminar structure of the masseter muscle was reported in several studies and
was used as a morphologic variable to divide the muscle into multiple sub-volumes (Hannam and
McMillian, 1994; Gaudy et al., 2000).
2.6.1.3 Suprahyoid muscles
Two cadaveric studies were found that quantified the fibre bundle architecture of the
suprahyoid muscles, including digastric, mylohyoid, stylohyoid and geniohyoid (van Eijden et
al., 1997; Pearson et al., 2011). One study focused on the role of the suprahyoid muscles on
hyoid movement during swallowing (Pearson et al., 2011), and the other on the role of the
suprahyoid muscles in elevation and depression of the mandible (Van Eijden et al., 1997). The
quantified architectural parameters are summarized in Table 2.5.

30
Table 2.5. Summary of architectural parameters of suprahyoid muscles.
Study Muscle n MV (cm3) FBL (mm) SL (μm) PA (°) PCSA (cm
2)
van Eijden
et al. 1997
Digastric,
Posterior
8 2.82 ± 0.71 20.5 ± 2.6 2.72 ± 0.14 14.3 ± 4.1 1.16 ± 0.31
Pearson et
al. 2011
Digastric,
Posterior
13 2.53 ± 0.65 30.27 ± 4.28 2.95 ± 0.43 7.10 ± 3.71 0.64 ± 0.16
van Eijden
et al. 1997
Digastric,
Anterior
8 2.72 ± 0.50 21.4 ± 4.5 2.75 ± 0.21 13.0 ± 6.2 1.16 ± 0.32
Pearson et
al. 2011
Digastric,
Anterior
13 2.37 ± 0.46 33.30 ± 4.50 2.75 ± 0.34 9.29 ± 3.40 0.55 ± 0.12
van Eijden
et al. 1997
Mylohyoid
total
8 6.07 ± 1.17 28.2 ± 3.3 2.85 ± 0.18 0 2.12 ± 0.32
Pearson et
al. 2011
Mylohyoid
(posterior)
13 2.17 ± 0.56 47.50 ± 3.92 2.43 ± 0.51 2.39 ± 0.85 0.43 ± 0.12
Pearson et
al. 2011
Mylohyoid
(anterior)
13 3.03 ± 0.47 32.87 ± 4.26 2.43 ± 0.30 6.99 ± 4.49 0.82 ± 0.18
van Eijden
et al. 1997
Geniohyoid 8 3.41 ± 0.88 34.3 ± 5.1 2.65 ± 0.33 0 0.97 ± 0.23
Pearson et
al. 2011
Geniohyoid 13 1.39 ± 0.46 35.32 ± 3.69 2.31 ± 0.55 7.30 ± 1.58 0.46 ± 0.16
van Eijden
et al. 1997
Stylohyoid 8 1.5 ± 0.35 36.4 ± 2.8 2.76 ± 0.18 4.7 ± 0.7 0.39 ± 0.09
Pearson et
al. 2011
Stylohyoid 13 2.21 ± 0.59 46.93 ± 7.11 2.80 ± 0.35 5.02 ± 1.83 0.27 ± 0.09
n, number of specimens; FBL, fibre bundle length; MV, muscle volume; PA, pennation
angle; PCSA, physiological cross-sectional area; SL, sarcomere length.
The fibre bundle length of digastric, mylohyoid and stylohyoid varied markedly between
the two studies: Pearson et al. (2011) reported a FBL up to 50 percent longer than van Eijden et
al. (1997). Pennation angle also varied between the two studies; however, the PCSA reported by
Pearson et al. (2011) was consistently about one half of that reported by van Eijden et al. (1997)
for the digastric, mylohyoid and geniohyoid. Sarcomere length was consistent between the two
studies.
2.6.1.4 Infrahyoid muscles
Infrahyoid muscles include sternohyoid, omohyoid, sternothyroid, and thyrohyoid.
Pearson et al. (2013) investigated the architecture of the thyrohyoid muscle. No other studies

31
were found that have quantified the architecture of the other infrahyoid muscles. The FBL, PA,
SL, MV and PCSA of thyrohyoid are summarized in Table 2.6.
Table 2.6. Summary of architectural parameters of suprahyoid muscles.
Study Muscle n MV (cm3) FBL (mm) SL (μm) PA (°) PCSA (cm
2)
Pearson et
al. 2013 Thyrohyoid 12 1.56 ± 0.49 30.68 ± 6.56 2.90 ± 0.24 3.78 ± 1.47 0.51 ± 0.18
n, number of specimens used; FBL, fibre bundle length; MV, muscle volume; PA,
pennation angle; PCSA, physiological cross-sectional area; SL, sarcomere length.
Studies of the sternohyoid, sternothyroid and omohyoid muscles were limited to descriptions of
muscle attachments and morphological variation (Leppi, 1961; Miura et al., 1995; Sonoda and
Tamatsu, 2008; Nayak et al., 2009).
2.6.2 Imaging studies
Computed tomography, MRI and ultrasound have all been used to quantify a small number
of architectural parameters of the oro-facial and hyoid musculature. These parameters include
muscle volume, cross-sectional area, muscle thickness and percentage muscle shortening on
contraction (Table 2.7). Fibre bundle length and pennation angle have not been investigated.
Table 2.7. Summary of imaging studies of oro-facial and supra- and infrahyoid muscles,
and quantified muscle parameters.
Muscle
group
MRI CT Ultrasound
MV/CA % Shortening Thickness
Facial
expression
X X Satiroglu et al. 2005.
Van Alfen et al. 2013.
Mastication 1. Weijs and Hillen,
1985.
2. Hannam and Wood,
1989
3. Cioffi et al. 2012.
X 4. Bakke et al. 1992
5. Raadsheer et al 1994
6. Kubota et al. 1998.
7. Emshoff et al. 1999.
8. Raadsheer et al. 2004
9. Satiroglu et al. 2005
Suprahyoid X Okada et al. 2013
7. Emshoff et al. 1999.
8. Raadsheer et al. 2004
Infrahyoid X Okada et al. 2013 X
X, no available data.

32
Magnetic resonance imaging studies have measured the muscle volume and cross-sectional area,
CT the percentage of muscle shortening on contraction, and ultrasound muscle thickness.
2.6.2.1 Muscles of facial expression
The thickness of selected muscles of facial expression was measured using ultrasound. The
results of the two studies are summarized in Table 2.9.
Table 2.8. Summary of thickness (mm) of muscles of expression as reported in ultrasound
studies.
Procerus Zygomaticus
Major
Levator
labii
superioris
Depressor
anguli
oris
Mentalis Orbicularis
oris (pars
labialis)
Orbicularis
oris (pars
marginalis)
Satiroglu
et al. 2005
3.44±0.40 3.48±0.49
Van Alfen
et al. 2013
0.56
(0.4-0.9)
2.5
(2.1-2.9)
1.6
(0.9-2.3)
3.0
(2.1-3.9)
3.0
(1.4-4.2)
2.2
(1.7-3.1)
1.5
(1.1-2.4)
These were the only studies that were found that quantified the architectural parameters of
the muscles of facial expression. Satiroglu et al. (2005) studied 47 adult subjects, whereas van
Alfen et al. (2013) studied 13 subjects. Besides the muscles listed in Table 2.8, van Alfen et al.
(2013) also attempted to quantify the thickness of other facial muscles, but found that they were
either too thin or indistinguishable from the adjacent muscles/soft tissue.
2.6.2.2 Muscles of mastication
The quantified architectural parameters of the muscles of mastication from three MRI and
six ultrasound studies are summarized in Table 2.9.
33
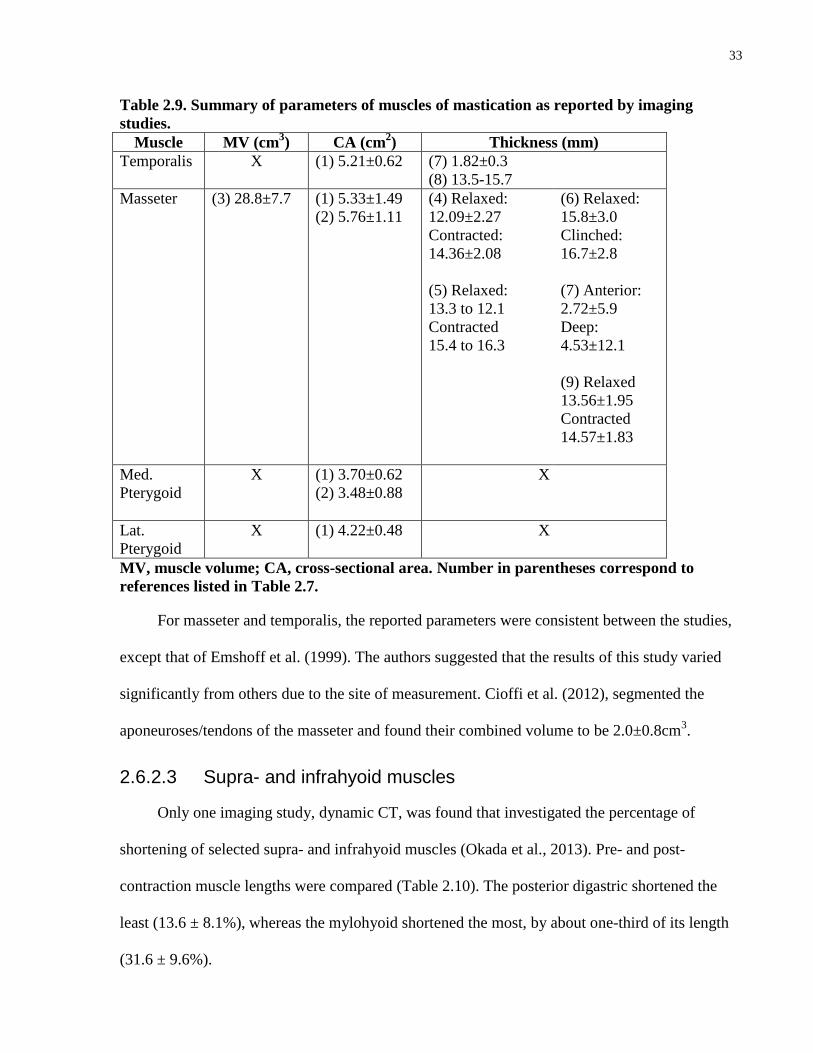
Table 2.9. Summary of parameters of muscles of mastication as reported by imaging
studies.
Muscle MV (cm3) CA (cm
2) Thickness (mm)
Temporalis X (1) 5.21±0.62
(7) 1.82±0.3
(8) 13.5-15.7
Masseter (3) 28.8±7.7
(1) 5.33±1.49
(2) 5.76±1.11
(4) Relaxed:
12.09±2.27
Contracted:
14.36±2.08
(5) Relaxed:
13.3 to 12.1
Contracted
15.4 to 16.3
(6) Relaxed:
15.8±3.0
Clinched:
16.7±2.8
(7) Anterior:
2.72±5.9
Deep:
4.53±12.1
(9) Relaxed
13.56±1.95
Contracted
14.57±1.83
Med.
Pterygoid
X (1) 3.70±0.62
(2) 3.48±0.88
X
Lat.
Pterygoid
X (1) 4.22±0.48
X
MV, muscle volume; CA, cross-sectional area. Number in parentheses correspond to
references listed in Table 2.7.
For masseter and temporalis, the reported parameters were consistent between the studies,
except that of Emshoff et al. (1999). The authors suggested that the results of this study varied
significantly from others due to the site of measurement. Cioffi et al. (2012), segmented the
aponeuroses/tendons of the masseter and found their combined volume to be 2.0±0.8cm3.
2.6.2.3 Supra- and infrahyoid muscles
Only one imaging study, dynamic CT, was found that investigated the percentage of
shortening of selected supra- and infrahyoid muscles (Okada et al., 2013). Pre- and post-
contraction muscle lengths were compared (Table 2.10). The posterior digastric shortened the
least (13.6 ± 8.1%), whereas the mylohyoid shortened the most, by about one-third of its length
(31.6 ± 9.6%).

34
Table 2.10. Change in length in suprahyoid muscles during swallowing.
Max muscle
length (mm)
Min muscle
length (mm)
Shortening
length (mm)
% shortening
Suprahyoid:
Digastric,
Posterior
85.2 ± 8.2 72.6 ± 9.4 11.7 ± 7.2 13.6 ± 8.1
Digastric,
Anterior
44.7 ± 7.5 36.5 ± 6.5 8.2 ± 4.7 17.9 ± 9.4
Mylohyoid 42.3 ± 11.3 29.0 ± 9.3 13.3 ± 5.2 31.6 ± 9.6
Geniohyoid 32.5 ± 5.5 22.8 ± 3.8 9.7 ± 4.1 29.2 ± 9.0
Stylohyoid 59.3 ± 12.3 46.6 ± 11.6 12.8 ± 7.2 21.3 ± 10.8
Infrahyoid:
Thyrohyoid 30.6 ± 7.4 22.1 ± 6.6 8.5 ± 3.8 28.1 ± 11.7
Two in vivo ultrasound studies were identified that investigated muscle thickness. Emshoff
et al. (1999) found that the mean thickness of the anterior digastric was 4.48±1.09mm, almost
double that of the posterior digastric (2.37±0.55mm), whereas Raasheer et al. (2004) reported
that the thickness of the anterior digastric ranged from 5.8-6.7mm.
2.7 Muscle modelling
Computer modeling of skeletal muscles has been used to study muscle function for many
decades. Line segment models were the first to be developed, followed by volumetric models.
These models form the core for dynamic simulation.
2.7.1 Line segment models
The simplest muscle models consist of a single line segment that connects the centres of
the muscle’s attachment sites. This line segment is intended to capture the muscle’s line-of-
action. However, a single line segment is not sufficient to represent muscles with broad
attachments and/or regions that vary architecturally (Blemker & Delp 2005). To overcome this
shortcoming, several line segments have been used to represent the lines of action within a

35
muscle. For example Hannam et al. (2003) modelled the masseter muscle using two line
segments, one representing the line of action of the superficial head and the other the deep head.
These simple line models can be used as actuators to perform dynamic simulations. The
actuators are used to constrain movement by programing them with basic architectural
parameters, e.g., PCSA and FBL (often from a limited number of fibre bundles). However, due
to the simplicity of these line segment models, they are limited in their ability to capture the
contractile behaviour of muscles, especially pennate muscles with complex fibre bundle
geometry (Blemker and Delp, 2005).
2.7.2 Volumetric muscle models
These 3D models can consist of:
An empty surface shell (obtained using CT or MRI reconstruction);
A surface shell containing generalized fibre bundle templates - an “anatomical-
based approximation” of fibre bundle geometry; or
The entire musculoaponeurotic geometry of a muscle based on digitized fibre
bundle and tendon/aponeurosis data.
These volumetric models can form the core for dynamic models. The empty shell muscle
models can be used to emulate, but not simulate, muscle deformation, and are limited to
computer animation (Lewis et al., 2000; Kahler et al., 2001). Shell models with generalized fibre
bundle templates can be transformed into dynamic finite element (FE) models (Blemker and
Delp 2005; Rohrle and Pullan 2007; Cotin, 2008). However, since the generalized fibre bundle
templates are not based on actual muscle geometry, the fidelity of the simulations has been

36
questioned.
The fidelity of dynamic simulations is dependent on the accuracy of the underlying muscle
architectural data (Blemker et al., 2007; Lee et al., 2009). Rohler and Pullan (2007) stated that
“although it would be desirable to base the [finite element] model fibre geometry on
measurements of actual muscle fibres, it was not possible to find applicable data”. With advances
in technology, it is now possible to capture fibre bundle geometry and organization using
digitization (Kim et al. 2007; Rosatelli et al. 2008; Li et al. 2013). Finite element techniques
using fibre bundle data are currently being developed. Sanchez et al. (2014) stated “the
significant differences observed in net forces produced as the fibre field is varied, as well as
discrepancies in geometric muscle deformation, suggest that we may need to pay closer attention
to subtleties in the fibre architecture”, and furthermore, “… it may not be sufficient to assume
some simplified fibre orientations as is common practice.”
2.8 Summary
The function and synergistic activity of the oro-facial and hyoid muscles are poorly
understood despite their importance in chewing, swallowing and verbal/non-verbal
communication. It is evident from the literature that the lack of a volumetric musculotendinous
database is impeding progress in advances in understanding the individual functions and
coordinated activity of the oro-facial and hyoid muscles.
Previous architectural studies of these muscle groups often focused on one or a small
number of muscles in a group and quantified only select architectural parameters. This has
resulted in a limited ability to study architectural partitioning in individual muscles and spatial
relationships between muscles in the same functional group. These studies were carried out in
2D space with fibre bundle measurements restricted to a small number of fibre bundles sampled

37
from the superficial surface of the muscle. These manual measurements were made using tools
such as calipers, protractors and grid based photography, all with inherent human error.
More recent developments in muscle geometry capture techniques include the use of a
digitizer to obtain Cartesian coordinates of fibre bundles and tendinous/aponeurotic elements,
allowing volumetric reconstruction of the entire muscle in 3D space. However, this technique
has not been utilized to generate a complete model/architectural database of the
musculotendinous structures of the oro-facial and hyoid regions. Pilot studies have indicated not
only that these data can be used to analyze a muscle’s functional capabilities in more depth than
was previously possible, but also that they can provide a basis for finite element modeling at the
fibre bundle level.
Therefore, the main objective of this thesis is to digitize, model and analyze the
architecture of the oro-facial and hyoid muscles to be able to compare their force generating and
excursion capabilities. At the same time, a comprehensive database of the musculoskeletal
parameters of these muscles will be established for use in modelling, imaging and clinical
studies.

38
Chapter 3
3 Objectives and hypothesis
3.1 Objectives
Overall:
To digitize, model and analyze the architecture of the oro-facial and hyoid muscles to
compare their force-generating and excursion capabilities, as determined by the muscle
architectural parameters, at the muscle group, whole muscle, and muscle partition levels.
Specific:
1. To digitize the fibre bundles and tendons of the oro-facial and hyoid musculature of one
cadaveric specimen.
2. To create 3D volumetric models of the oro-facial and hyoid musculature from the
digitized data.
3. To reconstruct 3D surface meshes of the skeleton of the head and neck from the CT scans
of the same specimen.
4. To combine the volumetric models of the muscles and 3D surface meshes of the skeleton
of the head and neck to create a comprehensive musculoskeletal model.
5. To quantify the fibre bundle length, pennation angle, muscle volume, and physiological
cross-sectional area of individual muscles at the fibre bundle level, and obtain SL
measurements throughout the muscle volume.
39
6. To characterize the spatial relationships between the fibre bundles and the
tendinous/aponeurotic elements of each muscle.
7. To develop preliminary observations about the force-generating and excursion
capabilities of the oro-facial and hyoid musculature that will inform the development of
future work adopting empirical approaches to identifying functional differences between
muscle groups, muscles as a whole, and partitions within muscles.
3.2 Hypothesis
The excursion and relative force-generating capabilities, as determined by the muscle
architectural parameters, will differ between the oro-facial and hyoid musculature at the
muscle group, whole muscle, and muscle partition levels.

40
Chapter 4
4 Material and Methods
One formalin embalmed human cadaveric specimen male in early 80s with normal
muscle mass and no visible signs of musculoskeletal abnormality or previous surgery was
included in this study. Ethics approval was received from the University of Toronto Health
Sciences Research Ethics Board (Protocol Reference #27210 and #28530) and the Mount Sinai
Hospital Research Ethics Board (Protocol Reference 12-0252-E).
The methodologies used in this thesis are summarized in the flowchart below (Figure
4.1), which provides a step-by-step guide to the workflow used in this study.
Figure 4.1. Workflow pipeline summarizing the steps involved in this study.

41
4.1 Scanning of specimen
The specimen was scanned using an Aquilion ONE™ Computed Tomography (CT)
scanner (Toshiba Medical Systems Corporation, Tokyo, Japan). The axial images were reformed
in the sagittal and coronal planes to provide datasets in all planes.
Figure 4.2. Aquilion ONE™ CT scanner (Toshiba Medical Systems Corporation, Tokyo,
Japan).
The scanned images were saved and exported in compressed Digital Imaging and
Communications in Medicine (DICOM) format. The slice thickness was 2mm; other parameters
are summarized in Table 4.1.
Table 4.1. Computed tomography scan parameters
Parameter (units) Coronal† Sagittal
† Axial
Voltage (kV) 120.0 120.0 120.0
Current (mA) 430.0 430.0 430.0
Thickness of slice (mm) 3 3 2
DFOV (cm) 41.8 × 41.8 41.8 × 41.8 25.0 × 25.0
Resolution (pixels) 856 × 856 856 × 856 512 × 512
Window 350 × 3500 3500 × 350 3500 × 350
DFOV, display field of view.
† Images obtained in the coronal and sagittal planes were reformed from scans in the axial plane.

42
The skeletal elements of the head and neck region were segmented from the CT scans and
volumetrically reconstructed using AMIRA (FEI Visualization Sciences Group, Bordeaux,
France and Zuse Institute Berlin, Berlin, Germany).
4.2 Dissection and digitization
The specimen was placed supine, in the anatomical position, on a dissection table and the
head and neck were stabilized using minimal expansion polyurethane foam (Great Stuff™, Dow
Chemical Co, Midland, Michigan, USA). The foam casing prevented movement of the specimen
during dissection and digitization. Prior to dissection and digitization, three screws were placed
in bone as reference markers that defined a virtual 3D Cartesian coordinate space in which
digitized data could be recorded and reconstructed. The screws were placed in the right and left
clavicles and in the frontal bone. The skin and fascia of the face and neck were removed to
expose the muscles. Digitization was carried out using a MicroScribeTM
MX Digitizer (0.05mm
accuracy; Immersion Corporation, San Jose, CA), as seen in Figure 4.3 A. Fibonacci, the
software used to collect the data from the digitizer was developed with our computer science
collaborators and named Fibonacci. The fibre bundles and tendinous elements of each of the
muscles of facial expression, mastication, suprahyoid and infrahyoid were digitized using the
processes outlined in the next sections.
4.2.1 Digitization of fibre bundles
Each muscle was exposed individually beginning with superficial muscles. The fibre
bundles on the exposed surface of the muscle were meticulously cleaned and delineated so that
each fibre bundle could be traced in its entirety. Each fibre bundle was digitized at 3-5mm
intervals between attachment sites (Figure 4.3 B and C). The number of points digitized along a
fibre bundle depended on its length and the complexity of its course. Next, the digitized fibre

43
bundles were excised to reveal the underlying fibre bundles. This process of dissection and
digitization of each fibre bundle was continued throughout the muscle volume.
Figure 4.3. Digitization of fibre bundles. A. MicroscribeTM
MX Digitizer. B. Digitized fibre
bundles of masseter specimen. Data points are purple and the points for each fibre bundle
are joined by an orange line. C. Digitized fibre bundles of masseter as seen on screen using
Fibonacci.
4.2.2 Digitization of tendinous elements
During digitization of the fibre bundles, all internal and external tendons, including
aponeuroses, were digitized beginning with the perimeter, followed by collagen fibre bundles on
the exposed surface (Figure 4.4). The digitized points were spaced at 3-5mm intervals. This
process was continued during serial dissection and digitization of the fibre bundles throughout
the volume of the muscle.
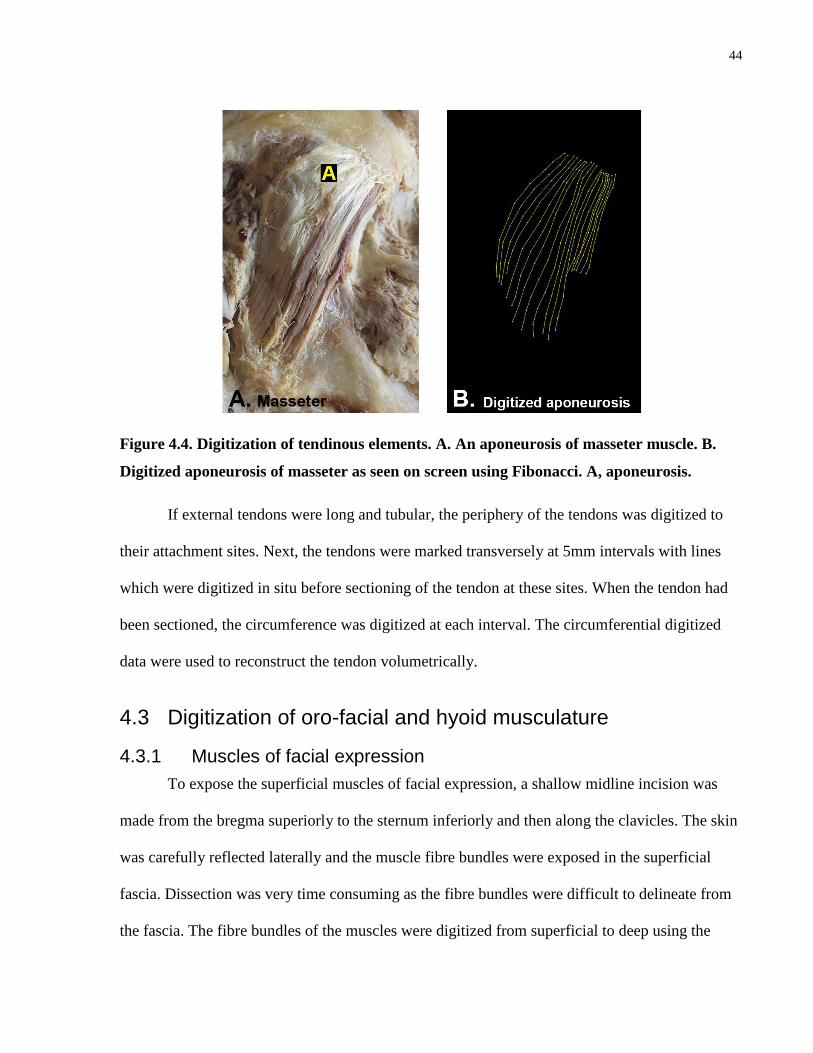
44
Figure 4.4. Digitization of tendinous elements. A. An aponeurosis of masseter muscle. B.
Digitized aponeurosis of masseter as seen on screen using Fibonacci. A, aponeurosis.
If external tendons were long and tubular, the periphery of the tendons was digitized to
their attachment sites. Next, the tendons were marked transversely at 5mm intervals with lines
which were digitized in situ before sectioning of the tendon at these sites. When the tendon had
been sectioned, the circumference was digitized at each interval. The circumferential digitized
data were used to reconstruct the tendon volumetrically.
4.3 Digitization of oro-facial and hyoid musculature
4.3.1 Muscles of facial expression
To expose the superficial muscles of facial expression, a shallow midline incision was
made from the bregma superiorly to the sternum inferiorly and then along the clavicles. The skin
was carefully reflected laterally and the muscle fibre bundles were exposed in the superficial
fascia. Dissection was very time consuming as the fibre bundles were difficult to delineate from
the fascia. The fibre bundles of the muscles were digitized from superficial to deep using the
45
process described above. The buccinator was the deepest muscle and was therefore digitized last.
All muscles of facial expression were digitized bilaterally except for buccinator and
temporoparietalis. The bilaterally digitized muscles included risorius, platysma, zygomaticus
major/minor, nasalis, levator labii superioris alaeque nasi (LLSAN), levator labii superioris
(LLS), orbicularis oculi, levator anguli oris (LAO), depressor anguli oris (DAO), depressor labii
inferioris (DLI), mentalis, orbicularis oris, frontalis, procerus, and corrugator.
4.3.2 Muscles of mastication
Since the muscles of facial expression were removed as they were digitized, the masseter
with the overlying facial blood vessels, the parotid gland and duct, and fascia was exposed
bilaterally. The overlying structures were removed, revealing the superficial fibre bundles and
aponeurosis of masseter. Both the fibre bundles and tendinous elements were serially dissected
and digitized using the process described above. Next, the zygomatic arch and temporal fascia
were removed to expose the temporalis, which was then dissected and digitized. To access the
lateral and medial pterygoid muscles for digitization, the coronoid process of the mandible was
excised and the ramus of the mandible was removed in small fragments, exposing the medial
pterygoid. The head of the mandible was left intact along with the lateral pterygoid. The
temporalis, medial and lateral ptergyoid were digitized on the right side only. During dissection
and digitization of the muscles of mastication, the surfaces of the underlying skeletal elements,
including the head and ramus of the mandible, zygomatic arch, lateral surface of the cranium and
lateral pterygoid plate, were digitized as they were exposed.
4.3.3 Supra- and infrahyoid muscles
Since the platysma was digitized with the muscles of facial expression, the supra- and
infrahyoid muscles had already been exposed. Any remaining fascia and blood vessels were

46
removed. The suprahyoid muscles were digitized first, beginning with the anterior and posterior
bellies of digastric, followed by stylohyoid, mylohyoid and geniohyoid. Next, the infrahyoid
muscles, including sternohyoid and omohyoid superficially and the deeper sternothyroid and
thyrohyoid, were digitized.
4.4 Three-dimensional modelling of digitized data
The digitized musculotendonous data were imported into Autodesk® Maya® (Autodesk
Inc., San Rafael, California) using custom software plug-ins developed in our laboratory.
The modelling process is outlined below:
The digitized points of each fibre bundle were connected by line segments. The path of
each digitized fibre bundle was approximated by a cubic uniform B-Spline curve, with
clamped boundary conditions, and then stored as a Maya® NURBS curve (Ravichandiran
et al. 2009). Each NURBS curve, i.e. fibre bundle, was volumetrically reconstructed into
a cylindrical tube.
The digitized points of the collagen fibre bundles along the perimeter and over the surface
of the tendinous elements were connected by line segments. Similar to the fibre bundle,
the digitized collagen fibre bundles were transformed into NURBS curves. The NURBS
curves, i.e., collagen fibre bundles, were lofted into a 3D surface.
To reconstruct the external tendon in 3D, the sites of the incrementally marked curves
along the tendon were used to spatially locate the corresponding circumference data. The
curves of the circumferential data were then lofted into a 3D surface.
The lofted internal/external tendons and aponeuroses were combined with the
cylindrically reconstructed muscle fibre bundles into one 3D model of each
musculotendinous unit.
The skeletal elements of the head and neck were volumetrically reconstructed from the
CT scans and registered with the digitized surfaces of the skeletal elements.
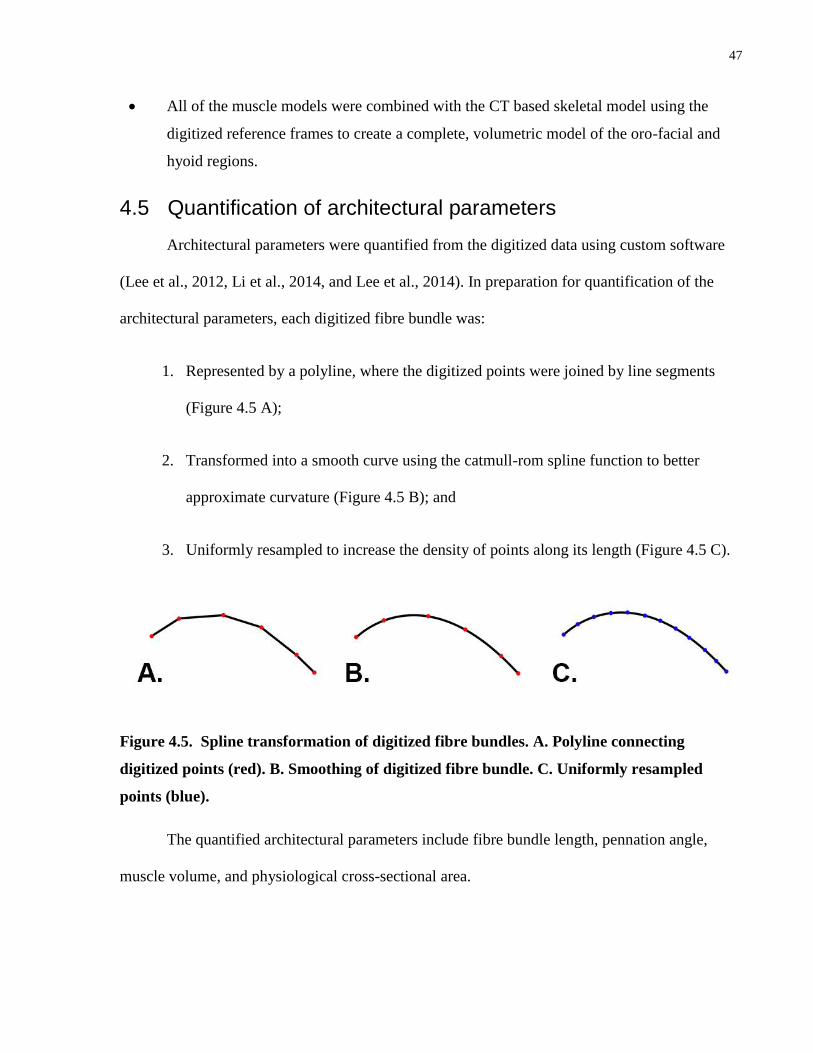
47
All of the muscle models were combined with the CT based skeletal model using the
digitized reference frames to create a complete, volumetric model of the oro-facial and
hyoid regions.
4.5 Quantification of architectural parameters
Architectural parameters were quantified from the digitized data using custom software
(Lee et al., 2012, Li et al., 2014, and Lee et al., 2014). In preparation for quantification of the
architectural parameters, each digitized fibre bundle was:
1. Represented by a polyline, where the digitized points were joined by line segments
(Figure 4.5 A);
2. Transformed into a smooth curve using the catmull-rom spline function to better
approximate curvature (Figure 4.5 B); and
3. Uniformly resampled to increase the density of points along its length (Figure 4.5 C).
Figure 4.5. Spline transformation of digitized fibre bundles. A. Polyline connecting
digitized points (red). B. Smoothing of digitized fibre bundle. C. Uniformly resampled
points (blue).
The quantified architectural parameters include fibre bundle length, pennation angle,
muscle volume, and physiological cross-sectional area.

48
4.5.1 Fibre bundle length
Fibre bundle length was obtained by summating the distances between the resampled
points (Figure 4.6.)
Figure 4.6. Quantification of fibre bundle length. represents the distance between two
adjacent points on the fibre bundle.
4.5.2 Pennation angle
Pennation angle is the angle between the fibre bundle and the muscle’s line of action. The
calculation of pennation angle is a three step process. Each step is outlined below.
1. The average tangent vector, i.e., fibre bundle orientation, was computed from a series of
tangent vectors at each point along the distal end of the fibre bundle (Figure 4.7).

49
Figure 4.7. Determination of average tangent vector (i.e. fibre bundle orientation). Tangent
vectors through each point along the distal end of the fibre bundle (green); averaged
tangent vector (red).
2. a) Determination of the line of action for the muscle as a whole or its regions. The line of
action was the vector determined by averaging the average tangent vectors of each fibre bundle
within the muscle or region of interest.
2. b) For “suspensory muscles”, which are usually somewhat V-shaped, another method is used
to calculate the line of action, as it is not in the direction of the fibre bundles. The muscle is
transversely divided along its midline and then the average tangent vector of each fibre bundle is
determined at this point. These vectors are averaged to determine the muscle’s line of action
(Figure 4.8).
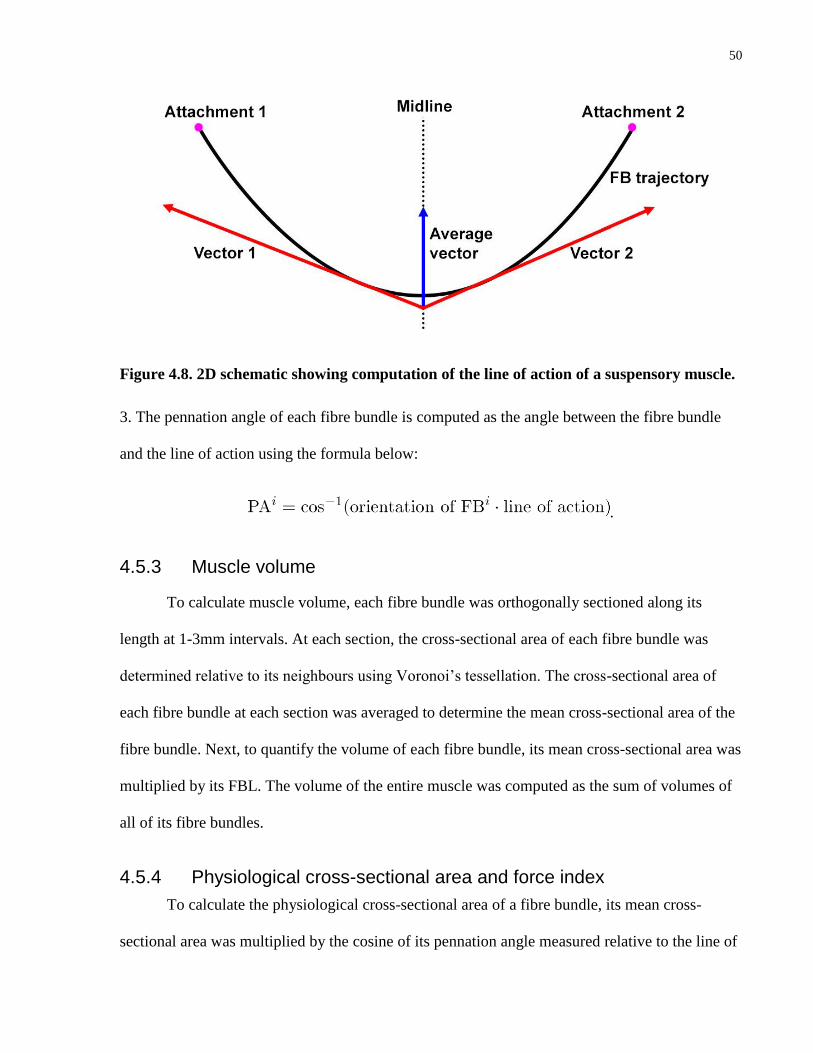
50
Figure 4.8. 2D schematic showing computation of the line of action of a suspensory muscle.
3. The pennation angle of each fibre bundle is computed as the angle between the fibre bundle
and the line of action using the formula below:
.
4.5.3 Muscle volume
To calculate muscle volume, each fibre bundle was orthogonally sectioned along its
length at 1-3mm intervals. At each section, the cross-sectional area of each fibre bundle was
determined relative to its neighbours using Voronoi’s tessellation. The cross-sectional area of
each fibre bundle at each section was averaged to determine the mean cross-sectional area of the
fibre bundle. Next, to quantify the volume of each fibre bundle, its mean cross-sectional area was
multiplied by its FBL. The volume of the entire muscle was computed as the sum of volumes of
all of its fibre bundles.
4.5.4 Physiological cross-sectional area and force index
To calculate the physiological cross-sectional area of a fibre bundle, its mean cross-
sectional area was multiplied by the cosine of its pennation angle measured relative to the line of
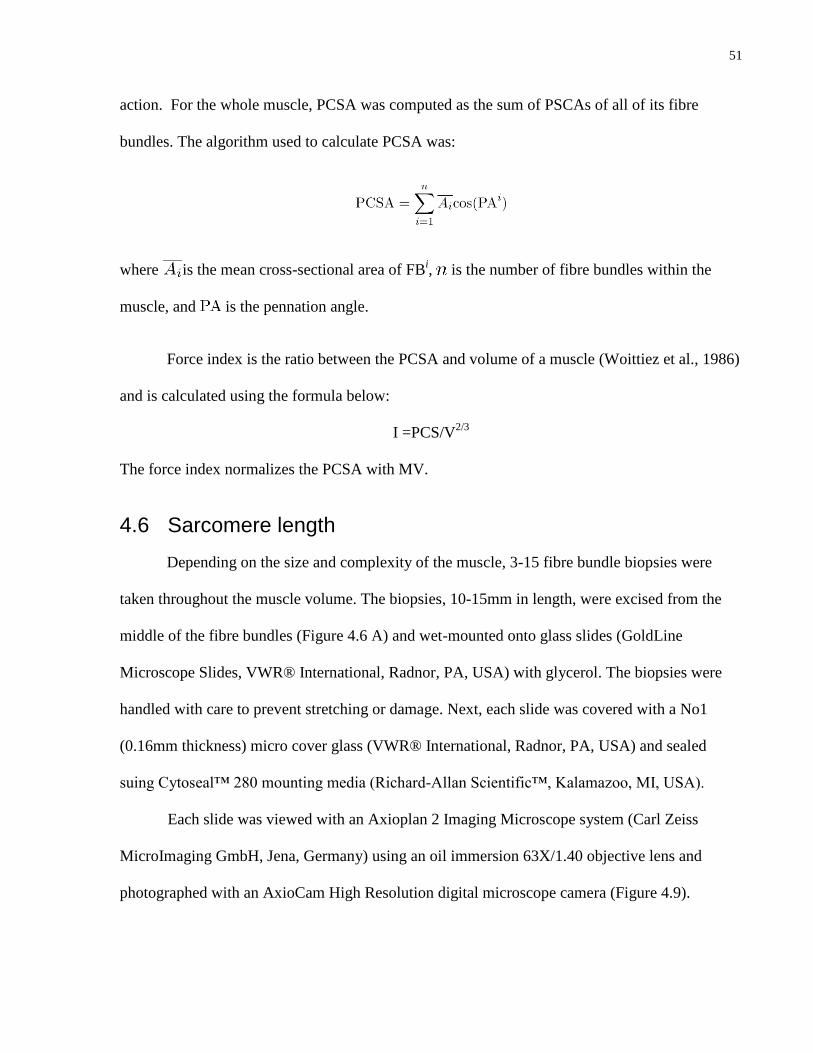
51
action. For the whole muscle, PCSA was computed as the sum of PSCAs of all of its fibre
bundles. The algorithm used to calculate PCSA was:
where is the mean cross-sectional area of FBi, is the number of fibre bundles within the
muscle, and is the pennation angle.
Force index is the ratio between the PCSA and volume of a muscle (Woittiez et al., 1986)
and is calculated using the formula below:
I =PCS/V2/3
The force index normalizes the PCSA with MV.
4.6 Sarcomere length
Depending on the size and complexity of the muscle, 3-15 fibre bundle biopsies were
taken throughout the muscle volume. The biopsies, 10-15mm in length, were excised from the
middle of the fibre bundles (Figure 4.6 A) and wet-mounted onto glass slides (GoldLine
Microscope Slides, VWR® International, Radnor, PA, USA) with glycerol. The biopsies were
handled with care to prevent stretching or damage. Next, each slide was covered with a No1
(0.16mm thickness) micro cover glass (VWR® International, Radnor, PA, USA) and sealed
suing Cytoseal™ 280 mounting media (Richard-Allan Scientific™, Kalamazoo, MI, USA).
Each slide was viewed with an Axioplan 2 Imaging Microscope system (Carl Zeiss
MicroImaging GmbH, Jena, Germany) using an oil immersion 63X/1.40 objective lens and
photographed with an AxioCam High Resolution digital microscope camera (Figure 4.9).
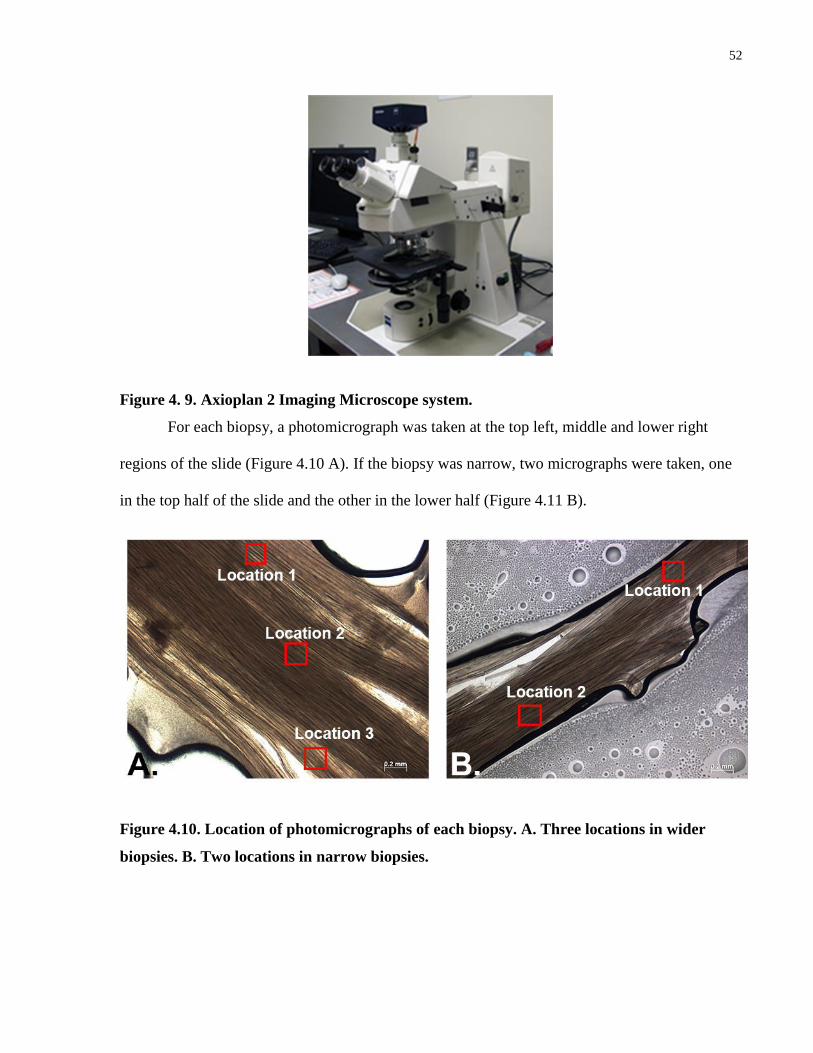
52
Figure 4. 9. Axioplan 2 Imaging Microscope system.
For each biopsy, a photomicrograph was taken at the top left, middle and lower right
regions of the slide (Figure 4.10 A). If the biopsy was narrow, two micrographs were taken, one
in the top half of the slide and the other in the lower half (Figure 4.11 B).
Figure 4.10. Location of photomicrographs of each biopsy. A. Three locations in wider
biopsies. B. Two locations in narrow biopsies.

53
Three muscle fibres, located at the top, middle and lower part of each micrograph were
selected for sarcomere length measurement (Figure 4.12). First, the length of ten sarcomeres in
series was measured, and then divided by ten to determine the average length of each sarcomere.
Figure 4.12. Measurements of ten sarcomeres in series (63x objective lens). The three
locations of measurement at the top, middle and lower part of the micrograph are shown.
The measurements were taken with an Image J system (http://rsbweb.nih.gov/ij) further
enhanced with the Bio-Formats plug-in (Univeristy of Dundee & Open Microscopy
Environment, http://www.openmicroscopy.org/site/products/bio-formats).
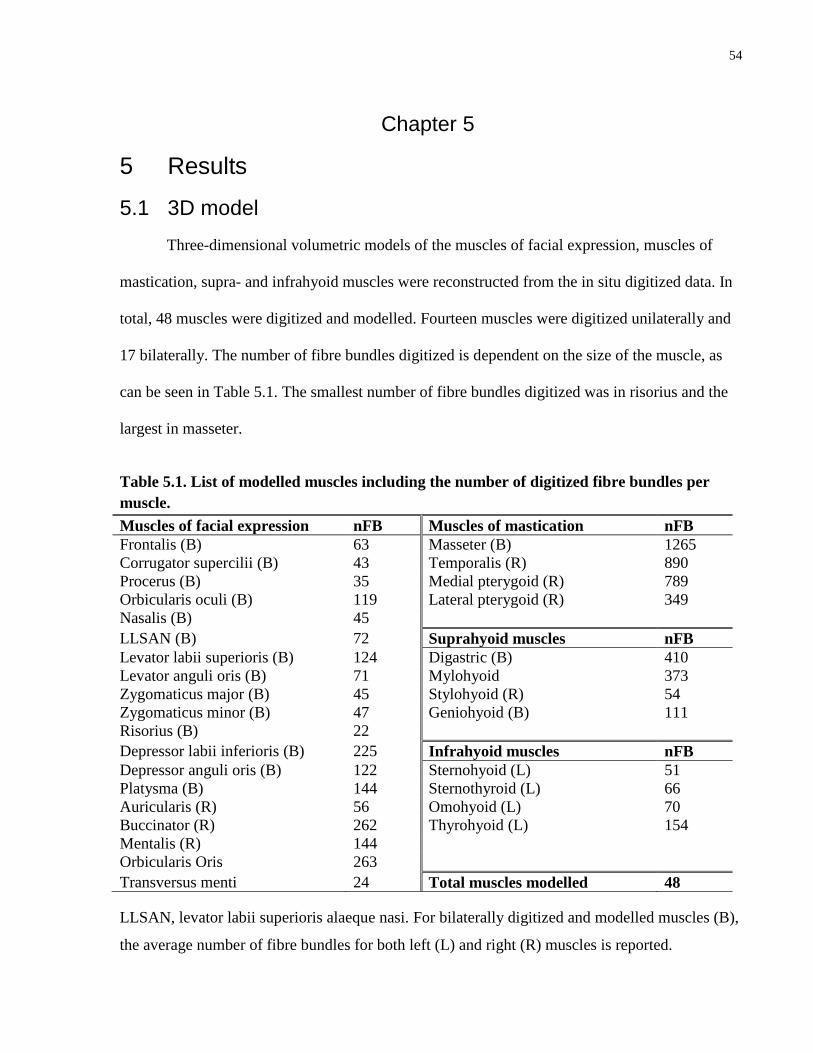
54
Chapter 5
5 Results
5.1 3D model
Three-dimensional volumetric models of the muscles of facial expression, muscles of
mastication, supra- and infrahyoid muscles were reconstructed from the in situ digitized data. In
total, 48 muscles were digitized and modelled. Fourteen muscles were digitized unilaterally and
17 bilaterally. The number of fibre bundles digitized is dependent on the size of the muscle, as
can be seen in Table 5.1. The smallest number of fibre bundles digitized was in risorius and the
largest in masseter.
Table 5.1. List of modelled muscles including the number of digitized fibre bundles per
muscle.
Muscles of facial expression nFB Muscles of mastication nFB
Frontalis (B) 63 Masseter (B) 1265
Corrugator supercilii (B) 43 Temporalis (R) 890
Procerus (B) 35 Medial pterygoid (R) 789
Orbicularis oculi (B) 119 Lateral pterygoid (R) 349
Nasalis (B) 45
LLSAN (B) 72 Suprahyoid muscles nFB
Levator labii superioris (B) 124 Digastric (B) 410
Levator anguli oris (B) 71 Mylohyoid 373
Zygomaticus major (B) 45 Stylohyoid (R) 54
Zygomaticus minor (B) 47 Geniohyoid (B) 111
Risorius (B) 22
Depressor labii inferioris (B) 225 Infrahyoid muscles nFB
Depressor anguli oris (B) 122 Sternohyoid (L) 51
Platysma (B) 144 Sternothyroid (L) 66
Auricularis (R) 56 Omohyoid (L) 70
Buccinator (R) 262 Thyrohyoid (L) 154
Mentalis (R) 144
Orbicularis Oris 263
Transversus menti 24 Total muscles modelled 48
LLSAN, levator labii superioris alaeque nasi. For bilaterally digitized and modelled muscles (B),
the average number of fibre bundles for both left (L) and right (R) muscles is reported.

55
The integrated model shows the relationships of the musculotendinous elements of the
muscle groups and their relative attachment sites to the underlying skeleton. In the anterior view,
the most superficial muscles, i.e., the muscles of facial expression, overlie the deeper muscles of
mastication and hyoid muscles (Figure 5.1).
Figure 5.1. Three-dimensional model of the digitized muscles, anterior view.

56
In the lateral view, the muscles of facial expression are not as numerous, permitting
visualization of some of the underlying muscles of mastication and supra- and infrahyoid
muscles (Figure 5.2).
Figure 5.2. Three-dimensional model of the digitized muscles, lateral view.

57
The 3D models are interactive and can be viewed as a composite or as individual muscle
components, i.e., from individual muscles to muscle groups to combinations of muscle groups.
5.1.1 3D models of muscle groups
The 3D models of the muscle groups (muscles of facial expression, muscles of
mastication, supra- and infrahyoid muscles) are presented in this section of the thesis. Within
each group, the spatial relationships and attachments of the muscles relative to one another can
be visualized.
5.1.1.1 Muscles of facial expression
Thirty-three muscles of facial expression are included in the 3D model (Figure 5.3).
Figure 5.3. Three-dimensional model of the muscles of facial expression, anterior and
lateral views. Individual muscles are colour-coded.
Anterior Lateral
58
When observing this model, the relationships between specific muscles in a group can be noted.
For example, some observations include (Figure 5.3):
The extent of interdigitation of the fibre bundles of frontalis (green), procerus (orange)
and orbicularis oculi (orange).
The zygomaticus minor (light green) fibre bundles lie adjacent and parallel to the inferior
fibre bundles of the orbital part of orbicularis oculi.
The asymmetry in the size and shape of the left and right muscles of facial expression,
i.e., platysma (blue), orbicularis oculi (brown), and levator/depressor anguli oris (purple
and magenta).
The extent of interdigitation of the fibre bundles of the oral musculature at the angle of
the mouth, i.e., orbicularis oris (aqua), buccinator, levator/depressor anguli oris, and
zygomaticus major.
5.1.2 Muscles of mastication
Various views of the 3D model of the muscles of mastication are shown in Figure 5.4.
The directions of the fibre bundles provide evidence of the functional similarities and differences
of these muscles. The relationship of the more superficially located masseter and temporalis
muscles is visualized in Figure 5.4 A to D. The deeply lying muscles of the infratemporal fossa,
the medial and lateral pterygoids, are modelled in Figure 5.4 E and F.

59
Figure 5.4. Three-dimensional model of the muscles of mastication, lateral and anterior
views. A and B. Muscles of mastication with the underlying skeletal elements. C-F. Muscles
of mastication without the underlying skeletal elements.

60
5.1.3 Suprahyoid muscles
The 3D model of the suprahyoid muscles is presented in Figure 5.5. From the 3D model,
the spatial relationships of the individual muscles and the skeletal elements can be visualized.
The extent of mylohyoid and the overlapping belly of the anterior digastric is evident in this
model, along with the location of the intermediate tendon of digastric piercing the belly of
stylohyoid laterally and emerging from its medial surface, just superior to the hyoid bone. Also,
the variable length of the fibre bundles of mylohyoid and their orientation are highlighted in
Figure 5.5 C.
Figure 5.5. Three-dimensional model of the suprahyoid muscles. A. Inferior view. B and C.
Lateral views.
Light green: Anterior digastric. Dark green: Posterior digastric.
Red: Mylohyoid. Blue: Stylohyoid. Orange: Geniohyoid.
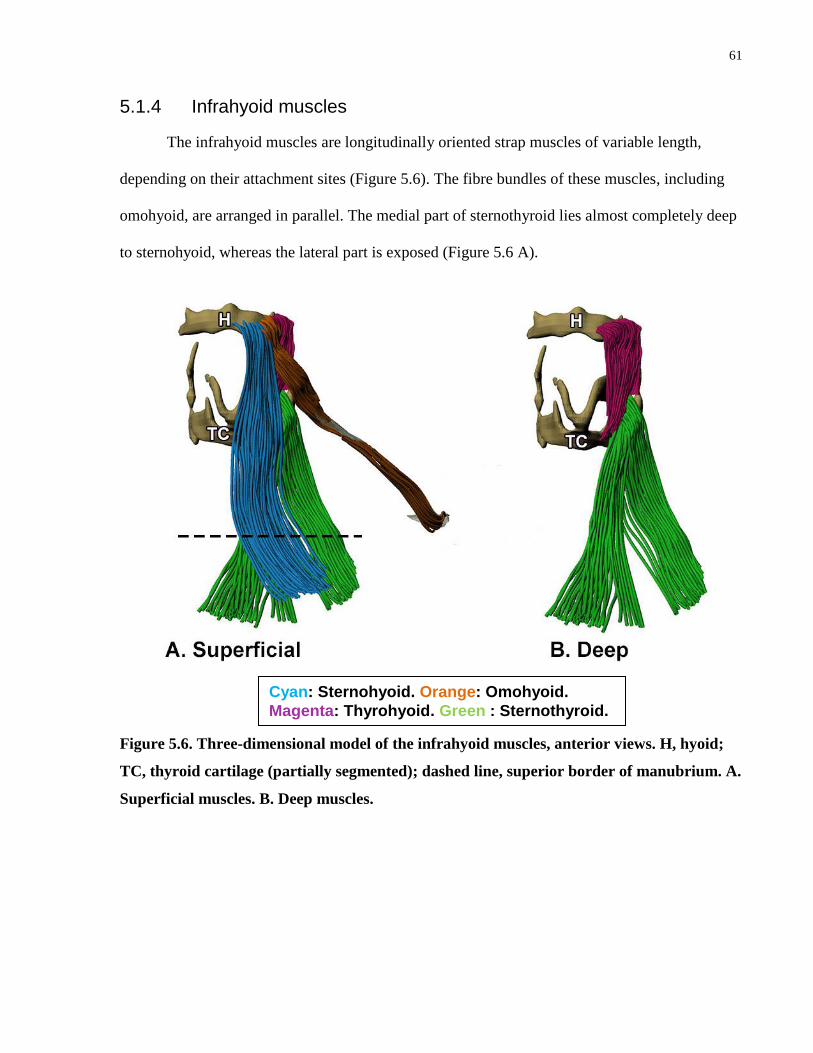
61
5.1.4 Infrahyoid muscles
The infrahyoid muscles are longitudinally oriented strap muscles of variable length,
depending on their attachment sites (Figure 5.6). The fibre bundles of these muscles, including
omohyoid, are arranged in parallel. The medial part of sternothyroid lies almost completely deep
to sternohyoid, whereas the lateral part is exposed (Figure 5.6 A).
Figure 5.6. Three-dimensional model of the infrahyoid muscles, anterior views. H, hyoid;
TC, thyroid cartilage (partially segmented); dashed line, superior border of manubrium. A.
Superficial muscles. B. Deep muscles.
Cyan: Sternohyoid. Orange: Omohyoid.
Magenta: Thyrohyoid. Green : Sternothyroid.

62
5.2 Muscle morphology and architecture
5.2.1 Muscles of facial expression
5.2.1.1 Muscles of the oral region
Orbicularis oris forms the core of the muscles that move the mouth and lips. This muscle
had distinct upper and lower parts, with some fibre bundles of the upper part overlapping the
lower part at the angle of the mouth (Figure 5.7).
Figure 5.7. Three-dimentional model of orbicularis oris, anterior views. A. Lower part. B.
Inferior fibre bundles of lower part. C. Deep fibre bundles of upper part. D. Superficial
fibre bundles of upper part.
The lower part mainly consisted of long arched fibre bundles, but the most inferior fibre bundles
were short and did not cross the midline. The upper part was divided into superficial and deep

63
fibre bundles. The deep fibre bundles were short and did not cross the midline, whereas the
superficial fibre bundles were long and lay superficial to the fibre bundles of the lower part
where they overlap at the angle of the mouth.
The fibre bundles of the other muscles of facial expression that move the mouth and lips,
including buccinator, depressor anguli oris and levator anguli oris interdigitated with the fibre
bundles of orbicularis oris (Figure 5.8). Buccinator is classically described as a “cheek” muscle,
but was found to have extensive interdigitations with the lower part of orbicularis oris (Figure
5.8 A and B), with the upper part of orbicularis oris only interdigitating with a small slip of
buccinator (Figure 5.8 C and D ). The remainder of the upper part of orbicularis oris lay
superficial to buccinator.
The fibre bundles of depressor anguli oris blended with the periosteum of the inferior
border of the mandible and continued to course superiorly along the lateral side of the nasolabial
fold to interdigitate with the upper part of orbicularis oris near the angle of the mouth (Figure 5.8
E and F). As the fibre bundles coursed superiorly, they lay superficial to buccinator. At the angle
of the mouth, the inferior part of levator anguli oris was interdigitated with depressor anguli oris,
forming a continuous band of muscle (Figure 5.8. G and H).
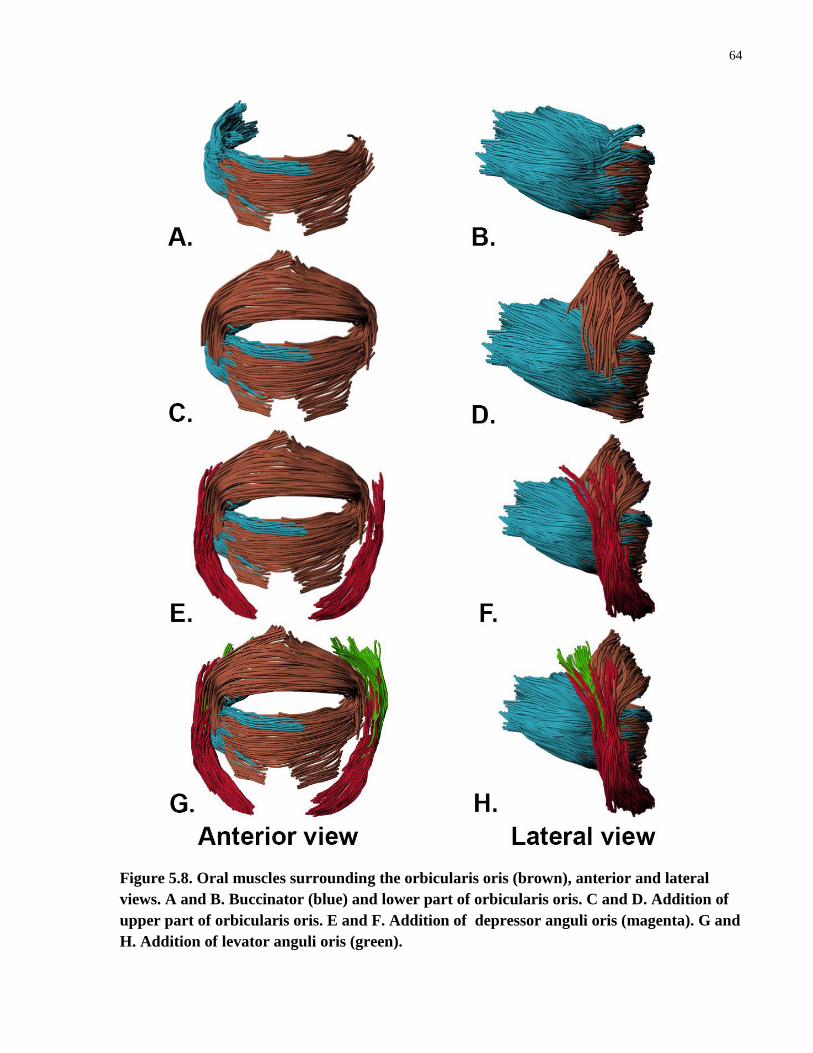
64
Figure 5.8. Oral muscles surrounding the orbicularis oris (brown), anterior and lateral
views. A and B. Buccinator (blue) and lower part of orbicularis oris. C and D. Addition of
upper part of orbicularis oris. E and F. Addition of depressor anguli oris (magenta). G and
H. Addition of levator anguli oris (green).

65
Zygomaticus major and minor did not interdigitate with orbicularis oris, but blended to
orbicularis oris via connective tissue. This connective tissue spanned from the medial margin of
zygomaticus major and the inferior fibre bundles of zygomaticus minor to the angle of the
mouth. The superior fibre bundles of zygomaticus minor attached adjacent to the ala of the nose
(Figure 5.9).
Figure 5.9. Three-dimensional model of zygomaticus major and minor in relation to
orbicularis oris, anterior view.
The architectural parameters of the muscles of the oral region are summarized in Table
5.2.
Zygomaticus major
Zygomaticus minor

66
Table 5.2. Architectural parameters of the muscles of the oral region
Muscle FBL (mm) PA (°)
Orbicularis oris
Superficial fibres of upper part 114.1 ± 9.8 X
Superior fibres of lower part 83.0 ± 17.3 X
Deep fibres of upper part (L) 35.5 ± 14.0 X
Deep fibres of upper part (R) 44.1 ± 6.2 X
Inferior fibres of lower part (L) 30.1 ± 4.3 X
Inferior fibres of lower part (R) 37.6 ± 10.7 X
Buccinator (R) 40.7 ± 13.5 26.9 ± 14.1
Depressor anguli oris (L) 40.6 ± 7.1 13.3 ± 8.0
Depressor anguli oris (R) 41.5 ± 13.1 19.8 ± 12.1
Levator anguli oris (L) 48.5 ± 10.2 13.0 ± 8.8
Levator anguli oris (R) 54.1 ± 16.1 23.4 ± 8.1
L, left; R, right; X. not quantified.
The mean FBL of the superficial upper and superior lower parts of orbicularis oris were
longer than those of the deep upper and inferior lower parts, respectively (Table 5.2). Buccinator
had a greater PA than both levator and depressor anguli oris. When comparing levator and
depressor anguli oris, levator anguli oris was found to have a greater mean FBL. The right and
left levator anguli oris and depressor anguli oris had similar PAs, with the right greater than the
left.
5.2.1.2 Muscles of the nasal region
Nasalis, the deeper of two primary nasal muscles, lay on the lateral aspect of the bony and
cartilaginous components of the nose (Figure 5.10). This muscle was found to be triangular in
shape and had a small inferior attachment to the maxilla adjacent to the inferolateral part of the
nasal notch. From its distal attachment, the fibre bundles diverged into three main parts attaching
to connective tissue overlying the greater alar cartilage, lateral nasal cartilage and nasal bone
(Figure 5.10 A).

67
Figure 5.10. Three-dimensional model of the muscles of the nasal region. A. Nasalis,
anterior and lateral views. B. Alar part of levator labii superioris alaeque nasi (LLSAN),
anterior and lateral views. C. Labial part of LLSAN, anterior and lateral views
Levator labii superioris alaeque nasi (LLSAN) was superficial to nasalis and was found to
consist of two parts, alar and labial. Superiorly, both parts attached to the superior frontal process
of the maxilla (Figure 5.10 B and C). Inferiorly, the alar part extended to the fibro-fatty tissue of
the ala of the nose, and the labial part to the fascia of the superolateral portion of the upper lip.
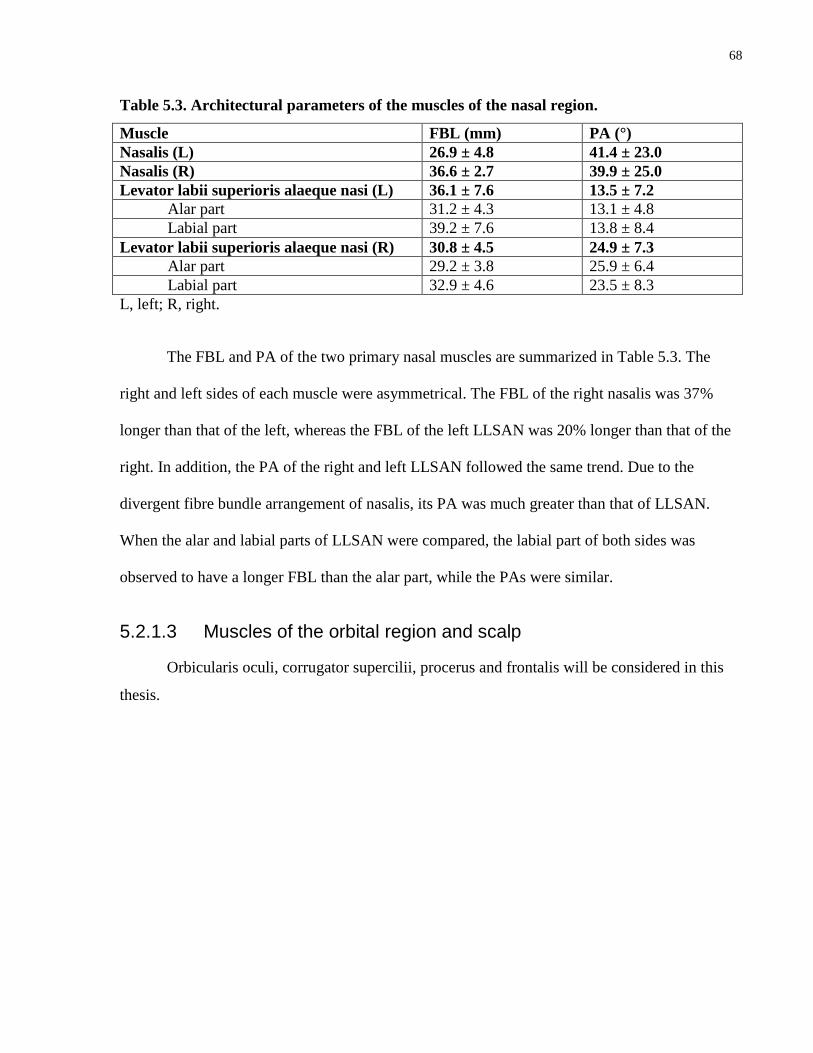
68
Table 5.3. Architectural parameters of the muscles of the nasal region.
Muscle FBL (mm) PA (°)
Nasalis (L) 26.9 ± 4.8 41.4 ± 23.0
Nasalis (R) 36.6 ± 2.7 39.9 ± 25.0
Levator labii superioris alaeque nasi (L) 36.1 ± 7.6 13.5 ± 7.2
Alar part 31.2 ± 4.3 13.1 ± 4.8
Labial part 39.2 ± 7.6 13.8 ± 8.4
Levator labii superioris alaeque nasi (R) 30.8 ± 4.5 24.9 ± 7.3
Alar part 29.2 ± 3.8 25.9 ± 6.4
Labial part 32.9 ± 4.6 23.5 ± 8.3
L, left; R, right.
The FBL and PA of the two primary nasal muscles are summarized in Table 5.3. The
right and left sides of each muscle were asymmetrical. The FBL of the right nasalis was 37%
longer than that of the left, whereas the FBL of the left LLSAN was 20% longer than that of the
right. In addition, the PA of the right and left LLSAN followed the same trend. Due to the
divergent fibre bundle arrangement of nasalis, its PA was much greater than that of LLSAN.
When the alar and labial parts of LLSAN were compared, the labial part of both sides was
observed to have a longer FBL than the alar part, while the PAs were similar.
5.2.1.3 Muscles of the orbital region and scalp
Orbicularis oculi, corrugator supercilii, procerus and frontalis will be considered in this
thesis.
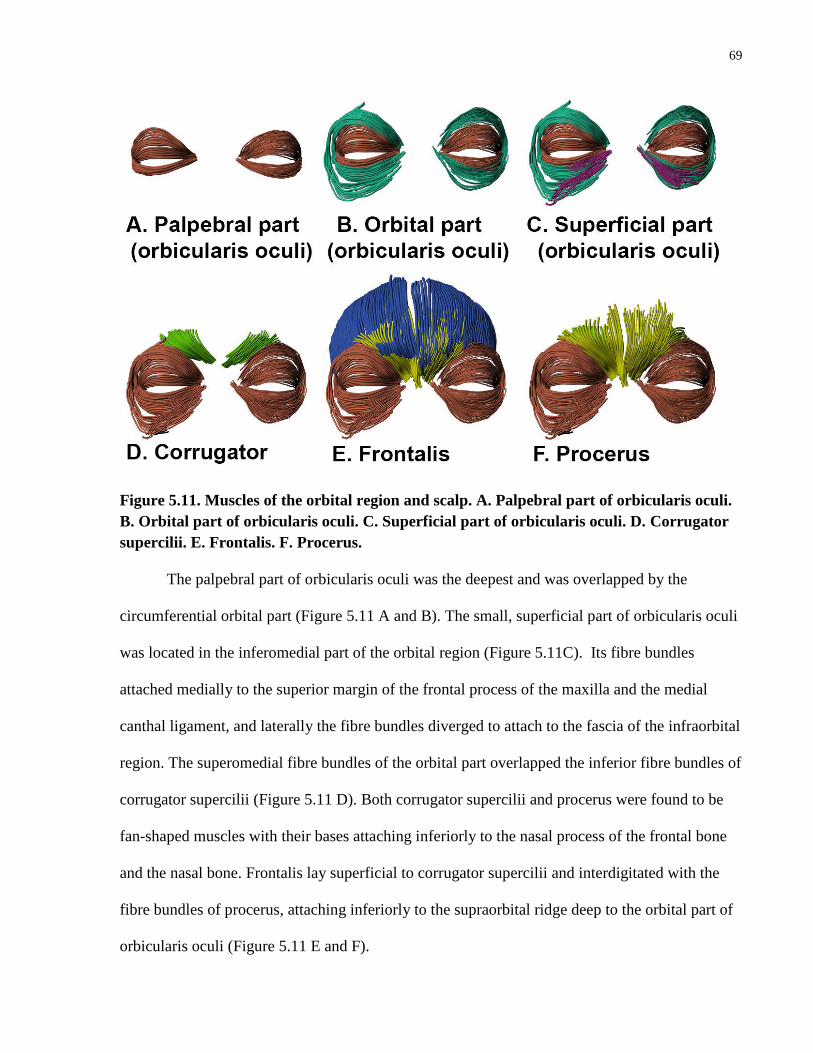
69
Figure 5.11. Muscles of the orbital region and scalp. A. Palpebral part of orbicularis oculi.
B. Orbital part of orbicularis oculi. C. Superficial part of orbicularis oculi. D. Corrugator
supercilii. E. Frontalis. F. Procerus.
The palpebral part of orbicularis oculi was the deepest and was overlapped by the
circumferential orbital part (Figure 5.11 A and B). The small, superficial part of orbicularis oculi
was located in the inferomedial part of the orbital region (Figure 5.11C). Its fibre bundles
attached medially to the superior margin of the frontal process of the maxilla and the medial
canthal ligament, and laterally the fibre bundles diverged to attach to the fascia of the infraorbital
region. The superomedial fibre bundles of the orbital part overlapped the inferior fibre bundles of
corrugator supercilii (Figure 5.11 D). Both corrugator supercilii and procerus were found to be
fan-shaped muscles with their bases attaching inferiorly to the nasal process of the frontal bone
and the nasal bone. Frontalis lay superficial to corrugator supercilii and interdigitated with the
fibre bundles of procerus, attaching inferiorly to the supraorbital ridge deep to the orbital part of
orbicularis oculi (Figure 5.11 E and F).

70
Table 5.4. Architectural parameters of the muscles of orbital region and scalp
Muscle FBL (mm) PA (°)
Orbicularis oculi (L)
Superficial 32.7 ± 7.2 X
Orbital part 112.0 ± 29.9 X
Palpebral part 54.2 ± 10.4 X
Orbicularis oculi (R)
Superficial 39.4 ± 9.6 X
Orbital part 86.9 ± 35.9 X
Palpebral part 65.6 ± 35.6 X
Frontalis (L) 73.2 ± 7.6 13.1 ± 8.1
Frontalis (R) 67.6 ± 7.1 15.6 ± 9.6
Corrugator supercilii (L) 30.1 ± 5.7 9.1 ± 4.9
Corrugator supercilii (R) 30.5 ± 5.1 10.0 ± 5.4
Procerus (L) 51.2 ± 6.7 22.3 ± 14.7
Procerus (R) 43.6 ± 10.2 18.1 ± 10.9
X, not quantified.
The architecture of orbicularis oculi is complex, with the orbital part having the longest
mean FBL and the superficial part the shortest. In addition, due to its sphincter morphology, the
orbital part of orbicularis oculi also had the longest FBL of all the muscles of the orbital and
scalp regions. Corrugator supercilii had on average shorter fibre bundles and a smaller PA than
procerus (Table 5.4). The FBL of procerus was on average about 20mm shorter than that of
frontalis. Asymmetry between the left and right sides was also found. For example, the mean
FBL of the left orbital part of orbicularis oculi was about 30% longer than the right; however,
both the superficial and palpebral parts of the right orbicularis oculi were found to be about 21%
longer than their counterparts on the left.
5.2.2 Muscles of mastication
5.2.2.1 Temporalis
The temporalis muscle was divided into two distinct parts, superficial and deep, based on
the areas of attachment and architecture (Figure 5.12).
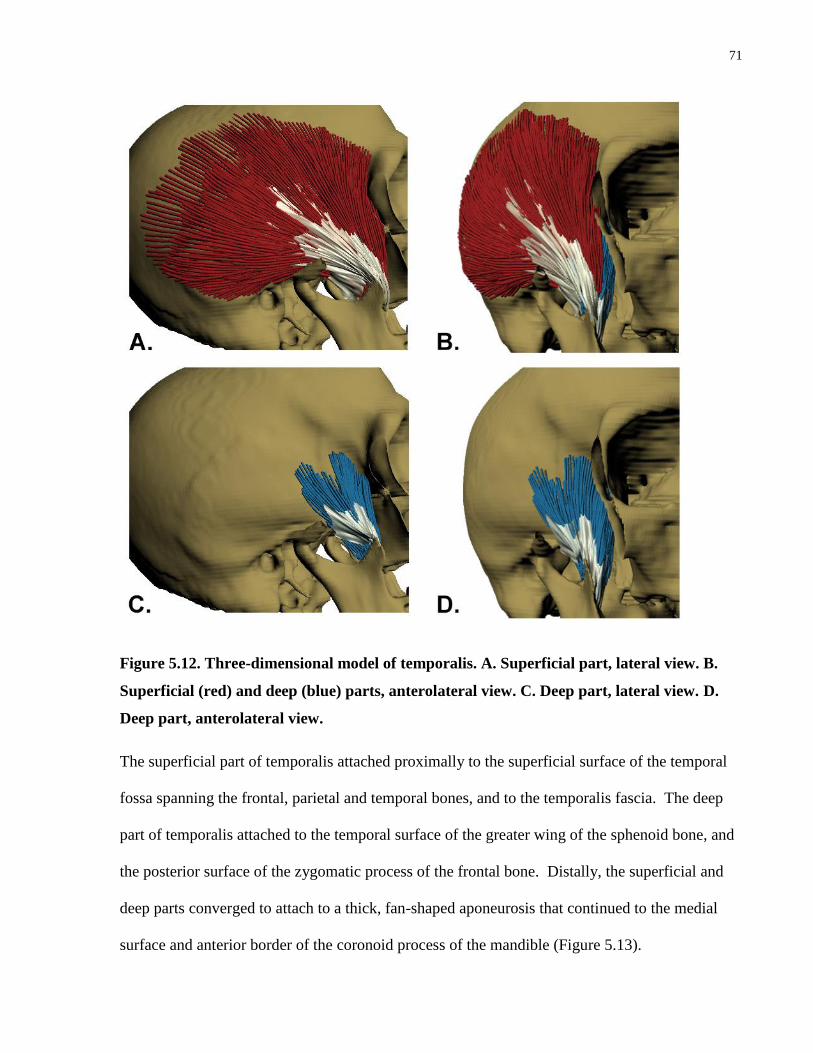
71
Figure 5.12. Three-dimensional model of temporalis. A. Superficial part, lateral view. B.
Superficial (red) and deep (blue) parts, anterolateral view. C. Deep part, lateral view. D.
Deep part, anterolateral view.
The superficial part of temporalis attached proximally to the superficial surface of the temporal
fossa spanning the frontal, parietal and temporal bones, and to the temporalis fascia. The deep
part of temporalis attached to the temporal surface of the greater wing of the sphenoid bone, and
the posterior surface of the zygomatic process of the frontal bone. Distally, the superficial and
deep parts converged to attach to a thick, fan-shaped aponeurosis that continued to the medial
surface and anterior border of the coronoid process of the mandible (Figure 5.13).

72
Figure 5.13. Three-dimensional model of the aponeurosis of temporalis. A. Lateral view. B.
Anterolateral view. The zygomatic arch has been removed.
When considering the architecture of the superficial and deep parts of temporalis, the
FBL of the superficial part was 24% longer than that of the deep part, and the MV of the
superficial part was about 83% larger (Table 5.3).
Table 5.5. Architectural parameters of temporalis and its parts.
Temporalis FBL (mm) SL (μm) PA (˚) PCSA (cm2) MV (cm
3)
Whole muscle 33.1 ± 7.74 1.6 ± 0.2 26.3 ± 15.5 7.7 30.6
Superficial part 35.6 ± 8.3 1.6 ± 0.2 27.5 ± 17.2 4.4 19.8
Deep part 28.7 ± 3.5 1.7 ± 0.1 24.3 ± 11.2 3.4 10.8
It is of interest to note that the MV of the superficial part of temporalis was approximately
double that of the deep part, but the PCSA of the superficial part was only 23% greater than that
of the deep part.
Based on computation of the principal fibre bundle orientations in the superficial and
deep parts of temporalis, it was determined that the superficial part had four principal fibre

73
bundle orientations and the deep part had two (Figure 5.14). Principal fibre bundle orientation
can be used to determine the direction of force generation (line of action) of each of the sub-
volumes of a muscle in comparison to the line of action of the entire muscle.
Figure 5.14. Principal fibre bundle orientations (lines of action) of the superficial and deep
parts of temporalis, lateral views. A. Superficial part. B. Deep part. Yellow arrows,
principal fibre bundle orientations of the superficial and deep parts; black arrow, line of
action of entire muscle.
As seen in Figure 5.14, the line of action of each of the sub-volumes changed direction
from anterior to posterior. In the anterior sub-volumes of the superficial part of temporalis, the
line of action was directed superiorly, whereas it was directed posteriorly in the posterior sub-
volumes, providing evidence of functional differences between the sub-volumes. The line of
action in the anterior sub-volume of the deep part of temporalis was directed superiorly, and that
of the posterior sub-volume was directed superoposteriorly.
The sarcomere length of temporalis was measured from 13 locations throughout the
muscle volume. The mean sarcomere length of the superficial and deep parts of temporalis was
found to be similar: 1.6 ± 0.2μm and 1.7 ± 0.1μm, respectively (Table 5.5). However, when

74
sarcomere length was graphed to the location of the biopsy sites from anterior to posterior, the
posteriorly located muscle fibres tended to have a shorter sarcomere length than the more
anterior fibres (Figure 5.15).
Figure 5.15. Sarcomere length variation within the volume of temporalis.
5.2.2.2 Masseter
Masseter was found to be a quadrangular muscle located on the lateral surface of the
mandible (Figure 5.16). It consisted of superficial and deep heads that were further subdivided
into laminae.

75
Figure 5.16. Three-dimensional model of masseter. A. Lateral view. B. Anterior view. S,
superficial head; D, deep head.
The left and right masseter muscles were each found to contain 8 laminae numbered from
superficial to deep (Figure 5.17). The superficial head consisted of the first four laminae, and the
deep head consisted of the last four laminae.
S
D
S

76
Figure 5.17. Laminae of masseter. A. Laminae (1-4) of the superficial head. B. Laminae (5-
8) of the deep head.
The fibre bundles of each of the laminae attached to alternating sheets of superior and
inferior aponeuroses or directly to bone. There were four superior aponeuroses and four to five
inferior aponeuroses. The locations of fibre bundle attachments in each of the laminae are
summarized in Table 5.6 and also visually represented in Figures 5.18 and 19.

77
Table 5.6. Summary of fibre bundle attachment sites in each lamina (1-8) of masseter.
Lamina Superior attachment Inferior attachment
Superficial head
1 Via aponeurosis attaching to
zygomatic process of maxilla (Figure
5.18 A)
Bone: inferior border of ramus of
mandible (Figure 5.18 C)
2 Via aponeurosis attaching to
zygomatic process of maxilla (Figure
5.18 A)
Via aponeurosis attaching to angle and
inferior border of ramus of mandible
(Figure 5.18 C)
3 Via aponeurosis attaching to anterior
1/3 of zygomatic arch (Figure 5.18 B)
Attach to angle and inferior border of
ramus of mandible directly or via
aponeurosis (Figure 5.18 C).
4 Via aponeurosis attaching to middle
1/3 of zygomatic arch (Figure 5.18 D)
Attach to posterior border of ramus of
mandible directly or via aponeurosis
(Figure 5.18 E)
Deep head
5 Superficial surface of deep
aponeurosis attaching to middle 1/3 of
zygomatic arch (Figure 5.19 A)
Via aponeurosis attaching to ramus of
mandible centrally (Figure 5.19 B)
6 Superficial surface of deep
aponeurosis attaching to posterior 1/3
of zygomatic arch (Figure 5.19 A)
Via aponeurosis attaching to superior
part of ramus of mandible (Figure 5.19
C)
7 Deep surface of deep aponeurosis
attaching to posterior 2/3 of zygomatic
arch (Figure 5.19 A)
Via aponeurosis attaching to coronoid
process of mandible (Figure 5.19 C)
8 Bone: mandibular notch Bone: posterior surface of zygomatic
notch

78
Figure 5.18. Aponeurotic attachment sites of laminae (1-4) of the superficial head of
masseter. A. Superior attachments of laminae 1 and 2. B. Superior attachment of lamina 3.
C. Superior attachment of lamina 4. D. Inferior attachments of laminae 1, 2 and 3. E.
Inferior attachment of lamina 4. Blue, must superficial aponeurosis of each of the images.
Dotted outline

79
Figure. 5.19. Aponeurotic attachment sites of laminae (5-8) of the deep head of masseter.
A. Superior attachments of laminae 5, 6 and 7. B. Inferior attachment of lamina 5. C.
Inferior attachments of laminae 6 and 7.
The architectural parameters of masseter were quantified for the muscle as a whole, the
superficial and deep heads, and individual laminae (Figure 5.20 and Table 5.7).
Figure 5.20. Architectural parameters of the superficial and deep heads of masseter. The
mean FBL and PA and total PCSA and MV of the superficial and deep heads are indicated
above each bar.
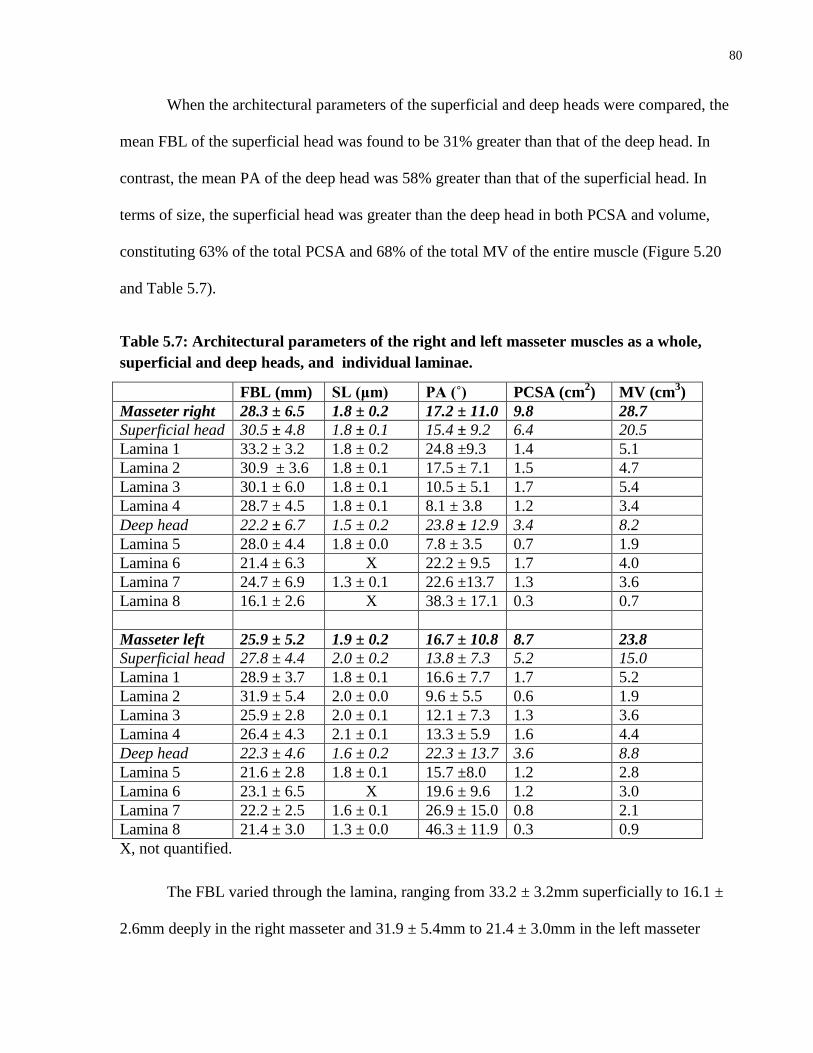
80
When the architectural parameters of the superficial and deep heads were compared, the
mean FBL of the superficial head was found to be 31% greater than that of the deep head. In
contrast, the mean PA of the deep head was 58% greater than that of the superficial head. In
terms of size, the superficial head was greater than the deep head in both PCSA and volume,
constituting 63% of the total PCSA and 68% of the total MV of the entire muscle (Figure 5.20
and Table 5.7).
Table 5.7: Architectural parameters of the right and left masseter muscles as a whole,
superficial and deep heads, and individual laminae.
FBL (mm) SL (μm) PA (˚) PCSA (cm2) MV (cm
3)
Masseter right 28.3 ± 6.5 1.8 ± 0.2 17.2 ± 11.0 9.8 28.7
Superficial head 30.5 ± 4.8 1.8 ± 0.1 15.4 ± 9.2 6.4 20.5
Lamina 1 33.2 ± 3.2 1.8 ± 0.2 24.8 ±9.3 1.4 5.1
Lamina 2 30.9 ± 3.6 1.8 ± 0.1 17.5 ± 7.1 1.5 4.7
Lamina 3 30.1 ± 6.0 1.8 ± 0.1 10.5 ± 5.1 1.7 5.4
Lamina 4 28.7 ± 4.5 1.8 ± 0.1 8.1 ± 3.8 1.2 3.4
Deep head 22.2 ± 6.7 1.5 ± 0.2 23.8 ± 12.9 3.4 8.2
Lamina 5 28.0 ± 4.4 1.8 ± 0.0 7.8 ± 3.5 0.7 1.9
Lamina 6 21.4 ± 6.3 X 22.2 ± 9.5 1.7 4.0
Lamina 7 24.7 ± 6.9 1.3 ± 0.1 22.6 ±13.7 1.3 3.6
Lamina 8 16.1 ± 2.6 X 38.3 ± 17.1 0.3 0.7
Masseter left 25.9 ± 5.2 1.9 ± 0.2 16.7 ± 10.8 8.7 23.8
Superficial head 27.8 ± 4.4 2.0 ± 0.2 13.8 ± 7.3 5.2 15.0
Lamina 1 28.9 ± 3.7 1.8 ± 0.1 16.6 ± 7.7 1.7 5.2
Lamina 2 31.9 ± 5.4 2.0 ± 0.0 9.6 ± 5.5 0.6 1.9
Lamina 3 25.9 ± 2.8 2.0 ± 0.1 12.1 ± 7.3 1.3 3.6
Lamina 4 26.4 ± 4.3 2.1 ± 0.1 13.3 ± 5.9 1.6 4.4
Deep head 22.3 ± 4.6 1.6 ± 0.2 22.3 ± 13.7 3.6 8.8
Lamina 5 21.6 ± 2.8 1.8 ± 0.1 15.7 ±8.0 1.2 2.8
Lamina 6 23.1 ± 6.5 X 19.6 ± 9.6 1.2 3.0
Lamina 7 22.2 ± 2.5 1.6 ± 0.1 26.9 ± 15.0 0.8 2.1
Lamina 8 21.4 ± 3.0 1.3 ± 0.0 46.3 ± 11.9 0.3 0.9
X, not quantified.
The FBL varied through the lamina, ranging from 33.2 ± 3.2mm superficially to 16.1 ±
2.6mm deeply in the right masseter and 31.9 ± 5.4mm to 21.4 ± 3.0mm in the left masseter

81
(Table 5.7). The longest average FBL was found in laminae 1 and 2, and the shortest in lamina 8
(Figure 5.21).
Figure 5.21. Mean FBL of individual laminae of right masseter.
The PA was found to decrease from lamina 1 to 4 in the superficial head, and then
increase from lamina 5 to 8 in the deep head (Figure 5.22 and Table 5.7). Laminae 3 and 4 had
the smallest PA and lamina 8 had the largest.
Figure 5.22. Mean PA of individual laminae of right masseter.

82
No pattern was observed for individual laminae when considering PCSA and MV, but as
mentioned above, at the level of the superficial and deep heads, considerable differences were
noted, with the superficial head having a greater MV and PCSA than the deep head.
The principal fibre bundle orientations (lines of action) differed in the anterior and
posterior parts of the superficial and deep heads of masseter (Figure 5.23). The line of action of
the anterior part of the superficial head was directed anterosuperiorly in the sagittal plane and
superolaterally in the coronal plane; that of the posterior part of the superficial head was directed
superiorly in the sagittal plane and superolaterally in the coronal plane; and in the deep head,
superoposteriorly and superolaterally, respectively.
Figure 5.23. Principal fibre bundle orientations (lines of action) of the superficial and deep
heads of masseter. A. Lateral view. B. Anterior view. Red fibre bundles, anterior part of
superficial head; blue fibre bundles, posterior part of superficial head; green fibre bundles,
deep head; yellow arrows, principal fibre bundle orientations of the superficial and deep
heads; black arrow, line of action of entire muscle.
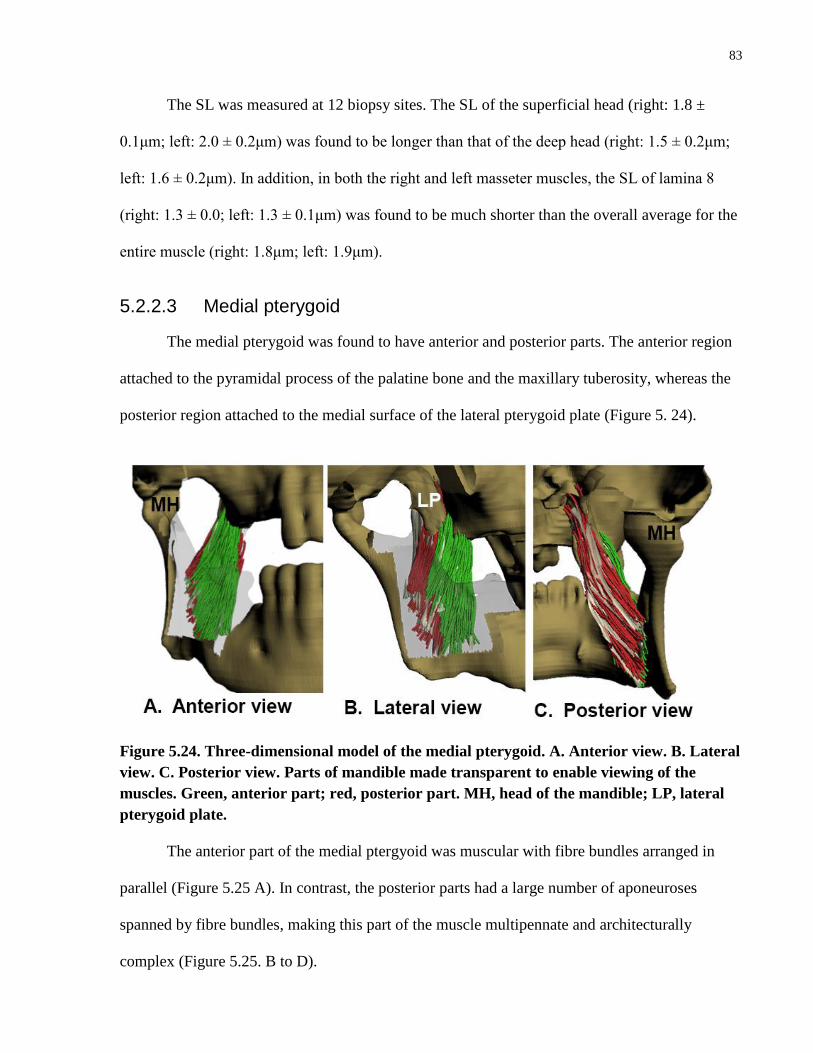
83
The SL was measured at 12 biopsy sites. The SL of the superficial head (right: 1.8 ±
0.1μm; left: 2.0 ± 0.2μm) was found to be longer than that of the deep head (right: 1.5 ± 0.2μm;
left: 1.6 ± 0.2μm). In addition, in both the right and left masseter muscles, the SL of lamina 8
(right: 1.3 ± 0.0; left: 1.3 ± 0.1μm) was found to be much shorter than the overall average for the
entire muscle (right: 1.8μm; left: 1.9μm).
5.2.2.3 Medial pterygoid
The medial pterygoid was found to have anterior and posterior parts. The anterior region
attached to the pyramidal process of the palatine bone and the maxillary tuberosity, whereas the
posterior region attached to the medial surface of the lateral pterygoid plate (Figure 5. 24).
Figure 5.24. Three-dimensional model of the medial pterygoid. A. Anterior view. B. Lateral
view. C. Posterior view. Parts of mandible made transparent to enable viewing of the
muscles. Green, anterior part; red, posterior part. MH, head of the mandible; LP, lateral
pterygoid plate.
The anterior part of the medial ptergyoid was muscular with fibre bundles arranged in
parallel (Figure 5.25 A). In contrast, the posterior parts had a large number of aponeuroses
spanned by fibre bundles, making this part of the muscle multipennate and architecturally
complex (Figure 5.25. B to D).

84
Figure 5.25. Three-dimensional model of the medial pterygoid. A. Anterior (green) and
posterior (red) regions, lateral view. B. Posterior region, lateral view. C. Internal
aponeuroses, lateral view. D. Internal aponeuroses, anterior view. LP, lateral pterygoid
plate.
The posterior part was larger than the anterior part, but their FBL, SL and PA were similar
(Table 5.8). Interestingly, the MV of the posterior part was found to be 55% larger than that of
the anterior part, but the PCSA of the posterior part was 78% larger than that of the anterior part.
Table 5.8. Architectural parameters of the medial pterygoid.
Medial
pterygoid
FBL (mm) SL (μm) PA (˚) PCSA (cm2) MV (cm
3)
Whole muscle 20.5 ± 4.5 2.1 ± 0.2 11.1 ± 6.4 5.0 10.6
Anterior part 21.6 ± 3.6 2.0 ± 0.1 12.6 ± 6.9 1.8 4.2
Posterior part 20.0 ± 4.8 2.1 ± 0.2 10.3 ± 6.1 3.2 6.5
In addition, the principal orientations of the fibre bundles of the anterior and posterior
parts, i.e., lines of action, were relatively similar. Both were oriented superiorly in the sagittal
plane and superomedially in the coronal plane (Figure 5.26).

85
Figure 5.26. Principal fibre bundle orientations (lines of action) of the anterior and
posterior parts of the medial pterygoid. A. Lateral view. B. Anterior view. Green fibre
bundles, anterior part; red fibre bundles, posterior part; yellow arrows, principal fibre
bundle orientations of the anterior and posterior parts; black arrow, line of action of entire
muscle.
5.2.2.4 Lateral pterygoid
The lateral pterygoid was divided into superior and inferior heads based on its attachment
sites, as well as its fibre bundle orientations (Figure 5.27). Proximally, the superior head attached
to the infratemporal crest of the greater wing of the sphenoid bone and the inferior head attached
to the lateral surface of the lateral pterygoid plate. Distally, both the superior and inferior heads
attached to the medial part of the head (condyloid process) of the mandible. In addition, some
fibre bundles of the superior head inserted onto the capsule of the temporomandibular joint.
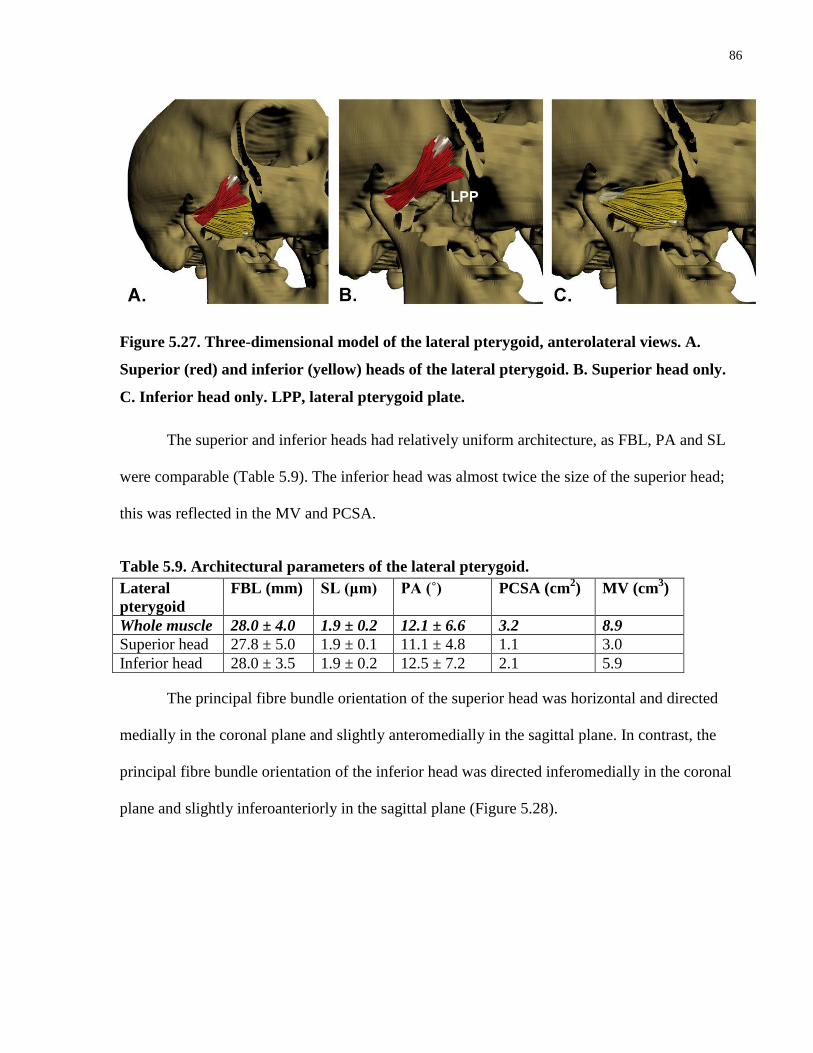
86
Figure 5.27. Three-dimensional model of the lateral pterygoid, anterolateral views. A.
Superior (red) and inferior (yellow) heads of the lateral pterygoid. B. Superior head only.
C. Inferior head only. LPP, lateral pterygoid plate.
The superior and inferior heads had relatively uniform architecture, as FBL, PA and SL
were comparable (Table 5.9). The inferior head was almost twice the size of the superior head;
this was reflected in the MV and PCSA.
Table 5.9. Architectural parameters of the lateral pterygoid.
Lateral
pterygoid
FBL (mm) SL (μm) PA (˚) PCSA (cm2) MV (cm
3)
Whole muscle 28.0 ± 4.0 1.9 ± 0.2 12.1 ± 6.6 3.2 8.9
Superior head 27.8 ± 5.0 1.9 ± 0.1 11.1 ± 4.8 1.1 3.0
Inferior head 28.0 ± 3.5 1.9 ± 0.2 12.5 ± 7.2 2.1 5.9
The principal fibre bundle orientation of the superior head was horizontal and directed
medially in the coronal plane and slightly anteromedially in the sagittal plane. In contrast, the
principal fibre bundle orientation of the inferior head was directed inferomedially in the coronal
plane and slightly inferoanteriorly in the sagittal plane (Figure 5.28).

87
Figure 5.28. Principal fibre bundle orientations (lines of action) of the superior and inferior
heads of the lateral pterygoid. A. Lateral view. B. Anterior view. Red fibre bundles,
superior head; yellow fibre bundles, inferior head; yellow arrows, principal fibre bundle
orientations of the superior and inferior heads; black arrow, line of action of entire muscle.
5.2.2.5 Architectural summary of muscles of mastication
The architectural parameters of each of the muscles of mastication and their component
parts are summarized in Table 5.10 and compared below.
Table 5.10. Summary of mean architectural parameters of muscles of mastication.
Muscle FBL (mm) SL (μm) PA (˚) PCSA
(cm2)
MV
(cm3)
Force
index
Temporalis 33.1 ± 7.74 1.6 ± 0.2 26.3 ± 15.5 7.7 30.6 0.79
Superficial 35.6 ± 8.3 1.6 ± 0.2 27.5 ± 17.2 4.4 19.8 0.60
Deep 28.7 ± 3.5 1.7 ± 0.1 24.3 ± 11.2 3.4 10.8 0.70
Masseter right 28.3 ± 6.5 1.8 ± 0.2 17.2 ± 11.0 9.8 28.7 1.05
Superficial 30.5 ± 4.8 1.8 ± 0.1 15.4 ± 9.2 6.4 20.5 0.85
Deep 22.2 ± 6.7 1.5 ± 0.2 23.8 ± 12.9 3.4 8.2 0.84
Masseter left 25.9 ± 5.2 1.9 ± 0.2 16.7 ± 10.8 8.7 23.8 1.05
Superficial 27.8 ± 4.4 2.0 ± 0.2 13.8 ± 7.3 5.2 15.0 0.85
Deep 22.3 ± 4.6 1.6 ± 0.2 22.3 ± 13.7 3.6 8.8 0.84
Medial pterygoid 20.5 ± 4.5 2.1 ± 0.2 10.0 ± 5.9 4.9 10.7 1.04
Anterior 21.6 ± 3.6 2.0 ± 0.1 12.6 ± 6.9 1.8 4.2 0.69
Posterior 20.0 ± 4.8 2.1 ± 0.2 10.3 ± 6.1 3.2 6.5 0.92
Lateral pterygoid 28.0 ± 4.0 1.9 ± 0.2 12.1 ± 6.6 3.2 8.9 0.75
Superior 27.8 ± 5.0 1.9 ± 0.1 11.1 ± 4.8 1.1 3.0 0.53
Inferior 28.0 ± 3.5 1.9 ± 0.2 12.5 ± 7.2 2.1 5.9 0.64

88
When the FBLs of all of the muscles of mastication were compared, the temporalis was
found to have the longest FBL (33.1 ± 7.74mm), and the medial pterygoid the shortest (20.5 ±
4.5mm). Fibre bundle length decreased from the superficial to deep parts/heads of temporalis and
masseter, e.g., the deep head of masseter was on average 5-8mm shorter than the superficial
head. The medial and lateral pterygoids had a consistent FBL throughout their volumes.
Sarcomere length was generally found to range from 1.8 to 2.1 μm, except in temporalis and the
deep head of masseter, which were found to have the shortest SL, ranging from 1.5 to 1.7 μm.
Pennation angle varied between the muscles, with the medial pterygoid having the
smallest mean PA (10.0 ± 5.9°), and temporalis the largest (26.3 ± 15.5°). The deep part of
temporalis had a smaller mean PA than the superficial part, but interestingly, in masseter, the
PA increased almost 10° from superficial to deep. The medial and lateral pterygoids had the
smallest mean PAs, which were consistent throughout each part of the muscle.
The force index, which is a normalization of PCSA to MV, quantifies a muscle’s relative
force-generating capabilities. The left and right masseters and the medial pterygoid were found
to have the largest force indices (1.05 and 1.04, respectively). The medial pterygoid, although a
small muscle by volume, had a large force index due to the high ratio between its PCSA and
MV. In contrast, temporalis and the lateral pterygoid had much smaller force indices (0.79 and
0.75, respectively), suggesting a tendency towards excursion. Although temporalis had the
largest MV and a relatively large PCSA compared to the other muscles of mastication, the ratio
between its PCSA and MV was smaller, thus yielding a smaller force index. Despite the
differences between the MVs of the left and right masseters, their force indices were the same.
Similarities in the principal fibre bundle orientations of the parts of the muscles of
mastication were identified, providing evidence for potential functional synergies. For example,
the deep head of the masseter and the anterior sub-volumes of the superficial and deep parts of

89
temporalis were observed to have similar principal fibre bundle orientations, which were directed
superiorly with a slight posterior deviation (Figure 5.29 A to C). In addition, the superficial head
of masseter and the medial pterygoid had similar principal fibre bundle orientations in the
sagittal plane. However, in the coronal plane, the fibre bundles of the superficial head of
masseter were directed superolaterally, whereas in the medial ptergyoid, they were directed
superomedially (Figure 5.29 D to G).
Figure 5.29. Similarities in principal fibre bundle orientations of the parts of the muscles of
mastication, lateral and anterior views. A to C. Superficial and deep parts of temporalis
and deep head of masseter, later view. AST, anterior sub-volumes of superficial part of
temporalis. D to G. Superficial head of masseter and the medial pterygoid. Yellow arrows,
principal fibre bundle orientations of the parts of the muscles.

90
5.2.3 Suprahyoid muscles
5.2.3.1 Digastric
The digastric muscle was found to consist of two bellies connected by a cord-like
intermediate tendon, which attached to the hyoid bone via the trochlea, a dense connective tissue
sling (Figure 5.30). The anterior belly attached to the mandible at the digastric fossa, and the
posterior belly attached to the medial surface of the mastoid process.
Figure 5.30. Three-dimensional model of digastric. A. Right and left digastric, inferior
view. B. Right digastric, lateral view. C. Left digastric, lateral view. Light green fibre
bundles, anterior belly of digastric; dark green fibre bundles, posterior belly of digastric.
H, hyoid bone; T, trochlea.
The mean FBLs of the left and right anterior bellies of digastric were similar, but the
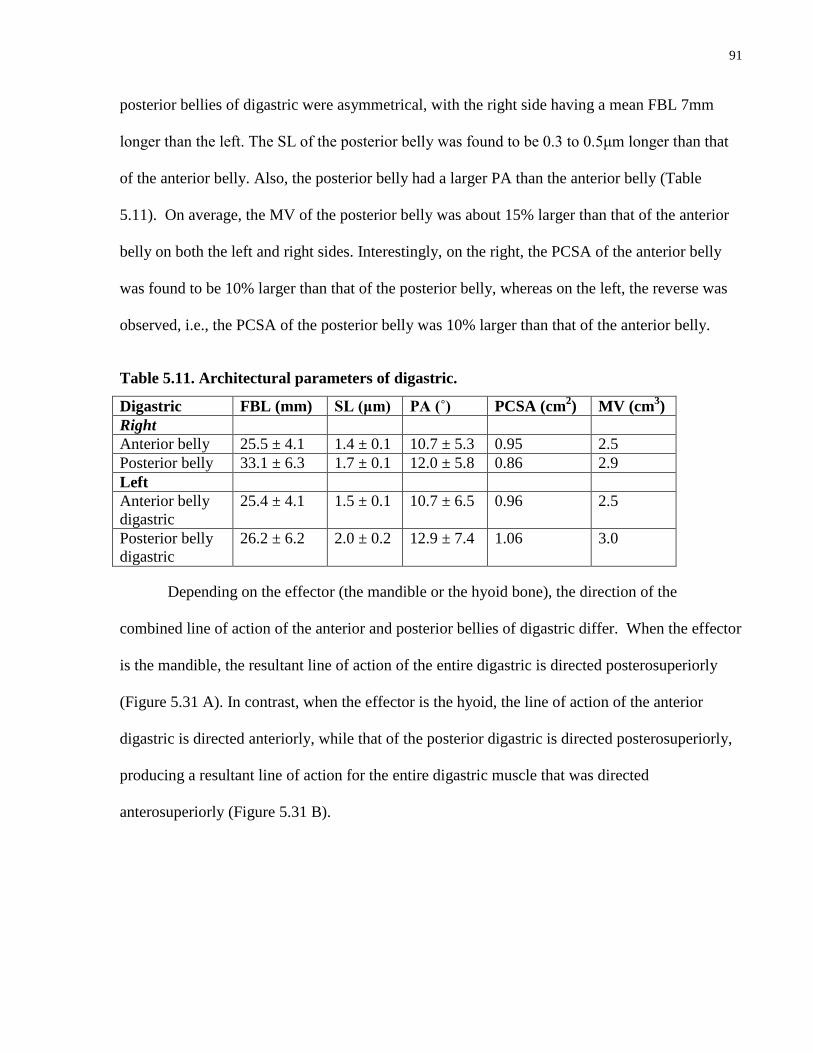
91
posterior bellies of digastric were asymmetrical, with the right side having a mean FBL 7mm
longer than the left. The SL of the posterior belly was found to be 0.3 to 0.5μm longer than that
of the anterior belly. Also, the posterior belly had a larger PA than the anterior belly (Table
5.11). On average, the MV of the posterior belly was about 15% larger than that of the anterior
belly on both the left and right sides. Interestingly, on the right, the PCSA of the anterior belly
was found to be 10% larger than that of the posterior belly, whereas on the left, the reverse was
observed, i.e., the PCSA of the posterior belly was 10% larger than that of the anterior belly.
Table 5.11. Architectural parameters of digastric.
Digastric FBL (mm) SL (μm) PA (˚) PCSA (cm2) MV (cm
3)
Right
Anterior belly 25.5 ± 4.1 1.4 ± 0.1 10.7 ± 5.3 0.95 2.5
Posterior belly 33.1 ± 6.3 1.7 ± 0.1 12.0 ± 5.8 0.86 2.9
Left
Anterior belly
digastric
25.4 ± 4.1 1.5 ± 0.1 10.7 ± 6.5 0.96 2.5
Posterior belly
digastric
26.2 ± 6.2 2.0 ± 0.2 12.9 ± 7.4 1.06 3.0
Depending on the effector (the mandible or the hyoid bone), the direction of the
combined line of action of the anterior and posterior bellies of digastric differ. When the effector
is the mandible, the resultant line of action of the entire digastric is directed posterosuperiorly
(Figure 5.31 A). In contrast, when the effector is the hyoid, the line of action of the anterior
digastric is directed anteriorly, while that of the posterior digastric is directed posterosuperiorly,
producing a resultant line of action for the entire digastric muscle that was directed
anterosuperiorly (Figure 5.31 B).

92
Figure 5.31. Principal fibre bundle orientations (lines of action) of the anterior and
posterior bellies of digastric, lateral views. A. Resultant mandibular movement. B.
Resultant hyoid movement. Light green fibre bundles, anterior belly of digastric; dark
green fibre bundles, posterior belly of digastric; yellow arrows, principal line of action of
each belly; black arrow, resultant line of action of entire muscle.
5.2.3.2 Stylohyoid
Stylohyoid was found to be a slender muscle attached superiorly to the styloid process of
the temporal bone and inferiorly to the greater horn of the hyoid bone via a broad tendon (Figure
5.32). The intermediate tendon of the digastric muscle pierced the belly of stylohyoid and
divided the muscle into superficial and deep parts. Where the tendon of digastric traversed
stylohyoid, it was loosely stabilized by surrounding connective tissue.
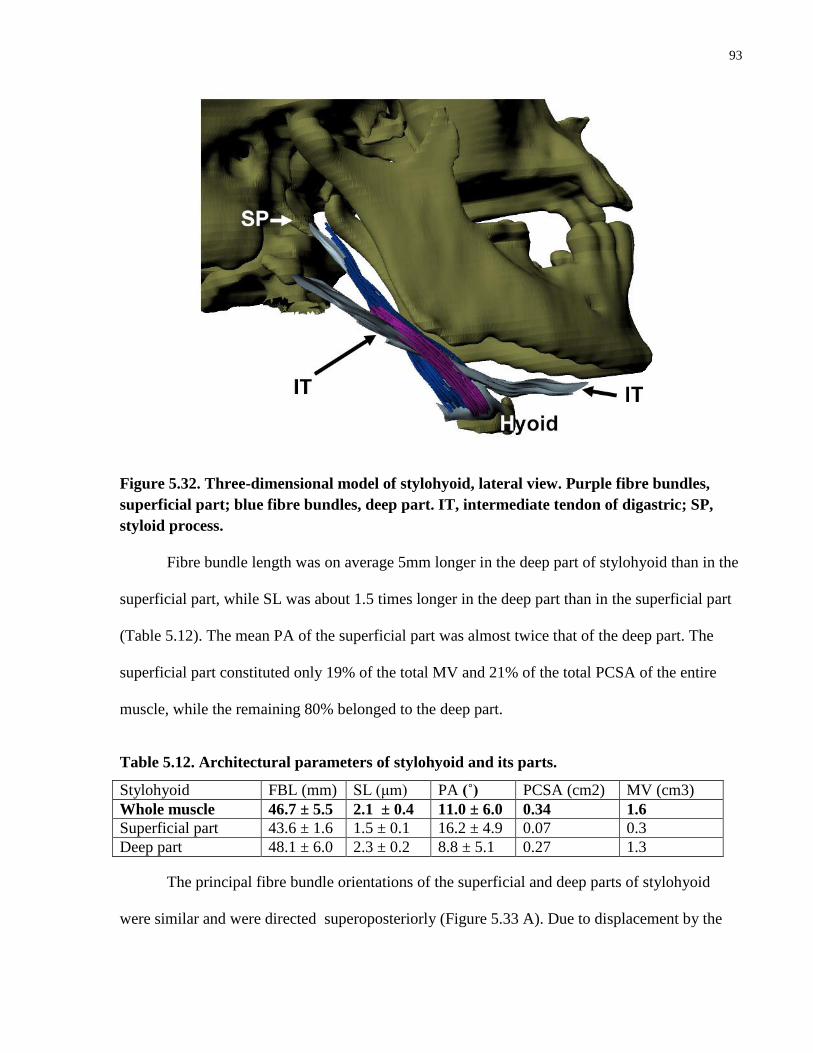
93
Figure 5.32. Three-dimensional model of stylohyoid, lateral view. Purple fibre bundles,
superficial part; blue fibre bundles, deep part. IT, intermediate tendon of digastric; SP,
styloid process.
Fibre bundle length was on average 5mm longer in the deep part of stylohyoid than in the
superficial part, while SL was about 1.5 times longer in the deep part than in the superficial part
(Table 5.12). The mean PA of the superficial part was almost twice that of the deep part. The
superficial part constituted only 19% of the total MV and 21% of the total PCSA of the entire
muscle, while the remaining 80% belonged to the deep part.
Table 5.12. Architectural parameters of stylohyoid and its parts.
Stylohyoid FBL (mm) SL (μm) PA (˚) PCSA (cm2) MV (cm3)
Whole muscle 46.7 ± 5.5 2.1 ± 0.4 11.0 ± 6.0 0.34 1.6
Superficial part 43.6 ± 1.6 1.5 ± 0.1 16.2 ± 4.9 0.07 0.3
Deep part 48.1 ± 6.0 2.3 ± 0.2 8.8 ± 5.1 0.27 1.3
The principal fibre bundle orientations of the superficial and deep parts of stylohyoid
were similar and were directed superoposteriorly (Figure 5.33 A). Due to displacement by the

94
intermediate tendon of digastric, the principal fibre bundle orientation of the superficial part had
a slight lateral deviation in the coronal plane (Figure 5.33 B).
Figure 5.33. Principal fibre bundle orientations (lines of action) of the superficial and deep
parts of stylohyoid. Purple fibre bundles, superficial part; blue fibre bundles, deep part. A.
Lateral view. B. Anterior view. Yellow arrows, principal fibre bundle orientations of the
superficial and deep parts; black arrow, line of action of entire muscle.
5.2.3.3 Mylohyoid
Mylohyoid was found to be a broad suspensory muscle that formed the floor of the mouth
(Figure 5.34). It was divided into three parts: anterior, middle and posterior (Figure 5.34 C and
D). The anterior part was triangular and its fibre bundles spanned across the floor of the mouth,
bridging the left and right sides of the mandible. In contrast, both the middle and posterior parts
were split into right and left halves. The fibre bundles of the middle part attached to a raphe and
those of the posterior part to an aponeurosis attaching to the hyoid bone (Figure 5.34 B and C).
In addition, the middle part was perforated by the sublingual glandular tissue (sublingual
boutonniere), which separated the muscle fibre bundles. Laterally, all three parts attached to the
mylohyoid line of the mandible, extending from the mandibular symphysis anteriorly to the
ramus of the mandible posteriorly.

95
Figure 5.34. Three-dimensional model of mylohyoid. A. Inferior view. B. Raphe (R) and
aponeurosis attaching to hyoid bone, inferior view. C. Three parts of mylohyoid, inferior
view. D. Three parts of mylohyoid, lateral view. Red fibre bundles, anterior part; green
fibre bundles, middle part; blue fibre bundles, posterior part.
The mylohyoid muscle is architecturally heterogeneous (Table 5.13). The posterior part
was found to have the largest mean FBL (51.0 ± 4.8mm). The mean FBLs of the anterior and
middle parts were similar (44.9 ± 14.0mm and 43.7 ± 8.0mm, respectively). However, due to the
triangular shape of the anterior part, the FBL ranged from 10.4mm at the apex to 69.1mm at the
base. In addition, the FBL of the right half of both the middle and posterior parts was found to be
13% and 17% longer, respectively, than the FBL of the left side.
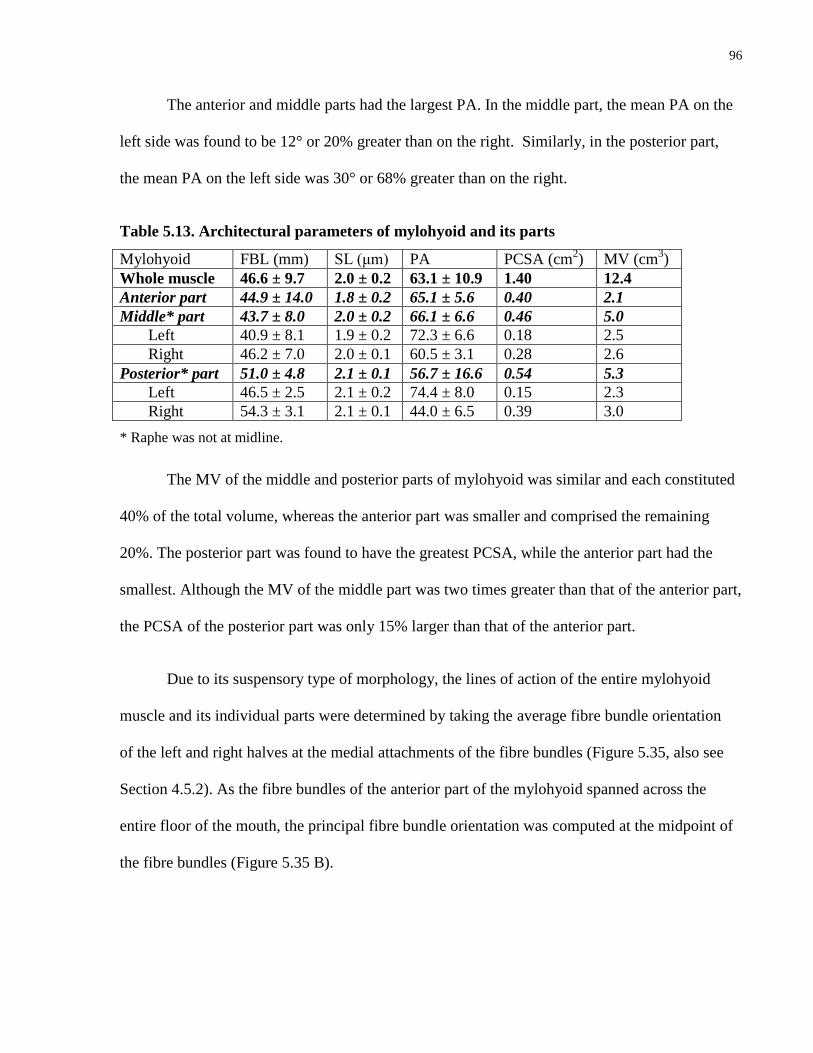
96
The anterior and middle parts had the largest PA. In the middle part, the mean PA on the
left side was found to be 12° or 20% greater than on the right. Similarly, in the posterior part,
the mean PA on the left side was 30° or 68% greater than on the right.
Table 5.13. Architectural parameters of mylohyoid and its parts
Mylohyoid FBL (mm) SL (μm) PA PCSA (cm2) MV (cm
3)
Whole muscle 46.6 ± 9.7 2.0 ± 0.2 63.1 ± 10.9 1.40 12.4
Anterior part 44.9 ± 14.0 1.8 ± 0.2 65.1 ± 5.6 0.40 2.1
Middle* part 43.7 ± 8.0 2.0 ± 0.2 66.1 ± 6.6 0.46 5.0
Left 40.9 ± 8.1 1.9 ± 0.2 72.3 ± 6.6 0.18 2.5
Right 46.2 ± 7.0 2.0 ± 0.1 60.5 ± 3.1 0.28 2.6
Posterior* part 51.0 ± 4.8 2.1 ± 0.1 56.7 ± 16.6 0.54 5.3
Left 46.5 ± 2.5 2.1 ± 0.2 74.4 ± 8.0 0.15 2.3
Right 54.3 ± 3.1 2.1 ± 0.1 44.0 ± 6.5 0.39 3.0
* Raphe was not at midline.
The MV of the middle and posterior parts of mylohyoid was similar and each constituted
40% of the total volume, whereas the anterior part was smaller and comprised the remaining
20%. The posterior part was found to have the greatest PCSA, while the anterior part had the
smallest. Although the MV of the middle part was two times greater than that of the anterior part,
the PCSA of the posterior part was only 15% larger than that of the anterior part.
Due to its suspensory type of morphology, the lines of action of the entire mylohyoid
muscle and its individual parts were determined by taking the average fibre bundle orientation
of the left and right halves at the medial attachments of the fibre bundles (Figure 5.35, also see
Section 4.5.2). As the fibre bundles of the anterior part of the mylohyoid spanned across the
entire floor of the mouth, the principal fibre bundle orientation was computed at the midpoint of
the fibre bundles (Figure 5.35 B).

97
Figure 5.35. Principal fibre bundle orientations and resultant lines of action of the
individual parts of mylohyoid. A. Principal fibre bundle orientation and resultant line of
action of anterior part, anterior view. B. Principal fibre bundle orientation and resultant
line of action of middle part, anterior view. C. Principal fibre bundle orientation and
resultant line of action of posterior part, anterior view. D. Lines of action of mylohyoid and
its parts, lateral view, left half only. Red fibre bundles, anterior part; green fibre bundles,
middle part; blue fibre bundles, posterior part; yellow arrows, principal fibre bundle
orientations of the individual parts; orange arrow, resultant line of action of each part;
black arrow, line of action of entire muscle.
The line of action was computed for the individual parts of mylohyoid and then used to
infer their actions on the floor of the mouth and the hyoid bone. The line of action of the anterior
part was directed superiorly in both the coronal and sagittal planes, suggesting that it may play a

98
role in elevation of the floor of the mouth (Figure 5.35 A and D). The line of action of the middle
part was directed superiorly in the coronal plane and superoanteriorly in sagittal plane. As the
fibre bundles of the middle part attached at the midline onto the raphe, and indirectly via the
raphe to the hyoid, this suggests that the middle part may have a role in elevating the floor of the
mouth, as well as elevating and anteriorly displacing the hyoid. The line of action of the posterior
part was directed superiorly in both the coronal and sagittal planes, suggesting that it may
contribute to direct elevation of the hyoid.
5.2.3.4 Geniohyoid
The right and left geniohyoid muscles were found to be separated by a thin fascial layer at
the midline (Figure 5.36). Anteriorly, the geniohyoid attached to the inferior mental spine of the
mandible, and coursed posteriorly attached to the body of hyoid.
Figure 5.36. Three-dimensional model of geniohyoid. A. Inferior view. B. Lateral view.
Green fibre bundles, right geniohyoid; yellow fibre bundles, left geniohyoid. H, hyoid bone.
Fibre bundle length, SL and PA were found to be similar between the right and left sides.
However, the PCSA and MV of the left side were about 20% larger than those of the right side.

99
Table 5.14. Architectural parameters of geniohyoid
Geniohyoid FBL (mm) SL (μm) PA PCSA (cm2) MV (cm3)
Whole muscle 33.4 ± 3.5 2.2 ± 0.3 15.2 ± 6.5 1.41 5.1
Left 33.4 ± 3.6 2.1 ± 0.2 16.0 ± 6.7 0.78 2.8
Right 33.3 ± 3.5 2.3 ± 0.3 14.4 ± 6.2 0.63 2.3
The principal fibre bundle orientations, i.e., lines of action, of the left and right
geniohyoid muscles were similar (Figure 5.37). In the transverse plane, the fibre bundles were
oriented anteromedially; however, the combined line of action of the left and right muscles was
directed anteriorly. In the sagittal plane, the combined line of action of the left and right muscles
was directed anterosuperiorly.
Figure 5.37. Principal fibre bundle orientations (lines of action) of the left and right
geniohyoid muscles. A. Inferior view. B. Lateral view. Green fibre bundles, right
geniohyoid; yellow fibre bundles, left geniohyoid; yellow arrows, principal fibre bundle
orientation of each muscle; black arrow, combined line of action of right and left
geniohyoid muscles.

100
5.2.3.5 Architectural summary of suprahyoid muscles
Stylohyoid and mylohyoid were found to have the longest mean FBL (46.7 ± 5.5mm and
46.6 ± 9.7mm respectively), and the anterior belly of digastric the shortest (20.5 ± 4.5mm).
Sarcomere length was found to range from 1.8μm to 2.3 μm, except in the anterior and posterior
bellies of digastric, which had the shortest SL, ranging from 1.4μm to 1.7μm (Table 5.15).
The mean PA of digastric, stylohyoid and geniohyoid were relatively similar, ranging
from 10.7° (anterior belly of digastric) to 16.0° (geniohyoid). Due to its morphological
differences, the mean PA of the mylohyoid muscle (63.1 ± 10.9°) was up to six times larger than
that of the other suprahyoid muscles.
Table 5.15. Summary of architectural parameters of suprahyoid muscles and their parts.
FBL (mm) SL (μm) PA (˚) PCSA
(cm2)
MV
(cm3)
Force
Index
Right Digastric
Ant. Digastric 25.5 ± 4.1 1.4 ± 0.1 10.7 ± 5.3 0.95 2.5 0.52
Post. Digastric 33.1 ± 6.3 1.7 ± 0.1 12.0 ± 5.8 0.86 2.9 0.42
Left digastric
Ant. Digastric 25.4 ± 4.1 1.5 ± 0.1 10.7 ± 6.5 0.96 2.5 0.52
Post. Digastric 26.2 ± 6.2 2.0 ± 0.2 12.9 ± 7.4 1.06 3.0 0.51
Stylohyoid 46.7 ± 5.5 2.1 ± 0.4 11.0 ± 6.0 0.34 1.6 0.25
Superficial 43.6 ± 1.6 1.5 ± 0.1 16.2 ± 4.9 0.07 0.3 0.16
Deep 48.1 ± 6.0 2.3 ± 0.2 8.8 ± 5.1 0.27 1.3 0.23
Mylohyoid 46.6 ± 9.7 2.0 ± 0.2 63.1 ± 10.9 1.40 12.4 0.26
Anterior 44.9 ± 14.0 1.8 ± 0.2 65.1 ± 5.6 0.40 2.1 0.24
Middle 43.7 ± 8.0 2.0 ± 0.2 66.1 ± 6.6 0.46 5.0 0.15
Left 40.9 ± 8.1 1.9 ± 0.2 72.3 ± 6.6 0.18 2.5 0.10
Right 46.2 ± 7.0 2.0 ± 0.1 60.5 ± 3.1 0.28 2.6 0.15
Posterior 51.0 ± 4.8 2.1 ± 0.1 56.7 ± 16.6 0.54 5.3 0.18
Left 46.5 ± 2.5 2.1 ± 0.2 74.4 ± 8.0 0.15 2.3 0.09
Right 54.3 ± 3.1 2.1 ± 0.1 44.0 ± 6.5 0.39 3.0 0.19
Geniohyoid 33.4 ± 3.5 2.2 ± 0.3 15.2 ± 6.5 1.41 5.1 0.48
Left 33.4 ± 3.6 2.1 ± 0.2 16.0 ± 6.7 0.78 2.8 0.39
Right 33.3 ± 3.5 2.3 ± 0.3 14.4 ± 6.2 0.63 2.3 0.36
When the force indices of the suprahyoid muscles were compared, it was found that
digastric and geniohyoid had relatively higher indices, with values ranging from 0.42 to 0.52. In

101
contrast, stylohyoid and mylohyoid had relatively low force indices (0.25 and 0.26, respectively).
This suggests that, comparatively, stylohyoid and mylohyoid were designed for excursion, while
digastric and geniohyoid were designed for force generation.
Synergism between the suprahyoid muscles as a whole or their component parts could be
identified based on their principal fibre bundle orientations and lines of action. For example, the
posterior belly of digastric and stylohyoid had similar principal fibre bundle orientations,
suggesting that they may be able to work collaboratively to move the hyoid bone
posterosuperiorly (Figure 5.38 A and B). Also, the geniohyoid had anterosuperiorly oriented
fibre bundles, whereas the anterior belly of digastric had fibre bundles oriented posteroanteriorly,
suggesting that in combination, these muscles may produce anterior movement of the hyoid bone
with slightly superior displacement (Figure 5.38 C to F).
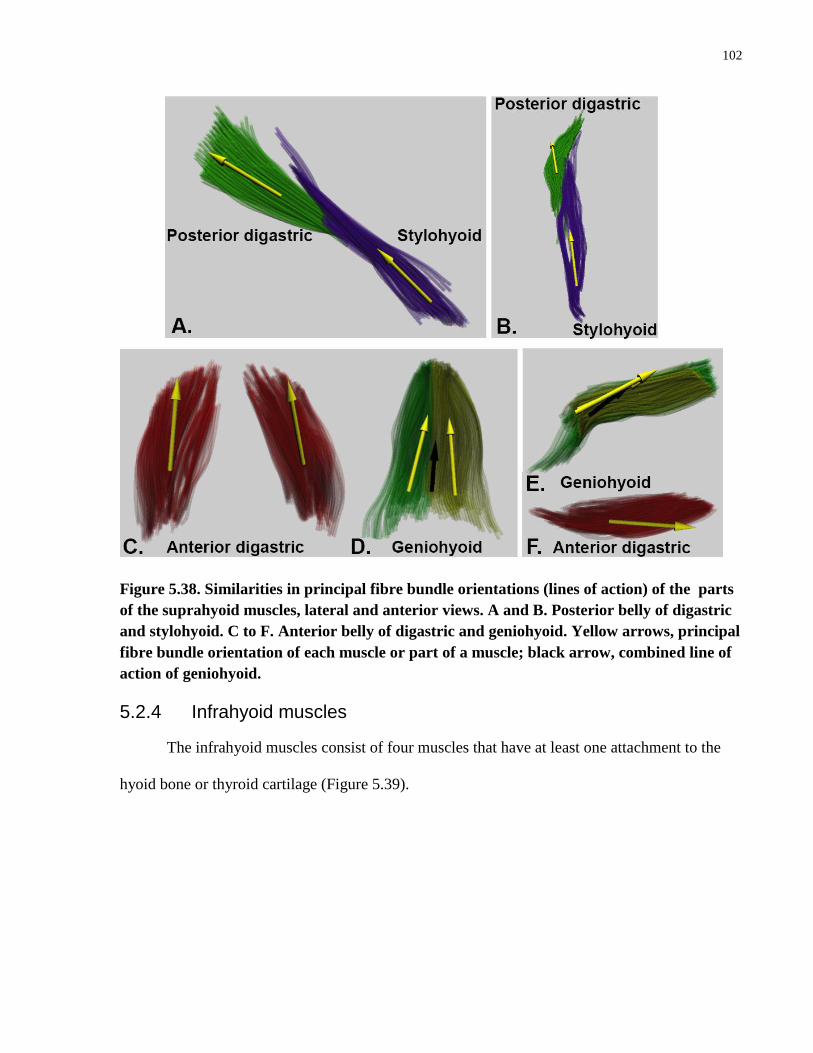
102
Figure 5.38. Similarities in principal fibre bundle orientations (lines of action) of the parts
of the suprahyoid muscles, lateral and anterior views. A and B. Posterior belly of digastric
and stylohyoid. C to F. Anterior belly of digastric and geniohyoid. Yellow arrows, principal
fibre bundle orientation of each muscle or part of a muscle; black arrow, combined line of
action of geniohyoid.
5.2.4 Infrahyoid muscles
The infrahyoid muscles consist of four muscles that have at least one attachment to the
hyoid bone or thyroid cartilage (Figure 5.39).

103
Figure 5.39. Three-dimensional models of the infrahyoid muscles. A. Sternohyoid, anterior
view. B. Omohyoid, anterior view. C. Sternothyroid, anterior view. D. Thyrohyoid, lateral
view.
Sternohyoid and omohyoid are superficial and thyrohyoid and sternothyroid lie deep.

104
Sternohyoid attached inferiorly to the posterior surface of the manubrium and
superiorly to the inferior border of the body of hyoid bone (Figure 5.39 A).
The superior belly of omohyoid attached to the anterior surface of the body of the
hyoid bone and to an intermediate tendon that was anchored by the deep cervical
fascia to the clavicle. The inferior belly of omohyoid continued from the
intermediate tendon to the superior border of the scapula near the scapular notch
(Figure 5.39 B).
Sternothyroid was found to consist of medial and lateral parts. Inferiorly, the fibre
bundles of the medial part originated from the posterior surface of the manubrium,
and those of the lateral part from the costal cartilage of the first rib. Superiorly,
the medial and lateral parts converged and attached onto the lamina of the thyroid
cartilage (Figure 5.39 C).
Thyrohyoid is a quadrangular muscle attached to the lamina of the thyroid
cartilage inferiorly and the lateral surface of the hyoid superiorly. Although
similar in attachment, the muscle was divided into superficial and deep parts
based on fibre bundle orientation (Figure 5.39 D).
The fibre bundles of all of the infrahyoid muscles were arranged in parallel, spanning
almost the entire length of the muscle belly. Due to the parallel fibre bundle arrangement, the
PAs of most of the infrahyoid muscles were less than 10°, except for the inferior belly of
omohyoid and the superficial part of thyrohyoid, which had slightly larger PAs of about 15°
(Table 5.16). Fibre bundle length depended on the attachment sites of the fibre bundles.
Sternohyoid had the longest FBL (97.4 ± 1.9mm), which was about three times longer than that

105
of thyrohyoid. Although thyrohyoid had the shortest mean FBL, its mean SL was longer than
that of the other infrahyoid muscles, which had longer fibre bundles.
Table 5.16. Summary of architectural parameters of the infrahyoid muscles and their
parts.
FBL (mm) SL (μm) PA (˚) PCSA
(cm2)
MV (cm3) Force
index
Sternohyoid 97.4 ± 1.9 1.8 ± 0.3 4.8 ± 3.0 0.5 4.9 0.17
Omohyoid
Superior belly 42.3 ± 4.0 1.7 ± 0.1 5.9 ± 1.6 0.21 0.9 0.23
Inferior belly 69.5 ± 6.1 1.5 ± 0.1 15.5 ± 1.6 0.26 1.9 0.17
Sternothyroid 72.0 ± 7.8 1.7 ± 0.2 7.9 ± 3.9 0.9 6.6 0.26
Medial head 70.5 ± 9.8 1.7 ± 0.1 6.7 ± 3.2 0.5 3.4 0.22
Lateral head 74.3 ± 2.1 1.7 ± 0.2 9.6 ± 4.2 0.4 3.2 0.18
Thyrohyoid 31.2 ± 6.3 2.0 ± 0.2 9.4 ± 7.3 0.9 2.9 0.44
Superficial part 35.3 ± 6.5 2.1 ± 0.1 15.2 ± 6.1 0.5 1.6 0.34
Deep part 30.0 ± 5.7 2.0 ± 0.2 7.6 ± 6.8 0.4 1.3 0.37
Sternothyroid was found to have the largest MV, while thyrohyoid and omohyoid had
the smallest. Interestingly, despite having the smallest volume, thyrohyoid had the largest PCSA,
the same PCSA as the sternothyroid, which was the largest of the infrahyoid muscles. Therefore,
the thyrohyoid muscle had the largest PCSA to MV ratio and the largest force index. The
remaining infrahyoid muscles, due to their strap-like morphology, had small force indices.
The principal fibre bundle orientations of the superior and inferior bellies of omohyoid
were directed inferolaterally in the coronal plane (Figure 40 A) and inferoposteriorly in the
sagittal plane (Figure 5.40 B). The similar alignment of the fibre bundles in both bellies
demonstrates the potential for cohesive transmission of forces from the origin of the superior
belly to the insertion of the inferior belly.

106
Figure 5.40. Principal fibre bundle orientations (lines of action) of the superior and inferior
bellies of omohyoid. A. Anterior view. B. Lateral view. Yellow fibre bundles, superior belly;
red fibre bundles, inferior belly; yellow arrows, principal fibre bundle orientations of the
superior and inferior bellies; black arrow, line of action of entire muscle.
In sternothyroid, the principal fibre bundle orientation of the medial part was directed
superoinferiorly and that of the lateral part was directed inferolaterally (Figure 5.41). Although
both parts may result in inferior movement of the thyroid cartilage, depending on the activation
pattern within this muscle, it may enable movement of the thyroid cartilage in multiple axes.
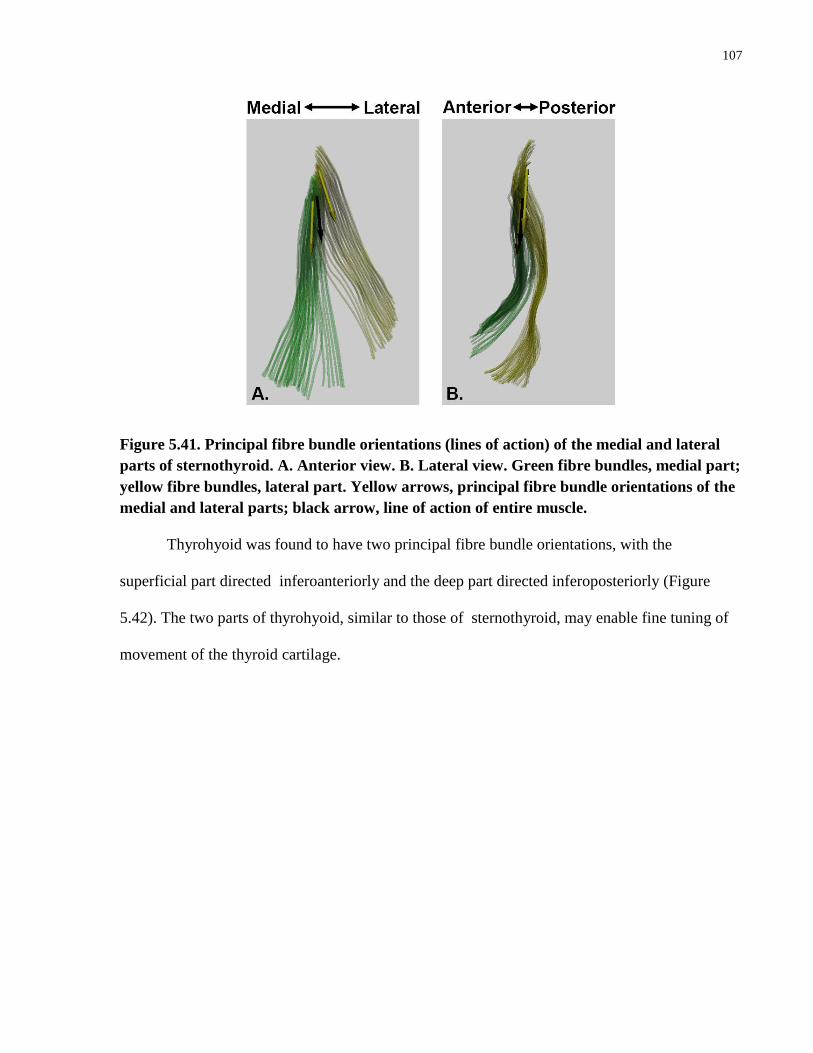
107
Figure 5.41. Principal fibre bundle orientations (lines of action) of the medial and lateral
parts of sternothyroid. A. Anterior view. B. Lateral view. Green fibre bundles, medial part;
yellow fibre bundles, lateral part. Yellow arrows, principal fibre bundle orientations of the
medial and lateral parts; black arrow, line of action of entire muscle.
Thyrohyoid was found to have two principal fibre bundle orientations, with the
superficial part directed inferoanteriorly and the deep part directed inferoposteriorly (Figure
5.42). The two parts of thyrohyoid, similar to those of sternothyroid, may enable fine tuning of
movement of the thyroid cartilage.
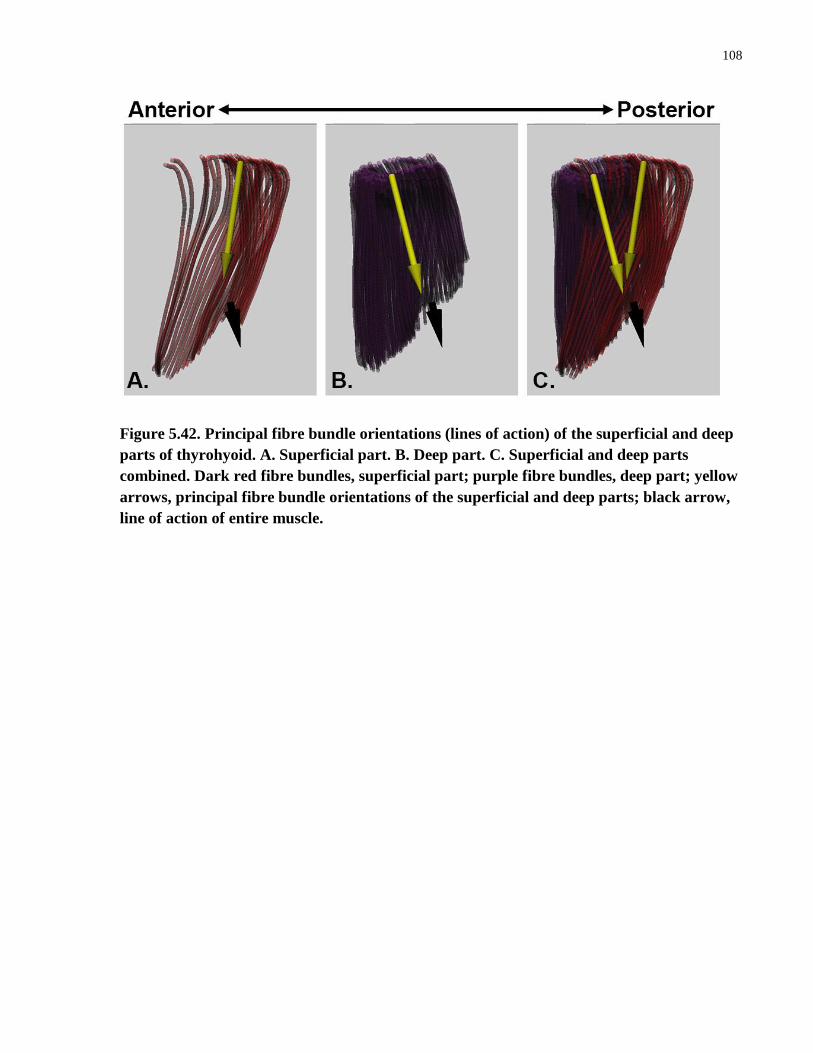
108
Figure 5.42. Principal fibre bundle orientations (lines of action) of the superficial and deep
parts of thyrohyoid. A. Superficial part. B. Deep part. C. Superficial and deep parts
combined. Dark red fibre bundles, superficial part; purple fibre bundles, deep part; yellow
arrows, principal fibre bundle orientations of the superficial and deep parts; black arrow,
line of action of entire muscle.
109
Chapter 6
6 Discussion
Using digitization and 3D computer modelling, the musculotendinous architecture of the
oro-facial and hyoid muscles was captured and reconstructed three-dimensionally. The 3D model
reconstructed from the digitized data was able to capture the geometries of the fibre bundles and
the internal and external tendons in situ. From the digitized data, architectural parameters of
individual muscles and musculotendinous partitions were quantified. The architectural variations
demonstrated in the 3D model and quantified parameters provide a unique opportunity to further
investigate the functional capabilities of these muscles and pursue advanced computer modelling
leading to more realistic simulation.
The digital atlas described in this study is the only available database that provides 3D
coordinate data of the entire oro-facial and hyoid musculotendinous anatomy. The advantages of
this technique were described by the candidate in a recent paper (Li et al., 2014): “Since all fibre
bundles were digitized from the same specimen, any architectural differences between muscles
were real differences and were not caused by interspecimen variation. The digital format allowed
us to quantify and visually examine the intricacies of the spatial relationships between muscles,
as well as the 3D arrangement of the fibre bundles in relation to their tendons and aponeuroses.
The current data demonstrate that even muscles that appear to be morphologically simple, from
their superficial appearance, can contain considerable variation in architecture throughout their
volumes. The tools and techniques implemented in the current study enabled us to identify and
quantify differences between architecturally distinct regions that are often lumped into a single
muscle volume.”

110
Prior to digitization and 3D modelling, most studies were not volumetric and usually
sampled a limited number of fibre bundles either from the muscle’s surface or from
undocumented locations. Digitization of fibre bundles is done in situ, whereas in earlier
cadaveric studies, muscles were removed en block or fibre bundles were removed individually
for measurement (Schumacher, 1961; Weijis and Hillen, 1984). The majority of studies reported
mean values for architectural parameters, and did not address variation in fibre bundle geometry
within a muscle, whereas in this thesis the architectural parameters were quantified at the fibre
bundle level. Furthermore, digitization enables capture and subsequent archiving of the 3D data
so that the models can be reconstructed and analyzed at any time, even after completion of the
dissection. This was not previously an option, since once the dissection had been completed, it
was not possible to reassemble the fibre bundles.
Earlier anatomical studies used 2D drawings or photographs and qualitative descriptions
to report their findings (Schumacher, 1961; Gaundy et al., 2000; Gassner et al., 2008; Sonoda
and Tamatsu, 2008; Nayak et al., 2009). The drawings or photographs only offered a single
perspective of the 3D anatomy being studied. In comparison, the 3D model created in this study
can be viewed from any angle, and structures can be removed or added to offer unobstructed
views of the spatial relationships between the different structures.
Digitization permits the capture of the location, length and trajectory of a large number of
fibre bundles in 3D throughout the muscle volume. For example, the number of fibre bundles of
the masseter (1265) digitized in this study was 21 times greater than the number of fibre bundles
sampled by van Eidjen et al. (1997) (60). Only by digitizing a large number of fibre bundles
throughout the volume of each muscle was it possible to capture and quantify the range of
architectural variability within and between muscles.

111
Very few studies have attempted to document the location of aponeuroses/tendons within
the muscle volume. This has been difficult since exposure of the deeper aponeuroses/tendons,
i.e., not on the surface of the muscle, involves removal of fibre bundles, thus interrupting the
relationships of the fibre bundles and the tendinous elements. In contrast, aponeuorses/tendons
can be digitized throughout the muscle volume and modelled in conjuction with the digitized
fibre bundles, permitting 3D reconstruction of the relationships between the contractile and
connective tissue elements.
In vivo examination of muscle geometry can be carried out using ultrasonography. Fibre
bundles and aponeuroses/tendons can both be visualized, but this is restricted by wave
penetration to superficial musculature and to the measurement plane of the probe. Fibre bundle
identification is limited to the measurement plane and therefore can be used to identify isolated
fibre bundles throughout the muscle volume, but not to view the entire volume as a whole.
Ultrasound studies require detailed knowledge of a muscle’s architecture in order to be able to
target key regions in the muscle volume in static or dynamic states.
From the digitized fibre bundle data, architectural parameters can be quantified digitally.
For example, when the length of each digitized fibre bundle was computed, the curvature of the
fibre bundle could be taken into consideration. In contrast, previously, FBL was measured using
a ruler and/or callipers directly from cadaveric specimens (van Eijden et al., 1997; Pearson et al.,
2011, 2013). Pennation angle has been measured directly from specimens using a protractor as
the angle at the site of attachment of a fibre bundle or to a line connecting the muscle’s
attachment sites. Using digitization, it is possible to measure the pennation angle relative to the
line of action in 3D space. The line of action can be computed, but not visually defined.

112
6.1 Modelling
To date, most computer models of the facial, masticatory and/or hyoid musculature have
represented individual muscles as a line segment(s) or a 3D volume. For example, Terzopoulos
and Waters (1990) and Sifakis et al. (2005) used line segments to represent the muscles of facial
expression in a simulation model. In these studies, sphincter muscles (orbicularis oculi and oris)
were modelled using multiple line segments linked together to form a polygon that approximates
the outer circumference of these muscles. The orientations and attachment sites of the muscles
were based on descriptions from the existing literature and anatomical textbooks. In another
study, Stavness et al. (2006) developed a line segment model of the masticatory and hyoid
muscles based on their attachment sites. The locations and orientations of the muscles were
primarily inferred from imaging data. For muscles with broad areas of attachment (i.e.,
temporalis) or multiple heads (i.e., masseter), 2 to 3 line segments were used to represent the
different regions. In contrast, in this thesis, these muscles were reconstructed from in situ
digitized data, capturing fibre bundle curvature, interdigitation and architectural variation.
More recently, 3D finite-element (FE) representations of skeletal muscles have been used
to attempt simulation of contractile dynamics, such as muscle deformation, surface-to-surface
contact and muscular-hydrostasis (Rohler and Pullan, 2007; Cotin, 2008; Stavness et al., 2011;
Sanchez et al., 2014). The finite element method is thought to be capable of integrating complex
muscle geometry, architecture and tissue properties, but this has not yet been accomplished due
to implementation problems. Sanchez et al. (2014) stated, “There has yet to be any work on
incorporating detailed fibre fields in skeletal muscles, or tests on the sensitivity of a tissue’s
behaviour to variations in the fibre distribution.” The lack of detailed architectural data has also
prevented further development of FE muscle models (Rohler and Pullan, 2007; Sanchez et al.,

113
2014). Rohler and Pullan (2007) stated that “Although it would be desirable to base the FE
model fibre geometry on measurements of actual muscle fibres, it was not possible to find
applicable data for this.” The database developed as a result of this thesis is the first to include
3D digital data of detailed fibre bundle architecture and tendon geometry of individual muscles.
These data are currently being used by our collaborators to begin to build FE models that
incorporate complex and realistic fibre bundle and tendon geometry. Thus, the database has
filled an important need in model development.
6.2 Muscles of facial expression
No previous study of the architectural parameters of the muscles of facial expression at
the fibre bundle level was found. Studies to date have been more general and limited to average
length and width of selected muscles (Balogh et al., 1988; Happak et al., 1997). In this thesis, the
fibre bundle geometry, including FBL and PA, have been quantified from digitized fibre bundle
data, showing variation in the architecture of functionally related muscles. For example,
zygomaticus minor had a longer FBL than zygomaticus major, and levator anguli oris was found
to have a longer FBL and greater PA than depressor angli oris, with extensive interdigitation of
the two muscles.
Interdigitation of the fibre bundles of the muscles of facial expression has been observed
in previous studies (Demiryurek et al., 2003; Shim et al., 2008; Yu et al., 2013). For example,
interdigitation of zygomaticus major, buccinator, platysma, orbicularis oris, levator anguli oris,
mentalis, depressor labii inferioris, depressor anguli oris, and risorius has been reported, but the
specific geometry of the interdigitations was not defined (Shim et al., 2008; Al-Hoqail et al.,
2009; Yu et al., 2013; Kim et al., 2014). In this thesis, due to 3D digital data collection, the
precise location, morphology, interrelationships and interdigitations of the muscles of facial
114
expression were modelled in 3D as in situ. The fibre bundles of levator/depressor anguli oris
were found to interdigitate with the fibre bundles of the upper part of orbicularis oris at the angle
of the mouth, whereas the fibre bundles of buccinator interdigitated with the fibre bundles of the
lower part of orbicularis oris. Zygomaticus major and minor, levator labii superioris, depressor
labii inferioris, LLSAN, and risorius had minimal interdigitation with orbicularis oris.
On morphological comparison of the left and right muscles of facial expression marked
asymmetry was noted. For example in the nasal region, greater than 20% differences were
observed in the FBL between the right and left nasalis as well as the right and left LLSAN
muscles. Asymmetrical findings in muscle architecture and morphology were also observed in
the muscles of the oral and orbital regions. Although greater than 20% difference in FBL and
variation in the orientation of the line of action were noted between the right and left side, these
asymmetries could also be due to use patterns, pathology, injury or deformation of the
underlying skeleton. In future studies using digitization and modelling, the detailed architecture
of the muscles of facial expression of multiple subjects will be incorporated into the current
database to document inter-subject variations. The asymmetrical aspects of facial expression also
requires further investigation.
6.3 Muscle architecture
The architectural parameters of the oro-facial and hyoid musculature were quantified for
the whole muscle, as well as architecturally distinct regions within the muscle volume. Since the
previous literature primarily reported average values of the architectural parameters of each
muscle as a whole, this discussion will focus on a comparison of the architectural parameters of
individual muscles and muscle groups.
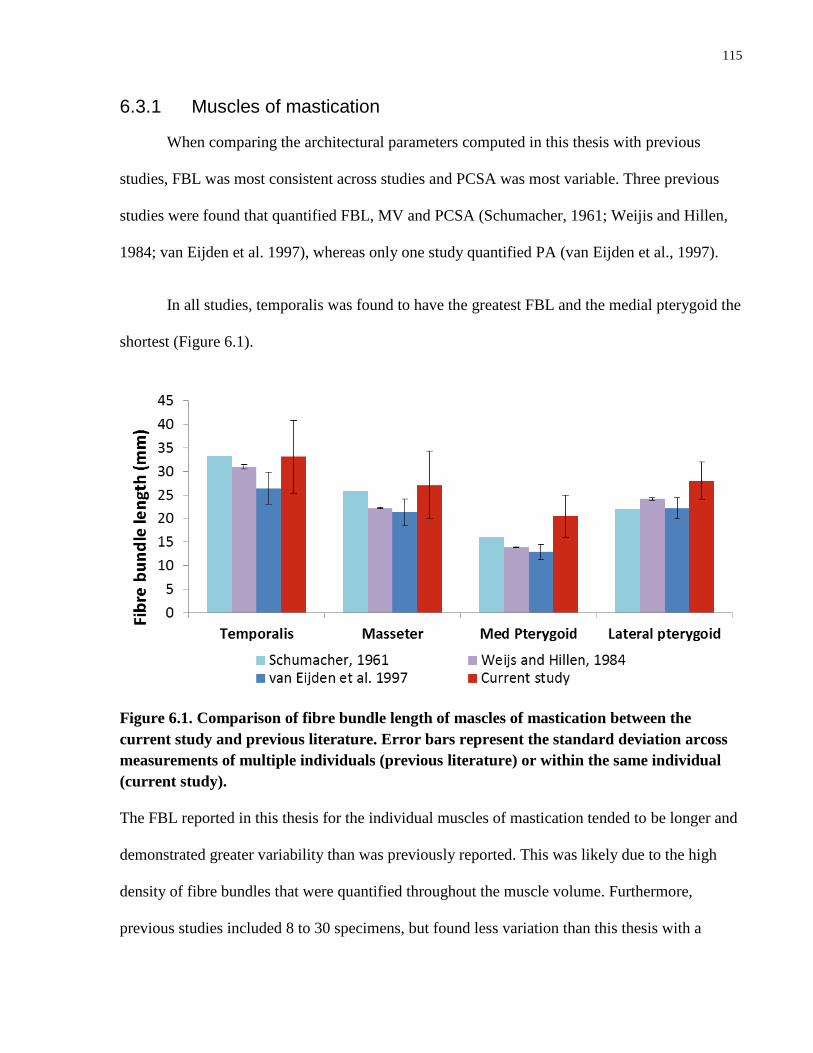
115
6.3.1 Muscles of mastication
When comparing the architectural parameters computed in this thesis with previous
studies, FBL was most consistent across studies and PCSA was most variable. Three previous
studies were found that quantified FBL, MV and PCSA (Schumacher, 1961; Weijis and Hillen,
1984; van Eijden et al. 1997), whereas only one study quantified PA (van Eijden et al., 1997).
In all studies, temporalis was found to have the greatest FBL and the medial pterygoid the
shortest (Figure 6.1).
Figure 6.1. Comparison of fibre bundle length of mascles of mastication between the
current study and previous literature. Error bars represent the standard deviation arcoss
measurements of multiple individuals (previous literature) or within the same individual
(current study).
The FBL reported in this thesis for the individual muscles of mastication tended to be longer and
demonstrated greater variability than was previously reported. This was likely due to the high
density of fibre bundles that were quantified throughout the muscle volume. Furthermore,
previous studies included 8 to 30 specimens, but found less variation than this thesis with a

116
sample size of one specimen. As FBL is indicative a muscle’s excursion capability, the
temporalis is expected to have the greatest excursion capability.
Pennation angle was reported in the only previous study (van Eijden et al., 1997) for the
parts of each muscle of mastication, rather than for each muscle as a whole. The PA of the parts
of the medial pterygoid was found to be consistent between the result by van Eijden et al. (1997)
and the current study (Figure 6.2). In contrast, van Eijden et al. (1997) reported a 0° mean PA for
the inferior part of the lateral pterygoid, whereas in the current thesis, a mean PA of 12.5° was
found. The largest difference in mean PAs was found in temporalis and the deep head of
masseter. The mean PA for the deep head of masseter reported in the current study was about 3.6
times greater than that of van Eijden et al. (1997).
Figure 6.2. Comparison of pennation angle of muscles of mastication between the current
study and previous literature. Error bars represent the standard deviation arcoss
measurements of multiple individuals (previous literature) or within the same individual
(current study).
In this thesis, the PA was calculated at the individual fibre bundle level throughout the
muscle volume. In comparison, van Eijden et al. (1997) quantified PA using selected fibre
bundles at undisclosed locations in the muscle. This could explain the greater variation in the PA
of each muscle observed in the current study.

117
The volumes of the muscles of mastication were comparable between this thesis and van
Eijden et al. (1997). Overall, Schumacher (1961) and Weijis and Hillen (1984) reported much
smaller MVs (Figure 6.3). For example, the MV of masseter reported in this thesis was 3.3 times
greater than that of Schumacher (1961), and 1.8 times greater than that of Weijis and Hillen
(1984). All three of the previous studies weighed the contractile tissue and quantified the volume
indirectly by multiplying the mass with a generalized muscle density value (1g/cm3), compared
to this thesis, where the MV was computed from the volumetrically digitized fibre bundle fields.
The methodology used in previous studies resulted in markedly different muscle volume
quantifications between studies, as can be seen in Figure 6.3.
Figure 6.3. Comparison of muscle volume of muscles of mastication between the current
study and previous literature. Error bars represent the standard deviation arcoss
measurements of multiple individuals (previous literature) or within the same individual
(current study).
Despite the variations in MV found between studies, temportalis was found to have the greatest
volume and the medial and lateral pterygoids the smallest.

118
The masseter and temporalis had a greater PCSA compared to the medial and lateral
pterygoids. Across all four studies, the medial pterygoid was found to have a greater PCSA than
the lateral pterygoid. In contrast, the masseter muscle in this thesis was found to have the greatest
PCSA of all of the muscles of mastication, whereas in all three previous studies, temporalis was
reported to have the greatest PCSA. As PCSA is indicative of the force-generating capability,
this suggests that the temporalis and masseter muscles have a greater force-generating capability
than the pterygoids.
Figure 6.4. Comparison of physiological cross-sectional area of muscles of masticaton
between the current study and previous literature. Error bars represent the standard
deviation arcoss measurements of multiple individuals (previous literature) or within the
same individual (current study).
In all three previous studies, PCSA was calculated by dividing the MV with the mean
FBL. In contrast, in this thesis, the PCSA was directly computed from the raw digitized data at
the fibre bundle level, taking into account the PA of each fibre bundle.
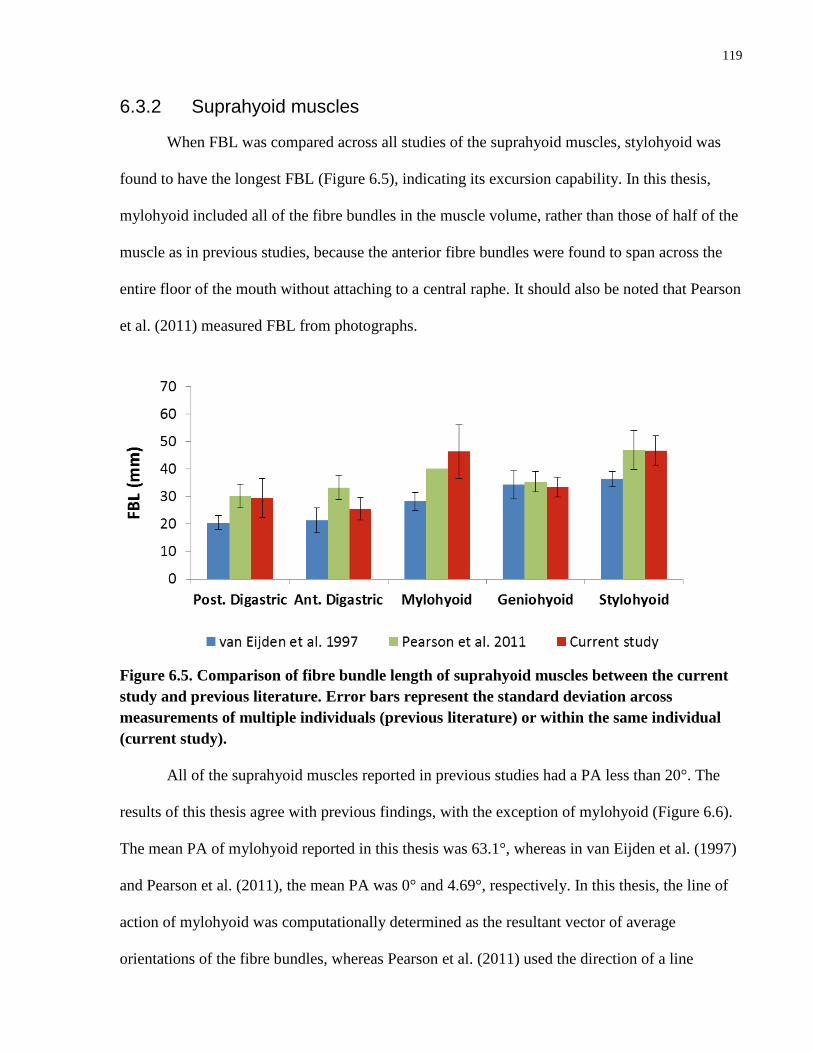
119
6.3.2 Suprahyoid muscles
When FBL was compared across all studies of the suprahyoid muscles, stylohyoid was
found to have the longest FBL (Figure 6.5), indicating its excursion capability. In this thesis,
mylohyoid included all of the fibre bundles in the muscle volume, rather than those of half of the
muscle as in previous studies, because the anterior fibre bundles were found to span across the
entire floor of the mouth without attaching to a central raphe. It should also be noted that Pearson
et al. (2011) measured FBL from photographs.
Figure 6.5. Comparison of fibre bundle length of suprahyoid muscles between the current
study and previous literature. Error bars represent the standard deviation arcoss
measurements of multiple individuals (previous literature) or within the same individual
(current study).
All of the suprahyoid muscles reported in previous studies had a PA less than 20°. The
results of this thesis agree with previous findings, with the exception of mylohyoid (Figure 6.6).
The mean PA of mylohyoid reported in this thesis was 63.1°, whereas in van Eijden et al. (1997)
and Pearson et al. (2011), the mean PA was 0° and 4.69°, respectively. In this thesis, the line of
action of mylohyoid was computationally determined as the resultant vector of average
orientations of the fibre bundles, whereas Pearson et al. (2011) used the direction of a line

120
connecting the centre of the attachment sites on the surface of the muscle. With the methodology
developed in this thesis, it was possible to determine the resultant vector according to the
definition of the line of action, rather than using external landmarks or centroids within a muscle
volume.
Figure 6.6. Comparison of pennation angle of suprahyoid muscles between the current
study and previous literature. Error bars represent the standard deviation arcoss
measurements of multiple individuals (previous literature) or within the same individual
(current study).
The PCSA of all of the suprahyoid muscles, with the exception of mylohyoid, was
comparable between this thesis and van Eijden et al. (1997), whereas Pearson et al. (2011)
consistantly reported a smaller PCSA for all suprahyoid muscles, in particular regarding
geniohyoid and the anterior and posterior bellies of digatric (Figure 6.7).
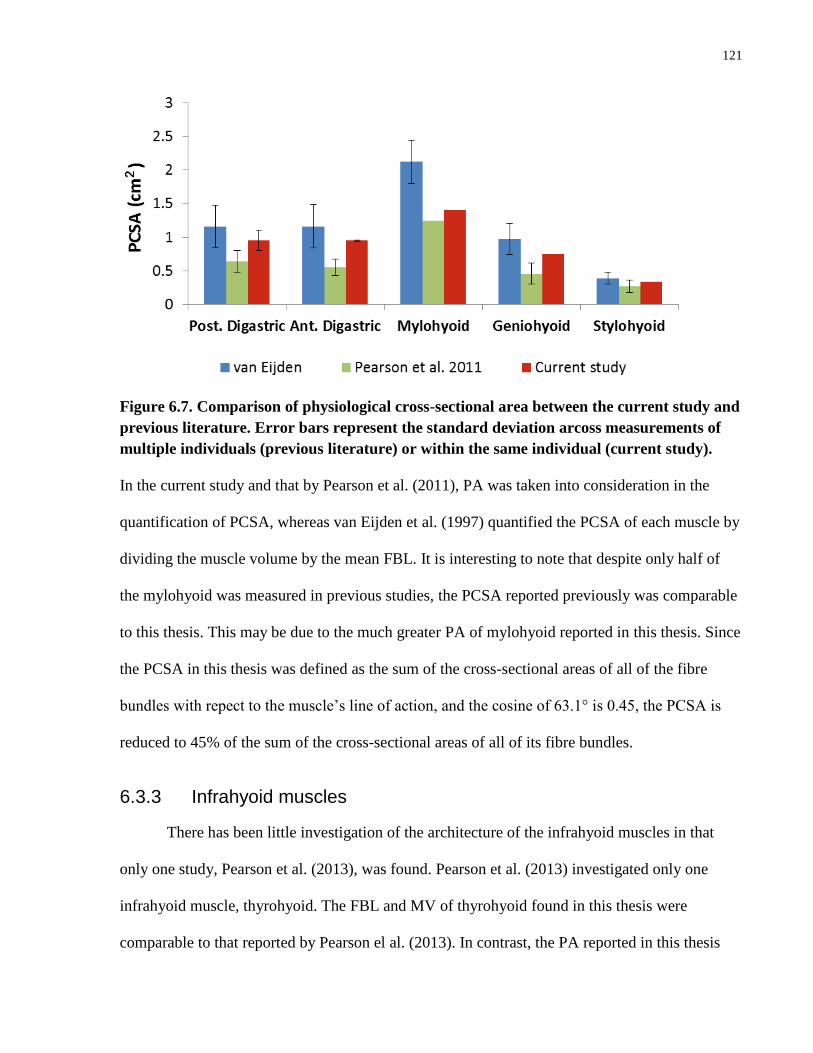
121
Figure 6.7. Comparison of physiological cross-sectional area between the current study and
previous literature. Error bars represent the standard deviation arcoss measurements of
multiple individuals (previous literature) or within the same individual (current study).
In the current study and that by Pearson et al. (2011), PA was taken into consideration in the
quantification of PCSA, whereas van Eijden et al. (1997) quantified the PCSA of each muscle by
dividing the muscle volume by the mean FBL. It is interesting to note that despite only half of
the mylohyoid was measured in previous studies, the PCSA reported previously was comparable
to this thesis. This may be due to the much greater PA of mylohyoid reported in this thesis. Since
the PCSA in this thesis was defined as the sum of the cross-sectional areas of all of the fibre
bundles with repect to the muscle’s line of action, and the cosine of 63.1° is 0.45, the PCSA is
reduced to 45% of the sum of the cross-sectional areas of all of its fibre bundles.
6.3.3 Infrahyoid muscles
There has been little investigation of the architecture of the infrahyoid muscles in that
only one study, Pearson et al. (2013), was found. Pearson et al. (2013) investigated only one
infrahyoid muscle, thyrohyoid. The FBL and MV of thyrohyoid found in this thesis were
comparable to that reported by Pearson el al. (2013). In contrast, the PA reported in this thesis

122
was found to be double that of the previous study (Figure 6.9), again, possibly due to
measurement of PA from photographs and superficial sampling of fibre bundles.
Figure 6.8. Comparison of architectural parameters of thyrohyoid muscle between the
current study and previous literature. Error bars represent the standard deviation arcoss
measurements of multiple individuals (previous literature) or within the same individual
(current study).
In addition, this thesis also found greater variability in PA throughout the muscle volume than
was previously reported for superficial fibre bundles.
6.3.4 Comparison of architecture across muscle groups
The PCSA and FBL of the muscles of mastication, and supra- and infrahyoid muscles are
compared in Figure 6.9 to provide an overview of the functional characteristics of each
muscle/group, i.e., their excursion and/or force-generating capabilities. The infrahyoid muscles
tended to have a greater excursion capability as indicated by their longer FBL, whereas the
muscles of mastication had the greatest force-generating capacity as indicated by their large
PCSA. The suprahyoid muscles had a comparable PCSA to that of the infrahyoid muscles, but
overall, had a shorter FBL.
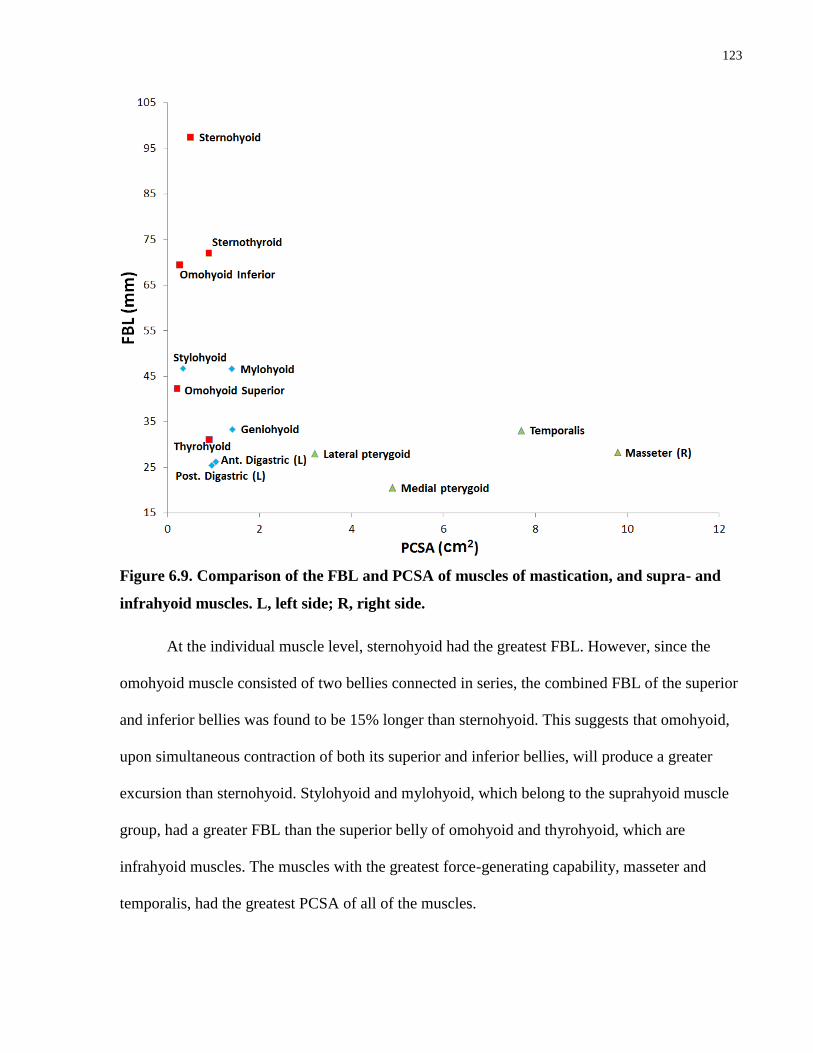
123
Figure 6.9. Comparison of the FBL and PCSA of muscles of mastication, and supra- and
infrahyoid muscles. L, left side; R, right side.
At the individual muscle level, sternohyoid had the greatest FBL. However, since the
omohyoid muscle consisted of two bellies connected in series, the combined FBL of the superior
and inferior bellies was found to be 15% longer than sternohyoid. This suggests that omohyoid,
upon simultaneous contraction of both its superior and inferior bellies, will produce a greater
excursion than sternohyoid. Stylohyoid and mylohyoid, which belong to the suprahyoid muscle
group, had a greater FBL than the superior belly of omohyoid and thyrohyoid, which are
infrahyoid muscles. The muscles with the greatest force-generating capability, masseter and
temporalis, had the greatest PCSA of all of the muscles.

124
6.4 Limitations
The limitations of this thesis include the small sample size; more specimens would need
to be digitized to this level of detail to determine variations between individuals. Further
development of the finite element model is necessary, including determination of the accuracy of
the placement of the fibre bundle data onto the segmented head and neck skeleton. This did not
affect the results of this thesis directly, as the skeletal elements were not used to calculate
architectural parameters, but formed a base on which to display the digitized muscles.
6.5 Summary
Based on the results of this thesis, the hypothesis, “The excursion and relative force-
generating capabilities, as determined by the muscle architectural parameters, will differ between
the oro-facial and hyoid musculature at the muscle group, whole muscle, and muscle partition
levels”, was accepted at all levels.
The main objective of this thesis, “To digitize, model and analyse the architecture of the
oro-facial and hyoid muscles to be able to compare their force generating and excursion
capabilities”, was achieved. At the same time, a comprehensive database of the
musculotendinous parameters of these muscles was established for use in modelling, imaging
and clinical studies.

125
Chapter 7
7 Conclusions
1. In this thesis, the first comprehensive 3D model and database of the muscles of facial
expression, muscles of mastication, and supra- and infrahyoid muscles was constructed
based on tendon/aponeurosis and fibre bundle level digitization. This approach is unique,
as it captures the trajectory of thousands of fibre bundles in relation to the complex
geometry of internal and external tendons throughout the muscle volume in situ.
2. The 3D model created in this thesis is the only model that is based on digitization and
registration of the musculotendinous data to segmented CT scans of the same individual.
Forty-eight oro-facial and hyoid muscles are included.
3. A comprehensive database of architectural parameters, including FBL, SL, PA, PCSA
and MV, which were quantified in 3D space at the fibre bundle level, was compiled.
Sarcomere length could be related to the precise location where the fibre bundle was
biopsied, as the site was digitized into the dataset.
4. The functional characteristics, i.e., force-generating and excursion capabilities, of a
muscle as a whole and its component parts were determined from the architectural
parameters, line(s) of action, and force indices. The functional characteristics were
compared between groups of muscles, individual muscles, and musculoaponeurotic
partitions. Correlation of the volumetric 3D musculotendinous data obtained in this study
with the functional characteristics of a muscle provides a comprehensive approach to
assessing the implications of muscle geometry in normal and pathological states.

126
Chapter 8
8 Future directions
The three-dimensional models and architectural database of the oro-facial and hyoid
muscles constructed in this study provide a foundation for the development of more
comprehensive and realistic dynamic models to simulate musculoskeletal function with greater
fidelity than has previously been possible. Clinically, more specific imaging studies can be
defined from these data to study normal and pathological muscle architecture and function in
vivo in order to provide insight into the processes following musculoskeletal injury. Four
possible future directions are described below.
The 3D data of the oro-facial and hyoid muscles from this thesis are currently being used
to develop a state-of-the-art finite element (FE) model in collaboration with our computer
science collaborators. The detailed fibre bundle architecture and tendon geometry will be
converted into realistic, anatomically based fibre bundle and tendon fields. When embedded into
the FE model, it is expected to greatly improve the capability and fidelity of the simulations.
In order to develop a more comprehensive model, the database needs to be expanded to
include the soft palate, laryngeal and pharyngeal musculature, and the musculoskeletal structures
of the cervical spine. These data would be incorporated into the finite element model for
dynamic simulation of mastication, swallowing and speaking. Validation of the model’s ability
to realistically simulate dynamic function is important and may be carried out using in vivo
imaging such as ultrasonography and fluoroscopy, and functional studies including
electromyography and motion capture.

127
To add a motor control component to the dynamic model, a comprehensive 3D map of
the extra- and intramuscular innervation of each muscle is necessary. This could be
accomplished by digitizating the nerve distribution throughout the muscle volume, which would
enable correlation of musculoaponeurotic partitioning with innervation. The 3D innervation map
could then be incorporated into the FE model to provide neurally based contraction at the level of
the whole muscle, muscle group, or neuromuscular partition.
Clinically, it is not understood how architectural parameters are affected at the fibre
bundle level in individuals with muscular pathology, e.g., tendon tears. Detailed ultrasound
protocols could be developed based on the results of this thesis to investigate changes in
musculotendinous architecture in pathological states. In addition to identifying alterations in
musculotendinous architecture, the results could be used to create patient-specific FE models that
could be used to simulate the condition and provide a mechanism to test surgical and
rehabilitation interventions.

128
References
Arnold, A.S., Delp, S.L. (2001). Rotational moment arms of the medial hamstrings and
adductors vary with femoral geometry and limb position: implications for the treatment of
internally rotated gait. Journal of Biomechanics. 34(4):437-447.
Bakke, M., Tuxen, A., Vilmann, P., Jensen, B.R., Vilmann, A., Toft, M. (1992). Ultrasound
image of human masseter muscle related to bite force, electromyography, facial morphology, and
occlusal factors. Scandinavian Journal of Dental Research. 100:164–171.
Balogh, B., Wessig, M., Millesi, W., Millesi, H., Firbas, W., Fruhwald, F. (1988).
Photogrammetry of the muscles of facial expression. Acta Anatomica. 133:183-187.
Benjamin, M. Kaiser, E.; Milz, S. (2008). Structure-function relationships in tendons: a review.
Journal of Anatomy. 212:211-228.
Biewener, A. A., Roberts, T. J. (2000). Muscle and tendon contributions to force, work and
elastic energy savings: A comparative perspective. Exercise Sports Science Review. 28: 99–107.
Blemker, S.S., Delp, S.L. (2005). Three-dimensional representation of complex muscle
architectures and geometries. Annals of Biomedical Engineering. 33(5):661-673.
Brand, R. A., Pedersen, D. R., Friederich, J. A. (1986). The sensitivity of muscle force
predictions to changes in physiologic cross-sectional area. Journal of Biomechanics, 19, 589-
596.
Buchanan TS. (1995). Evidence that maximum muscle stress is not a constant: differences in
specific tension in elbow flexors and extensors. Medical Engineering & Physics. 17(7):529-36.
Buchner, H. (1877). Kritische und experimentelle Studien iiber den Zusammenhalt des
Hüftgelenks wahrend des Lebens in alien normalen Fallen, Archiv für Anatomie und Physiologie.
22-45.
Cioffi, I., Gallo, L.M., Palla, S., Erni, S., Farella, M. (2012). Macroscopic analysis of human
masseter compartments assessed by magnetic resonance imaging. Cells Tissues and Organs.
195:465-472.

129
Cormack, D.H. 2001. Essential Histology. Philadelphia, Pennsylvania: Lippincott Williams &
Wilkins.
Cotin, S. Computer Based Interactive Medical Simulation. Modeling and Simulation. Universite
des Sciences et Technologie de Lille - Lille I, 2008.
De Castro, C.C. (1980). The anatomy of the platysma muscle. Plastic and Reconstructive
Surgery. 66(5):680–683.
Demiryurek, D., Bayramoglu, A., Erbil, K.M., Onderoglu, S., Sargon, M.F., Aldur, M.M.,
Korkusuz, P., Nazikoglu, A. (2003). Three-dimensional structure of the modiolus. A
computerized reconstruction study. Saudi Medical Journal, 24(8), 846-849.
Dumas GA, J. PM, Roy B, Gagnon M, Jovanovic M. (1988). A three-dimensional digitization
method to measure trunk muscle lines of action. Spine. 13:532–541.
Ehmsen, J., Poon, E., Davies, K. (2002) The dystrophine-associated protein complex. Journal of
Cell Science. 115:2801-2803.
Emshoff, R., Bertram, S., Strobl, H. (1999). Ultrasonographic cross-sectional characteristics of
muscles of the head and neck. Oral Surgery, Oral Medicine, Oral Pathology, Oral Radiology,
and Endodontology. 87:93-106.
Friederich, J.A., Brand, R.A. (1990). Muscle fiber architecture in the human lower limb. Journal
of Biomechanics. 23(1):91-5.
Froeling, M., Nederveen, A.J., Heijtel, D.F., Lataster, A., Bos, C., Nicolay, K., Maas, M., Drost,
M.R., Strijkers, G.J. (2012). Diffusion-tensor MRI reveals the complex muscle architecture of
the human forearm. Journal of Magnetic Resonance Imaging. 36(1):237-248.
Gans, C., Bock, W.J. (1965). The functional significance of muscle architecture--a theoretical
analysis. Ergeb Anat Entwicklungsgesch. 38:115-42.
Gans, C., de Vree, F. (1987) Functional bases of fibre length and angulation in muscle. Journal
of Morphology. 192:63-85.
130
Gans, C., Gaunt, A.S. (1991). Muscle architecture in relation to function. Journal of
Biomechanics. 24:53-65.
Gassner, H.G. Rafii, A., Young, A., Murakami, C., Moe, K.S., Larrabee, W.F. (2008). Surgical
anatomy of the face: Implications for modern face-lift techniques. Archives of Facial Plastic
Surgery. 10(1):9-17.
Gaudy, J.F., Zouaoui, A., Bravetti, P., Charrier, J.L., Guettaf, A. (2000). Functional organization
of the human masseter muscle. Surgerical and Radiological Anatomy. 22:181-190.
Gilles, B., Moccozet, L., Magnenat-Thalmann, N. (2006). Anatomical modelling of the
musculoskeletal system from MRI. Medical Image Computing and Computer-Assisted
Intervention. 9(Pt 1):289-296.
Gordon, A.M., Huxley, A.F., Julian, F.J. (1966). The variation in isometric tension with
sarcomere length in vertebrate muscle fibres. Journal of Physiology.184:170-192.
Jarvinen, R.A.H., Jozsa, L., Kannus, P., Jarvinen, T.L., Jarvinen, M. (2002) Organization and
distribution of intramuscular connective tissue in normal and immobilized skeletal muscles.
Journal of Muscle Research and Cell Motility. 23:245-254.
Ham, A.W. Histology. Philadelphia, Pennsylvania: J.B. Lippincott Company.
Hannam, A.G., Wood, W.W. (1989). Relationships between the size and spatial morphology of
human masseter and medial pterygoid muscles, the craniofacial skeleton, and jaw biomechanics.
American Journal of Physical Anthropology. 80(4):429-45.
Hannam, A.G., McMillian, A.S. (1994). Internal organization in the human jaw muscles. Critical
Reviews in Oral Biology and Medicine. 5(1):55-89.
Hannam, A.G., Stavness, I., Lloyd, J.E., Fels, S. (2008). A dynamic model of jaw and hyoid
biomechanics during chewing. Journal of Biomechanics. 41(5):1069-76.
Hanson, J. Huxley, H.E. (1953). Structural basis of the cross-striations in muscle. Nature. 172:
530-532.

131
Happak, W., Liu, J., Burggasser, G., Flowers, A., Gruber, H., Freilinger, G. (1997). Human
facial muscles: dimensions, motor endplate distribution, and presence of muscle fibres with
multiple motor endplates. Anatomical Record. 249:276–284.
Herrmann, A. M., Delp, S. L. (1999). Moment arm and force-generating capacity of the extensor
carpi ulnaris after transfer to the extensor carpi radialis brevis. The Journal of Hand Surgery, 24,
1083-1090.
Holzbaur, K.R., Murray, W.M., Gold, G.E., Delp, S.L. (2007). Upper limb muscle volumes in
adult subjects. Journal of Biomechanics. 40(4):742-749.
Huijing, P.A. (1999). Muscular force transmission: a unified, dual or multiple system? A review
and some explorative experimental results. Archives of Physiology and Biochemistry. 107(4):
292-311.
Hutto, J.R., Vattoth, S. (2015). A practical review of the muscles of facial mimicry with special
emphasis on the superficial musculoaponeurotic system. American Journal of Roentgenology,
204(1):W19-26.
Huxley, H. E. (1953). X-ray analysis and the problem of muscle. Proceedings of the Royal
Society Series B-Biological Sciences. 141, 59.
Huxley, A. F., Niedergerke, R. (1954). Structural changes in muscle during contraction:
interference microscopy of living muscle fibres. Nature. 173, 971-973.
Huxley, H. E., Hanson, J. (1954). Changes in the cross-striations of muscle during contraction
and stretch and their structural interpretation . Nature. 173, 973-976.
Huxley, H. E., Reconditi, M., Stewart, A., Irving,T. (1999). X-ray evidence for changes in
configuration of actin-attached myosin heads during the working stroke in intact muscle.
Biophysics Journal. 76: A269.
Jenson, R.H., Davy, D.T. (1975). An investigation of muscle lines of action about the hip: A
centroid line approach vs. the straight line approach. Journal of Biomechanics. 8: 103-110.

132
Kahler, K., Haber, J., Seidel, H.P. (2001). Geometry-based muscle modeling for facial
animation. Proceedings of Graphics Interface 2001. 37-46.
Kim, H.S., Pae, C., Bae, J.H., Hu, K.S., Chang, B.M., Tansatit, T., Kim, H.J. (2014). An
anatomical study of the risorius in Asians and its insertion at the modiolus. Surgical and
Radiological Anatomy. [Epub. ahead of print].
Kim SY, Boynton EL, Ravichandiran K, Fung LY, Bleakney RR, Agur AM. (2007). Three-
dimensional study of the musculotendinous architecture of supraspinatus and its functional
correlations. Clinical Anatomy. 20(6):648-655.
Kim, S.Y., Bleakney, R., Rindlisbacher, T., Ravichandiran, K., Rosser, B., Boynton, E. (2013).
Musculotendinour architecture of pathological supraspinatus: a pilot in vivo ultrasonography
study. Clinical Anatomy. 26 (2): 228-235.
Kwah, L.K., Pinto, R.Z., Diong, J., Herbert, R.D. (2013). Reliability and validity of ultrasound
measurements of muscle fascicle length and pennation in humans, a systemic review. Journal of
Applied Physiology. 114(6):761-769.
Langenderfer, J., Jerabek, S. A., Thangamani, V. B., Kuhn, J. E., Hughes, R. E. (2004).
Musculoskeletal parameters of muscles crossing the shoulder and elbow and the effect of
sarcomere length sample size on estimation of optimal muscle length. Clinical Biomechanics
(Bristol, Avon). 19, 664-670.
Lee, D., Ravichandiran, K., Jackson, K., Fiume, E., Agur, A. (2012). Robust estimation of
physiological cross-sectional area and geometric reconstruction for human skeletal muscle.
Journal of Biomechanics. 45(8):1507-1513.
Lee, D., Li, Z., Sohail, Q.Z., Jackson, K., Fiume, E., and Agur A. (2014). A three-dimensional
approach to pennation angle estimation for human skeletal muscle. Computer Methods in
Biomechanics and Biomedical Engineering. [Epub. ahead of print].
DOI:10.1080/10255842.2014.917294.
Lemay, M. A., & Crago, P. E. (1996). A dynamic model for simulating movements of the elbow,
forearm, an wrist. Journal of Biomechanics, 29(10), 1319-1330.
133
Leppi, J. (1961). An anomalous infrahyoid muscle. Brief Yale Reports. 522-523.
Levin, D.I.W., Gilles, B., Mädler, B., Pai, D.K. (2011). Extracting skeletal muscle fiber fields
from noisy diffusion tensor data. Medical Image Analysis. 15(3):340-353.
Lewis, J. P., Cordner, M., Fong, N. (2000). Pose space deformation: a unified approach to shape
interpolation and skeleton-driven deformation. Proceedings of the 27th annual conference on
Computer graphics and interactive techniques. 165–172.
Li, Z., Mogk, J., Lee, D., Bibliowicz, J., and Agur, A. (2014). Development of an architecturally
comprehensive database of forearm flexors and extensors from a single cadaveric specimen.
Computer Methods in Biomechanics and Biomedical Engineering: Imaging & Visualization.
[Epub. ahead of print]. DOI:10.1080/21681163.2013.868779.
Lieber, R.L., Yeh, Y., Baskin, R.J. (1984). Sarcomere length determination using laser
diffraction. Effect of beam and fiber diameter. Biophysical Journal. 45(5):1007-16.
Lieber, R.L., Fazeli, B.M., Botte, M.J. (1990). Architecture of selected wrist flexor and extensor
muscles. Journal of Hand Surgery [Am]. 15(2):244-50.
Lieber, R.L., M.D. Jacobson, B.M. Fazeli, R.A. Abrams, and M.J. Botte. (1992). Architecture of
selected muscles of the arm and forearm: anatomy and implications for tendon transfer. Journal
of Hand Surgery [Am]. 17(5):787-98.
Lieber, R.L., G.J. Loren, and J. Fridén. (1994). In vivo measurement of human wrist extensor
muscle sarcomere length changes. Journal of Neurophysiology. 71(3):874-81.
Lieber, R. L., & Friden, J. (2001). Clinical significance of skeletal muscle architecture. Clinical
Orthopaedics and Related Research, 3(83), 140-151.
Lieber R.L, Ward S.R. (2011). Skeletal muscle design to meet functional demands. Philosophical
Transactions of the Royal Society B: Biological Sciences. 366(1570):1466-1476.
Mendelson, B.C, Freeman, M.E., Wu, W., Huggins, R.J. (2008). Surgical anatomy of the lower
face: the premasseter space, the jaw, and the labiomandibular fold. Aesthetic and Plastic
Surgery. 2(2):185–195.

134
Mendez, J., Keys, A. (1960). Density and composition of mammalian muscle. Metabolism .
9:184-188
Miura, M., Kato, S., Itonaga, I., Usui, T. (1995). The double omohyoid muscle in humans: report
of one case and review of the literature. Okajimas Folia Anatomica Japonica. 72(2-3):81-97.
Moore, K.L., Agur, A.M., Dalley, A.F. 2014. Essential Clinical Anatomy. Baltimore, Maryland:
Lippincott Williams & Wilkins.
Murray, W.M., Buchanan, T.S., Delp, S.L. (2000). The isometric functional capacity of muscles
that cross the elbow. J Biomech. 33(8):943-952.
Nayak, S.R., Rai, R., Krishnamurthy, A., Prabhu, L.V., Potu, B.K. (2009). An anomalous belly
of sternothyroid muscle and its significance. Romanian Journal of Morphology and Embryology,
50:307-308.
Nicot R., Hottenstein, M., Raoul G., Ferri, J., Horton, M., Tobias, J.W., Barton, E., Gele, P.,
Sciote, J.J. (2014). Nodal pathway genes are down-regulated in facial asymmetry. Journal of
Craniofacial Surgery. 25(6):e548-55.
Okada, T., Aoyagi, Y., Saitoh, E., Kagaya, H., Shibata, S., Ota, K., Ueda, K. (2013). Dynamic
change in hyoid muscle length associated with trajectory of hyoid bone during swallowing:
analysis using 320-row area detector computed tomography. Journal of Applied Physiology.
115:1138-1145.
Pearson, W.G., Hindson, D.F., Langmore, S.E., Zumwalt, A.C. (2013). Evaluating swallowing
muscle essential for hyolarygngeal elevation by using muscle functional magnetic resonance
imaging. International Journal of Radiation Oncology Biology Physics. 85(3):735-740.
Pearson, W.G., Langmore, S.E., Zumwalt, A.C. (2011). Evaluating the structural properties of
suprahyoid muscles and their potential for moving the hyoid. Dysphagia. 26(4):345-351.
Pearson, W.G., Langmore, S.E., Yu, L.B., Zumwalt, A.C. (2012). Structural Analysis of muscle
elevating the hyolaryngeal complex. Dysphagia. 27(4):445-451.
135
Petrof, B.J., Shrager, J.B., Stedman, H.H., Kelly, A.M. (1993) Dystrophin protects the
sarcolemma from stresses developed during muscle contraction. Proceedings of the National
Academy of Sciences of the United States of America. 90:3710-3714.
Raadsheer, M.C., van Eijedn, T.M., van Spronsen, H., Van Ginkel, F.C., Kiliaridis, S., Prahl-
Andersen, B. (1994). A comparison of human masseter muscle thickness measured by
ultrasonography and magnetic resonance imaging. Archives of Oral Biology. 39(12):1079-1084.
Raadsheer, M.C., Van Eijden, T.M., Van Ginkel, F.C., Prahl-Andersen, B. (2004). Human jaw
muscle strength and size in relation to limb muscle strength and size. European Journal of Oral
Sciences. 112(5):398-405.
Rassier, D.E., MacIntosh, B.R., Herzog, W. (1999). Length dependence of active force
production in skeletal muscle. Journal of Applied Physiology. 86: 1445-1457.
Ravichandiran, K., Ravichandiran, M., Oliver, M.L., Singh, K.S., McKee, N.H., Agur, A.M.
(2009). Determining physiological cross-sectional area of extensor carpi radialis longus and
brevis as a whole and by regions using 3D computer muscle models created from digitized fiber
bundle data. Computer Methods and Programs in Biomedicine. 95(3):203-212.
Rohrle, O., Pullan, A.J. (2007). Three-dimensional finite element modelling of muscle forces
during mastication. Journal of Biomechanics. 40(15):3363-3372.
Rosatelli A.L., Ravichandiran K., Agur A.M. (2008). Three-dimensional study of the
musculotendinous architecture of lumbar multifidus and its functional implications. Clinical
Anatomy. 21(6):539-546.
Ross, M.H., Pawlina, W. 2010. Histology: A Text and Atlas. Baltimore, Maryland: Lippincott
Williams & Wilkins.
Sacks R.D., Roy, R.R. (1982). Architecture of the hind limb muscles of cats: Functional
significance. Journal of Morphology. 173(2):185-195.
136
Sánchez, A.C., Lloyd, J.E., Fels, S., Abolmaesumi, P. (2014). Embedding digitized fibre fields in
finite element models of muscles. Computer Methods in Biomechanics and Biomedical
Engineering: Imaging & Visualization. [Epub ahead of print. DOI:
10.1080/21681163.2013.862861]
Satirolu, F., Arun, T., Isik, F. (2005). Comparative data on facial morphology and muscle
thickness using ultrasonography. The European Journal of Orthodontics. 27:562-567.
Schenk, P., Siebert, T., Hiepe, P., Güllmar, D., Reichenbach, J.R., Wick, C., Blickhan, R., Böl,
M. (2013). Determination of three-dimensional muscle architecture: validation of the DTI-based
fibre tractography method by manual digitization. J Anat. 223(1):61-68.
Schumacher, G.H. (1961). Funktionelle Morphologie der Kaumskulatur. Fischer, Jena.
Shim, K.S., Hu, K.S., H.H., Kwak, H.H., Youn, K.H., Koh, K.S., Kim, H.J. (2008). An
anatomical study of the insertion of the zygomaticus major muscle in humans focused on the
muscle arrangement at the corner of the mouth. Plastic and Reconstructive Surgery, 121(2), 466-
473.
Sifakis, E., Neverov, I., Fedkiw, R., (2005). Automatic determination of facial muscle activations
from sparse motion capture marker data. ACM Trans. Graph., 24(3):417–425.
Smeulders, M.J., van den Berg, S., Oudeman, J., Nederveen, A.J., Kreulen, M., Maas, M. (2010).
Reliability of in vivo determination of forearm muscle volume using 3.0 T magnetic resonance
imaging. Journal of Magnetic Resonance Imaging. 31(5):1252-1255.
Sonoda, N., Tamatsu, Y. (2008) Observation on the attachment of muscles onto the hyoid bone
in human adults. Okajimas Folia Anatomica Japonica. 85(3):79-90.
Sosa, H., Popp, D., Ouyang, G., Huxley, H.E. (1994). Ultrastructure of skeletal muscle fibres
studied by a pluuge quick freezing method: myofilament length. Biophysics Journal. 67:283-292.
Stavness, I., Hannam, A. G., Lloyd, J. E., Fels, S. (2006). An integrated, dynamic jaw and
laryngeal model constructed from CT data. Proc ISBMS06 in Springer LNCS. 4072:169–177.

137
Stavness, I., Lloyd, J.E., Payan Y., Fels, S. (2011). Coupled hard–soft tissue simulation with
contact and constraints applied to jaw–tongue–hyoid dynamics. International Journal for
Numerical Methods in Biomedical Engineering, 27(3), 367-390, 2011.
Stevens D.E., Smith, C.B., Harwood, B., Rice C.L. (2014). In vivo measurement of fascicle
length and pennation of the human anconeus muscles at several elbow joint angles. Journal of
Anatomy. [Epub ahead of print] doi: 10.1111/joa. 12233.
Street, S. F., Ramsey, R. W. (1965). Sarcolemma: transmitter of active tension in frog skeletal
muscle. Science. 149: 379-1380.
Terzopoulos, D., Waters, K. (1990). Physically-Based Facial Modeling, Analysis, and
Animation. Journal of Visualization and Computer Animation. 1(2), 73-80.
Tsuang, Y.H., Novak, G.J., Schipplein, O.D., Hafezi, A., Trafimow, J.H., and Andersson, G.B.
(1993). Trunk muscle geometry and centroid location when twisting. Journal of Biomechanics.
26(4-5):537-546.
van Alfen, N., Gilhuis, J., Keijzers, J.P., Pillen, S., van Dijk, J. (2013). Quantitative facial
muscle ultrasound: Feasibility and reproducibility. Muscle and Nerve. 48:375-380.
van Eijden, T.M.G.J., Korfage, J.A.M., Brugman P. (1997). Architecture of the human jaw-
closing and jaw-opening muscles. Anatomical Record. 248:464–474.
Walker, S.M., Schrodt, G.R. (1974). I segment lengths and thin filament periods in skeletal
muscle fibers of the rhesus monkey and the human. Anatomical Records. 178: 63-81.
Weijs WA, Hillen B. (1985). Physiological cross-section of the human jaw muscles. Acta
Anatomica (Basel). 121(1):31-5.
Yu, S.K., Lee, M.H., Kim, H.S., Park, J.T., Kim, H.J., Kim, H.J. (2013). Histomorphologic
approach for the modiolus with reference to reconstructive and aesthetic surgery. Journal of
Craniofacial Surgery, 24(4):1414-1417.
Zajac F.E. (1989). Muscle and tendon: Properties, models, scaling, and application to
biomechanics and motor control. Critical Review in Biomedical Engineering. 17(4):359-411.

138
Zajac F.E. (1992). How musculotendon architecture and joint geometry affect the capacity of
muscles to move and exert force on objects: a review with application to arm and forearm tendon
transfer design. Journal of Hand Surgery. 17:799–804.

139
Copyright Acknowledgements

140

141

142