functional aromatic amino ketones - semantic scholar5.2.1 aromatic amino ketones by friedel craft...
TRANSCRIPT
Functional Aromatic Amino Ketones as UV/Vis probes for
various liquid and solid environments
von der Fakultät für Naturwissenschaften der Technischen Universität Chemnitz
genehmigte Dissertation zur Erlangung des akademischen Grades
doctor rerum naturalium
(Dr. rer. nat.)
vorgelegt von Master in Chemie Mohamed El-Sayed
geboren am 16.11.1966 in Port-Said, Ägypten
eingereicht am 20 Dezember 2002
Gutachter:
Prof. Dr. Stefan Spange, Technische Universität Chemnitz
Prof. Dr. Heinrich Lang, Technische Universität Chemnitz
Prof. Dr. Rainer Beckert, Friedrich-Schiller-Universität Jena
Tag der Verteidigung: 1 April 2003
Bibliographische Beschreibung und Referat 2
Bibliographische Beschreibung und Referat
El-Sayed, M.
Functional Aromatic Amino Ketones as UV/Vis probes for various liquid and solid
environments
Technische Universität Chemnitz-Zwickau, Fakultät für Naturwissenschaften, Dissertation,
2003, 140 Seiten, 141 Literaturzitate, 35 Abbildungen, 24 Tabellen, 14 Diagramme.
Zum gegenwärtigen Kenntnisstand bezüglich Solvatochromie, Sol-Gel Prozesse, und
der Synthese von Polyketonen wird eine kurze Einführung gegeben. Die Synthese-
konzeptionen funktionalisierter aromatischer Aminoketone werden vorgestellt. Die neuen
Verbindungen wurden mittels Elementaranalyse, Röntgenstrukturanalyse, und
spektroskopischen (NMR, UV/Vis, MS) Methoden aufgeklärt. Im Mittelpunkt der
Untersuchungen steht die Untersuchung des Einflusses von unterschiedlichen Medien
(Lösungmittel, Oberflächen, Sol-Gel Materialien und Nachbarnmoleküle im Kristall) auf die
Lage der UV/Vis-Absorptionsmaxima verschiedener aromatischer Aminoketone. Die
Ergebnisse der Untersuchungen liefern Informationen in Bezug auf der spezifische
Solvotationsvermögen, die Polarität von Feststoffoberflächen, der Einfluss funktionaler
Gruppen in aromatischen Aminoketonen auf die intermolekulare Wasserstoff-
brückenbindungen in Kristallen, und über die Natur der Gast-Host- Wechselwirkungen.
Auf der Basis von nucleophilen Substitutionsreaktionen wurden zwei verschiedene
Prozesse für die Synthese von Poly(benzophenone-co-piperazin) und der Kompositform
entwickelt. Molekulare Strukturen und Eigenschaften konnten durch Elementaranalyse,
mehrere spektroskopische (IR, Festkörper-NMR, UV/Vis, MALDI-TOF) Methoden,
Zetapotentialmessungen in wässriger Phase und thermogravimetrischen Bestimmungen
charakterisiert werden.
Aromatische Aminoketonen, Aerosil 300, Sol-Gel-Prozess, Ormosile, Hybridmaterialien,
Solvatochromie, Acidität, Basizität, Dipolarität/Polarisierbarkeit, intermolekulare
Wasserstoffbrückenbindungen, Poly(benzophenone-co-piperazine).
Contents 3
Table of contents 3
List of publications 5
Acknowledgement 6
Symbols and abbreviations 7
I General part 10
1.1 Introduction 10
1.2 Solvatochromism 11
1.2.1 Aromatic amino ketones 12
1.2.2 Related compound 16
1.3 Sol-gel process 18
1.4 Aromatic amino ketone polymers 21
II Aim of this work 23
III Results and discussion 25
3.1 Aromatic amino ketones 25
3.1.1 UV/Vis absorption spectroscopy and linear solvation energy (LSE)
relationships 25
3.1.1.1 Solvent effects on the UV/Vis absorption spectra 25
3.1.1.2 Mathematical calculations based on LSE relationships 36
3.1.2 X-ray crystal structure analysis and powder reflectance UV/Vis
spectroscopy 52
3.1.2.1 Solid-state X-ray crystal structure analysis 52
3.1.2.2 UV/Vis diffuse reflectance spectra of the solid powders 63
3.1.3 Adsorption of aromatic amino ketones on Aerosil 300 68
3.1.4 Sol-gel materials containing aromatic amino ketones 73
3.1.4.1 Physical entrapment in a microporous silica network 73
3.1.4.2 Chemical linking to the silica network 83
3.2 N-(2’-hydroxy-4’-dimethylaminobenzylidene)-4-nitroaniline [HDBN] 90
3.2.1 UV/Vis absorption spectroscopy of HDBN 90
3.2.2 X-ray crystal structure analysis and powder reflectance UV/Vis
spectroscopy of HDBN 96
3.2.3 Adsorption of HDBN on Aerosil 300 99
3.3 Poly(benzophenone co-piperazine) and its silica-composite 102
3.3.1 Syntheses and structure analysis 102
3.3.2 Characterization 110
Contents 4
3.3.2.1 Electrokinetic data 110
3.3.2.2 Thermal stability 112
3.3.2.3 N2 adsorption/desorption data 114
3.3.3 Solvatochromic analysis 115
IV Summary 119
V Experimental section 123
5.1 General considerations 123
5.1.1 Instruments 123
5.1.2 Working procedures 125
5.1.3 Correlation analysis 125
5.1.4 Starting materials 125
5.2. Synthetic part 126
5.2.1 Aromatic amino ketones by Friedel Craft acylation reaction 126
5.2.2 Aromatic amino ketones by nucleophilic aromatic substitution reaction 129
5.2.3 3-(4-Di(2-hydroxyethyl)amino)phenyl-1-(2-furyl)-2-propene-1-one 132
5.2.4 N-(2’-hydroxy-4’-dimethylaminobenzylidene)-4-nitroaniline 132
5.3 Preparation of sol-gel hybrid materials 133
5.3.1 Physical entrapment in a microporous silica network 133
5.3.2 Chemical linking to the silica network 134
5.4 Poly(benzophenone co-piperazine) and its composite form 137
5.4.1. Solution polymerization 137
5.4.2. Solid-state polymerization 137
5.5 Crystal structure analyses 137
VI References 142
List of publications 5
List of publications
Original contributions:
1. El-Sayed, M.; Müller, H.; Rheinwald, G.; Lang, H.; Spange, S.: Linear solvation
energy (LSE) correlations of the solvatochromic response and x-ray structure
analysis of hydrophilically N-substituted Michler’s Ketone Derivatives. J. Phys.
Org. Chem. 2001, 14, 247-255.
2. Zimmermann, Y.; El-Sayed, M.; Prause, S.; Spange, S.: The Solvent-Like Nature
of Silica Particles in Organic Solvents. Monatsh. Chem. 2001, 132, 1347-1361.
3. Spange, S.; El-Sayed, M.; Müller, H.; Rheinwald, G.; Lang, H.; Poppitz, W.:
Solid-state Structures of N-substituted Michler’s Ketones and their relation to
Solvatochromism. Eur. J. Org. Chem. 2002, 24, 4159-4168.
4. El-Sayed, M.; Müller, H.; Rheinwald, G.; Lang, H.; Spange, S.: UV/Vis
spectroscopic properties of N-(2’-hydroxy-4’-N,N-dimethyl-aminobenzylidene)-
4-nitroaniline in various solvents and solid environments. Monatsh. Chem. 2003,
134, 361-370.
5. El-Sayed, M.; Müller, H.; Rheinwald, G.; Lang, H.; Spange, S.:
Solvatochromism, Crystallochromism, and Solid State Structures of
Hydrophilically Functionalized Aromatic Amino Ketones containing Furan and
Thiophene Rings. Chem. Mat. 2003, 15, 746-754.
Poster:
1. El-Sayed, M.; Schmidt, C.; Spange, S.; Kricheldorf, H.: Hydrophilically
Functionalized Michler’s Ketone Derivatives as Polarity Probes for Different
solid Materials. Berliner Polymerntage 2000, Poster (P 64, page 127), Berlin, 9. -
11. October 2000.

Acknowledgement 6
Acknowledgement
The experimental part of this work was carried out in the laboratories of Prof. Dr.
Stefan Spange, Chemnitz University of Technology from July 1998 until April 2002.
First of all, I wish to express my deep thanks and gratitude to Prof. Dr. Stefan Spange,
who welcomed me in his research group, who introduced me into German life and who
suggested the point and successfully guided me through my studies.
I would like to thank Prof. Dr. Heinrich Lang very much for his scientific support in crystal
structure analyses, and his evaluation of this thesis.
I would also like to thank Dr. Gerd Rheinwald for X-ray intensity data collection.
My deepest thanks are also to Dr. Hardy Müller for his interest and continuous
encouragement.
I would like to thank staff members in our research group for their co-operation, friendship
by means which the daily work has always been a pleasure.
I want to express my deepest gratitude to my parents Kauther El-Gamel and Mohamed El-
Sayed, and to my sister Frial and to my brothers Ashraf and Ibrahim for their constant
support and understanding.
I extend my thanks to my wife Dr. Eng. Hanan Koutta and my daughters Mirna and Manar
for understanding my demanding work and long working hours.
Finally, I would like to thank the Germany Ministry of Education, the Fonds der Chemischen
Industrie, Frankfurt am Main and Chemnitz University of Technology for their financial
support.
Symbols and abbreviations 7
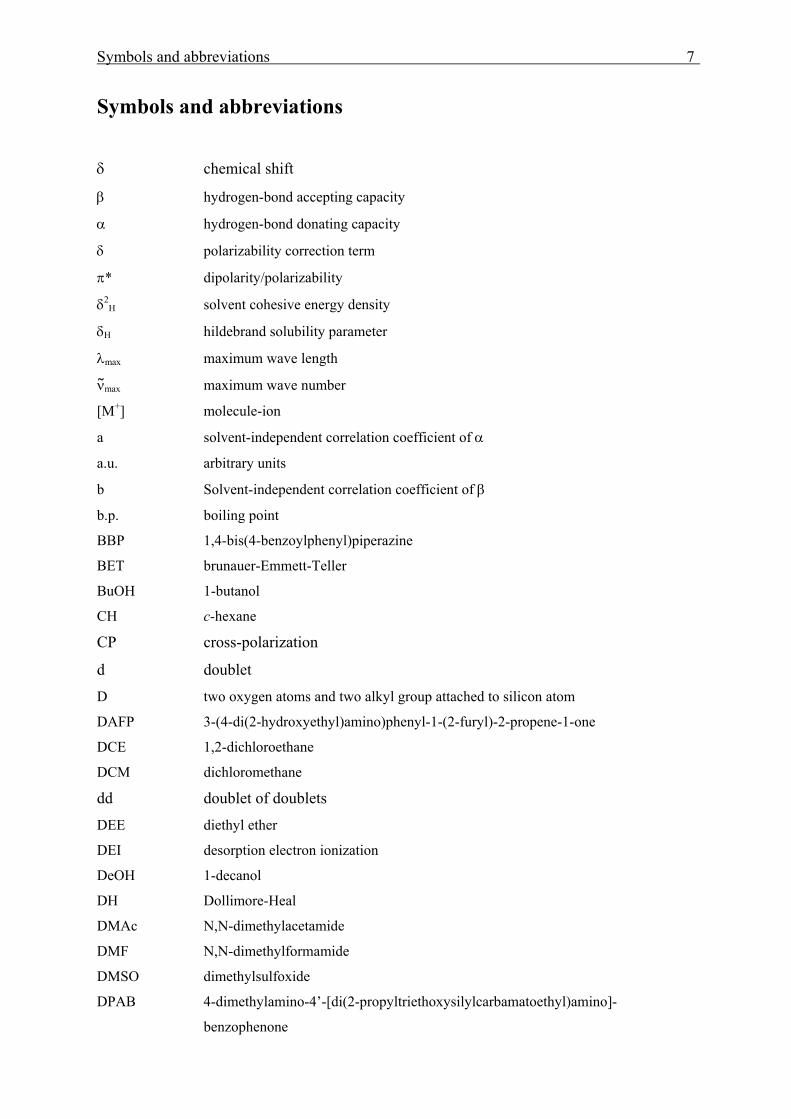
Symbols and abbreviations
δ chemical shift
β hydrogen-bond accepting capacity
α hydrogen-bond donating capacity
δ polarizability correction term
π* dipolarity/polarizability
δ2H solvent cohesive energy density
δH hildebrand solubility parameter
λmax maximum wave length
νmax maximum wave number
[M+] molecule-ion
a solvent-independent correlation coefficient of α
a.u. arbitrary units
b Solvent-independent correlation coefficient of β
b.p. boiling point
BBP 1,4-bis(4-benzoylphenyl)piperazine
BET brunauer-Emmett-Teller
BuOH 1-butanol
CH c-hexane
CP cross-polarization
d doublet
D two oxygen atoms and two alkyl group attached to silicon atom
DAFP 3-(4-di(2-hydroxyethyl)amino)phenyl-1-(2-furyl)-2-propene-1-one
DCE 1,2-dichloroethane
DCM dichloromethane
dd doublet of doublets
DEE diethyl ether
DEI desorption electron ionization
DeOH 1-decanol
DH Dollimore-Heal
DMAc N,N-dimethylacetamide
DMF N,N-dimethylformamide
DMSO dimethylsulfoxide
DPAB 4-dimethylamino-4’-[di(2-propyltriethoxysilylcarbamatoethyl)amino]-
benzophenone
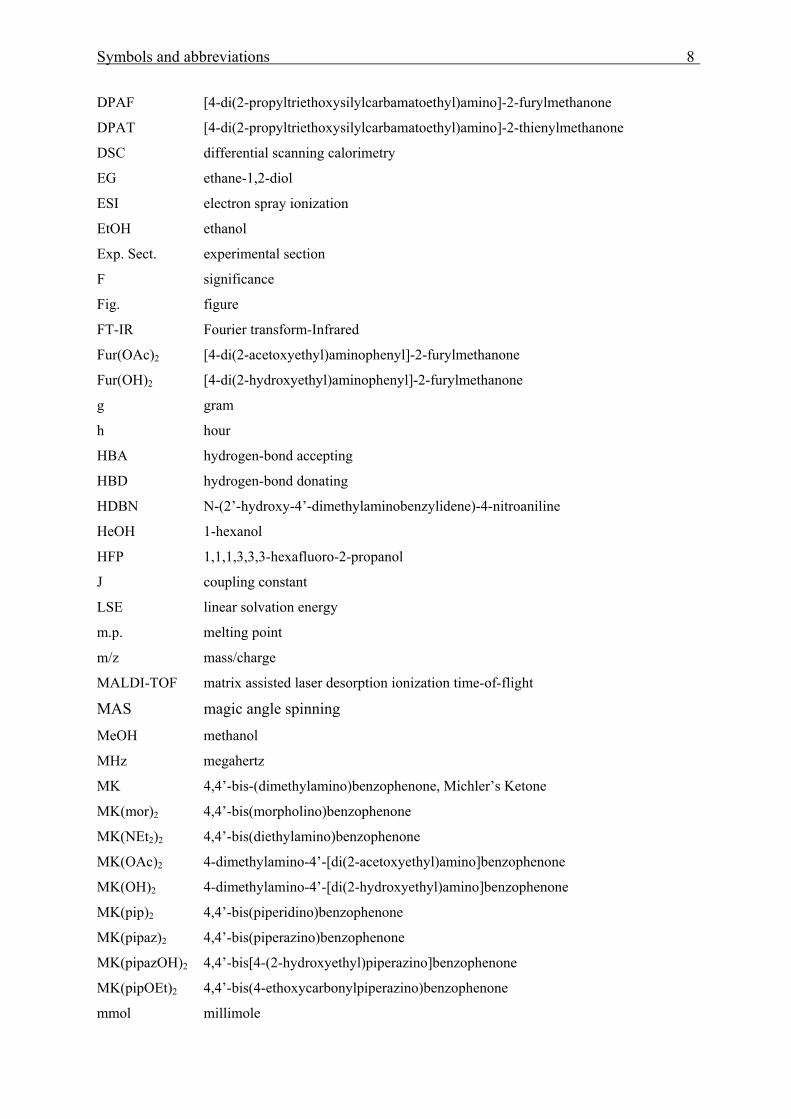
Symbols and abbreviations 8
DPAF [4-di(2-propyltriethoxysilylcarbamatoethyl)amino]-2-furylmethanone
DPAT [4-di(2-propyltriethoxysilylcarbamatoethyl)amino]-2-thienylmethanone
DSC differential scanning calorimetry
EG ethane-1,2-diol
ESI electron spray ionization
EtOH ethanol
Exp. Sect. experimental section
F significance
Fig. figure
FT-IR Fourier transform-Infrared
Fur(OAc)2 [4-di(2-acetoxyethyl)aminophenyl]-2-furylmethanone
Fur(OH)2 [4-di(2-hydroxyethyl)aminophenyl]-2-furylmethanone
g gram
h hour
HBA hydrogen-bond accepting
HBD hydrogen-bond donating
HDBN N-(2’-hydroxy-4’-dimethylaminobenzylidene)-4-nitroaniline
HeOH 1-hexanol
HFP 1,1,1,3,3,3-hexafluoro-2-propanol
J coupling constant
LSE linear solvation energy
m.p. melting point
m/z mass/charge
MALDI-TOF matrix assisted laser desorption ionization time-of-flight
MAS magic angle spinning
MeOH methanol
MHz megahertz
MK 4,4’-bis-(dimethylamino)benzophenone, Michler’s Ketone
MK(mor)2 4,4’-bis(morpholino)benzophenone
MK(NEt2)2 4,4’-bis(diethylamino)benzophenone
MK(OAc)2 4-dimethylamino-4’-[di(2-acetoxyethyl)amino]benzophenone
MK(OH)2 4-dimethylamino-4’-[di(2-hydroxyethyl)amino]benzophenone
MK(pip)2 4,4’-bis(piperidino)benzophenone
MK(pipaz)2 4,4’-bis(piperazino)benzophenone
MK(pipazOH)2 4,4’-bis[4-(2-hydroxyethyl)piperazino]benzophenone
MK(pipOEt)2 4,4’-bis(4-ethoxycarbonylpiperazino)benzophenone
mmol millimole
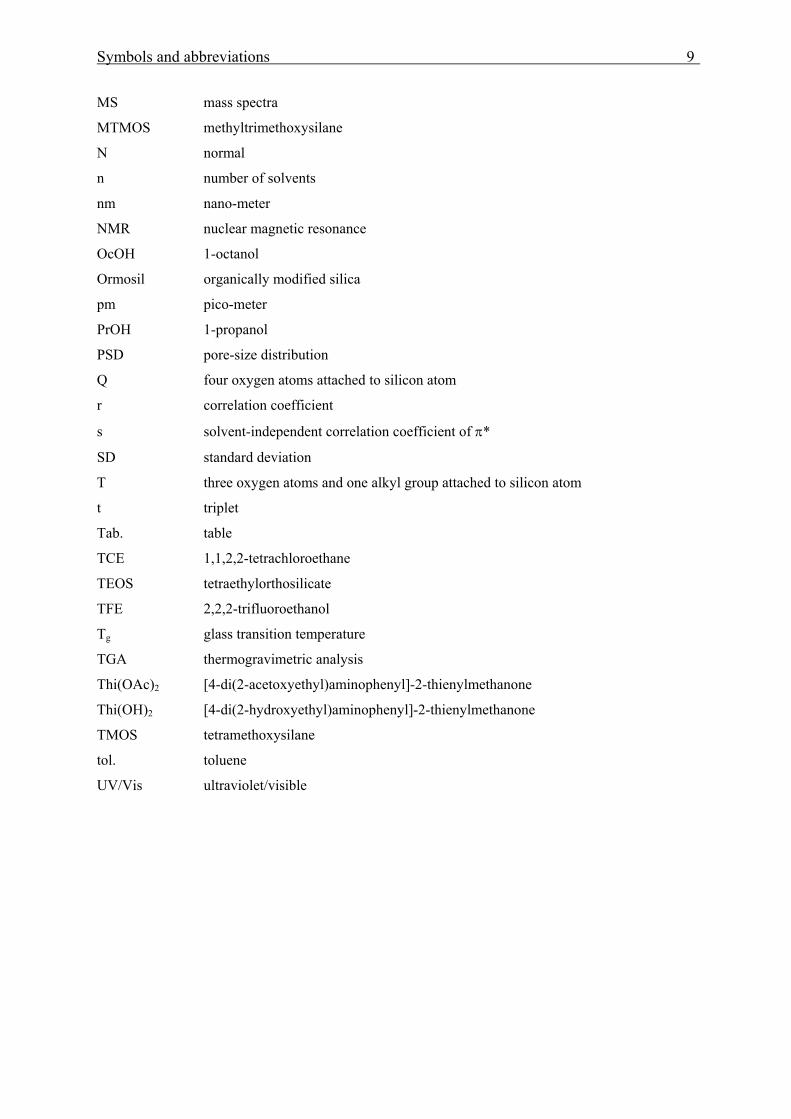
Symbols and abbreviations 9
MS mass spectra
MTMOS methyltrimethoxysilane
N normal
n number of solvents
nm nano-meter
NMR nuclear magnetic resonance
OcOH 1-octanol
Ormosil organically modified silica
pm pico-meter
PrOH 1-propanol
PSD pore-size distribution
Q four oxygen atoms attached to silicon atom
r correlation coefficient
s solvent-independent correlation coefficient of π*
SD standard deviation
T three oxygen atoms and one alkyl group attached to silicon atom
t triplet
Tab. table
TCE 1,1,2,2-tetrachloroethane
TEOS tetraethylorthosilicate
TFE 2,2,2-trifluoroethanol
Tg glass transition temperature
TGA thermogravimetric analysis
Thi(OAc)2 [4-di(2-acetoxyethyl)aminophenyl]-2-thienylmethanone
Thi(OH)2 [4-di(2-hydroxyethyl)aminophenyl]-2-thienylmethanone
TMOS tetramethoxysilane
tol. toluene
UV/Vis ultraviolet/visible
General part 10
I. General part
1.1 Introduction
The color change of a compound induced by external influences, e. g. by solvents
(solvatochromism), applied stress (mechanochromism), salts (halochromisms) and/or
temperature (thermochromism) has been studied intensively over the last decades.1-9 In this
context, solvatochromic dyes have been established as empirical polarity indicators for
solvents, solvent mixtures and solution of several solutes in various liquids.1,10-13 This
empirically derived concept for volume effects has been also widespread applied to evaluate
the internal and external polarities of surfaces of macro-molecular and related materials.14-24
In this sense, the term surface polarity is an argument often used in interpreting experimental
results obtained from Chromatography22 and heterogeneous catalysis.25 The effect of solid
matrix is important, because many compounds (such as dyes, stabilizers and others) are
applied as components of a more complex system in the solid phase. Therefore it is important
to evaluate the medium effect for these systems as well.
The solvatochromic effects of rigid matrices are complex and as yet less understood as
compared with solvents. It is important to take into account not only the matrix itself but its
mode of preparation and the way in which the solute has been incorporated into the matrix.
To date, no generally agreed upon definition of the term surface polarity has emerged. In the
broadest and most general sense the surface polarity can be viewed as the sum of all
interactive forces between an adsorbed molecule and the occupied surface site or sites. This
definition is based on the related interpretation of the term solvent polarity.1,26 Most solvent
polarity scales are empirical and are based on kinetic, thermodynamic, or spectroscopic data
relating to certain reference reactions.1 Significantly, different empirical solvent polarity
scales have been shown to correlate well with each other, pointing to the existence of an
underlying common feature.1
Since, a chromophor is covalently functionalized by a polar group or another suitable
moiety for molecular recognition in its periphery, manifold influences on the UV/Vis spectra
can result from the intermolecular interaction in the solid-state (crystal) or in molecular
aggregates of the dye.27-31 Thus, quantum size effects have been observed for organic nano-
crystals29 and carotenoid dye nano-particles.28 However, two different influences, the supra-
molecular structure and quantity of accumulated dye molecules in the nanocrystal seem of
importance for the resulting UV/Vis spectroscopic property. Because both influences are
General part 11
associated properties, a reasonable interpretation of the UV/Vis spectrum of those nanosized
dye aggregates is still complicated and requires further experimental results and theoretical
studies.
Examination of chromophoric aggregates and supramolecular structures by UV/Vis
spectroscopy is an experimental challenge and of importance both for academic research and
for practical applications in nano-science.28-31 For this objective, the exact knowledge of
solid-state structures (X-ray structure analysis) is necessary and the corresponding UV/Vis
spectra have to be significantly different as function of structure variation. This requires the
choice of suitable model systems which show color changes as function of nature of
accumulation processes.
1.2 Solvatochromism
Solvatochromism is defined as the pronounced change in position and sometimes
intensity of an electronic absorption or emission band accompanying a change in the polarity
of the medium.1 This medium may include solids, micelles, organized molecular films and
even a vacuum, apart from liquid solvents.1c Solvatochromic shifts result from the difference
of solvation energies between the two electronic states involved in the observable absorption
or emission transition. These shifts are important for the description of the relative energies of
electronic states, the dipole moment and polarizability of molecules. In addition they often
provide information about specific interactions such as hydrogen bonding.
Quantification of general properties of solvents and micelle environments has been
studied by physical organic chemists for many years.1 Using solvatochromic probe dyes has
several advantages: the measurements require very low concentrations of the probe
molecules, are easy to do, and reproduce well. The requirement is that the employed probe
dye must adequately reflect the relevant properties of the environment under study. The
responses of solvatochromic indicators on changing solvent environments have been used as
the phenomenological basis for several empirical „solvent polarity“ scales.1b Among such
quantitative scales, the Kamlet-Taft system1,32 is the most inclusive with respect to all solvent
types and it is well supported by theoretical reaction field models for the solvent influences
upon the solvatochromic probes.32,33
The general equation for the influence of solvent effects on a single solute is shown as
eq 1,1,10,32 where XYZ is the property to be correlated
XYZ = (XYZ)0 + hδ2H + s(π* + dδ) + aα + bβ (1)
General part 12
(XYZ)0 is a property relating to a standard process, δ2H is the solvent cohesive energy density
(δH is the Hildebrand solubility parameter), π* is the dipolarity/polarizability, δ represents a
polarizability correction term, α is the hydrogen-bond donating (HBD) capacity, and β is the
hydrogen-bond accepting (HBA) capacity.32 This linear solvation energy (LSE) relationship is
suitable for experimental proving of solvent effects, because it simply allows the separation of
“dipolarity/polarizability” from other solvent-solute interactions such as hydrogen bonding by
a multiple square correlation analysis. However, the parameters used in multi-parameter LSE
relationships are seldom interrelated, featuring just different blends of fundamental
intermolecular forces. This makes the interpretation of individual polarity parameters relating
to non-specific or specific interaction mechanism in special cases ambiguous.
1.2.1 Aromatic amino ketones
Aromatic aminoketones of the Michlers Ketone type and related compounds have
already been widely investigated thanks to their outstanding solvatochromic and
photophysical properties.2,34-39 They are also of importance as precursors for producing a
photo-initiator for cationic polymerization38 and di- and triphenylmethylium cations.41-43
Mayr et al. have recently shown that the electrophilicity of bis-[4-N,N-substituted]
diphenylmethylcarbenium ions significantly depends on the substitution at the nitrogen
atoms.41
Solvatochromic properties of Michler’s Ketone 4,4’-bis(dimethylamino)benzophenone
MK 4g and related compounds have been established as a suitable tool for investigating the
polarity of various liquids2,37,39,44 and solid environments, such as functionalized silica
particles, amino acid crystals, polyamino acids, and synthetic and native macromolecular
materials. 14a,15-18,45-47 In this context, we were able to show that the polarity observed by MK
and two related probes does not only depend on its chromophoric π-electron system, but also
on the quantity of hydrophilic substituents located at the periphery of the probe.47 The
introduction of polar groups at the nitrogen atom(s) of MK, for example –CH2-CH2-OH
moieties, gives rise to specific interactions with the carbonyl group in the solid-state (crystals)
or in aggregated forms of them, when adsorbed externally on solid surfaces, because the –
CH2-CH2-OH substituent has an effect like an internal polar solvent.2,47 These specific
intermolecular interactions cause significant changes in the UV/Vis spectrum
(bathochromicity) of the material which corresponds to structural features.2
General part 13
Since ground-state aromaticity of thiophene or furan is lower than that of the benzene ring and
the solubility of thiophene or furan derivative is usually higher than that of the parent benzene
compounds, much attention has recently been paid to solvatochromic compounds that contain
thiopene.48-52 Similar compounds found a wide range of application in the field of nonlinear
optics and nano-technology devices.48-50
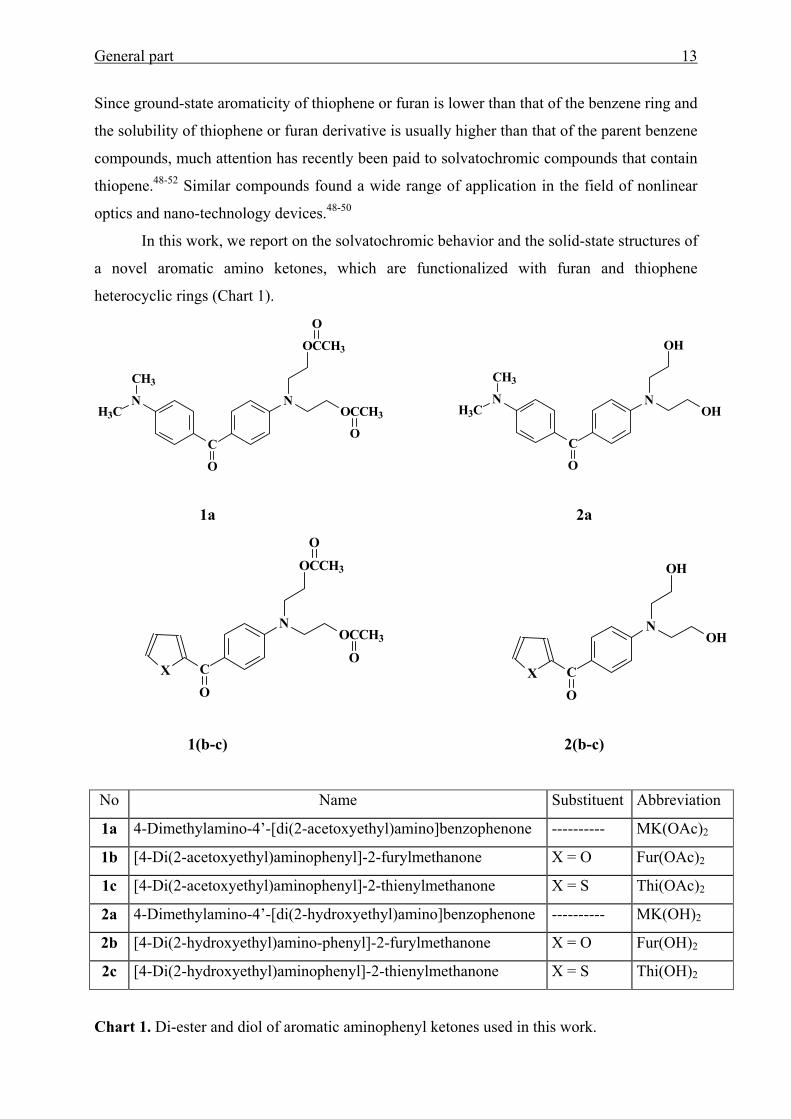
In this work, we report on the solvatochromic behavior and the solid-state structures of
a novel aromatic amino ketones, which are functionalized with furan and thiophene
heterocyclic rings (Chart 1).
C
O
NN
OCCH3
OCCH3
CH3
H3C
O
OC
O
NN
OH
OH
CH3
H3C
1a 2a
C
O
N
OCCH3
OCCH3
O
OX C
O
N
OH
OH
X
1(b-c) 2(b-c)
Chart 1. Di-ester and diol of aromatic aminophenyl ketones used in this work.
No Name Substituent Abbreviation
1a 4-Dimethylamino-4’-[di(2-acetoxyethyl)amino]benzophenone ---------- MK(OAc)2
1b [4-Di(2-acetoxyethyl)aminophenyl]-2-furylmethanone X = O Fur(OAc)2
1c [4-Di(2-acetoxyethyl)aminophenyl]-2-thienylmethanone X = S Thi(OAc)2
2a 4-Dimethylamino-4’-[di(2-hydroxyethyl)amino]benzophenone ---------- MK(OH)2
2b [4-Di(2-hydroxyethyl)amino-phenyl]-2-furylmethanone X = O Fur(OH)2
2c [4-Di(2-hydroxyethyl)aminophenyl]-2-thienylmethanone X = S Thi(OH)2
General part 14
Also, because of the usefulness of MK derivatives for solvatochromic studies, due to
the large extent of the bathochromic solvatochromic shift observed in increasing the
environments polarity,2,37,52 we intended to study the influence of substituents at the nitrogen
atom of MK on the UV/Vis spectroscopic properties in the solid-state and in various solvents
of different polarity. It is expected that acid-base interactions (hydrogen bonds) and dipolarity
/polarizability effects cause significant shifts in the UV/Vis spectra of those compounds
which are associated with the structure of the crystal as well as solvation behavior in well
behaved regular solvents. For this work, in extension to earlier study on MK, we have chosen
the following N-substituted Michler’s Ketones including 4,4’-bis[di(2-hydroxyethyl)-
amino]benzophenone MK(OH)4 3, 4,4’-bis(4-ethoxycarbonylpiperazino)benzophenone
MK(pipOEt)2 4a, 4,4’-bis(piperidino)benzophenone MK(pip)2 4b, 4,4’-bis(morpholino)-
benzophenone MK(mor)2 4c, 4,4’-bis(piperazino)benzophenone MK(pipaz)2 4d, 4,4’-bis[4-
(2-hydroxyethyl)piperazino]benzophenone MK(pipazOH)2 4e, and 4,4’-bis(diethyl-
amino)benzophenone MK(NEt2)2 4f as shown in Chart 2.

General part 15
C
O
R2R1
Chart 2. Michler’s ketones used in this work.
The linking of two identical solvatochromic chromophors by a rigid spacer
(piperazine) was also used as a model to study the influence of molecular polarity of the
chromophore itself on each other. Both chromophors are oppositely arranged concerning their
own dipolar direction (Chart 3)
No R1 R2 Abbreviation
3 NCH2CH2OH
CH2CH2OH
NCH2CH2OH
CH2CH2OH
MK(OH)4
4a NN C
O
OC2H5 NN C
O
OC2H5
MK(pipOEt)2
4b N
N
MK(pip)2
4c N O
N O
MK(mor)2
4d NN H
NN H
MK(pipaz)2
4e NN CH2CH2OH NN CH2CH2OH
MK(pipazOH)2
4f NCH2CH3
CH2CH3
NCH2CH3
CH2CH3
MK(NEt2)2
4g NCH3
CH3
NCH3
CH3
MK

General part 16
C
O
N N C
O
Chart 3. 1,4-bis(4-benzoylphenyl)piperazine BBP 5.
The specific question to be answered is: do both solvatochromic moieties compensate
their dipolarity or not and how is this effect detectable by means of UV/Vis spectroscopy?
To evaluate the respective contribution of vinylene spacer on the solvatochromic
properties, 3-(4-di(2-hydroxyethyl)amino)phenyl-1-(2-furyl)-2-propene-1-one [DAFP] 6
(Chart 4) was synthesized. The difference between Fur(OH)2 2b and DAFP 6 is evidently, in
the insertion of a single vinylene group between the carbonyl and the N,N-di-
hydroxyethylaminophenyl group to the backbone of 2b.
H
HC
N
HO
OH
O O Chart 4. 3-(4-Di(2-hydroxyethyl)amino)phenyl-1-(2-furyl)-2-propene-1-one [DAFP] 6.
This novel compound belongs to the α,β-unsaturated ketones of heterocyclic series.
The presence of a single vinylene group between the dimethylaminophenyl and carbonyl
group in this type of compounds is sufficient for the appearance of luminescence under
ordinary conditions.53
1.2.2 Related compound
The concepts for the molecular design of the dyes include the introduction of multiple
(both positive and negative) charges on both ends of the large conjugated π-electron system of
the dye molecule, so that the dye interacts with many chemical species or environments, the
General part 17
introduction of different substitution (electron-donating or electron-accepting) groups in the
conjugated π-electron system of the dye molecule, so that the dye has a different pKa and
solvatochromic property, and the introduction of an immobilization site in the dye molecule,
so that the dye can be easily prepared as a sensing probe.54
Based on these concepts, push-pull substituted aromatic azomethine compounds like
salicylidene-anilines can manifold interact with acids and bases as well as polar solvent
molecules, because both several basic and acidic sites as well as a dipolar delocalized π -
electron system is present.55-61 This makes the interpretation of the change of UV/Vis
spectrum as function of external influences sometimes difficult.
Therefore, it is of interest to know whether acid-base interaction and different
solvation of highly polar molecules can be treated with the same concept derived from
“indicator” chemistry or solvatochromism. Furthermore, the knowledge of the structure of the
molecules in the solid-state (crystal) and its relation to the color is of importance to
understand effects of crystallochromism with respect to dipolar and acid-base interactions for
NLO and photochromic applications in thin films and optical devices. For this study, we have
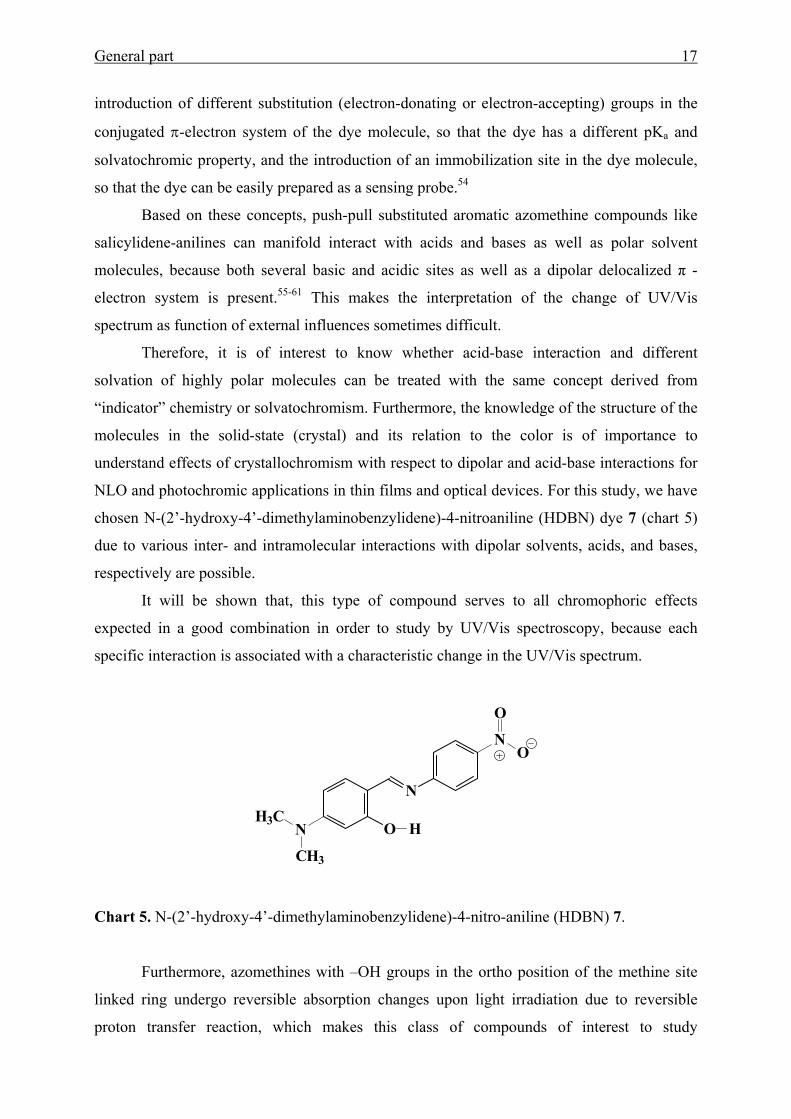
chosen N-(2’-hydroxy-4’-dimethylaminobenzylidene)-4-nitroaniline (HDBN) dye 7 (chart 5)
due to various inter- and intramolecular interactions with dipolar solvents, acids, and bases,
respectively are possible.
It will be shown that, this type of compound serves to all chromophoric effects
expected in a good combination in order to study by UV/Vis spectroscopy, because each
specific interaction is associated with a characteristic change in the UV/Vis spectrum.
N
O HNH3C
N
O
O
CH3
Chart 5. N-(2’-hydroxy-4’-dimethylaminobenzylidene)-4-nitro-aniline (HDBN) 7.
Furthermore, azomethines with –OH groups in the ortho position of the methine site
linked ring undergo reversible absorption changes upon light irradiation due to reversible
proton transfer reaction, which makes this class of compounds of interest to study
General part 18
photocrystallochromic effects as function of acid-base interaction e.g. in mixed crystals. The
general agreement56-60 about the photocoloration processes of hydrazones such as
salicylidene-aniline derivatives was also suggested as the mechanism of intramolecular proton
transfer from the O-hydroxyl group to the lone electron pair of the imine (-CH=N-) nitrogen
atom.
Intramolecularly hydrogen-bonded Schiff bases have attracted considerable attention,
because they exhibit also thermochromism. Thus the study of their structure related
properties, like environmentally influenced tautomerism equilibria, is of special importance.
Extensive studies have revealed that the thermochromism of N-salicylidene aniline
derivatives originates from the tautomerism between the OH and NH forms.60 However, due
to the high proton exchange rate, it is not possible to isolate the individual tautomeric forms.
Consequently, quantitative analysis of these processes, as well as relationships
between structural properties and tautomers, are difficult to obtain.
Therefore, it was of interest to study of the environmental effects (solvent, sol-gel
glasses, neighboring groups and molecules in the crystal) of the salicylidene aniline 7 bearing
both strong electron-donating and-withdrawing moieties in the same molecule.
1.3 Sol-gel process
Sol-gel-derived organic-inorganic nanocomposites have received a great importance in
scientific and technological interests during the past two decades.62-66 Sol-gel processing
involves hydrolysis and polycondensation of molecular precursors, mostly metal and
semimetal alkoxides, under ambient conditions and leads to the formation of ceramic
materials.67-69
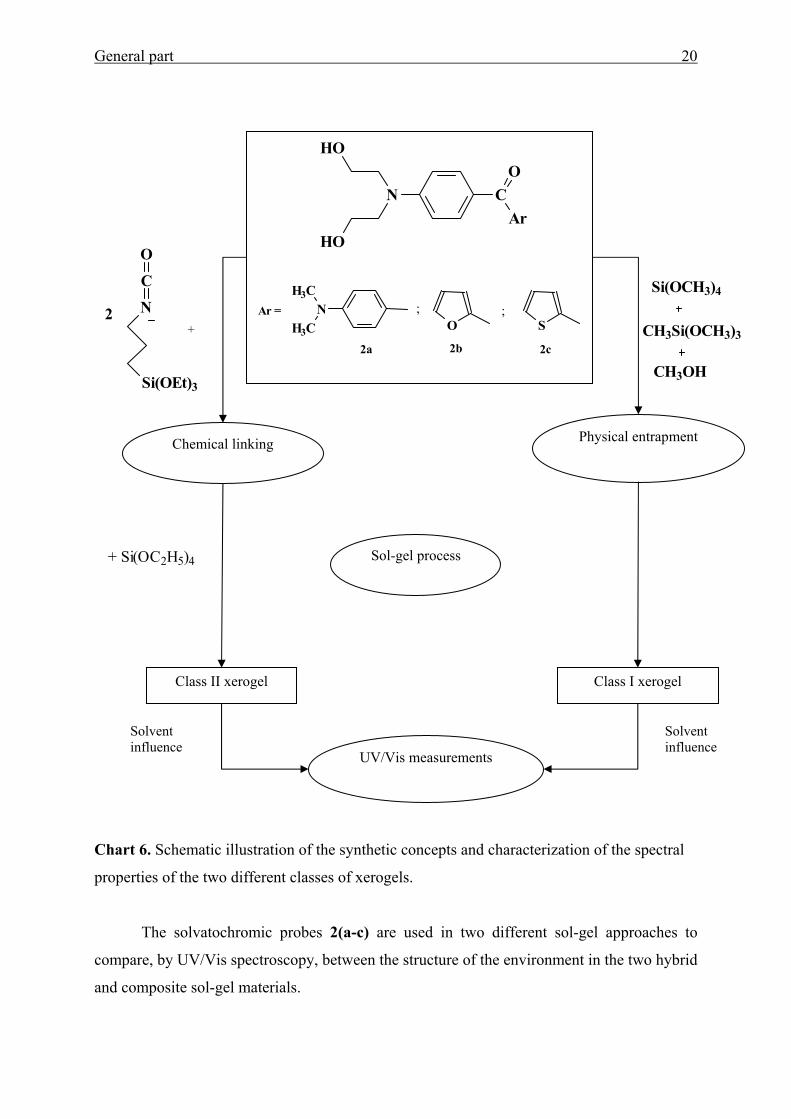
The sol-gel process is amenable to the incorporation of organic moieties in inorganic
matrixes, in both hybrid and composite forms (Chart 6). There are two different types of sol-
gel materials that have been extensively used in the past. In these, organic chromophores can
be either physically blended with the silica network or chemically bound to tri(alkoxy)silanes
before hydrolytic condensation.70 Probing the microenvironment of the entrapped molecules
in the nanocomposites is another area of interest.71-78 Of utmost importance in many
applications of sol-gel derived materials is the nature of reagent entrapment.79
Device performance is strongly influenced by the translational and rotational mobility
of entrapped species, the degree and chemical nature of molecular interactions with the wall
of the matrix, and molecular scale properties (polarity, rigidity) of the individual cages/pores
General part 19
in the host framework. As a result, numerous bulk spectroscopic, electrochemical, and
chemical studies have been performed.70,71,77,79-91 These previous studies have established that
the incorporated organic moieties remain accessible to species which are in contact with the
organic-inorganic hybrid or composite, due to the porosity of the matrix.70,79 Furthermore, the
properties of the hybrid or composite can be tuned to achieve specific requirements by
varying reaction conditions. Additionally, by choosing an appropriate organic moiety and
maintaining optical transparency, the silica-based material would be suitable for spectroscopic
and spectroelectrochemical applications.
In this work the solvatochromic aromatic amino ketones 2(a-c) (Chart 6), 3, and/or 4g
are employed in order to follow the variations in the cage interfacial polarities of Ormosils
prepared by the sol-gel process from various proportions of methyltrimethoxysilane
(MTMOS) and tetramethoxysilane (TMOS).75
Sol-gel derived chromophore-bound materials are prepared according to the standard
synthetic procedures70,92,93 by linking MK(OH)2, Fur(OH)2 and/or Thi(OH)2 to 3-isocyanato-
propyltriethoxysilane (IP-TriEOS) followed by hydrolysis and condensation with
tetraethoxysilane (TEOS) in presence of hydrochloric acid as a catalyst to enhance the
formation of an amorphous silica network (see Chart 6). The resulting cross-linked matrixes
were spectroscopically characterized.
General part 20
Chart 6. Schematic illustration of the synthetic concepts and characterization of the spectral
properties of the two different classes of xerogels.
The solvatochromic probes 2(a-c) are used in two different sol-gel approaches to
compare, by UV/Vis spectroscopy, between the structure of the environment in the two hybrid
and composite sol-gel materials.
C
N
Si(OEt)3
O
2+
Si(OCH3)4
CH3Si(OCH3)3
CH3OH
Physical entrapment Chemical linking
+ Si(OC2H5)4 Sol-gel process
Class II xerogel Class I xerogel
UV/Vis measurements
Solvent influence
Solvent influence
N
HO
HO
OC
Ar
O SH3CN
H3C; ;Ar =
2a 2b 2c
General part 21
1.4 Aromatic amino ketone polymers
Polyketones are high-performance materials and have several attractive properties
including high glass transition temperature (Tg) and thermal stability because of the
incorporation of carbonyl and/or aromatic groups in the polymer backbones, as well as the
ease of modification to other functionalized polymers.94 Moreover, aliphatic polyketones have
been used as photodegradable polymers.95 Aromatic polyketones are typically synthesized by
Friedel-Crafts or nucleophilic aromatic substitution reactions.96 These materials are usually
insoluble and intractable. Aliphatic polyketones have been prepared through the
copolymerization of CO with ethylene or α-olefines.97
Donor-acceptor polymers have received increased attention recently due to their low
band gaps, luminescence, and potential third-order nonlinear optical properties.98
Piperazines form the backbone of many biologically interesting molecules.99 Their
incorporation into biologically active molecules has even been associated with an increase in
potency.100 Very recently, several new methods have been proposed for the synthesis of such
compounds using solid support101 or palladium-catalyzed aromatic amination reaction.102
Supported reagents on mineral oxide surfaces have been widely employed in organic
synthesis.103 Reagents immobilized on porous solid materials have several advantages over
the conventional solution phase reactions because of the good dispersion of active sites
leading to improved reactivity and milder reaction conditions. The recyclability of the
inorganic solid support is often possible thus rendering the procedure relatively
environmentally acceptable. In addition, polymer nanocomposites, especially polymer-layered
silicate nanocomposites, represent a rational alternative to conventionally filled polymers.
Because of their nanometer scale dispersion, nanocomposites exhibit markedly
improved properties when compared with the pure polymers or conventional composites.104
Polymer-layered silicate nanocomposites possess several advantages such as: (a)
mechanical properties that are potentially superior to fiber-reinforced polymers; (b) a lighter
weight compared to conventionally filled polymers, because high degrees of stiffness and
strength can be realized with far less high-density inorganic materials; and (c) their
outstanding diffusional barrier properties without requiring multipolymer layered design.105
Aromatic aliphatic polyketones containing piperazine moiety (donor) in the polymer
backbone have, however, not been reported. We described herein two different processes
based on nucleophilic substitution reactions for preparation of poly(benzophenone co-
piperazine).

General part 22
We first investigated the polymerization reaction in solution using dimethylsulfoxide
(DMSO) as solvent and potassium carbonate as a base. Secondly, we developed a facile
solvent-free method for synthesis of poly(benzophenone co-piperazine).
Aim of the work 23
II Aim of this work
The design and development of novel optical chemical sensors (optodes) are subject of
active research in recent years for both chemists and physicists.106 In relation to these optodes,
functional dyes such as solvatochromic dyes,1 pH indicator dyes,107 fluorescent dyes,108 and
their derivatives109 play an important role in the signal transduction process of detecting
analytes using optodes. As pointed out in Section 1.2.1 a significant interest has been
generated during the past decade in the field of preparing aromatic aminoketones of the
Michlers Ketone type and related compounds for various applications. Therefore it should be
of interest to investigate the incorporation of these chromophores into macromolecular
architectures.
This approach generally requires the introduction of appropriate reactive
functionalities, such as hydroxy groups, at the electron donating site of the chromophore. The
bis-(hydroxyethyl)-amino substituent was chosen to mimic the dimethylamino group’s steric
and electronic (inductive) effects and to provide a reactive site for further attachment.
The nature of the local microenvironment(s) within a sol-gel-derived nanocomposite is
an important factor in designing materials for sensing or photonic application. For example,
factors such as microscopic phase separation can dramatically alter the behavior of dopants
within a nanocomposite. Furthermore, the environment experienced by the dopant (i.e.,
polarity, local microviscosity, interactions with pore walls, and preferential partitioning into a
given phase) will have an impact on the dynamics, stability, and accessibility of the dopant
and as such may lead to unwanted material properties.
The need to understand the nature of the local microenvironments within
nanocomposites requires a method that is sensitive to phenomena occurring at the molecular
scale. In these instances UV/Vis absorption spectroscopy is the method of choice as it reports
on the local microenvironment surrounding a probe molecule.75
One aim of this thesis was the synthesis of novel functionalized aromatic amino
ketones containing bis-(hydroxyethyl)amino substituent and study of the environmental
effects (solvent, solid surfaces, sol-gel glasses and neighboring molecules in the crystal) on
their UV/Vis spectra. From these studies, a large amount of information concerning the
polarity of the solid surfaces, the substituent-effect in aromatic amino ketones on the solvent
polarity parameters, the intermolecular hydrogen bonding in solid crystals and in their
solutions, and the nature of the guest-host interactions was obtained.

Aim of the work 24
The evaluation of the solvatochromic response of related compound (HDBN)
containing more extended double bonds was another aim of this work.
Furthermore, in the following sections, the generation of a novel polymer containing
4,4’-bis-(piperazino)benzophenone moiety is introduced. The structure of this polymer had to
be elucidated by spectroscopic methods (solid-state-NMR, UV/Vis spectroscopy, and
MALDI-TOF spectroscopy.
Results and discussions 25
III Results and discussion
3.1 Aromatic amino ketones
3.1.1 UV/Vis absorption spectroscopy and linear solvation energy (LSE) relationships
3.1.1.1 Solvent effects on the UV/Vis absorption spectra
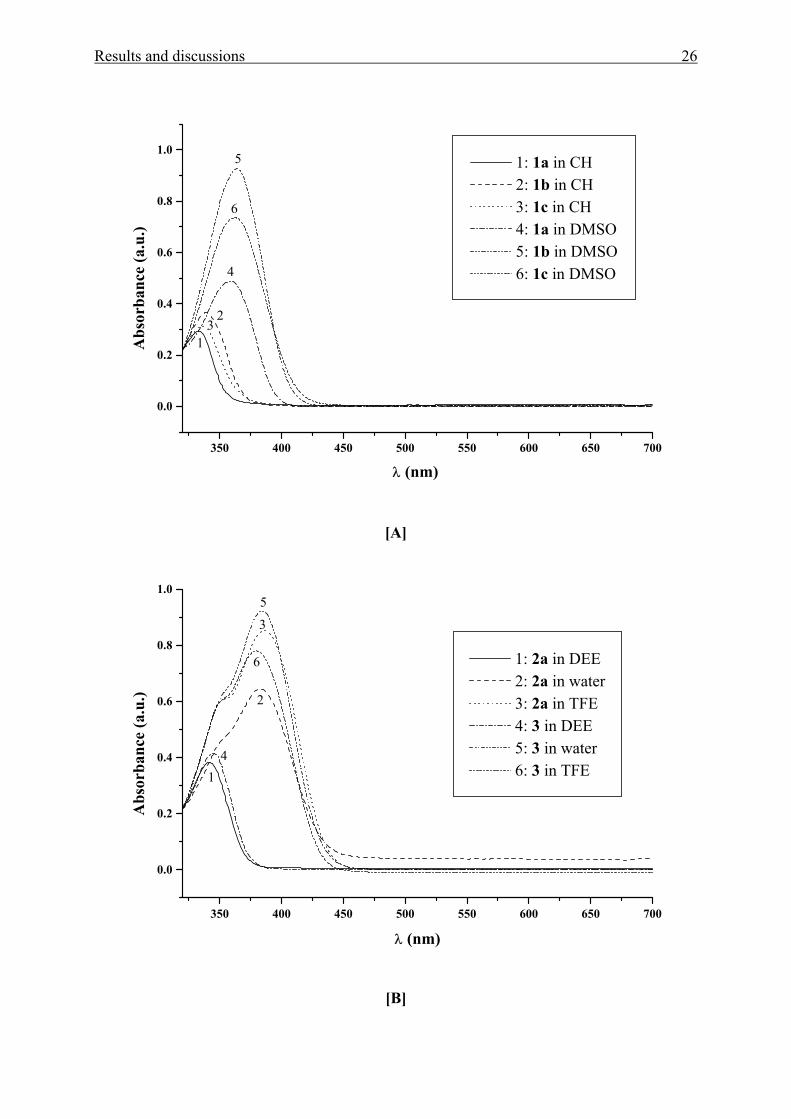
The UV/Vis absorption spectra of the solvatochromic UV/Vis band (the longest
wavelength band of the π- π* transition) of 1(a-c), 2(a-c), 3, 4(a-f), 5 and 6 have been
measured in 32 most common solvents at 293 K as shown in Tables (1-3). Solvents are used
with wide-ranging properties for which α, β, and π* are known.10
Altogether, in increasing the solvent polarity from cyclohexane (CH) to 1,1,1,3,3,3-
hexafluoro-2-propanol (HFP) (Tables 1-3), the UV/Vis absorption spectra of MK(OAc)2 1a
Fur(OAc)2 1b, Thi(OAc)2 1c, MK(OH)2 2a, Fur(OH)2 2b, Thi(OH)2 2c, MK(OH)4 3,
MK(pipOEt)2 4a, MK(pip)2 4b, MK(mor)2 4c, MK(NEt2)2 4f, BBP 5 and DAFB 6 show a
significant bathochromic shift of the long-wavelength UV/Vis band. A representative series of
UV/Vis spectra is shown in Fig. 1[A-E] for compounds 1(a-c), 2a, 3, 4(b-c), 4f, 5 and 6.
Results and discussions 26
350 400 450 500 550 600 650 700
0.0
0.2
0.4
0.6
0.8
1.0
3
6
5
4
2
1
1: 1a in CH 2: 1b in CH 3: 1c in CH 4: 1a in DMSO 5: 1b in DMSO 6: 1c in DMSO
Abs
orba
nce
(a.u
.)
λ (nm)
[A]
350 400 450 500 550 600 650 700
0.0
0.2
0.4
0.6
0.8
1.05
6
3
4
2
1
1: 2a in DEE 2: 2a in water 3: 2a in TFE 4: 3 in DEE 5: 3 in water 6: 3 in TFE
Abs
orba
nce
(a.u
.)
λ (nm)
[B]
Results and discussions 27
350 400 450 500 550 600 650 700
0.0
0.2
0.4
0.6
0.8
1.0
1.2
4
2
1
3
6
5
1: 4b in DEE 2: 4b in EG 3: 4c in DEE 4: 4c in EG 5: 4f in DEE 6: 4f in EG
Abs
orba
nce
(a.u
.)
λ (nm)
[C]
350 400 450 500 550 600 650 700
0.0
0.2
0.4
0.6
0.8
1.0
5
43
2
1
1: 5 in CH 2: 5 in DMAc 3: 5 in TFE 4: 5 in HFP 5: 5 in p-xylene
Abs
orba
nce
(a.u
.)
λ (nm)
[D]
Results and discussions 28
350 400 450 500 550 600 650 700
0.0
0.2
0.4
0.6
0.8
1.0
1.2
6 in TCM 6 in DMAc 6 in BuOH 6 in HFP
Abs
orba
nce
(a.u
.)
λ (nm)
[E]
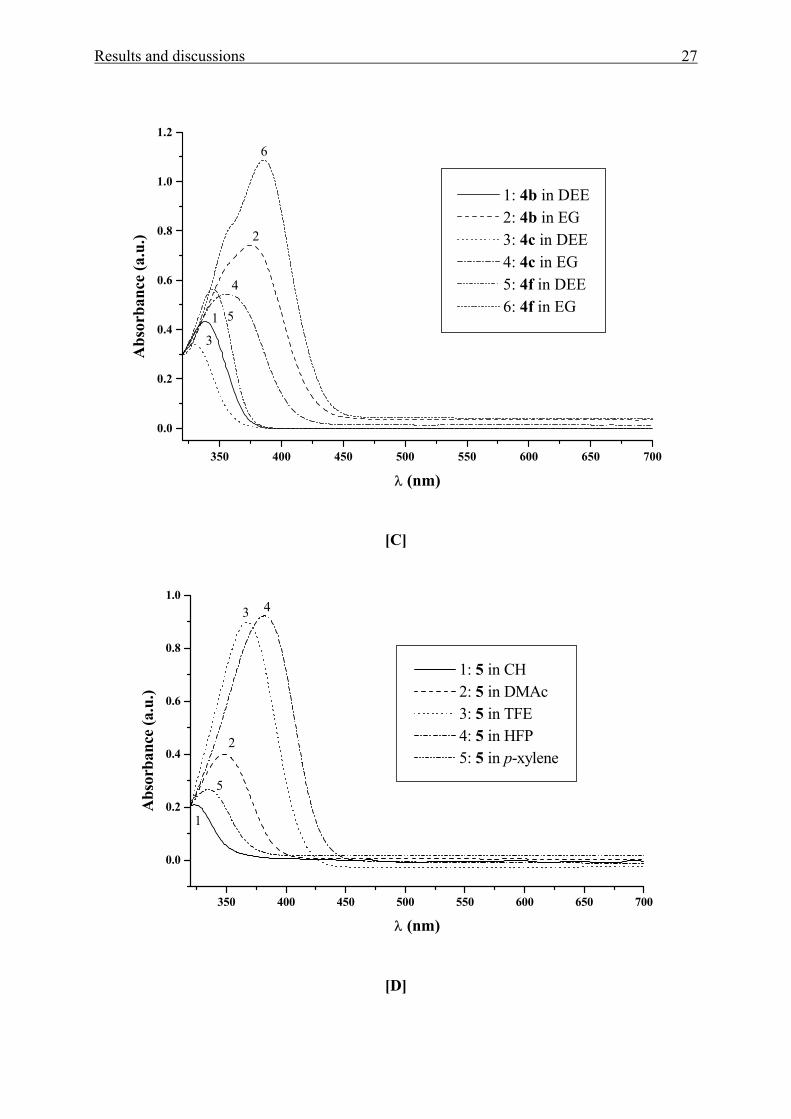
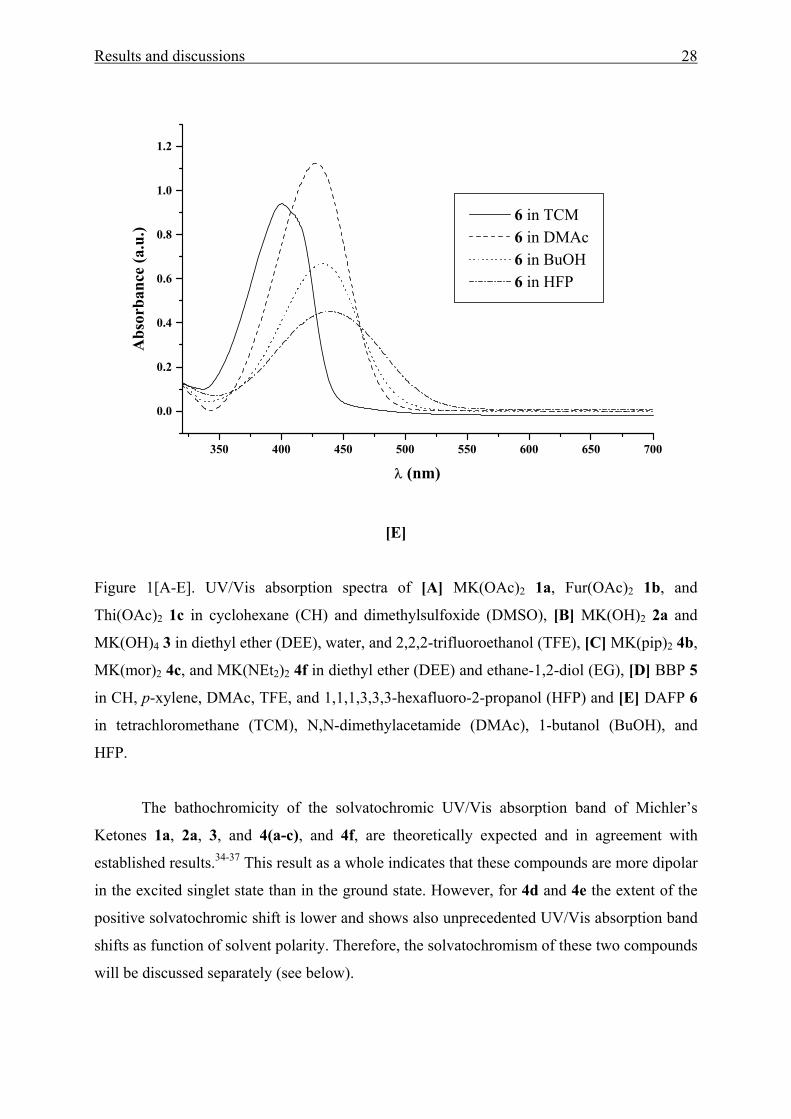
Figure 1[A-E]. UV/Vis absorption spectra of [A] MK(OAc)2 1a, Fur(OAc)2 1b, and
Thi(OAc)2 1c in cyclohexane (CH) and dimethylsulfoxide (DMSO), [B] MK(OH)2 2a and
MK(OH)4 3 in diethyl ether (DEE), water, and 2,2,2-trifluoroethanol (TFE), [C] MK(pip)2 4b,
MK(mor)2 4c, and MK(NEt2)2 4f in diethyl ether (DEE) and ethane-1,2-diol (EG), [D] BBP 5
in CH, p-xylene, DMAc, TFE, and 1,1,1,3,3,3-hexafluoro-2-propanol (HFP) and [E] DAFP 6
in tetrachloromethane (TCM), N,N-dimethylacetamide (DMAc), 1-butanol (BuOH), and
HFP.
The bathochromicity of the solvatochromic UV/Vis absorption band of Michler’s
Ketones 1a, 2a, 3, and 4(a-c), and 4f, are theoretically expected and in agreement with
established results.34-37 This result as a whole indicates that these compounds are more dipolar
in the excited singlet state than in the ground state. However, for 4d and 4e the extent of the
positive solvatochromic shift is lower and shows also unprecedented UV/Vis absorption band
shifts as function of solvent polarity. Therefore, the solvatochromism of these two compounds
will be discussed separately (see below).
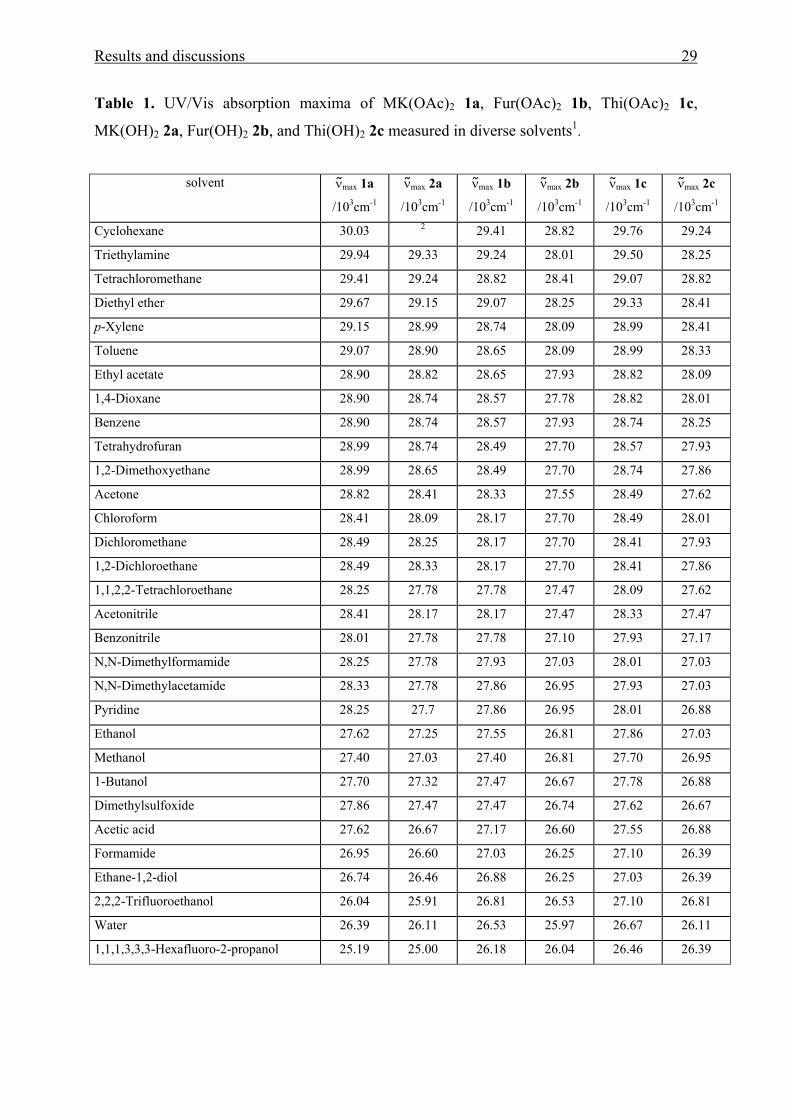
Results and discussions 29
Table 1. UV/Vis absorption maxima of MK(OAc)2 1a, Fur(OAc)2 1b, Thi(OAc)2 1c,
MK(OH)2 2a, Fur(OH)2 2b, and Thi(OH)2 2c measured in diverse solvents1.
solvent ν max 1a
/103cm-1
ν max 2a
/103cm-1
ν max 1b
/103cm-1
ν max 2b
/103cm-1
ν max 1c
/103cm-1
ν max 2c
/103cm-1
Cyclohexane 30.03 2 29.41 28.82 29.76 29.24
Triethylamine 29.94 29.33 29.24 28.01 29.50 28.25
Tetrachloromethane 29.41 29.24 28.82 28.41 29.07 28.82
Diethyl ether 29.67 29.15 29.07 28.25 29.33 28.41
p-Xylene 29.15 28.99 28.74 28.09 28.99 28.41
Toluene 29.07 28.90 28.65 28.09 28.99 28.33
Ethyl acetate 28.90 28.82 28.65 27.93 28.82 28.09
1,4-Dioxane 28.90 28.74 28.57 27.78 28.82 28.01
Benzene 28.90 28.74 28.57 27.93 28.74 28.25
Tetrahydrofuran 28.99 28.74 28.49 27.70 28.57 27.93
1,2-Dimethoxyethane 28.99 28.65 28.49 27.70 28.74 27.86
Acetone 28.82 28.41 28.33 27.55 28.49 27.62
Chloroform 28.41 28.09 28.17 27.70 28.49 28.01
Dichloromethane 28.49 28.25 28.17 27.70 28.41 27.93
1,2-Dichloroethane 28.49 28.33 28.17 27.70 28.41 27.86
1,1,2,2-Tetrachloroethane 28.25 27.78 27.78 27.47 28.09 27.62
Acetonitrile 28.41 28.17 28.17 27.47 28.33 27.47
Benzonitrile 28.01 27.78 27.78 27.10 27.93 27.17
N,N-Dimethylformamide 28.25 27.78 27.93 27.03 28.01 27.03
N,N-Dimethylacetamide 28.33 27.78 27.86 26.95 27.93 27.03
Pyridine 28.25 27.7 27.86 26.95 28.01 26.88
Ethanol 27.62 27.25 27.55 26.81 27.86 27.03
Methanol 27.40 27.03 27.40 26.81 27.70 26.95
1-Butanol 27.70 27.32 27.47 26.67 27.78 26.88
Dimethylsulfoxide 27.86 27.47 27.47 26.74 27.62 26.67
Acetic acid 27.62 26.67 27.17 26.60 27.55 26.88
Formamide 26.95 26.60 27.03 26.25 27.10 26.39
Ethane-1,2-diol 26.74 26.46 26.88 26.25 27.03 26.39
2,2,2-Trifluoroethanol 26.04 25.91 26.81 26.53 27.10 26.81
Water 26.39 26.11 26.53 25.97 26.67 26.11
1,1,1,3,3,3-Hexafluoro-2-propanol 25.19 25.00 26.18 26.04 26.46 26.39
Results and discussions 30
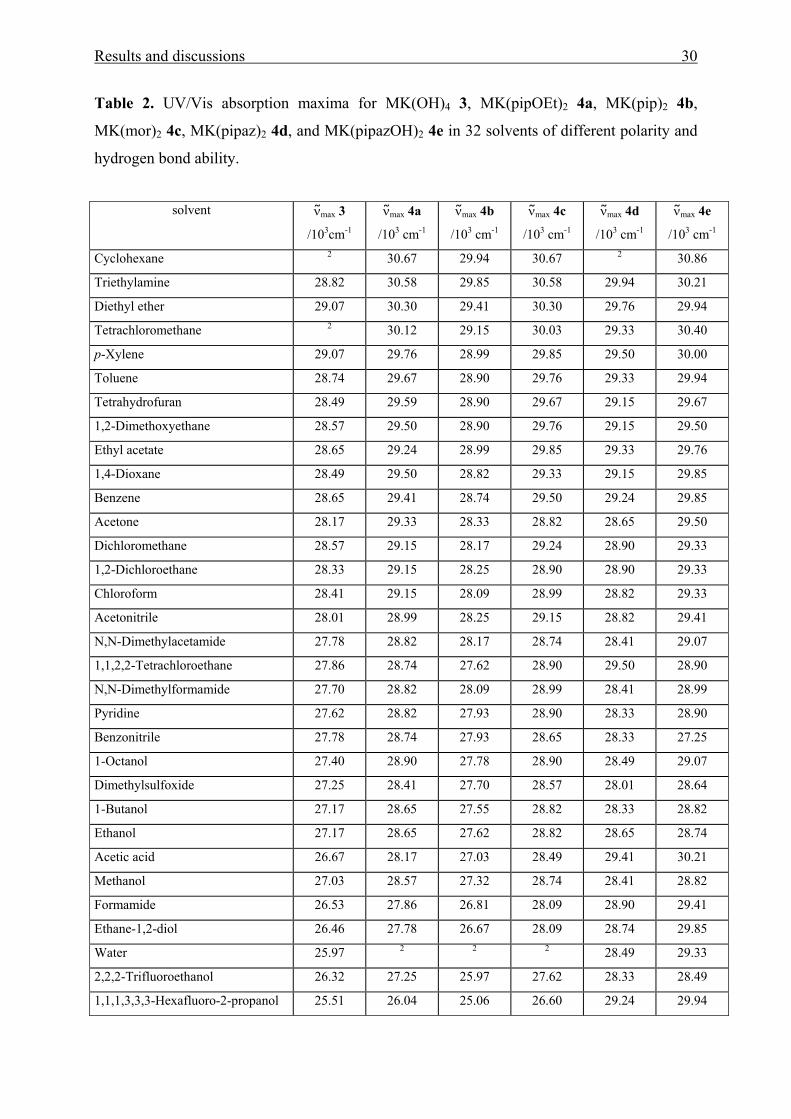
Table 2. UV/Vis absorption maxima for MK(OH)4 3, MK(pipOEt)2 4a, MK(pip)2 4b,
MK(mor)2 4c, MK(pipaz)2 4d, and MK(pipazOH)2 4e in 32 solvents of different polarity and
hydrogen bond ability.
solvent ν max 3
/103cm-1
ν max 4a
/103 cm-1
ν max 4b
/103 cm-1
ν max 4c
/103 cm-1
ν max 4d
/103 cm-1
ν max 4e
/103 cm-1
Cyclohexane 2 30.67 29.94 30.67 2 30.86
Triethylamine 28.82 30.58 29.85 30.58 29.94 30.21
Diethyl ether 29.07 30.30 29.41 30.30 29.76 29.94
Tetrachloromethane 2 30.12 29.15 30.03 29.33 30.40
p-Xylene 29.07 29.76 28.99 29.85 29.50 30.00
Toluene 28.74 29.67 28.90 29.76 29.33 29.94
Tetrahydrofuran 28.49 29.59 28.90 29.67 29.15 29.67
1,2-Dimethoxyethane 28.57 29.50 28.90 29.76 29.15 29.50
Ethyl acetate 28.65 29.24 28.99 29.85 29.33 29.76
1,4-Dioxane 28.49 29.50 28.82 29.33 29.15 29.85
Benzene 28.65 29.41 28.74 29.50 29.24 29.85
Acetone 28.17 29.33 28.33 28.82 28.65 29.50
Dichloromethane 28.57 29.15 28.17 29.24 28.90 29.33
1,2-Dichloroethane 28.33 29.15 28.25 28.90 28.90 29.33
Chloroform 28.41 29.15 28.09 28.99 28.82 29.33
Acetonitrile 28.01 28.99 28.25 29.15 28.82 29.41
N,N-Dimethylacetamide 27.78 28.82 28.17 28.74 28.41 29.07
1,1,2,2-Tetrachloroethane 27.86 28.74 27.62 28.90 29.50 28.90
N,N-Dimethylformamide 27.70 28.82 28.09 28.99 28.41 28.99
Pyridine 27.62 28.82 27.93 28.90 28.33 28.90
Benzonitrile 27.78 28.74 27.93 28.65 28.33 27.25
1-Octanol 27.40 28.90 27.78 28.90 28.49 29.07
Dimethylsulfoxide 27.25 28.41 27.70 28.57 28.01 28.64
1-Butanol 27.17 28.65 27.55 28.82 28.33 28.82
Ethanol 27.17 28.65 27.62 28.82 28.65 28.74
Acetic acid 26.67 28.17 27.03 28.49 29.41 30.21
Methanol 27.03 28.57 27.32 28.74 28.41 28.82
Formamide 26.53 27.86 26.81 28.09 28.90 29.41
Ethane-1,2-diol 26.46 27.78 26.67 28.09 28.74 29.85
Water 25.97 2 2 2 28.49 29.33
2,2,2-Trifluoroethanol 26.32 27.25 25.97 27.62 28.33 28.49
1,1,1,3,3,3-Hexafluoro-2-propanol 25.51 26.04 25.06 26.60 29.24 29.94
Results and discussions 31
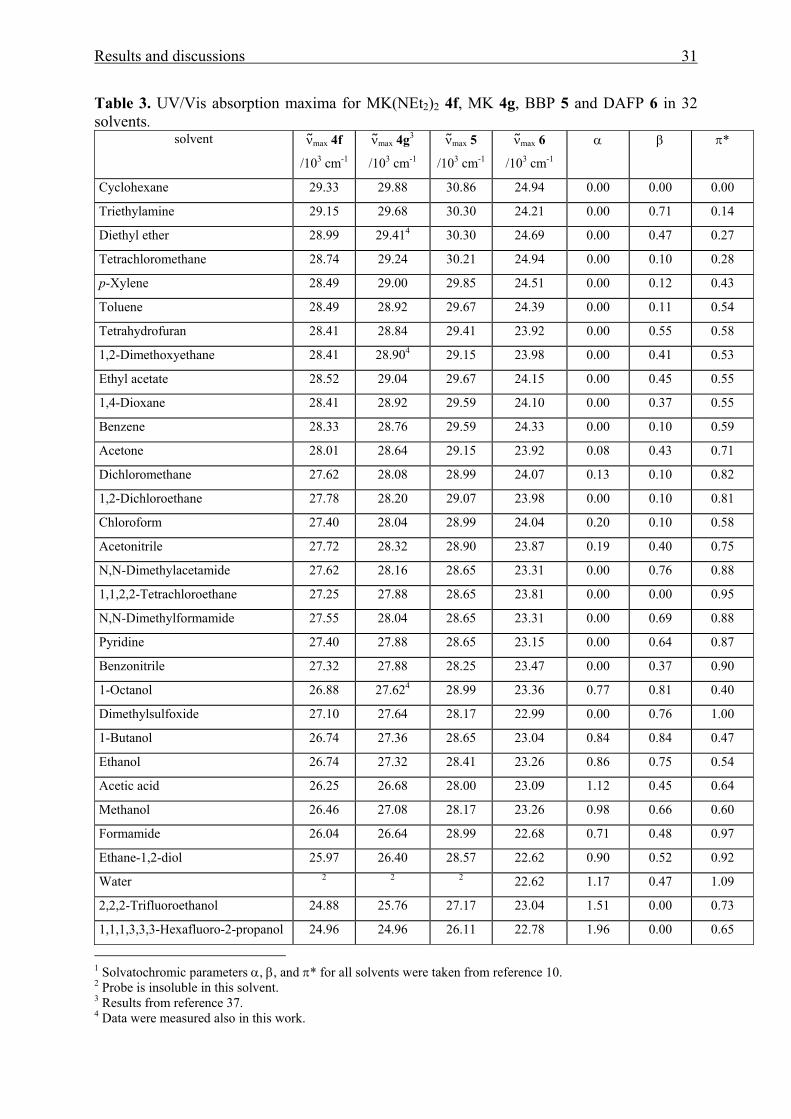
Table 3. UV/Vis absorption maxima for MK(NEt2)2 4f, MK 4g, BBP 5 and DAFP 6 in 32 solvents.
solvent ν max 4f
/103 cm-1
ν max 4g3
/103 cm-1
ν max 5
/103 cm-1
ν max 6
/103 cm-1
α β π*
Cyclohexane 29.33 29.88 30.86 24.94 0.00 0.00 0.00
Triethylamine 29.15 29.68 30.30 24.21 0.00 0.71 0.14
Diethyl ether 28.99 29.414 30.30 24.69 0.00 0.47 0.27
Tetrachloromethane 28.74 29.24 30.21 24.94 0.00 0.10 0.28
p-Xylene 28.49 29.00 29.85 24.51 0.00 0.12 0.43
Toluene 28.49 28.92 29.67 24.39 0.00 0.11 0.54
Tetrahydrofuran 28.41 28.84 29.41 23.92 0.00 0.55 0.58
1,2-Dimethoxyethane 28.41 28.904 29.15 23.98 0.00 0.41 0.53
Ethyl acetate 28.52 29.04 29.67 24.15 0.00 0.45 0.55
1,4-Dioxane 28.41 28.92 29.59 24.10 0.00 0.37 0.55
Benzene 28.33 28.76 29.59 24.33 0.00 0.10 0.59
Acetone 28.01 28.64 29.15 23.92 0.08 0.43 0.71
Dichloromethane 27.62 28.08 28.99 24.07 0.13 0.10 0.82
1,2-Dichloroethane 27.78 28.20 29.07 23.98 0.00 0.10 0.81
Chloroform 27.40 28.04 28.99 24.04 0.20 0.10 0.58
Acetonitrile 27.72 28.32 28.90 23.87 0.19 0.40 0.75
N,N-Dimethylacetamide 27.62 28.16 28.65 23.31 0.00 0.76 0.88
1,1,2,2-Tetrachloroethane 27.25 27.88 28.65 23.81 0.00 0.00 0.95
N,N-Dimethylformamide 27.55 28.04 28.65 23.31 0.00 0.69 0.88
Pyridine 27.40 27.88 28.65 23.15 0.00 0.64 0.87
Benzonitrile 27.32 27.88 28.25 23.47 0.00 0.37 0.90
1-Octanol 26.88 27.624 28.99 23.36 0.77 0.81 0.40
Dimethylsulfoxide 27.10 27.64 28.17 22.99 0.00 0.76 1.00
1-Butanol 26.74 27.36 28.65 23.04 0.84 0.84 0.47
Ethanol 26.74 27.32 28.41 23.26 0.86 0.75 0.54
Acetic acid 26.25 26.68 28.00 23.09 1.12 0.45 0.64
Methanol 26.46 27.08 28.17 23.26 0.98 0.66 0.60
Formamide 26.04 26.64 28.99 22.68 0.71 0.48 0.97
Ethane-1,2-diol 25.97 26.40 28.57 22.62 0.90 0.52 0.92
Water 2 2 2 22.62 1.17 0.47 1.09
2,2,2-Trifluoroethanol 24.88 25.76 27.17 23.04 1.51 0.00 0.73
1,1,1,3,3,3-Hexafluoro-2-propanol 24.96 24.96 26.11 22.78 1.96 0.00 0.65
1 Solvatochromic parameters α, β, and π* for all solvents were taken from reference 10. 2 Probe is insoluble in this solvent. 3 Results from reference 37. 4 Data were measured also in this work.
Results and discussions 32
Also, the bathochromic displacement of the long-wavelength UV/Vis absorption band
for 1(b-c) and 2(b-c) towards the more polar solvent is in agreement with an increased
delocalization due to the conjugation of the lone pair of electrons of the [-N(CH2CH2OH)2] or
[-N(CH2CH2OCOCH3)2] donor substituent with the aromatic π-electron system and the
carbonyl group. This result indicates that the heterocyclic substituted aromatic aminoketones
are more polar in the singlet excited state than in the ground state.
Taking into account all solvents studied, for any solvent, compounds 1(a-c) absorb
hypsochromically in comparison with their diols 2(a-c). This is a clear result of the electron
withdrawing influence of the acetyl group, which lowers the electron density at the nitrogen
atom. Thus, the delocalization ability of the lone pair of electrons at the nitrogen atom is
slightly decreased. The extent of the hypsochromic shift, for example, from Fur(OH)2 to
Fur(OAc)2, occurs stronger in HBA (hydrogen-bond accepting) solvents such as triethyl
amine (TEA) (∆ν = 1203 cm-1) than in HBD (hydrogen-bond donating) solvents like water
(∆ν = 533 cm-1) or HFP (∆ν = 140 cm-1) indicating an additional electron pushing influence
of HBA solvents upon the –N(CH2CH2OH)2 substituent.
The solvatochromic effect of MK(OAc)2 shows that the long-wavelength UV/Vis
absorption maximum ranges from λ = 333 nm in CH to λ = 397 nm in HFP, corresponding to
∆λ = 64 nm (∆ν = 4840 cm-1) stabilization energy between these two solvents of extremely
different polarity. However, the extent of the solvatochromic UV/Vis band shift is smaller for
MK(OH)2. It ranges from λ = 341 nm in TEA to λ = 400 nm in HFP, corresponding to ∆λ =
59 nm (∆ν = 4330 cm-1), while in the case of the furan [Fur(OAc)2, Fur(OH)2] and thiophene
[Thi(OAc)2, Thi(OH)2] analogues (Table 1), The UV/Vis shifts range from λ = 340 nm in CH
to λ = 382 nm in HFP, corresponding to ∆λ = 42 nm (∆ν = 3230 cm-1), from λ = 347 nm in
CH to λ = 385 nm in water, corresponding to ∆λ = 38 nm (∆ν = 2850 cm-1), from λ = 336 nm
in CH to λ = 378 nm in HFP, corresponding to ∆λ = 42 nm (∆ν = 3300 cm-1), and from λ =
342 nm in CH to λ = 383 nm in water, corresponding to ∆λ = 41 nm (∆ν = 3130 cm-1),
respectively. Thus, the extent of the solvatochromic shift as function of solvent polarity of the
hydroxyl functionalized homomorph is lower than that of the acetoxy functionalized
homomorph, which is likely caused by a competing influence of the polar substituent with the
solvent molecules.
A hypsochromic band shift from MK to MK(OH)4 is observed when strong HBD
solvents (TFE, water or HFP) are considered. This result indicates a specific solvation of the
oxygen atoms of the (HOCH2CH2)N- substituent by the active hydrogen atoms of the HBD
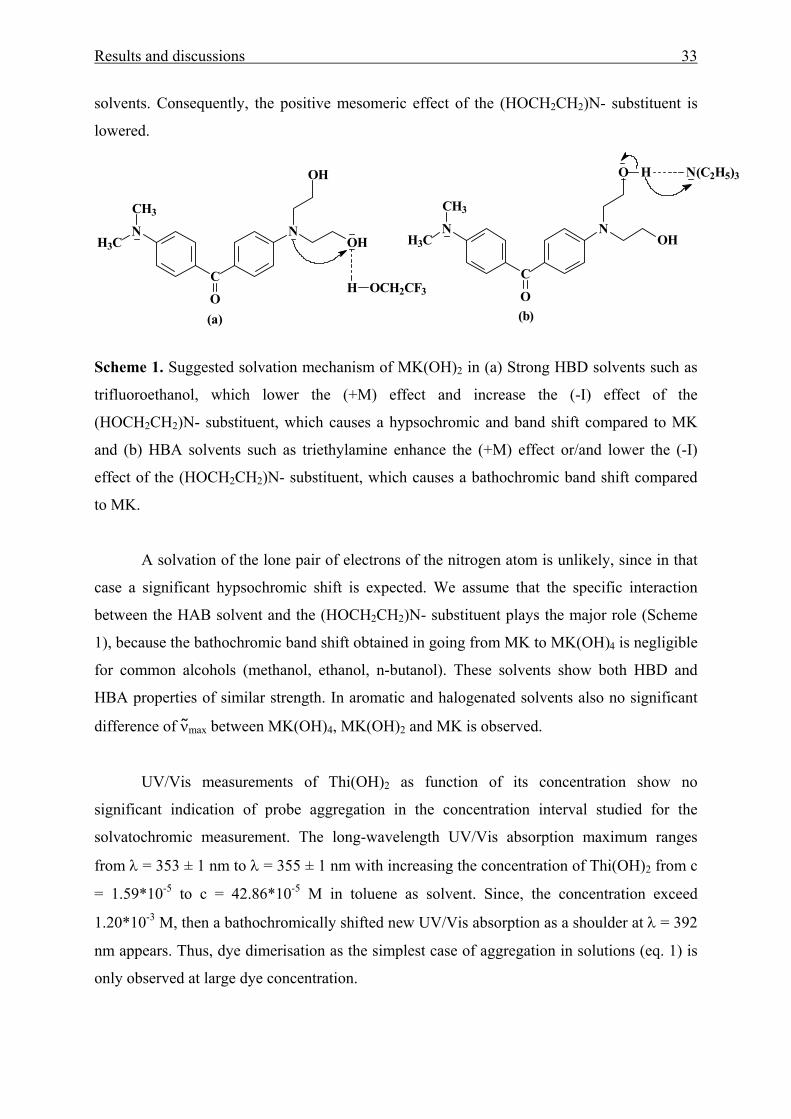
Results and discussions 33
solvents. Consequently, the positive mesomeric effect of the (HOCH2CH2)N- substituent is
lowered.
C
O
N
CH3
H3CN
OH
OH
H OCH2CF3C
O
N
CH3
H3CN
O
OH
H N(C2H5)3
(a) (b)
Scheme 1. Suggested solvation mechanism of MK(OH)2 in (a) Strong HBD solvents such as
trifluoroethanol, which lower the (+M) effect and increase the (-I) effect of the
(HOCH2CH2)N- substituent, which causes a hypsochromic and band shift compared to MK
and (b) HBA solvents such as triethylamine enhance the (+M) effect or/and lower the (-I)
effect of the (HOCH2CH2)N- substituent, which causes a bathochromic band shift compared
to MK.
A solvation of the lone pair of electrons of the nitrogen atom is unlikely, since in that
case a significant hypsochromic shift is expected. We assume that the specific interaction
between the HAB solvent and the (HOCH2CH2)N- substituent plays the major role (Scheme
1), because the bathochromic band shift obtained in going from MK to MK(OH)4 is negligible
for common alcohols (methanol, ethanol, n-butanol). These solvents show both HBD and
HBA properties of similar strength. In aromatic and halogenated solvents also no significant
difference of νmax between MK(OH)4, MK(OH)2 and MK is observed.
UV/Vis measurements of Thi(OH)2 as function of its concentration show no
significant indication of probe aggregation in the concentration interval studied for the
solvatochromic measurement. The long-wavelength UV/Vis absorption maximum ranges
from λ = 353 ± 1 nm to λ = 355 ± 1 nm with increasing the concentration of Thi(OH)2 from c
= 1.59*10-5 to c = 42.86*10-5 M in toluene as solvent. Since, the concentration exceed
1.20*10-3 M, then a bathochromically shifted new UV/Vis absorption as a shoulder at λ = 392
nm appears. Thus, dye dimerisation as the simplest case of aggregation in solutions (eq. 1) is
only observed at large dye concentration.
Results and discussions 34
(1)
λ = 353 nm (toluene) λ = 392 nm (toluene)
Low concentration (c <10-3 M) high concentration (c >10-3 M)
It is worth to note from figure 1B that, in the case of HBA and weak polar solvents
such as diethyl ether, MK(OH)4 and MK(OH)2 show a symmetrical UV/Vis band because the
n-π* and π-π* transition interfere,4 whereas in strong HBD solvents such as 2,2,2-
trifluoroethanol (TFE) and water, an additional shoulder at about 350 nm is observed which is
probably caused by a separate n-π* transition. For the regression analysis (see below), only
the intense absorption (π-π* transition) at the longer wavelength was used.
The long-wavelength UV/Vis absorption maximum of BBP 5 (Table 3, Figure 1D)
ranges from λ = 324 nm in CH to λ = 383 nm in HFP, corresponding to ∆λ = 59 nm (∆ν =
4750 cm-1). Thus, this compound shows quite the same solvatochromic effect than does MK.
The largest solvatochromic bathochromic UV/Vis band shift is observed in HFP for
MK(OAc)2, MK(NEt2)2, MK(pipOEt)2, MK(pip)2, MK(mor)2, and BBP including MK and
two hydrophilically substituted derivatives MK(OH)2, and MK(OH)4. The extent of the
positive solvatochromic shift, from TEA to HFP, decreases in the following order: MK(pip)2
(∆ν = 4790 cm-1) > MK(OAc)2 (∆ν = 4750 cm-1) > MK (∆ν = 4720 cm-1) > MK(pipOEt)2 (∆ν
= 4540 cm-1) > MK(OH)2 (∆ν = 4330 cm-1) > MK(NEt2)2 (∆ν = 4190 cm-1) > MK(mor)2 (∆ν
= 3980 cm-1) MK(OH)4 (∆ν = 3310 cm-1).
The solvatochromic effect of DAFP 6 (Table 3, Figure 1E) shows that the long-
wavelength UV/Vis absorption maximum ranges from λ = 401 nm in CH and TCM to λ =
442 nm in 1,2-ethandiol and water, corresponding to ∆λ = 41 nm (∆ν = 2320 cm-1)
stabilization energy between these solvents of extremely different polarity. This bathochromic
displacement for 6 is in agreement with an increased delocalization, due to a more extended
conjugated π-system. This result indicates that compound 6 is more polar in the excited
singlet state than in the ground state. Going from non polar solvent CH to polar solvent water,
the extent of solvatochromic bathochromic shift for 6 is similar to that of 2b (vide supra).
However, the difference between the long-wavelength UV/Vis absorption maximum of 6 and
2b in the same solvent is more significant (∆λ = 54, and 57 nm in case of CH and water,
respectively).
2 Thi(OH)2 [Thi(OH)2]2
Results and discussions 35
Ambiguous solvatochromic UV/Vis band shifts as function of solvent polarity show
MK(pipaz)2 and MK(pipazOH)2. The long-wavelength UV/Vis absorption maxima of
MK(pipaz)2 and MK(pipazOH)2 are less pronounced and range from λ = 334 nm in TEA to λ
= 353 nm in pyridine, benzonitrile, 1-butanol and TFE, corresponding to ∆λ = 19 nm (∆ν =
1610 cm-1) and from λ = 324 nm in CH to λ = 367 nm in benzonitrile, corresponding to ∆λ =
43 nm (∆ν = 3610 cm-1), respectively.
In strong HBD solvents, such as water, acetic acid and HFP a strong hypsochromic
shift of the UV/Vis band is observed, which shows that the positive mesomeric effect of the
nitrogen atom at the aromate is suppressed. However, the basicity of the secondary nitrogen
atom of the piperazine ring is larger than that of the tertiary nitrogen directly bonded at the
aromate. Therefore, it is expected that a HBD solvent interacts preferably with the secondary
nitrogen atom of the piperazine ring due to its larger basicity. This raises the question which
role play acid-base interactions at the piperazino ring and how do they contribute to the shift
of the solvatochromic UV/Vis band?
350 400 450 500 550 600 650 700
0.0
0.1
0.2
0.3
0.4
0.5
0.6
0.7
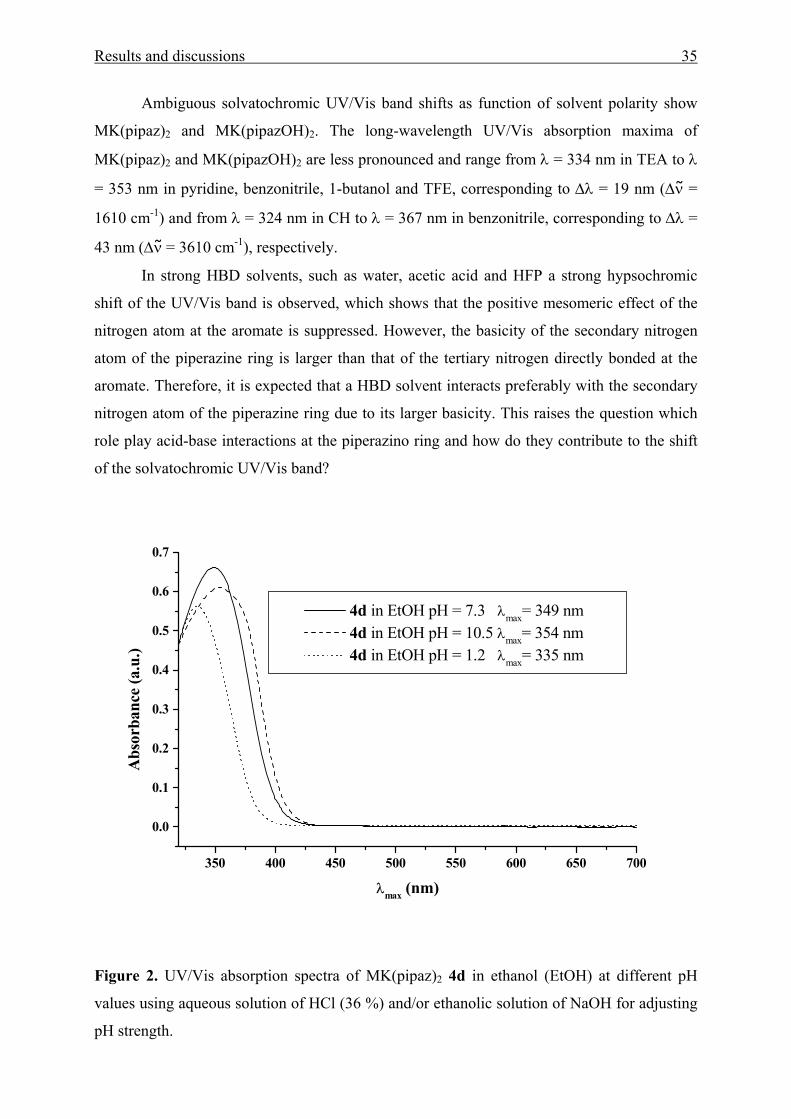
4d in EtOH pH = 7.3 λmax= 349 nm 4d in EtOH pH = 10.5 λmax= 354 nm 4d in EtOH pH = 1.2 λmax= 335 nm
Abs
orba
nce
(a.u
.)
λmax (nm)
Figure 2. UV/Vis absorption spectra of MK(pipaz)2 4d in ethanol (EtOH) at different pH
values using aqueous solution of HCl (36 %) and/or ethanolic solution of NaOH for adjusting
pH strength.
Results and discussions 36
UV/Vis absorption spectra of MK(pipaz)2 in ethanolic solutions with different pH’s
are shown in Fig. 2. At low pH, protonation takes place at the secondary nitrogen atoms and
the UV/Vis absorption maxima is hypsochromically shifted. This shows that acid-base
interactions at the secondary nitrogen atom have an influence on the tertiary nitrogen atom,
likely via the through-space interaction from the nitrogen atom bonded at the aromate to the
nitrogen atom in the 4-position of piperazine, because solely piperazine substituents with
strong basic nitrogen atoms show this effect.
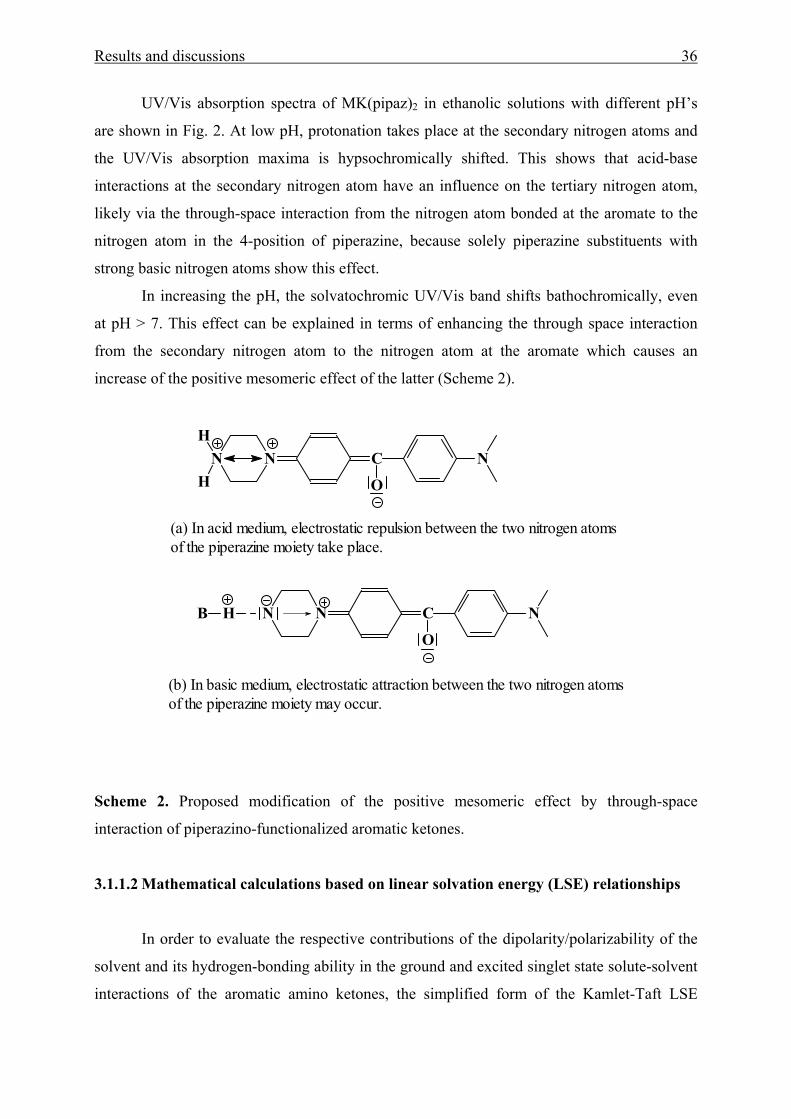
In increasing the pH, the solvatochromic UV/Vis band shifts bathochromically, even
at pH > 7. This effect can be explained in terms of enhancing the through space interaction
from the secondary nitrogen atom to the nitrogen atom at the aromate which causes an
increase of the positive mesomeric effect of the latter (Scheme 2).
NN C
O
NH
H
(a) In acid medium, electrostatic repulsion between the two nitrogen atoms of the piperazine moiety take place.
HB NN C
O
N
(b) In basic medium, electrostatic attraction between the two nitrogen atoms of the piperazine moiety may occur.
Scheme 2. Proposed modification of the positive mesomeric effect by through-space
interaction of piperazino-functionalized aromatic ketones.
3.1.1.2 Mathematical calculations based on linear solvation energy (LSE) relationships
In order to evaluate the respective contributions of the dipolarity/polarizability of the
solvent and its hydrogen-bonding ability in the ground and excited singlet state solute-solvent
interactions of the aromatic amino ketones, the simplified form of the Kamlet-Taft LSE

Results and discussions 37
relationship was used. This equation which applied to single solvatochromic shifts, XYZ =
νmax (probe)1, 10 is given in eq. (2).
XYZ = (XYZ)0 + aα + bβ + s(π*+dδ) (2)
The challenge is to relate the values of the Kamlet-Taft parameters to microscopic
interactions such as specific hydrogen bonds. To achieve this goal, we set out to compare
MK(OH)2, Fur(OH)2, and Thi(OH)2 with their ester analogue, MK(OAc)2, Fur(OAc)2 and
Thi(OAc)2. The difference between them is, evidently, in the replacement of the hydroxyl
hydrogen atom by acetyl group. If only the OH group contributes to b, we expect to be b = 0
for MK(OAc)2, Fur(OAc)2, and Thi(OAc)2, respectively.
XYZ = (XYZ)0 + s(π* + dδ) + aα (3)
Thus, in non protic or other solvents with α = 0, the UV/Vis shifts of the acetoxy
derivatives are governed exclusively by polarity effects.
If the substitution at the hydroxyl oxygen does not affect drastically the electron density of the
residual molecular structure of MK(OH)2, Fur(OH)2, and Thi(OH)2, the dipole moments of
the esters MK(OAc)2, Fur(OAc)2, and Thi(OAc)2 compared to their alcohols should be
similar. If, in addition, their a coefficients are similar, the excess UV/Vis shift, ∆ν max = νmax
[X(OAc)2] - νmax [X(OH)2] (X = MK, Fur or Thi), is to be expected solely a function of β:
∆ν = ∆ν 0 - bβ (4)
The above presumptions will be tested by the expected solvatochromic UV/Vis shifts
of the six compounds studied. Similar strategies with other homomorph solvatochromic dyes
have been employed for the creation of related empirical solvent HBA, HBD, and dipolarity/
polarizability scales.13
The solvatochromic parameters α, β, and π* for the square multiple correlation
analysis were taken from ref.10 The wave numbers of the absorption maxima (νmax) as energy
adequate measure have been used in the regression analysis.
The correlations statistically provide a solid base for understanding solvent effects on
the solvatochromic long-wavelength UV/Vis absorption band of these molecules. The LSE
relationships show a high quality in particular as indicated by correlation coefficients larger
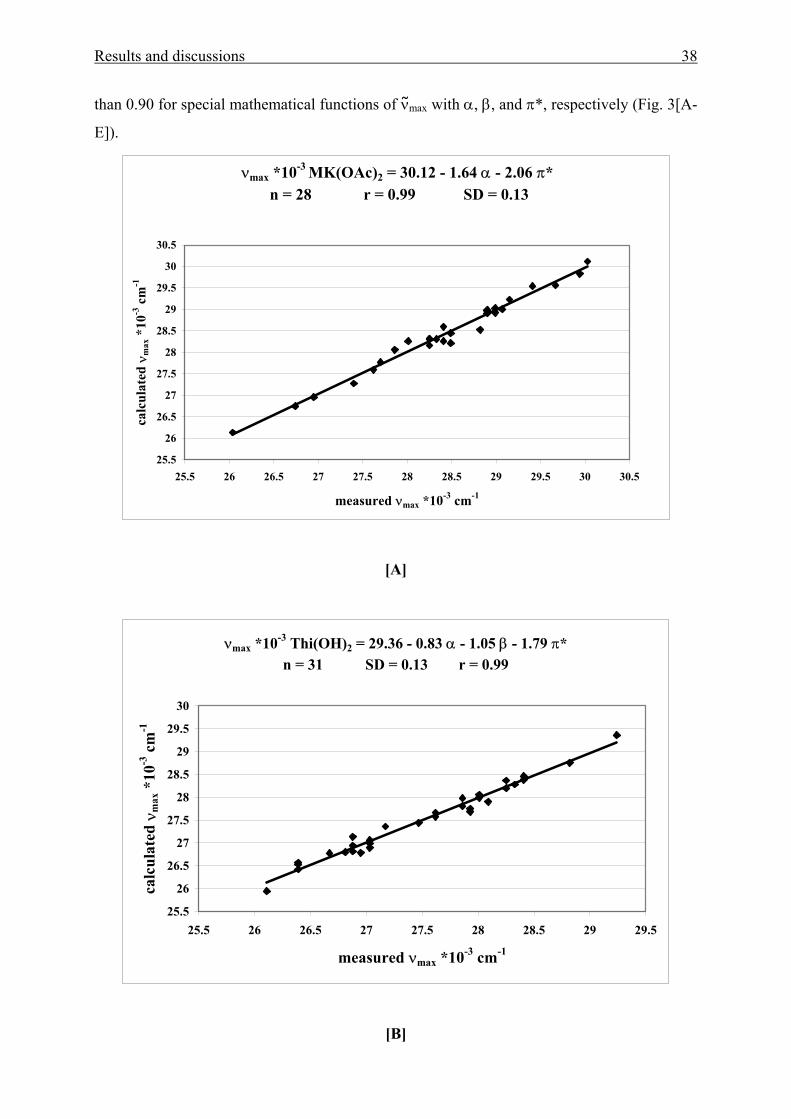
Results and discussions 38
than 0.90 for special mathematical functions of νmax with α, β, and π*, respectively (Fig. 3[A-
E]).
νmax *10-3 MK(OAc)2 = 30.12 - 1.64 α - 2.06 π* n = 28 r = 0.99 SD = 0.13
25.5
26
26.5
27
27.5
28
28.5
29
29.5
30
30.5
25.5 26 26.5 27 27.5 28 28.5 29 29.5 30 30.5
measured νmax *10-3 cm-1
calc
ulat
ed ν
max
*10
-3 c
m-1
[A]
νmax *10-3 Thi(OH)2 = 29.36 - 0.83 α - 1.05 β - 1.79 π* n = 31 SD = 0.13 r = 0.99
25.5
26
26.5
27
27.5
28
28.5
29
29.5
30
25.5 26 26.5 27 27.5 28 28.5 29 29.5
measured νmax *10-3 cm-1
calc
ulat
ed ν
max
*10
-3 c
m-1
[B]
Results and discussions 39
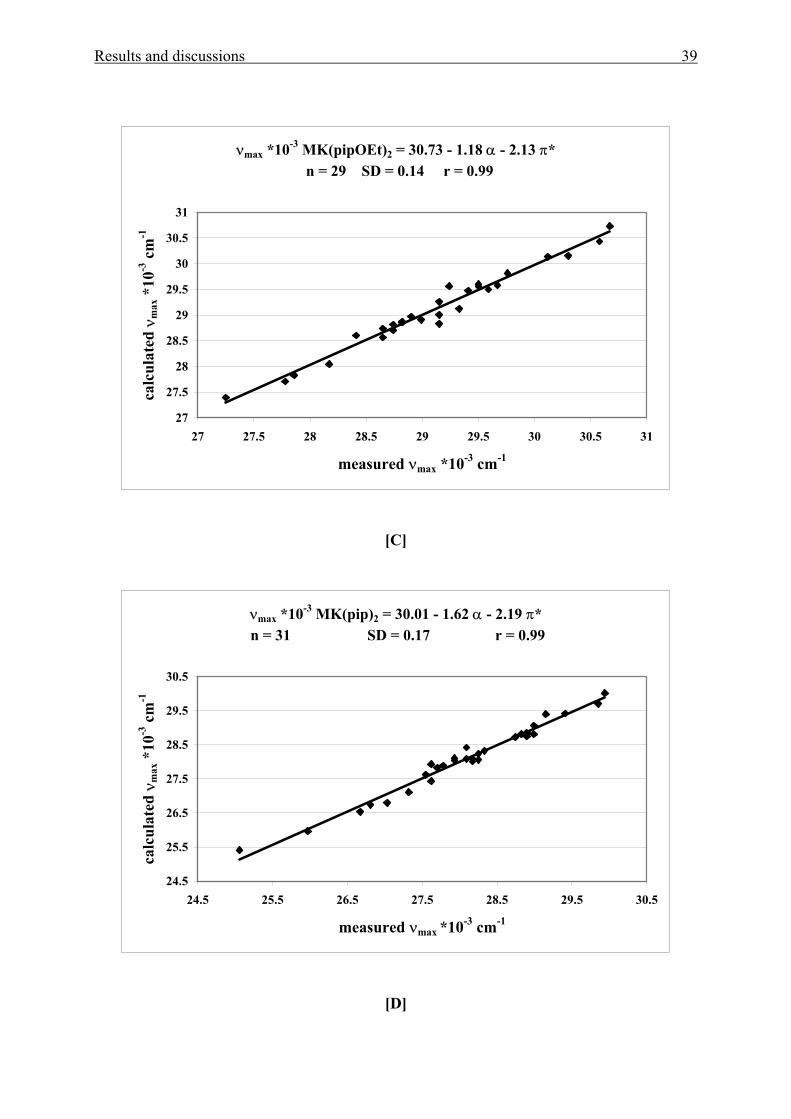
νmax *10-3 MK(pipOEt)2 = 30.73 - 1.18 α - 2.13 π* n = 29 SD = 0.14 r = 0.99
27
27.5
28
28.5
29
29.5
30
30.5
31
27 27.5 28 28.5 29 29.5 30 30.5 31
measured νmax *10-3 cm-1
calc
ulat
ed ν
max
*10
-3 c
m-1
[C]
νmax *10-3 MK(pip)2 = 30.01 - 1.62 α - 2.19 π* n = 31 SD = 0.17 r = 0.99
24.5
25.5
26.5
27.5
28.5
29.5
30.5
24.5 25.5 26.5 27.5 28.5 29.5 30.5
measured νmax *10-3 cm-1
calc
ulat
ed ν
max
*10
-3 c
m-1
[D]
Results and discussions 40
22
23
24
25
26
27
28
29
22 23 24 25 26 27 28 29
measured νmax *10-3 cm-1
calc
ulat
ed ν
max
*10
-3 c
m-1
2b6c-hexane
water
[E]
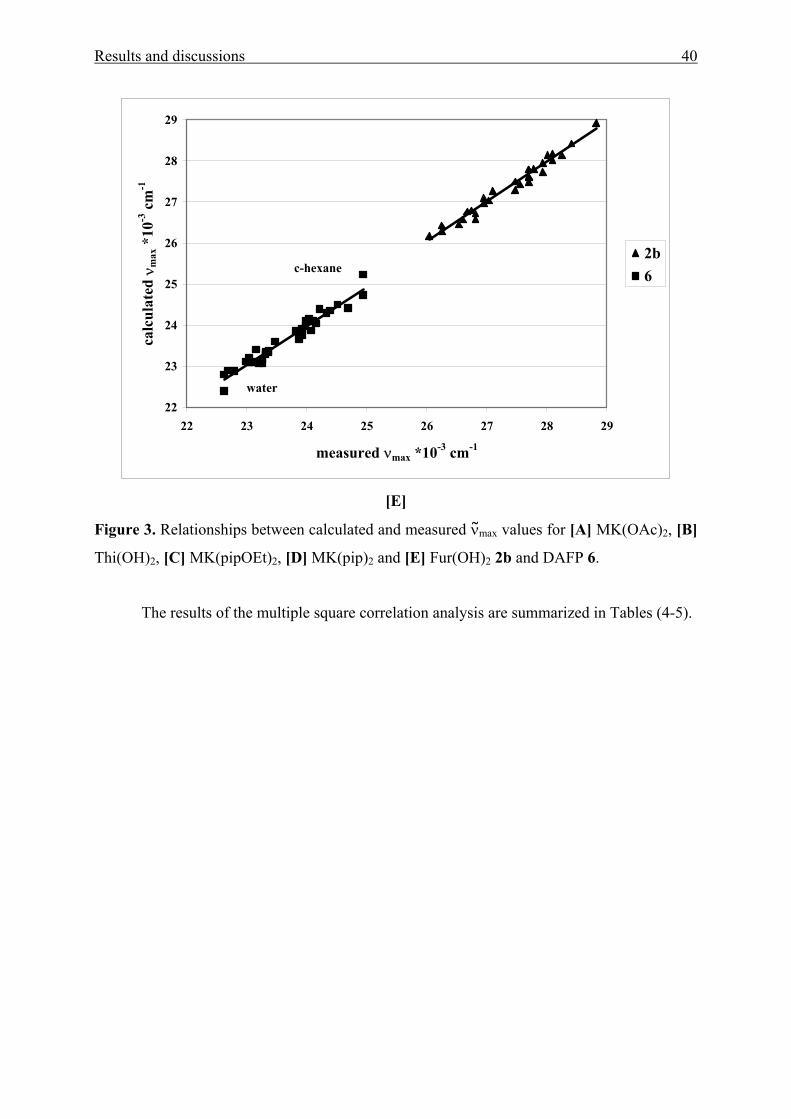
Figure 3. Relationships between calculated and measured νmax values for [A] MK(OAc)2, [B]
Thi(OH)2, [C] MK(pipOEt)2, [D] MK(pip)2 and [E] Fur(OH)2 2b and DAFP 6.
The results of the multiple square correlation analysis are summarized in Tables (4-5).
Results and discussions 41
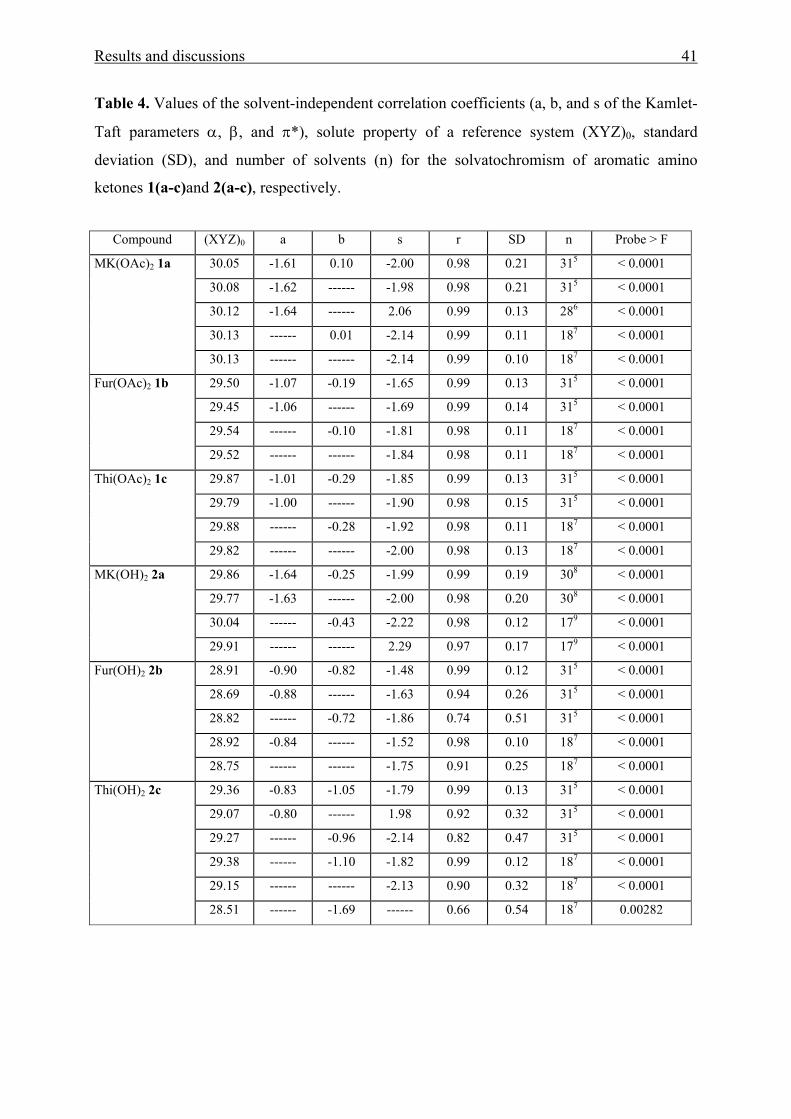
Table 4. Values of the solvent-independent correlation coefficients (a, b, and s of the Kamlet-
Taft parameters α, β, and π*), solute property of a reference system (XYZ)0, standard
deviation (SD), and number of solvents (n) for the solvatochromism of aromatic amino
ketones 1(a-c)and 2(a-c), respectively.
Compound (XYZ)0 a b s r SD n Probe > F
30.05 -1.61 0.10 -2.00 0.98 0.21 315 < 0.0001
30.08 -1.62 ------ -1.98 0.98 0.21 315 < 0.0001
30.12 -1.64 ------ 2.06 0.99 0.13 286 < 0.0001
30.13 ------ 0.01 -2.14 0.99 0.11 187 < 0.0001
MK(OAc)2 1a
30.13 ------ ------ -2.14 0.99 0.10 187 < 0.0001
29.50 -1.07 -0.19 -1.65 0.99 0.13 315 < 0.0001
29.45 -1.06 ------ -1.69 0.99 0.14 315 < 0.0001
29.54 ------ -0.10 -1.81 0.98 0.11 187 < 0.0001
Fur(OAc)2 1b
29.52 ------ ------ -1.84 0.98 0.11 187 < 0.0001
29.87 -1.01 -0.29 -1.85 0.99 0.13 315 < 0.0001
29.79 -1.00 ------ -1.90 0.98 0.15 315 < 0.0001
29.88 ------ -0.28 -1.92 0.98 0.11 187 < 0.0001
Thi(OAc)2 1c
29.82 ------ ------ -2.00 0.98 0.13 187 < 0.0001
29.86 -1.64 -0.25 -1.99 0.99 0.19 308 < 0.0001
29.77 -1.63 ------ -2.00 0.98 0.20 308 < 0.0001
30.04 ------ -0.43 -2.22 0.98 0.12 179 < 0.0001
MK(OH)2 2a
29.91 ------ ------ 2.29 0.97 0.17 179 < 0.0001
28.91 -0.90 -0.82 -1.48 0.99 0.12 315 < 0.0001
28.69 -0.88 ------ -1.63 0.94 0.26 315 < 0.0001
28.82 ------ -0.72 -1.86 0.74 0.51 315 < 0.0001
28.92 -0.84 ------ -1.52 0.98 0.10 187 < 0.0001
Fur(OH)2 2b
28.75 ------ ------ -1.75 0.91 0.25 187 < 0.0001
29.36 -0.83 -1.05 -1.79 0.99 0.13 315 < 0.0001
29.07 -0.80 ------ 1.98 0.92 0.32 315 < 0.0001
29.27 ------ -0.96 -2.14 0.82 0.47 315 < 0.0001
29.38 ------ -1.10 -1.82 0.99 0.12 187 < 0.0001
29.15 ------ ------ -2.13 0.90 0.32 187 < 0.0001
Thi(OH)2 2c
28.51 ------ -1.69 ------ 0.66 0.54 187 0.00282
Results and discussions 42
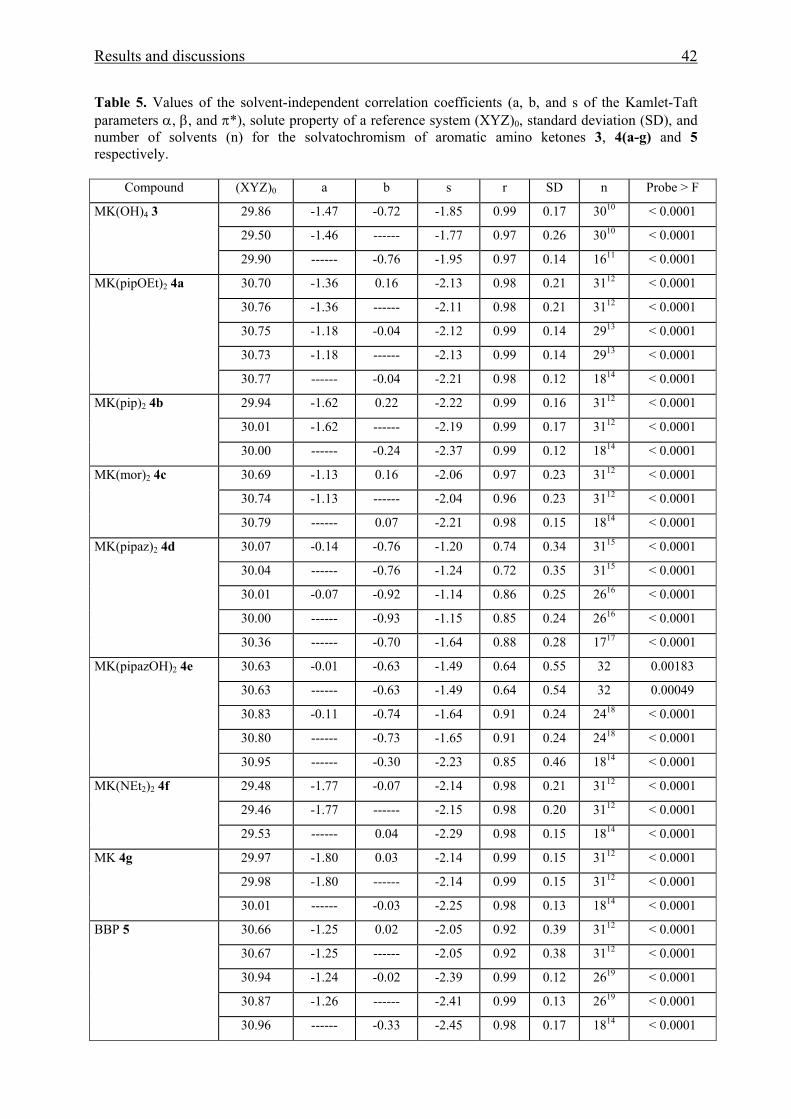
Table 5. Values of the solvent-independent correlation coefficients (a, b, and s of the Kamlet-Taft parameters α, β, and π*), solute property of a reference system (XYZ)0, standard deviation (SD), and number of solvents (n) for the solvatochromism of aromatic amino ketones 3, 4(a-g) and 5 respectively.
Compound (XYZ)0 a b s r SD n Probe > F
29.86 -1.47 -0.72 -1.85 0.99 0.17 3010 < 0.0001
29.50 -1.46 ------ -1.77 0.97 0.26 3010 < 0.0001
MK(OH)4 3
29.90 ------ -0.76 -1.95 0.97 0.14 1611 < 0.0001
30.70 -1.36 0.16 -2.13 0.98 0.21 3112 < 0.0001
30.76 -1.36 ------ -2.11 0.98 0.21 3112 < 0.0001
30.75 -1.18 -0.04 -2.12 0.99 0.14 2913 < 0.0001
30.73 -1.18 ------ -2.13 0.99 0.14 2913 < 0.0001
MK(pipOEt)2 4a
30.77 ------ -0.04 -2.21 0.98 0.12 1814 < 0.0001
29.94 -1.62 0.22 -2.22 0.99 0.16 3112 < 0.0001
30.01 -1.62 ------ -2.19 0.99 0.17 3112 < 0.0001
MK(pip)2 4b
30.00 ------ -0.24 -2.37 0.99 0.12 1814 < 0.0001
30.69 -1.13 0.16 -2.06 0.97 0.23 3112 < 0.0001
30.74 -1.13 ------ -2.04 0.96 0.23 3112 < 0.0001
MK(mor)2 4c
30.79 ------ 0.07 -2.21 0.98 0.15 1814 < 0.0001
30.07 -0.14 -0.76 -1.20 0.74 0.34 3115 < 0.0001
30.04 ------ -0.76 -1.24 0.72 0.35 3115 < 0.0001
30.01 -0.07 -0.92 -1.14 0.86 0.25 2616 < 0.0001
30.00 ------ -0.93 -1.15 0.85 0.24 2616 < 0.0001
MK(pipaz)2 4d
30.36 ------ -0.70 -1.64 0.88 0.28 1717 < 0.0001
30.63 -0.01 -0.63 -1.49 0.64 0.55 32 0.00183
30.63 ------ -0.63 -1.49 0.64 0.54 32 0.00049
30.83 -0.11 -0.74 -1.64 0.91 0.24 2418 < 0.0001
30.80 ------ -0.73 -1.65 0.91 0.24 2418 < 0.0001
MK(pipazOH)2 4e
30.95 ------ -0.30 -2.23 0.85 0.46 1814 < 0.0001
29.48 -1.77 -0.07 -2.14 0.98 0.21 3112 < 0.0001
29.46 -1.77 ------ -2.15 0.98 0.20 3112 < 0.0001
MK(NEt2)2 4f
29.53 ------ 0.04 -2.29 0.98 0.15 1814 < 0.0001
29.97 -1.80 0.03 -2.14 0.99 0.15 3112 < 0.0001
29.98 -1.80 ------ -2.14 0.99 0.15 3112 < 0.0001
MK 4g
30.01 ------ -0.03 -2.25 0.98 0.13 1814 < 0.0001
30.66 -1.25 0.02 -2.05 0.92 0.39 3112 < 0.0001
30.67 -1.25 ------ -2.05 0.92 0.38 3112 < 0.0001
30.94 -1.24 -0.02 -2.39 0.99 0.12 2619 < 0.0001
30.87 -1.26 ------ -2.41 0.99 0.13 2619 < 0.0001
BBP 5
30.96 ------ -0.33 -2.45 0.98 0.17 1814 < 0.0001
Results and discussions 43
5 All measured ν max data for all solvents in table (1) are used in correlation analysis. 6 Measured νmax data for acetic acid, water, and HFP are excluded. 7 Measured νmax data for all solvents with α = 0 in table (1) are only used in correlation analysis. 8 MK(OH)2 is insoluble in cyclohexane, therefore, the measured νmax data used in correlation analysis were 30. 9 Measured νmax data for all solvent with α = 0 in table (1) are only used in correlation analysis with the exception of cyclohexane. 10 Probe was measured in 30 solvents because it is insoluble in CH and TCM. 11 Excluding solvents with α > 0 with the exception of CH and TCM. 12 Probe was measured in 31 solvents because it is insoluble in water. 13 Excluding νmax values of methanol and HFP. 14 Excluding solvents with α > 0. 15 Probe was measured in 31 solvents because it is insoluble in CH. 16 Excluding νmax values of TEA, TCE, formamide, acetic acid and TFE. 17 Excluding solvents with α > 0 with the exception of CH. 18 Excluding νmax values of ethanol, 1-butanol, ethane-1,2-diol, benzonitrile, water, formamide, acetic acid and TFE. 19 Excluding νmax values of 1,2-dimethoxyethane, 1,2-ethandiol, benzonitrile, water, formamide, and HFP.
Results and discussions 44
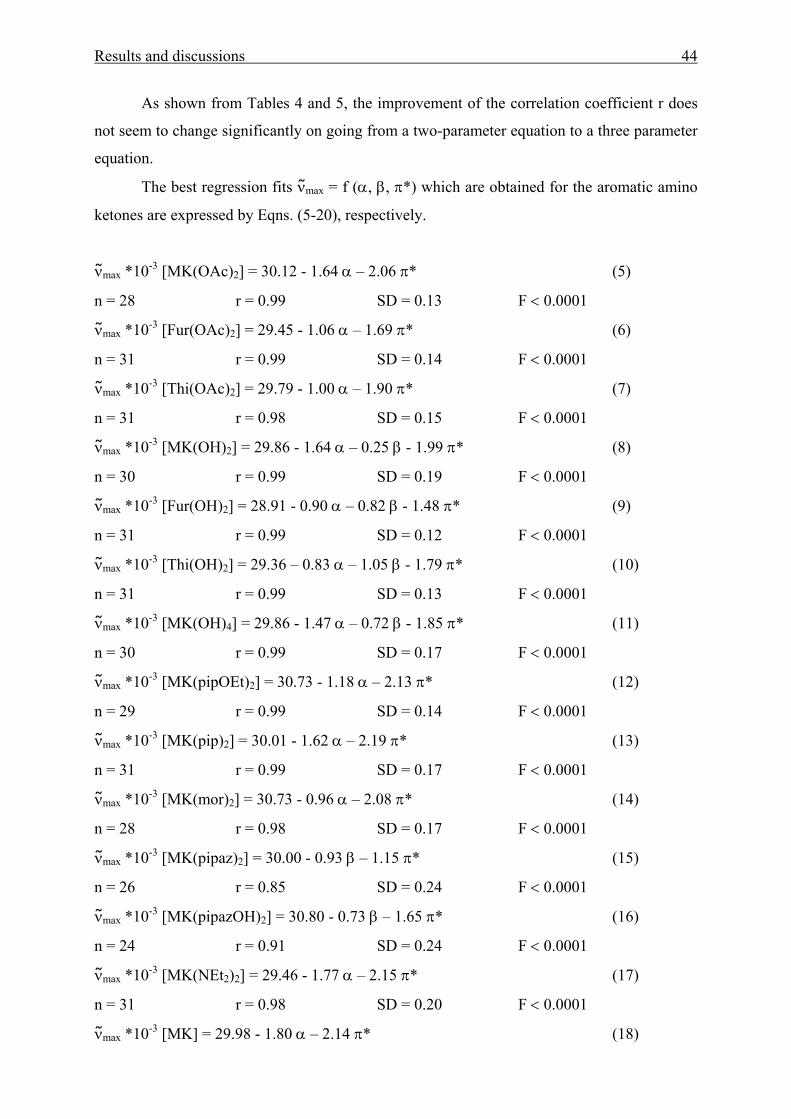
As shown from Tables 4 and 5, the improvement of the correlation coefficient r does
not seem to change significantly on going from a two-parameter equation to a three parameter
equation.
The best regression fits νmax = f (α, β, π*) which are obtained for the aromatic amino
ketones are expressed by Eqns. (5-20), respectively.
νmax *10-3 [MK(OAc)2] = 30.12 - 1.64 α – 2.06 π* (5)
n = 28 r = 0.99 SD = 0.13 F < 0.0001
νmax *10-3 [Fur(OAc)2] = 29.45 - 1.06 α – 1.69 π* (6)
n = 31 r = 0.99 SD = 0.14 F < 0.0001
νmax *10-3 [Thi(OAc)2] = 29.79 - 1.00 α – 1.90 π* (7)
n = 31 r = 0.98 SD = 0.15 F < 0.0001
νmax *10-3 [MK(OH)2] = 29.86 - 1.64 α – 0.25 β - 1.99 π* (8)
n = 30 r = 0.99 SD = 0.19 F < 0.0001
νmax *10-3 [Fur(OH)2] = 28.91 - 0.90 α – 0.82 β - 1.48 π* (9)
n = 31 r = 0.99 SD = 0.12 F < 0.0001
νmax *10-3 [Thi(OH)2] = 29.36 – 0.83 α – 1.05 β - 1.79 π* (10)
n = 31 r = 0.99 SD = 0.13 F < 0.0001
νmax *10-3 [MK(OH)4] = 29.86 - 1.47 α – 0.72 β - 1.85 π* (11)
n = 30 r = 0.99 SD = 0.17 F < 0.0001
νmax *10-3 [MK(pipOEt)2] = 30.73 - 1.18 α – 2.13 π* (12)
n = 29 r = 0.99 SD = 0.14 F < 0.0001
νmax *10-3 [MK(pip)2] = 30.01 - 1.62 α – 2.19 π* (13)
n = 31 r = 0.99 SD = 0.17 F < 0.0001
νmax *10-3 [MK(mor)2] = 30.73 - 0.96 α – 2.08 π* (14)
n = 28 r = 0.98 SD = 0.17 F < 0.0001
νmax *10-3 [MK(pipaz)2] = 30.00 - 0.93 β – 1.15 π* (15)
n = 26 r = 0.85 SD = 0.24 F < 0.0001
νmax *10-3 [MK(pipazOH)2] = 30.80 - 0.73 β – 1.65 π* (16)
n = 24 r = 0.91 SD = 0.24 F < 0.0001
νmax *10-3 [MK(NEt2)2] = 29.46 - 1.77 α – 2.15 π* (17)
n = 31 r = 0.98 SD = 0.20 F < 0.0001
νmax *10-3 [MK] = 29.98 - 1.80 α – 2.14 π* (18)
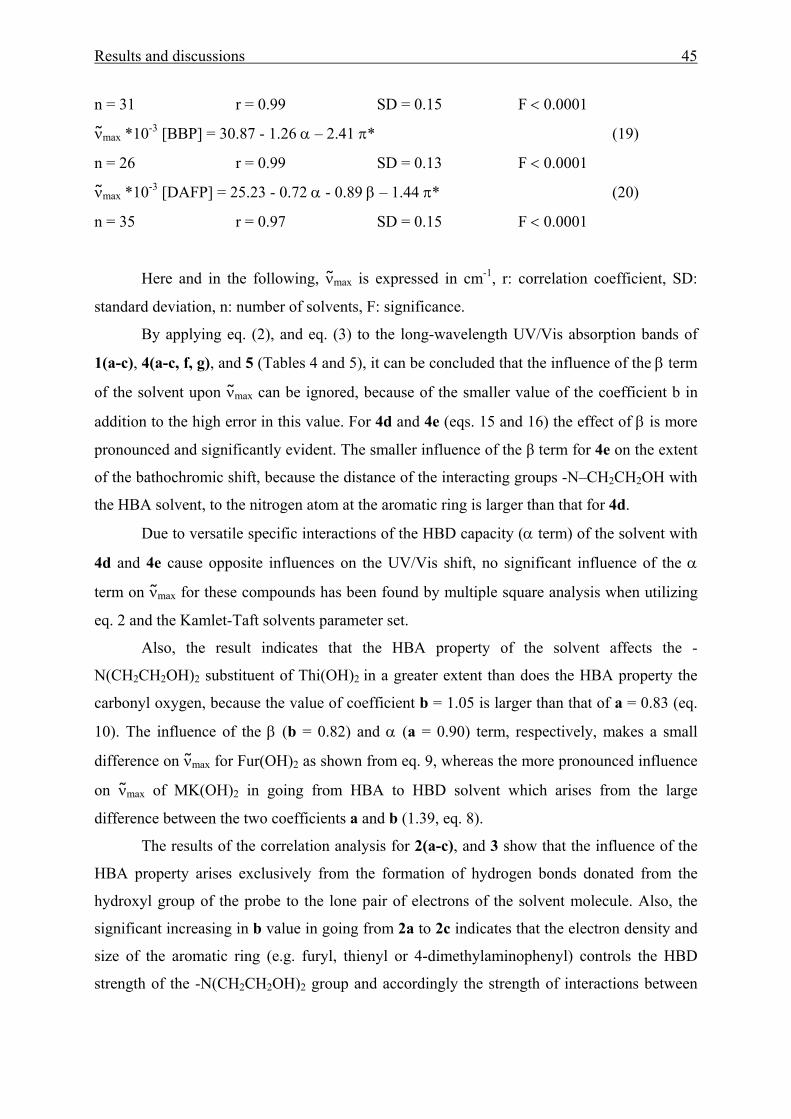
Results and discussions 45
n = 31 r = 0.99 SD = 0.15 F < 0.0001
νmax *10-3 [BBP] = 30.87 - 1.26 α – 2.41 π* (19)
n = 26 r = 0.99 SD = 0.13 F < 0.0001
νmax *10-3 [DAFP] = 25.23 - 0.72 α - 0.89 β – 1.44 π* (20)
n = 35 r = 0.97 SD = 0.15 F < 0.0001
Here and in the following, νmax is expressed in cm-1, r: correlation coefficient, SD:
standard deviation, n: number of solvents, F: significance.
By applying eq. (2), and eq. (3) to the long-wavelength UV/Vis absorption bands of
1(a-c), 4(a-c, f, g), and 5 (Tables 4 and 5), it can be concluded that the influence of the β term
of the solvent upon νmax can be ignored, because of the smaller value of the coefficient b in
addition to the high error in this value. For 4d and 4e (eqs. 15 and 16) the effect of β is more
pronounced and significantly evident. The smaller influence of the β term for 4e on the extent
of the bathochromic shift, because the distance of the interacting groups -N–CH2CH2OH with
the HBA solvent, to the nitrogen atom at the aromatic ring is larger than that for 4d.
Due to versatile specific interactions of the HBD capacity (α term) of the solvent with
4d and 4e cause opposite influences on the UV/Vis shift, no significant influence of the α
term on νmax for these compounds has been found by multiple square analysis when utilizing
eq. 2 and the Kamlet-Taft solvents parameter set.
Also, the result indicates that the HBA property of the solvent affects the -
N(CH2CH2OH)2 substituent of Thi(OH)2 in a greater extent than does the HBA property the
carbonyl oxygen, because the value of coefficient b = 1.05 is larger than that of a = 0.83 (eq.
10). The influence of the β (b = 0.82) and α (a = 0.90) term, respectively, makes a small
difference on νmax for Fur(OH)2 as shown from eq. 9, whereas the more pronounced influence
on νmax of MK(OH)2 in going from HBA to HBD solvent which arises from the large
difference between the two coefficients a and b (1.39, eq. 8).
The results of the correlation analysis for 2(a-c), and 3 show that the influence of the
HBA property arises exclusively from the formation of hydrogen bonds donated from the
hydroxyl group of the probe to the lone pair of electrons of the solvent molecule. Also, the
significant increasing in b value in going from 2a to 2c indicates that the electron density and
size of the aromatic ring (e.g. furyl, thienyl or 4-dimethylaminophenyl) controls the HBD
strength of the -N(CH2CH2OH)2 group and accordingly the strength of interactions between
Results and discussions 46
the HBD groups and the HBA substituents (either the lone pair of electrons on nitrogen and
oxygen atom and/ or of the heterocyclic moieties) of the molecules.
The negative signs of the s coefficients indicate that in increasing the solvent
dipolarity/ polarizability (π*), a bathochromic shift of νmax for all these compounds is
observed. This result demonstrates that the singlet excited state of these molecules becomes
more stabilized when the solvents dipolarity increases.
The influence of the π* on the bathochromic shift of νmax [DAFP] is more pronounced
than the α term (s /a ≈ 2, eq. 20). This demonstrates that the ability of the solvent to donate
hydrogen bonds is weaker than do solute-solvent dipole-dipole interactions occurring
preferably in the excited singlet state of the above compounds. Thus, a satisfactory linear
correlation with high significance is also observed between νmax [DAFP] and solely the
Kamlet-Taft’s solvation parameter π* (eq. 21).
νmax *10-3 [DAFP] = 24.66 – 1.60 π* (21)
n = 35 r = 0.62 SD = 0.52 F < 0.0001
On going from a three-parameter equation with π*, α and β, to a two-parameter
equation considering only π* and α, a significant change in the correlation coefficient r for
DAFP produced (eq. 22).
νmax *10-3 [DAFP] = 24.85 – 1.43 π* - 0.78 α (22)
n = 35 r = 0.89 SD = 0.31 F < 0.0001
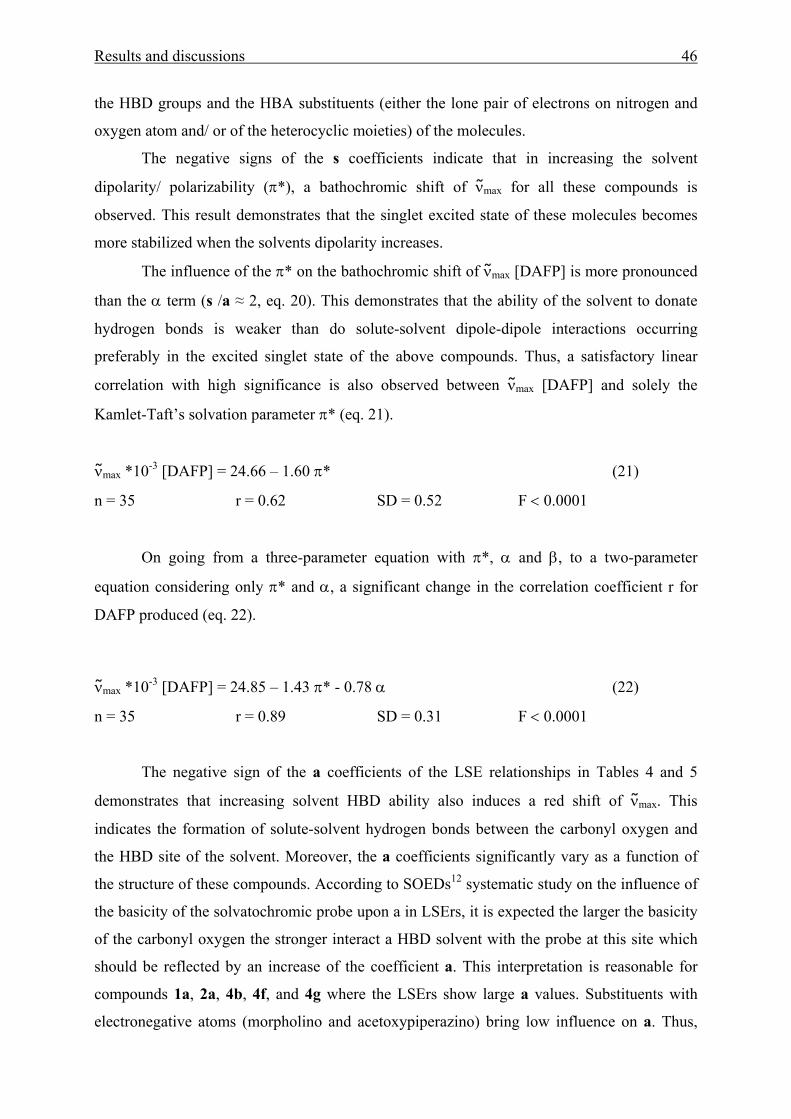
The negative sign of the a coefficients of the LSE relationships in Tables 4 and 5
demonstrates that increasing solvent HBD ability also induces a red shift of νmax. This
indicates the formation of solute-solvent hydrogen bonds between the carbonyl oxygen and
the HBD site of the solvent. Moreover, the a coefficients significantly vary as a function of
the structure of these compounds. According to SOEDs12 systematic study on the influence of
the basicity of the solvatochromic probe upon a in LSErs, it is expected the larger the basicity
of the carbonyl oxygen the stronger interact a HBD solvent with the probe at this site which
should be reflected by an increase of the coefficient a. This interpretation is reasonable for
compounds 1a, 2a, 4b, 4f, and 4g where the LSErs show large a values. Substituents with
electronegative atoms (morpholino and acetoxypiperazino) bring low influence on a. Thus,
Results and discussions 47
the LSEr of 4c and 4a show lower values of the a coefficient than 4f and 4b. In increasing the
HAMMETT σp+-substituent constant,41 an increase of a is expected.12 In general it seems that
the specific acid-base interactions are difficult to quantify, because basicity parameters for the
compounds used are still not available and difficulty to determine.
Also, the value of the coefficient a (Tables 4 and 5) decreases in the following order:
MK [a = 1.80] > MK(NEt2)2 [a = 1.77] > MK(pip)2 [a = 1.62] > MK(OH)2 [a = 1.64] >
MK(OAc)2 [a = 1.61] > MK(OH)4 [a = 1.47] > MK(pipOEt)2 [a = 1.36] > BBP [a = 1.25] >
MK(mor)2 [a = 1.13] > Fur(OAc)2 [a = 1.07] > Thi(OAc)2 [a = 1.01] > Fur(OH)2 [a = 0.90] >
Thi(OH)2 [a = 0.83] > MK(pipaz)2 [a = 0.14] > MK(pipazOH)2 [a = 0.01]. It is likely that the
electron-donor strength (+M effect) of the p-substituent decreases in the same order.
However, the basicity of the carbonyl oxygen can be reflected in particular by the 13C-
NMR chemical shift of the corresponding carbonyl carbon atom. The expected trend is
detectable. However, a linear fit is not obtained between δ of 13C(CO) (in ppm) (Experimental
Section) and a, because s is also affected by the respective substituent. Furthermore, cyclic
substituents cause additional steric peculiarities. Thus, in saturated six membered ring
systems, like the piperidino substituent, which adopts a rigid chair conformation, the
equatorial protons of the α methylene groups are directed towards the H-atoms in the ortho
position of the aromatic ring. The –CH2- groups of the linked rigid six membered rings are
restricted in their thermally induced rotation compared to a single methyl or ethyl substituent.
The later arrangement induces an average mesomeric effect taking into account all
conformation states of rotation. For rigid six memebered rings, as a result of enhanced
twisting of the aromatic ring and the +M substituent, due to conformational restriction, a
hypsochromic shift upon νmax is the result, because the overall extend of π conjugation is
lowered.
The decrease of the +M effect from diethylamino > dimethylamino > piperidino>
morpholino is supported by 1H NMR spectroscopic studies using data from the ortho H-
position of –NR2 substituted benzenes.110 Dipole moments (µ in debye) of related N-phenyl
amines also show a decrease of the +M effect in the order –N(C2H5)2 (µ = 1.80) > piperidino
(µ = 1.41±0.02) > morpholino (µ = 0.58±0.01). The dipole moments are taken from ref.111
Also, Effenberger et al. have shown that a –N(CH3)2 substituent possess a stronger +M
effect (quantitative parameter for the mesomeric potential k = 0.84) than does a piperidino
ring (k = 0.775), which agrees with the results from solvatochromic measurements.
The s coefficient significantly increases from Fur(OAc)2 (s = 1.69) to MK(OAc)2 (s =
1.98) and from Fur(OH)2 (s = 1.48) to MK(OH)2 (s = 1.99), which indicates that the
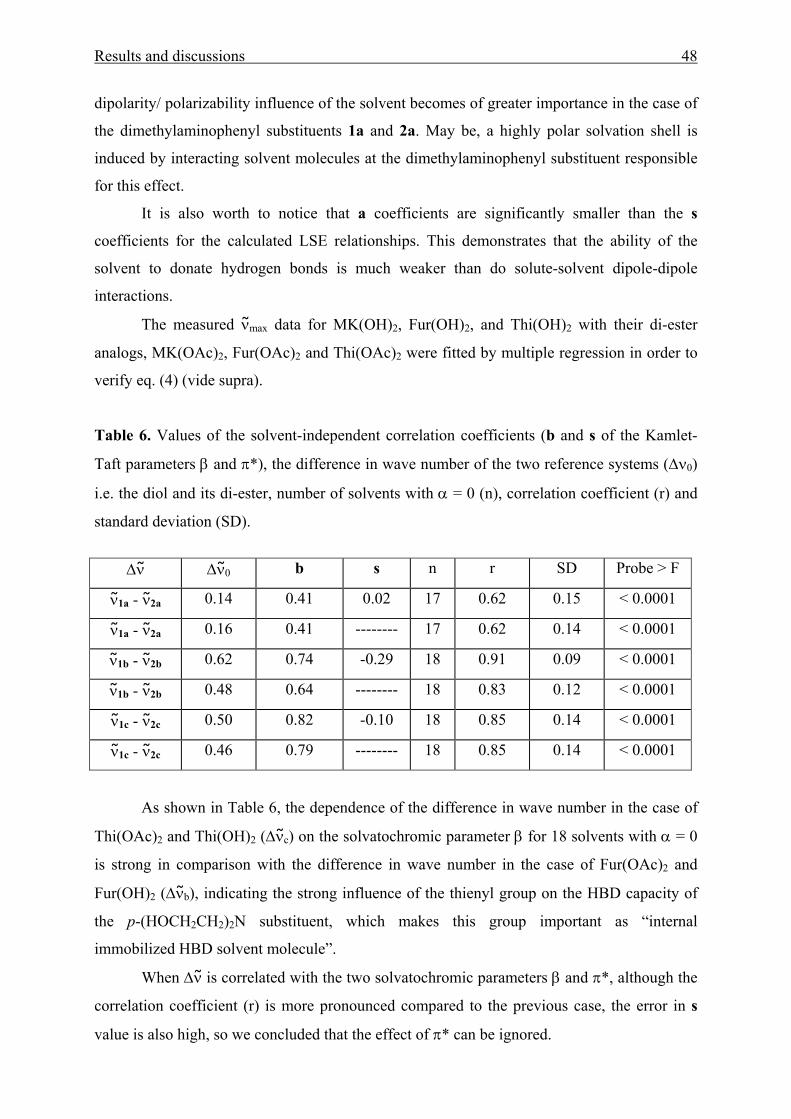
Results and discussions 48
dipolarity/ polarizability influence of the solvent becomes of greater importance in the case of
the dimethylaminophenyl substituents 1a and 2a. May be, a highly polar solvation shell is
induced by interacting solvent molecules at the dimethylaminophenyl substituent responsible
for this effect.
It is also worth to notice that a coefficients are significantly smaller than the s
coefficients for the calculated LSE relationships. This demonstrates that the ability of the
solvent to donate hydrogen bonds is much weaker than do solute-solvent dipole-dipole
interactions.
The measured νmax data for MK(OH)2, Fur(OH)2, and Thi(OH)2 with their di-ester
analogs, MK(OAc)2, Fur(OAc)2 and Thi(OAc)2 were fitted by multiple regression in order to
verify eq. (4) (vide supra).
Table 6. Values of the solvent-independent correlation coefficients (b and s of the Kamlet-
Taft parameters β and π*), the difference in wave number of the two reference systems (∆ν0)
i.e. the diol and its di-ester, number of solvents with α = 0 (n), correlation coefficient (r) and
standard deviation (SD).
As shown in Table 6, the dependence of the difference in wave number in the case of
Thi(OAc)2 and Thi(OH)2 (∆ν c) on the solvatochromic parameter β for 18 solvents with α = 0
is strong in comparison with the difference in wave number in the case of Fur(OAc)2 and
Fur(OH)2 (∆ν b), indicating the strong influence of the thienyl group on the HBD capacity of
the p-(HOCH2CH2)2N substituent, which makes this group important as “internal
immobilized HBD solvent molecule”.
When ∆ν is correlated with the two solvatochromic parameters β and π*, although the
correlation coefficient (r) is more pronounced compared to the previous case, the error in s
value is also high, so we concluded that the effect of π* can be ignored.
∆ν ∆ν 0 b s n r SD Probe > F
ν1a - ν2a 0.14 0.41 0.02 17 0.62 0.15 < 0.0001
ν1a - ν2a 0.16 0.41 -------- 17 0.62 0.14 < 0.0001
ν1b - ν2b 0.62 0.74 -0.29 18 0.91 0.09 < 0.0001
ν1b - ν2b 0.48 0.64 -------- 18 0.83 0.12 < 0.0001
ν1c - ν2c 0.50 0.82 -0.10 18 0.85 0.14 < 0.0001
ν1c - ν2c 0.46 0.79 -------- 18 0.85 0.14 < 0.0001
Results and discussions 49
We have shown that UV/Vis shifts of the compounds are significantly influenced by
external interactions as demonstrated by solvent molecules as model. For each compound
used depending on the structure of the aromatic moiety, the respective contributions of acid
and basic sites of an externally interacting partner is significantly different as shown by the
coefficients ratios of the LSE relationship a/ s, a/ b, and b/ s.
Also, the solvatochromic parameters (α, β and π*) as function of νmax have been
determined by means of multiple regression analysis as shown from Tables 7 and 8.
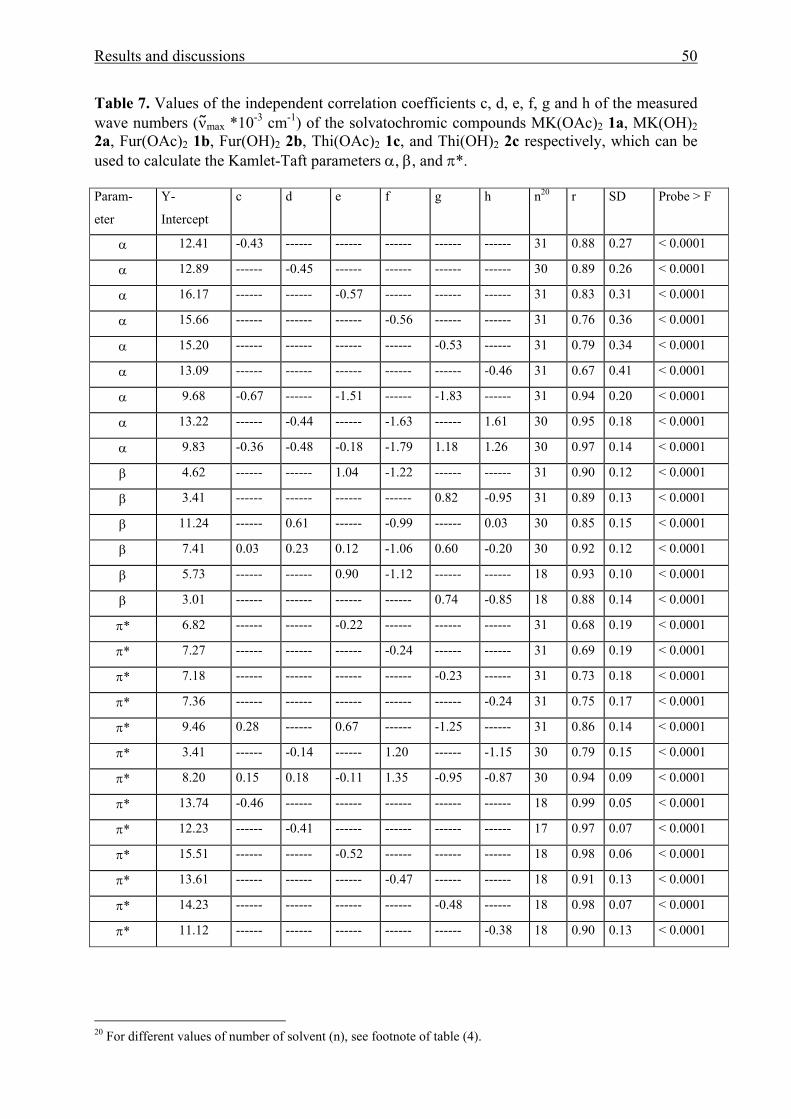
Results and discussions 50
Table 7. Values of the independent correlation coefficients c, d, e, f, g and h of the measured wave numbers (νmax *10-3 cm-1) of the solvatochromic compounds MK(OAc)2 1a, MK(OH)2 2a, Fur(OAc)2 1b, Fur(OH)2 2b, Thi(OAc)2 1c, and Thi(OH)2 2c respectively, which can be used to calculate the Kamlet-Taft parameters α, β, and π*.
20 For different values of number of solvent (n), see footnote of table (4).
Param-
eter
Y-
Intercept
c d e f g h n20 r SD Probe > F
α 12.41 -0.43 ------ ------ ------ ------ ------ 31 0.88 0.27 < 0.0001
α 12.89 ------ -0.45 ------ ------ ------ ------ 30 0.89 0.26 < 0.0001
α 16.17 ------ ------ -0.57 ------ ------ ------ 31 0.83 0.31 < 0.0001
α 15.66 ------ ------ ------ -0.56 ------ ------ 31 0.76 0.36 < 0.0001
α 15.20 ------ ------ ------ ------ -0.53 ------ 31 0.79 0.34 < 0.0001
α 13.09 ------ ------ ------ ------ ------ -0.46 31 0.67 0.41 < 0.0001
α 9.68 -0.67 ------ -1.51 ------ -1.83 ------ 31 0.94 0.20 < 0.0001
α 13.22 ------ -0.44 ------ -1.63 ------ 1.61 30 0.95 0.18 < 0.0001
α 9.83 -0.36 -0.48 -0.18 -1.79 1.18 1.26 30 0.97 0.14 < 0.0001
β 4.62 ------ ------ 1.04 -1.22 ------ ------ 31 0.90 0.12 < 0.0001
β 3.41 ------ ------ ------ ------ 0.82 -0.95 31 0.89 0.13 < 0.0001
β 11.24 ------ 0.61 ------ -0.99 ------ 0.03 30 0.85 0.15 < 0.0001
β 7.41 0.03 0.23 0.12 -1.06 0.60 -0.20 30 0.92 0.12 < 0.0001
β 5.73 ------ ------ 0.90 -1.12 ------ ------ 18 0.93 0.10 < 0.0001
β 3.01 ------ ------ ------ ------ 0.74 -0.85 18 0.88 0.14 < 0.0001
π* 6.82 ------ ------ -0.22 ------ ------ ------ 31 0.68 0.19 < 0.0001
π* 7.27 ------ ------ ------ -0.24 ------ ------ 31 0.69 0.19 < 0.0001
π* 7.18 ------ ------ ------ ------ -0.23 ------ 31 0.73 0.18 < 0.0001
π* 7.36 ------ ------ ------ ------ ------ -0.24 31 0.75 0.17 < 0.0001
π* 9.46 0.28 ------ 0.67 ------ -1.25 ------ 31 0.86 0.14 < 0.0001
π* 3.41 ------ -0.14 ------ 1.20 ------ -1.15 30 0.79 0.15 < 0.0001
π* 8.20 0.15 0.18 -0.11 1.35 -0.95 -0.87 30 0.94 0.09 < 0.0001
π* 13.74 -0.46 ------ ------ ------ ------ ------ 18 0.99 0.05 < 0.0001
π* 12.23 ------ -0.41 ------ ------ ------ ------ 17 0.97 0.07 < 0.0001
π* 15.51 ------ ------ -0.52 ------ ------ ------ 18 0.98 0.06 < 0.0001
π* 13.61 ------ ------ ------ -0.47 ------ ------ 18 0.91 0.13 < 0.0001
π* 14.23 ------ ------ ------ ------ -0.48 ------ 18 0.98 0.07 < 0.0001
π* 11.12 ------ ------ ------ ------ ------ -0.38 18 0.90 0.13 < 0.0001
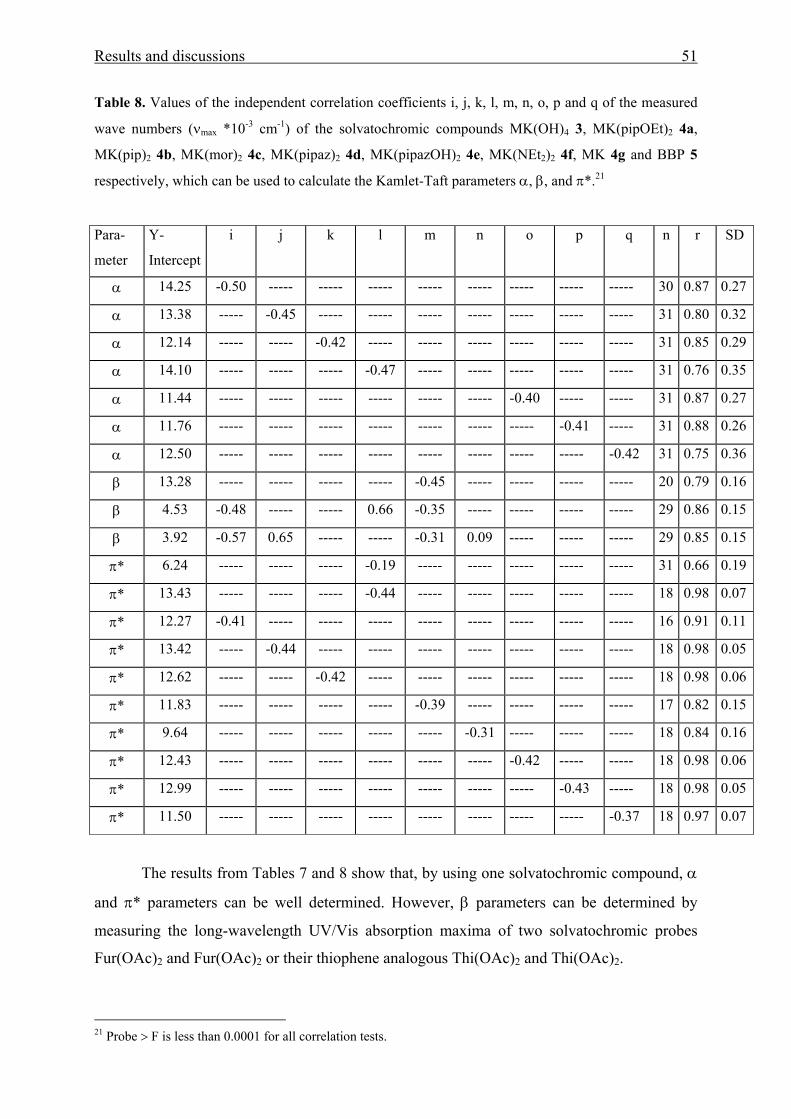
Results and discussions 51
Table 8. Values of the independent correlation coefficients i, j, k, l, m, n, o, p and q of the measured
wave numbers (νmax *10-3 cm-1) of the solvatochromic compounds MK(OH)4 3, MK(pipOEt)2 4a,
MK(pip)2 4b, MK(mor)2 4c, MK(pipaz)2 4d, MK(pipazOH)2 4e, MK(NEt2)2 4f, MK 4g and BBP 5
respectively, which can be used to calculate the Kamlet-Taft parameters α, β, and π*.21
The results from Tables 7 and 8 show that, by using one solvatochromic compound, α
and π* parameters can be well determined. However, β parameters can be determined by
measuring the long-wavelength UV/Vis absorption maxima of two solvatochromic probes
Fur(OAc)2 and Fur(OAc)2 or their thiophene analogous Thi(OAc)2 and Thi(OAc)2.
21 Probe > F is less than 0.0001 for all correlation tests.
Para-
meter
Y-
Intercept
i j k l m n o p q n r SD
α 14.25 -0.50 ----- ----- ----- ----- ----- ----- ----- ----- 30 0.87 0.27
α 13.38 ----- -0.45 ----- ----- ----- ----- ----- ----- ----- 31 0.80 0.32
α 12.14 ----- ----- -0.42 ----- ----- ----- ----- ----- ----- 31 0.85 0.29
α 14.10 ----- ----- ----- -0.47 ----- ----- ----- ----- ----- 31 0.76 0.35
α 11.44 ----- ----- ----- ----- ----- ----- -0.40 ----- ----- 31 0.87 0.27
α 11.76 ----- ----- ----- ----- ----- ----- ----- -0.41 ----- 31 0.88 0.26
α 12.50 ----- ----- ----- ----- ----- ----- ----- ----- -0.42 31 0.75 0.36
β 13.28 ----- ----- ----- ----- -0.45 ----- ----- ----- ----- 20 0.79 0.16
β 4.53 -0.48 ----- ----- 0.66 -0.35 ----- ----- ----- ----- 29 0.86 0.15
β 3.92 -0.57 0.65 ----- ----- -0.31 0.09 ----- ----- ----- 29 0.85 0.15
π* 6.24 ----- ----- ----- -0.19 ----- ----- ----- ----- ----- 31 0.66 0.19
π* 13.43 ----- ----- ----- -0.44 ----- ----- ----- ----- ----- 18 0.98 0.07
π* 12.27 -0.41 ----- ----- ----- ----- ----- ----- ----- ----- 16 0.91 0.11
π* 13.42 ----- -0.44 ----- ----- ----- ----- ----- ----- ----- 18 0.98 0.05
π* 12.62 ----- ----- -0.42 ----- ----- ----- ----- ----- ----- 18 0.98 0.06
π* 11.83 ----- ----- ----- ----- -0.39 ----- ----- ----- ----- 17 0.82 0.15
π* 9.64 ----- ----- ----- ----- ----- -0.31 ----- ----- ----- 18 0.84 0.16
π* 12.43 ----- ----- ----- ----- ----- ----- -0.42 ----- ----- 18 0.98 0.06
π* 12.99 ----- ----- ----- ----- ----- ----- ----- -0.43 ----- 18 0.98 0.05
π* 11.50 ----- ----- ----- ----- ----- ----- ----- ----- -0.37 18 0.97 0.07
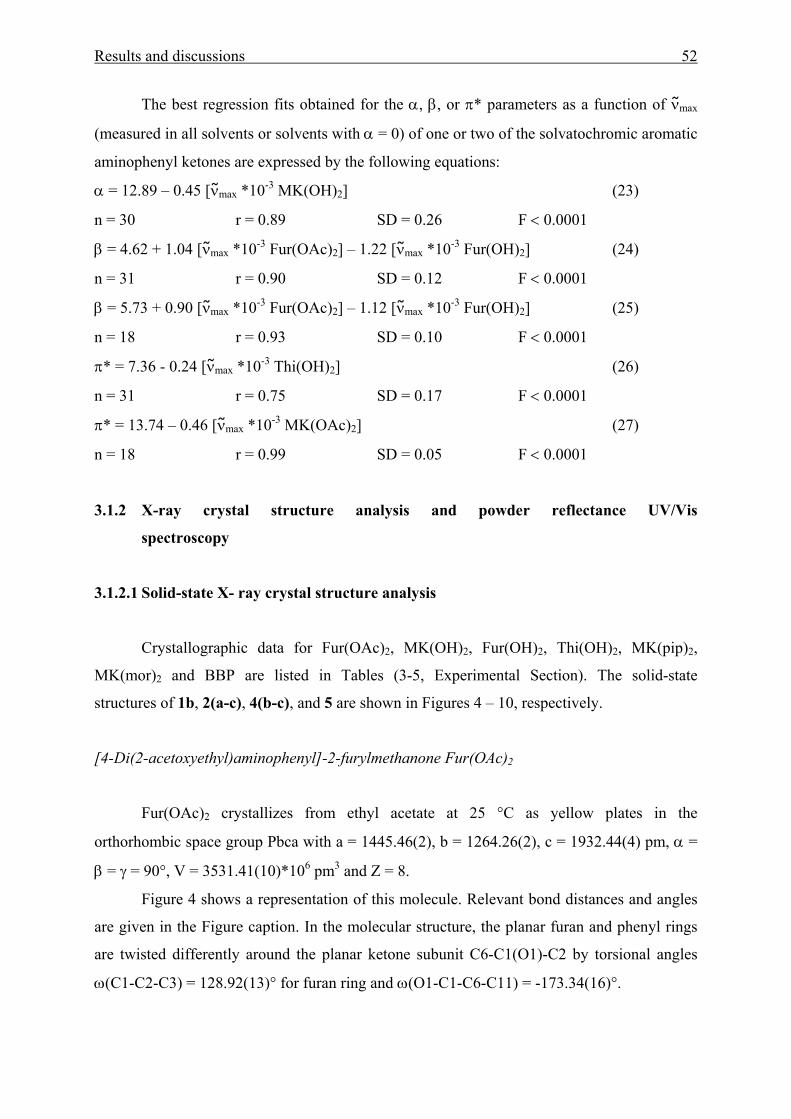
Results and discussions 52
The best regression fits obtained for the α, β, or π* parameters as a function of νmax
(measured in all solvents or solvents with α = 0) of one or two of the solvatochromic aromatic
aminophenyl ketones are expressed by the following equations:
α = 12.89 – 0.45 [νmax *10-3 MK(OH)2] (23)
n = 30 r = 0.89 SD = 0.26 F < 0.0001
β = 4.62 + 1.04 [νmax *10-3 Fur(OAc)2] – 1.22 [νmax *10-3 Fur(OH)2] (24)
n = 31 r = 0.90 SD = 0.12 F < 0.0001
β = 5.73 + 0.90 [νmax *10-3 Fur(OAc)2] – 1.12 [νmax *10-3 Fur(OH)2] (25)
n = 18 r = 0.93 SD = 0.10 F < 0.0001
π* = 7.36 - 0.24 [νmax *10-3 Thi(OH)2] (26)
n = 31 r = 0.75 SD = 0.17 F < 0.0001
π* = 13.74 – 0.46 [νmax *10-3 MK(OAc)2] (27)
n = 18 r = 0.99 SD = 0.05 F < 0.0001
3.1.2 X-ray crystal structure analysis and powder reflectance UV/Vis
spectroscopy
3.1.2.1 Solid-state X- ray crystal structure analysis
Crystallographic data for Fur(OAc)2, MK(OH)2, Fur(OH)2, Thi(OH)2, MK(pip)2,
MK(mor)2 and BBP are listed in Tables (3-5, Experimental Section). The solid-state
structures of 1b, 2(a-c), 4(b-c), and 5 are shown in Figures 4 – 10, respectively.
[4-Di(2-acetoxyethyl)aminophenyl]-2-furylmethanone Fur(OAc)2
Fur(OAc)2 crystallizes from ethyl acetate at 25 °C as yellow plates in the
orthorhombic space group Pbca with a = 1445.46(2), b = 1264.26(2), c = 1932.44(4) pm, α =
β = γ = 90°, V = 3531.41(10)*106 pm3 and Z = 8.
Figure 4 shows a representation of this molecule. Relevant bond distances and angles
are given in the Figure caption. In the molecular structure, the planar furan and phenyl rings
are twisted differently around the planar ketone subunit C6-C1(O1)-C2 by torsional angles
ω(C1-C2-C3) = 128.92(13)° for furan ring and ω(O1-C1-C6-C11) = -173.34(16)°.
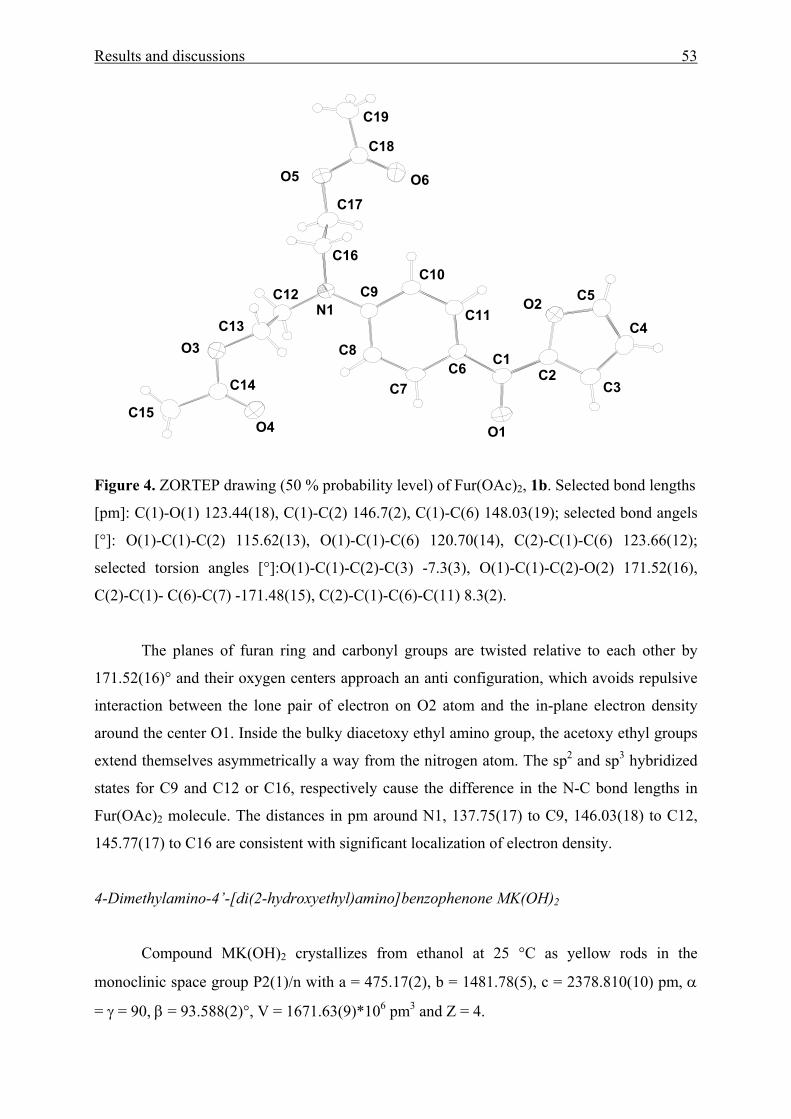
Results and discussions 53
C19
O5
C18
O6
C17
C16
C12
O3
N1C13
C15
C14
C9C10
O4
C11
C8
C7C6
O2 C5
C1C2
C4
O1
C3
Figure 4. ZORTEP drawing (50 % probability level) of Fur(OAc)2, 1b. Selected bond lengths
[pm]: C(1)-O(1) 123.44(18), C(1)-C(2) 146.7(2), C(1)-C(6) 148.03(19); selected bond angels
[°]: O(1)-C(1)-C(2) 115.62(13), O(1)-C(1)-C(6) 120.70(14), C(2)-C(1)-C(6) 123.66(12);
selected torsion angles [°]:O(1)-C(1)-C(2)-C(3) -7.3(3), O(1)-C(1)-C(2)-O(2) 171.52(16),
C(2)-C(1)- C(6)-C(7) -171.48(15), C(2)-C(1)-C(6)-C(11) 8.3(2).
The planes of furan ring and carbonyl groups are twisted relative to each other by
171.52(16)° and their oxygen centers approach an anti configuration, which avoids repulsive
interaction between the lone pair of electron on O2 atom and the in-plane electron density
around the center O1. Inside the bulky diacetoxy ethyl amino group, the acetoxy ethyl groups
extend themselves asymmetrically a way from the nitrogen atom. The sp2 and sp3 hybridized
states for C9 and C12 or C16, respectively cause the difference in the N-C bond lengths in
Fur(OAc)2 molecule. The distances in pm around N1, 137.75(17) to C9, 146.03(18) to C12,
145.77(17) to C16 are consistent with significant localization of electron density.
4-Dimethylamino-4’-[di(2-hydroxyethyl)amino]benzophenone MK(OH)2
Compound MK(OH)2 crystallizes from ethanol at 25 °C as yellow rods in the
monoclinic space group P2(1)/n with a = 475.17(2), b = 1481.78(5), c = 2378.810(10) pm, α
= γ = 90, β = 93.588(2)°, V = 1671.63(9)*106 pm3 and Z = 4.
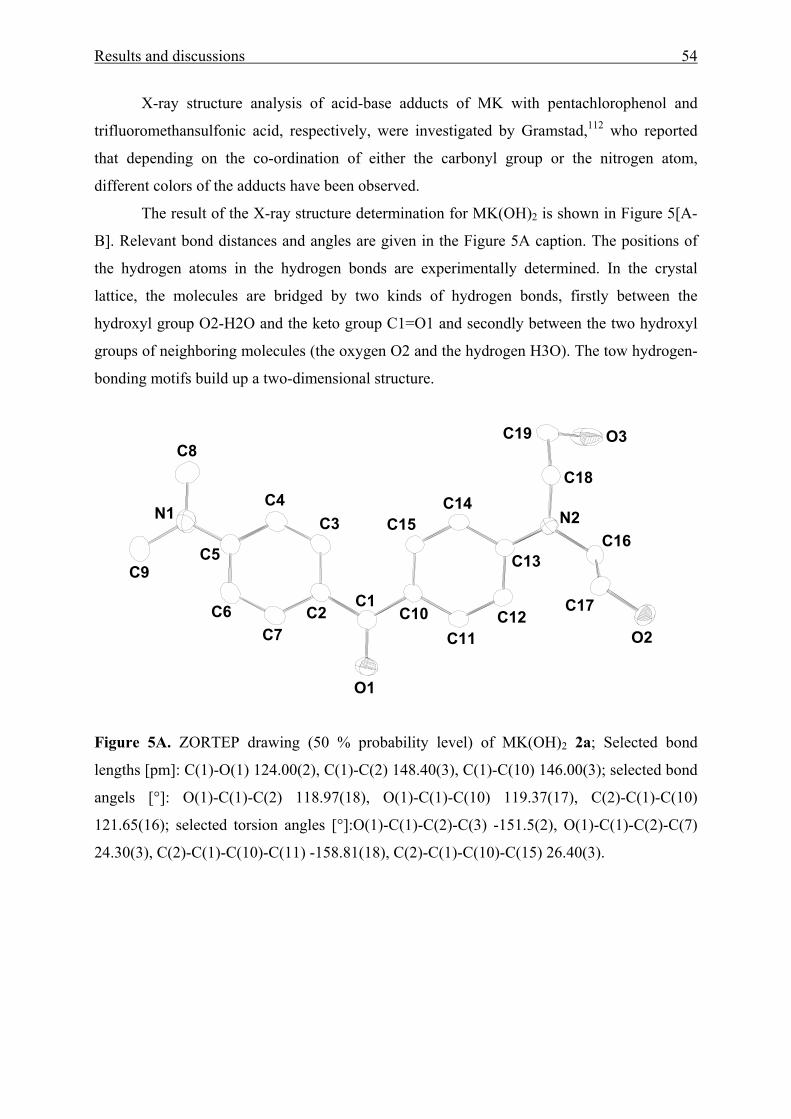
Results and discussions 54
X-ray structure analysis of acid-base adducts of MK with pentachlorophenol and
trifluoromethansulfonic acid, respectively, were investigated by Gramstad,112 who reported
that depending on the co-ordination of either the carbonyl group or the nitrogen atom,
different colors of the adducts have been observed.
The result of the X-ray structure determination for MK(OH)2 is shown in Figure 5[A-
B]. Relevant bond distances and angles are given in the Figure 5A caption. The positions of
the hydrogen atoms in the hydrogen bonds are experimentally determined. In the crystal
lattice, the molecules are bridged by two kinds of hydrogen bonds, firstly between the
hydroxyl group O2-H2O and the keto group C1=O1 and secondly between the two hydroxyl
groups of neighboring molecules (the oxygen O2 and the hydrogen H3O). The tow hydrogen-
bonding motifs build up a two-dimensional structure.
C9
C6
N1
C7
C5
C8
O1
C2
C4
C1
C3
C10C11
C15
C12
C14
C13
N2C16
C17
O2
C18
C19 O3
Figure 5A. ZORTEP drawing (50 % probability level) of MK(OH)2 2a; Selected bond
lengths [pm]: C(1)-O(1) 124.00(2), C(1)-C(2) 148.40(3), C(1)-C(10) 146.00(3); selected bond
angels [°]: O(1)-C(1)-C(2) 118.97(18), O(1)-C(1)-C(10) 119.37(17), C(2)-C(1)-C(10)
121.65(16); selected torsion angles [°]:O(1)-C(1)-C(2)-C(3) -151.5(2), O(1)-C(1)-C(2)-C(7)
24.30(3), C(2)-C(1)-C(10)-C(11) -158.81(18), C(2)-C(1)-C(10)-C(15) 26.40(3).
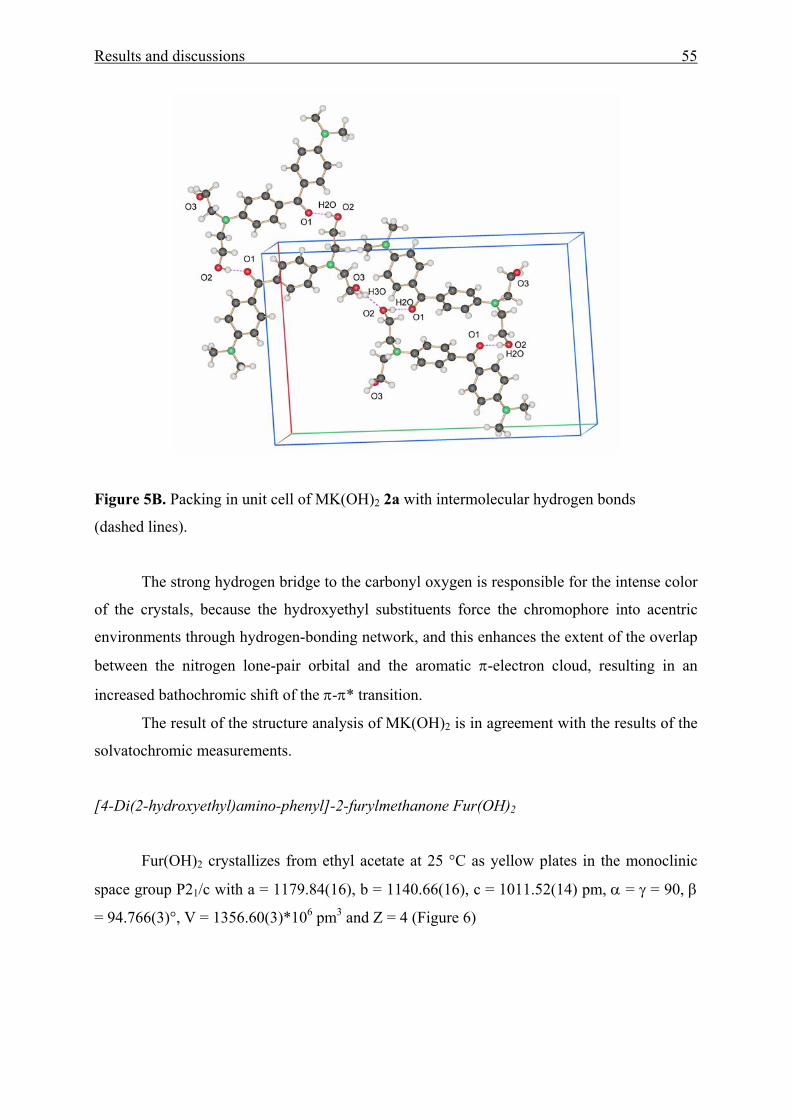
Results and discussions 55
Figure 5B. Packing in unit cell of MK(OH)2 2a with intermolecular hydrogen bonds
(dashed lines).
The strong hydrogen bridge to the carbonyl oxygen is responsible for the intense color
of the crystals, because the hydroxyethyl substituents force the chromophore into acentric
environments through hydrogen-bonding network, and this enhances the extent of the overlap
between the nitrogen lone-pair orbital and the aromatic π-electron cloud, resulting in an
increased bathochromic shift of the π-π* transition.
The result of the structure analysis of MK(OH)2 is in agreement with the results of the
solvatochromic measurements.
[4-Di(2-hydroxyethyl)amino-phenyl]-2-furylmethanone Fur(OH)2
Fur(OH)2 crystallizes from ethyl acetate at 25 °C as yellow plates in the monoclinic
space group P21/c with a = 1179.84(16), b = 1140.66(16), c = 1011.52(14) pm, α = γ = 90, β
= 94.766(3)°, V = 1356.60(3)*106 pm3 and Z = 4 (Figure 6)
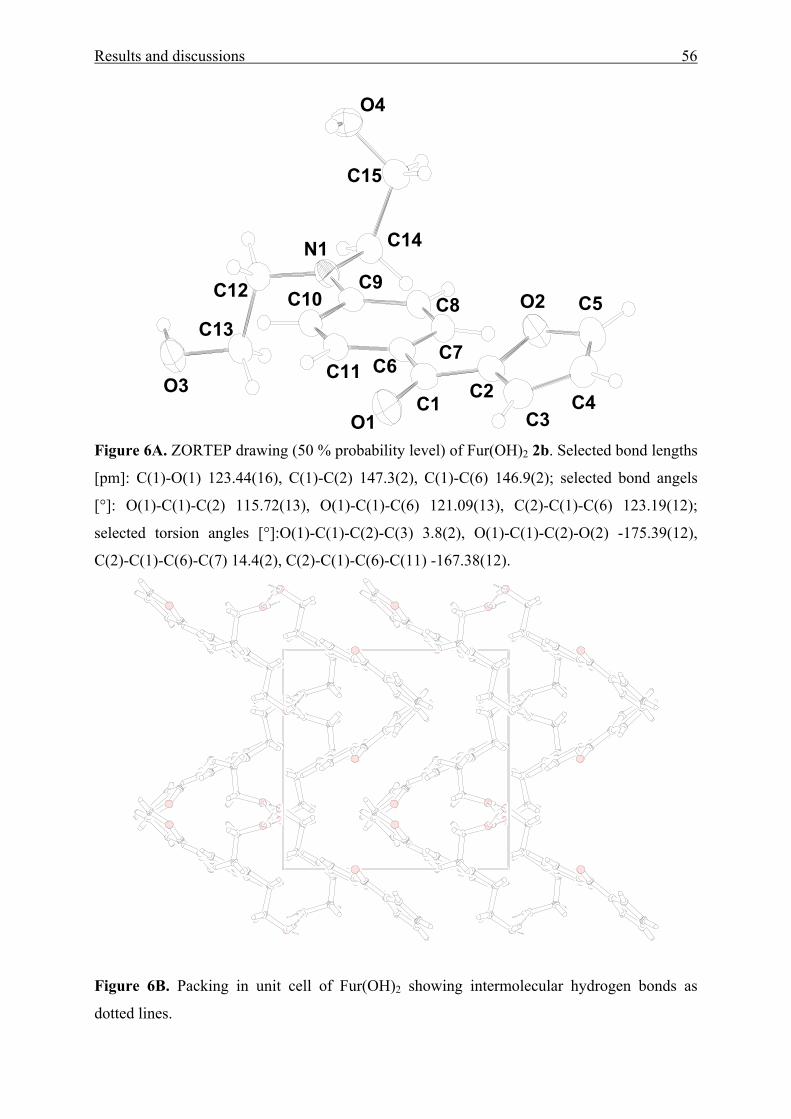
Results and discussions 56
C3C4
O1C2
C5
C1
O2
C6C11C7
C10 C8C9
N1
C12
C13
O3
C14
C15
O4
Figure 6A. ZORTEP drawing (50 % probability level) of Fur(OH)2 2b. Selected bond lengths
[pm]: C(1)-O(1) 123.44(16), C(1)-C(2) 147.3(2), C(1)-C(6) 146.9(2); selected bond angels
[°]: O(1)-C(1)-C(2) 115.72(13), O(1)-C(1)-C(6) 121.09(13), C(2)-C(1)-C(6) 123.19(12);
selected torsion angles [°]:O(1)-C(1)-C(2)-C(3) 3.8(2), O(1)-C(1)-C(2)-O(2) -175.39(12),
C(2)-C(1)-C(6)-C(7) 14.4(2), C(2)-C(1)-C(6)-C(11) -167.38(12).
Figure 6B. Packing in unit cell of Fur(OH)2 showing intermolecular hydrogen bonds as
dotted lines.
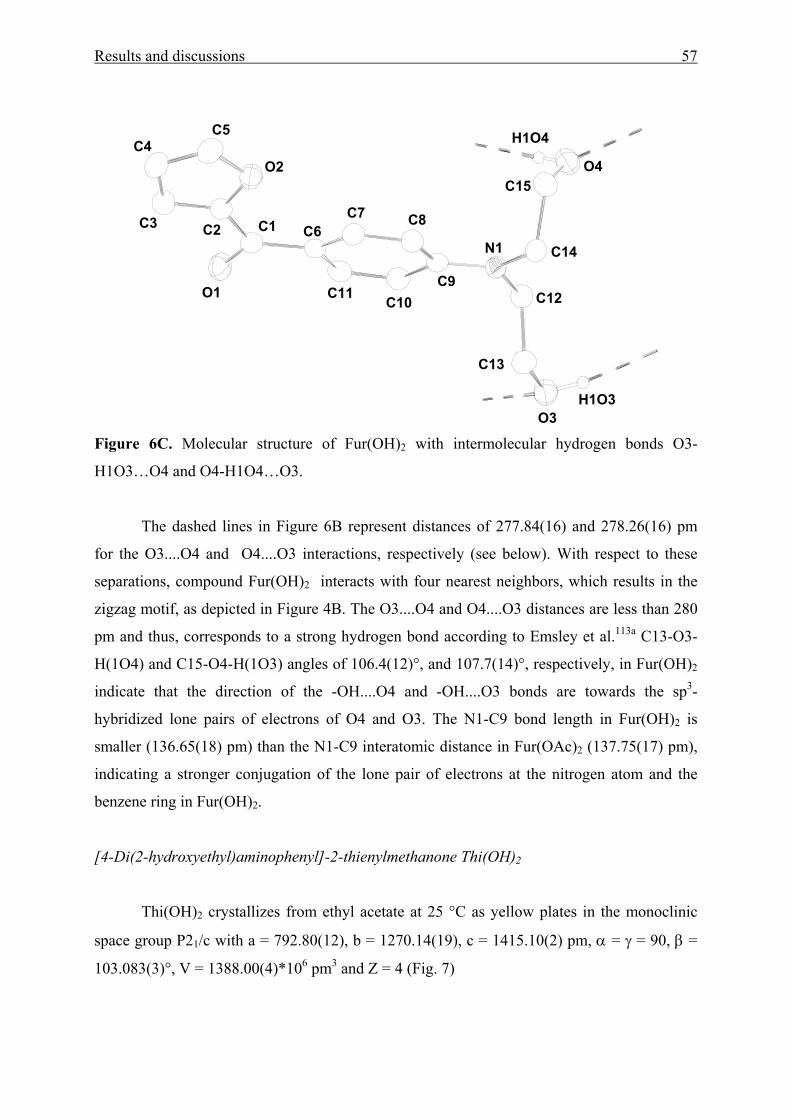
Results and discussions 57
C3
C4
O1
C2
C5
C1
O2
C6
C11
C7
C10
C8
C9
N1
C12
C13
O3
C14
C15O4
H1O3
H1O4
Figure 6C. Molecular structure of Fur(OH)2 with intermolecular hydrogen bonds O3-
H1O3…O4 and O4-H1O4…O3.
The dashed lines in Figure 6B represent distances of 277.84(16) and 278.26(16) pm
for the O3....O4 and O4....O3 interactions, respectively (see below). With respect to these
separations, compound Fur(OH)2 interacts with four nearest neighbors, which results in the
zigzag motif, as depicted in Figure 4B. The O3....O4 and O4....O3 distances are less than 280
pm and thus, corresponds to a strong hydrogen bond according to Emsley et al.113a C13-O3-
H(1O4) and C15-O4-H(1O3) angles of 106.4(12)°, and 107.7(14)°, respectively, in Fur(OH)2
indicate that the direction of the -OH....O4 and -OH....O3 bonds are towards the sp3-
hybridized lone pairs of electrons of O4 and O3. The N1-C9 bond length in Fur(OH)2 is
smaller (136.65(18) pm) than the N1-C9 interatomic distance in Fur(OAc)2 (137.75(17) pm),
indicating a stronger conjugation of the lone pair of electrons at the nitrogen atom and the
benzene ring in Fur(OH)2.
[4-Di(2-hydroxyethyl)aminophenyl]-2-thienylmethanone Thi(OH)2
Thi(OH)2 crystallizes from ethyl acetate at 25 °C as yellow plates in the monoclinic
space group P21/c with a = 792.80(12), b = 1270.14(19), c = 1415.10(2) pm, α = γ = 90, β =
103.083(3)°, V = 1388.00(4)*106 pm3 and Z = 4 (Fig. 7)
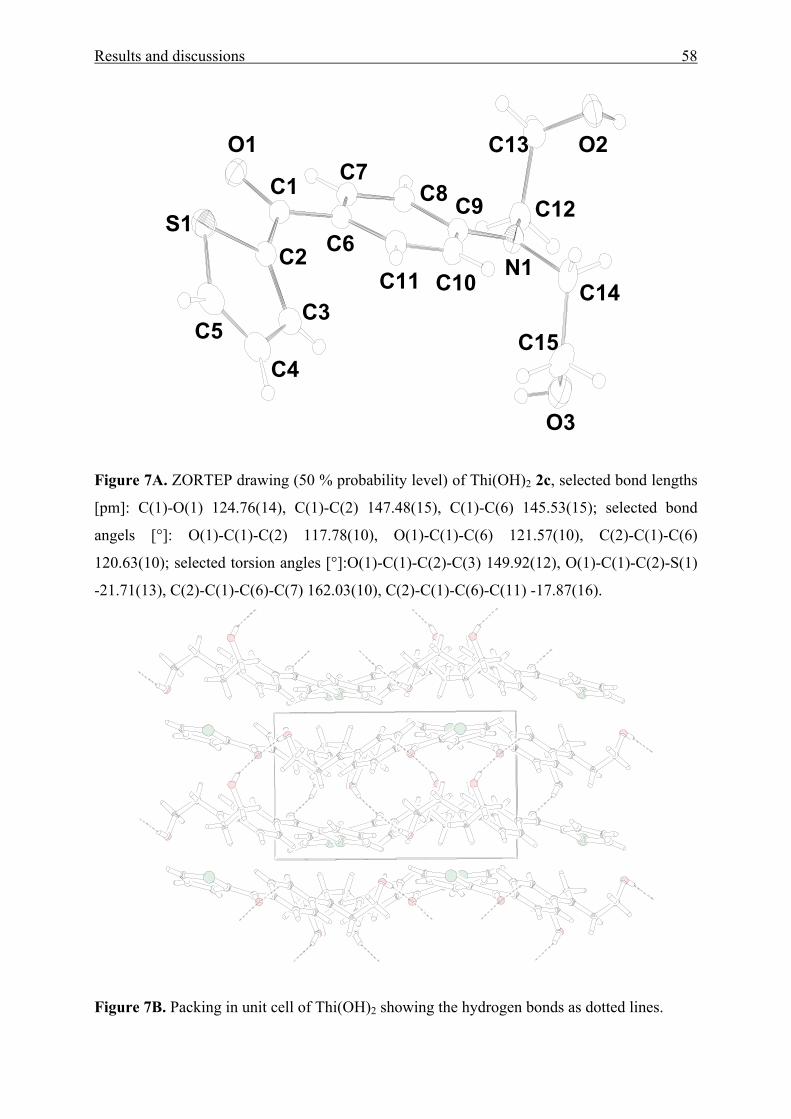
Results and discussions 58
C15
O3
C14
O2
N1
C12
C10
C13
C9
C11
C8
C3
C4
C6
C7
C2
C5
C1S1
O1
Figure 7A. ZORTEP drawing (50 % probability level) of Thi(OH)2 2c, selected bond lengths
[pm]: C(1)-O(1) 124.76(14), C(1)-C(2) 147.48(15), C(1)-C(6) 145.53(15); selected bond
angels [°]: O(1)-C(1)-C(2) 117.78(10), O(1)-C(1)-C(6) 121.57(10), C(2)-C(1)-C(6)
120.63(10); selected torsion angles [°]:O(1)-C(1)-C(2)-C(3) 149.92(12), O(1)-C(1)-C(2)-S(1)
-21.71(13), C(2)-C(1)-C(6)-C(7) 162.03(10), C(2)-C(1)-C(6)-C(11) -17.87(16).
Figure 7B. Packing in unit cell of Thi(OH)2 showing the hydrogen bonds as dotted lines.
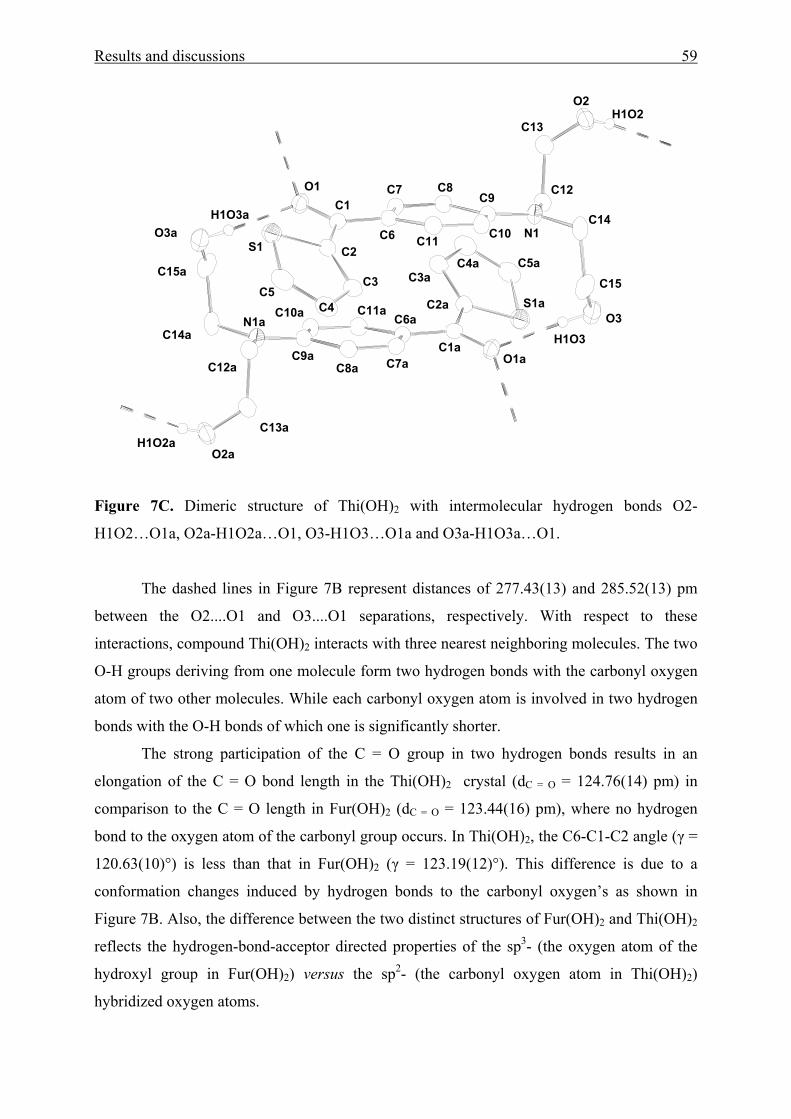
Results and discussions 59
C5aC4a
S1a
C3a
C2a
C13
C11a
C1a
H1O2
C12
C10a
O2
C6a
O1aH1O3
O3
C8
C15a
N1
C14aC9a
C7
C7a
C9
C14
N1a
C15
C8a
O3aH1O3a
O1
C6
O2a
C10
C12a
H1O2a
C1
C11
C13a
C2
C3
S1
C4C5
Figure 7C. Dimeric structure of Thi(OH)2 with intermolecular hydrogen bonds O2-
H1O2…O1a, O2a-H1O2a…O1, O3-H1O3…O1a and O3a-H1O3a…O1.
The dashed lines in Figure 7B represent distances of 277.43(13) and 285.52(13) pm
between the O2....O1 and O3....O1 separations, respectively. With respect to these
interactions, compound Thi(OH)2 interacts with three nearest neighboring molecules. The two
O-H groups deriving from one molecule form two hydrogen bonds with the carbonyl oxygen
atom of two other molecules. While each carbonyl oxygen atom is involved in two hydrogen
bonds with the O-H bonds of which one is significantly shorter.
The strong participation of the C = O group in two hydrogen bonds results in an
elongation of the C = O bond length in the Thi(OH)2 crystal (dC = O = 124.76(14) pm) in
comparison to the C = O length in Fur(OH)2 (dC = O = 123.44(16) pm), where no hydrogen
bond to the oxygen atom of the carbonyl group occurs. In Thi(OH)2, the C6-C1-C2 angle (γ =
120.63(10)°) is less than that in Fur(OH)2 (γ = 123.19(12)°). This difference is due to a
conformation changes induced by hydrogen bonds to the carbonyl oxygen’s as shown in
Figure 7B. Also, the difference between the two distinct structures of Fur(OH)2 and Thi(OH)2
reflects the hydrogen-bond-acceptor directed properties of the sp3- (the oxygen atom of the
hydroxyl group in Fur(OH)2) versus the sp2- (the carbonyl oxygen atom in Thi(OH)2)
hybridized oxygen atoms.

Results and discussions 60
4,4’-Bis(piperidino)benzophenone MK(pip)2
MK(pip)2 4b crystallizes from ethyl acetate at 50 oC as yellow plates (Experimental
Section) in the trigonal space group P3121, with a = 948.11(11), b = 948.11 (11), c =
1818.0(3) pm, α = β = 90, γ = 120°, V = 1415.30(3)*106 pm3 and Z = 3 (Figure 8). Molecule
4b consist a two fold rotation axis of symmetry (symmetry code y, x, -z). The symmetry
generated atoms are indicated with the suffix a.
The structure of MK(pip)2 is depicted in Figure 8. Relevant bond distances and angles
are given in the figure caption.
C10C11
C12
C9 C8N1
C5
C4
C6
C3
C7
C2
C7aC6a
C1
C11a
C2a
C12a
C5a
O1
N1a
C3a
C10a
C4a
C9a
C8a
Figure 8. ZORTEP drawing (50 % probability level) of MK(pip)2 4b, selected bond lengths
[pm]: C(1)-O(1) 123.07(18), C(1)-C(2) 149.06(11), C(1)-C(2a) 149.07(11); selected bond
angels [°]: O(1)-C(1)-C(2) 118.93(6), O(1)-C(1)-C(2a) 118.93(6), C(2)-C(1)-C(2a)
122.13(12); selected torsion angles [°]:O(1)-C(1)-C(2)-C(3) 19.79(9), O(1)-C(1)-C(2)-C(7) -
155.69(8), C(2a)-C(1)-C(2)-C(3) -160.21(9), C(2a)-C(1)-C(2)-C(7) 24.31(8).
The N1-C5 and N1a-C5a bond distances are quit typical and equal to 140.05(12) pm.
This can be compared with values of 146.69(12) and 147.15(13) pm for N1-C8 and N1-C12,
respectively. The N1-C5 bond distance is shorter than N1-C8 and N1-C12. The lone pair of
electrons of N1 and N1a are involved in conjugation with the π-system of the aromatic rings
attached to N1 and N1a and this leads to shortening of the N1-C5 and N1a-C5a distances,
respectively. The C = O double bond length in MK(pip)2 is 123.07(18) pm as compared to
123.24(18) pm in MK(mor)2 4c (wide infra) in which there is no hydrogen bond to the oxygen
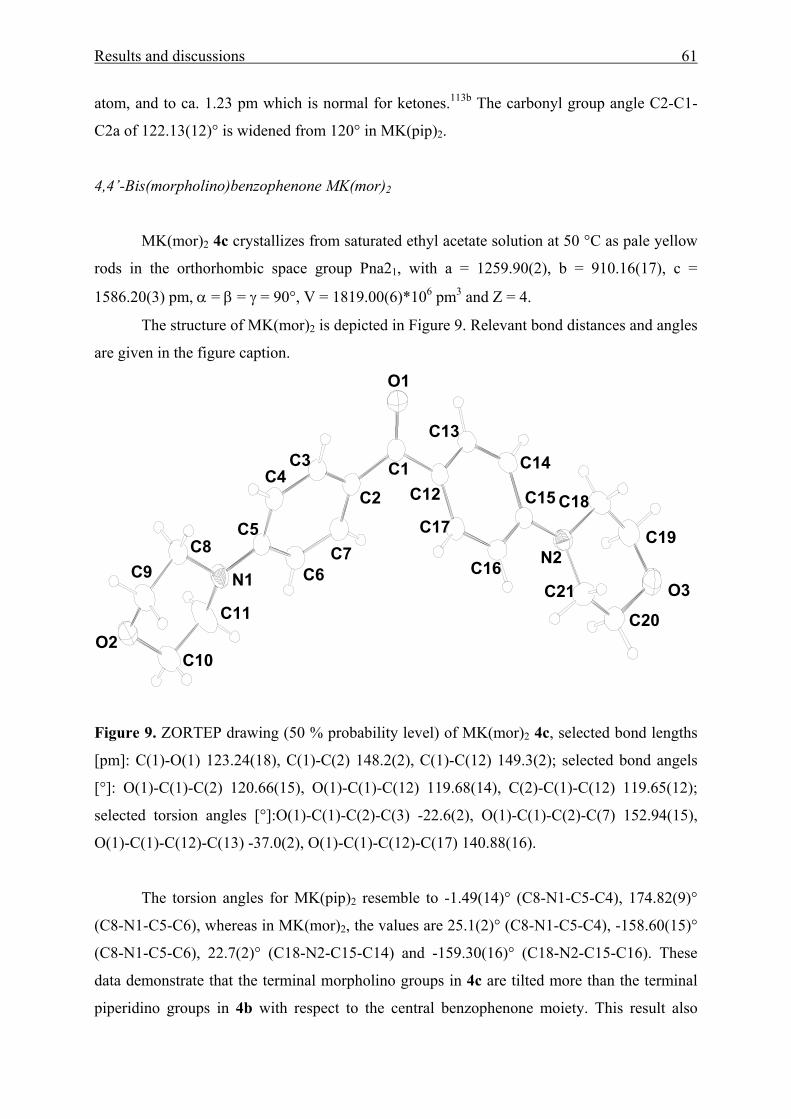
Results and discussions 61
atom, and to ca. 1.23 pm which is normal for ketones.113b The carbonyl group angle C2-C1-
C2a of 122.13(12)° is widened from 120° in MK(pip)2.
4,4’-Bis(morpholino)benzophenone MK(mor)2
MK(mor)2 4c crystallizes from saturated ethyl acetate solution at 50 °C as pale yellow
rods in the orthorhombic space group Pna21, with a = 1259.90(2), b = 910.16(17), c =
1586.20(3) pm, α = β = γ = 90°, V = 1819.00(6)*106 pm3 and Z = 4.
The structure of MK(mor)2 is depicted in Figure 9. Relevant bond distances and angles
are given in the figure caption.
O1
C13
C1 C14C3
C12C2 C18C4
C15
C7C19C17
N2C5
C8C16C6N1 O3C21
C9
C11 C20O2
C10
Figure 9. ZORTEP drawing (50 % probability level) of MK(mor)2 4c, selected bond lengths
[pm]: C(1)-O(1) 123.24(18), C(1)-C(2) 148.2(2), C(1)-C(12) 149.3(2); selected bond angels
[°]: O(1)-C(1)-C(2) 120.66(15), O(1)-C(1)-C(12) 119.68(14), C(2)-C(1)-C(12) 119.65(12);
selected torsion angles [°]:O(1)-C(1)-C(2)-C(3) -22.6(2), O(1)-C(1)-C(2)-C(7) 152.94(15),
O(1)-C(1)-C(12)-C(13) -37.0(2), O(1)-C(1)-C(12)-C(17) 140.88(16).
The torsion angles for MK(pip)2 resemble to -1.49(14)° (C8-N1-C5-C4), 174.82(9)°
(C8-N1-C5-C6), whereas in MK(mor)2, the values are 25.1(2)° (C8-N1-C5-C4), -158.60(15)°
(C8-N1-C5-C6), 22.7(2)° (C18-N2-C15-C14) and -159.30(16)° (C18-N2-C15-C16). These
data demonstrate that the terminal morpholino groups in 4c are tilted more than the terminal
piperidino groups in 4b with respect to the central benzophenone moiety. This result also
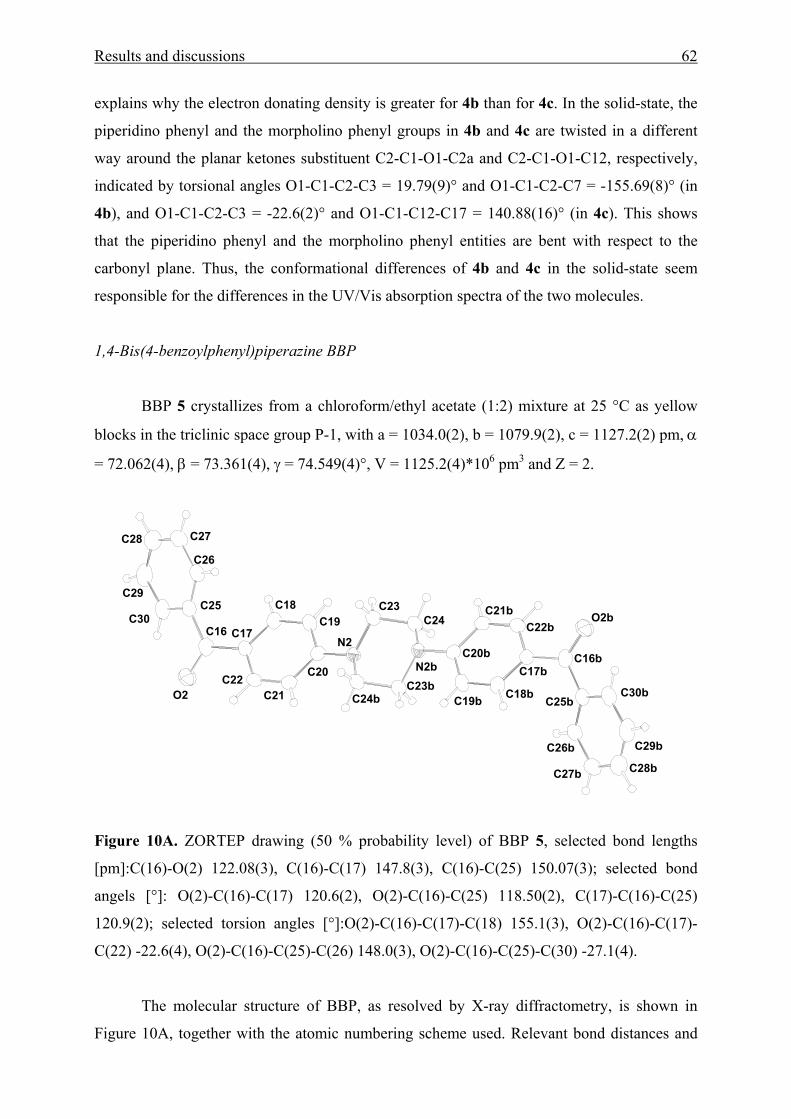
Results and discussions 62
explains why the electron donating density is greater for 4b than for 4c. In the solid-state, the
piperidino phenyl and the morpholino phenyl groups in 4b and 4c are twisted in a different
way around the planar ketones substituent C2-C1-O1-C2a and C2-C1-O1-C12, respectively,
indicated by torsional angles O1-C1-C2-C3 = 19.79(9)° and O1-C1-C2-C7 = -155.69(8)° (in
4b), and O1-C1-C2-C3 = -22.6(2)° and O1-C1-C12-C17 = 140.88(16)° (in 4c). This shows
that the piperidino phenyl and the morpholino phenyl entities are bent with respect to the
carbonyl plane. Thus, the conformational differences of 4b and 4c in the solid-state seem
responsible for the differences in the UV/Vis absorption spectra of the two molecules.
1,4-Bis(4-benzoylphenyl)piperazine BBP
BBP 5 crystallizes from a chloroform/ethyl acetate (1:2) mixture at 25 °C as yellow
blocks in the triclinic space group P-1, with a = 1034.0(2), b = 1079.9(2), c = 1127.2(2) pm, α
= 72.062(4), β = 73.361(4), γ = 74.549(4)°, V = 1125.2(4)*106 pm3 and Z = 2.
C29b
C28b
C30b
C27b
C25b
C26b
C16b
C18b
O2b
C17b
C19b
C22b
C20b
C21b
C23bN2b
C24b
C24
N2
C23
C21
C20C22
C19C17
O2
C18
C16
C26
C25
C27
C30
C28
C29
Figure 10A. ZORTEP drawing (50 % probability level) of BBP 5, selected bond lengths
[pm]:C(16)-O(2) 122.08(3), C(16)-C(17) 147.8(3), C(16)-C(25) 150.07(3); selected bond
angels [°]: O(2)-C(16)-C(17) 120.6(2), O(2)-C(16)-C(25) 118.50(2), C(17)-C(16)-C(25)
120.9(2); selected torsion angles [°]:O(2)-C(16)-C(17)-C(18) 155.1(3), O(2)-C(16)-C(17)-
C(22) -22.6(4), O(2)-C(16)-C(25)-C(26) 148.0(3), O(2)-C(16)-C(25)-C(30) -27.1(4).
The molecular structure of BBP, as resolved by X-ray diffractometry, is shown in
Figure 10A, together with the atomic numbering scheme used. Relevant bond distances and
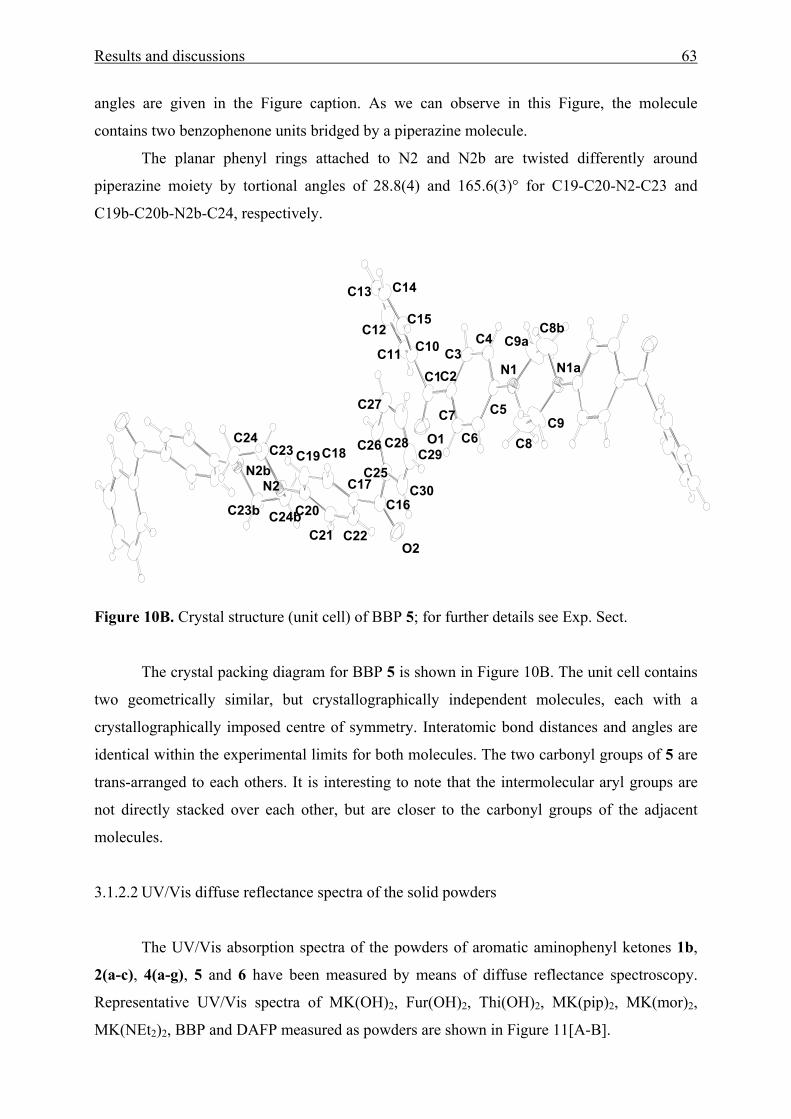
Results and discussions 63
angles are given in the Figure caption. As we can observe in this Figure, the molecule
contains two benzophenone units bridged by a piperazine molecule.
The planar phenyl rings attached to N2 and N2b are twisted differently around
piperazine moiety by tortional angles of 28.8(4) and 165.6(3)° for C19-C20-N2-C23 and
C19b-C20b-N2b-C24, respectively.
C23b
C12
N2b
C11
C24b
C13
C24
C10
N2
O1C23
C21
C14
C1
C20
C15
C22
C3C2
C4
C19
C17
C7
O2
C18
C16
C5
C6C26
C9a
C25
N1
C27
C8
C30
C28
N1a
C29
C9
C8b
Figure 10B. Crystal structure (unit cell) of BBP 5; for further details see Exp. Sect.
The crystal packing diagram for BBP 5 is shown in Figure 10B. The unit cell contains
two geometrically similar, but crystallographically independent molecules, each with a
crystallographically imposed centre of symmetry. Interatomic bond distances and angles are
identical within the experimental limits for both molecules. The two carbonyl groups of 5 are
trans-arranged to each others. It is interesting to note that the intermolecular aryl groups are
not directly stacked over each other, but are closer to the carbonyl groups of the adjacent
molecules.
3.1.2.2 UV/Vis diffuse reflectance spectra of the solid powders
The UV/Vis absorption spectra of the powders of aromatic aminophenyl ketones 1b,
2(a-c), 4(a-g), 5 and 6 have been measured by means of diffuse reflectance spectroscopy.
Representative UV/Vis spectra of MK(OH)2, Fur(OH)2, Thi(OH)2, MK(pip)2, MK(mor)2,
MK(NEt2)2, BBP and DAFP measured as powders are shown in Figure 11[A-B].
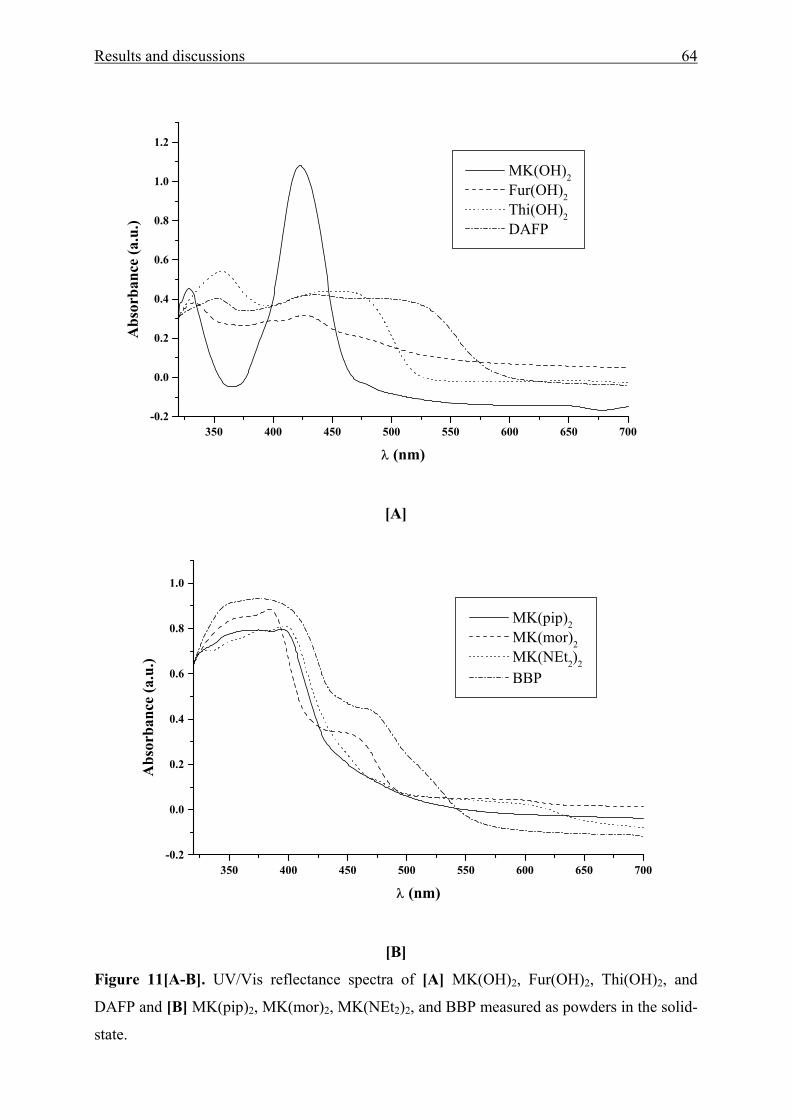
Results and discussions 64
350 400 450 500 550 600 650 700-0.2
0.0
0.2
0.4
0.6
0.8
1.0
1.2
MK(OH)2 Fur(OH)2 Thi(OH)2 DAFP
Abs
orba
nce
(a.u
.)
λ (nm)
[A]
350 400 450 500 550 600 650 700-0.2
0.0
0.2
0.4
0.6
0.8
1.0
MK(pip)2 MK(mor)2 MK(NEt2)2
BBP
Abs
orba
nce
(a.u
.)
λ (nm)
[B]
Figure 11[A-B]. UV/Vis reflectance spectra of [A] MK(OH)2, Fur(OH)2, Thi(OH)2, and
DAFP and [B] MK(pip)2, MK(mor)2, MK(NEt2)2, and BBP measured as powders in the solid-
state.
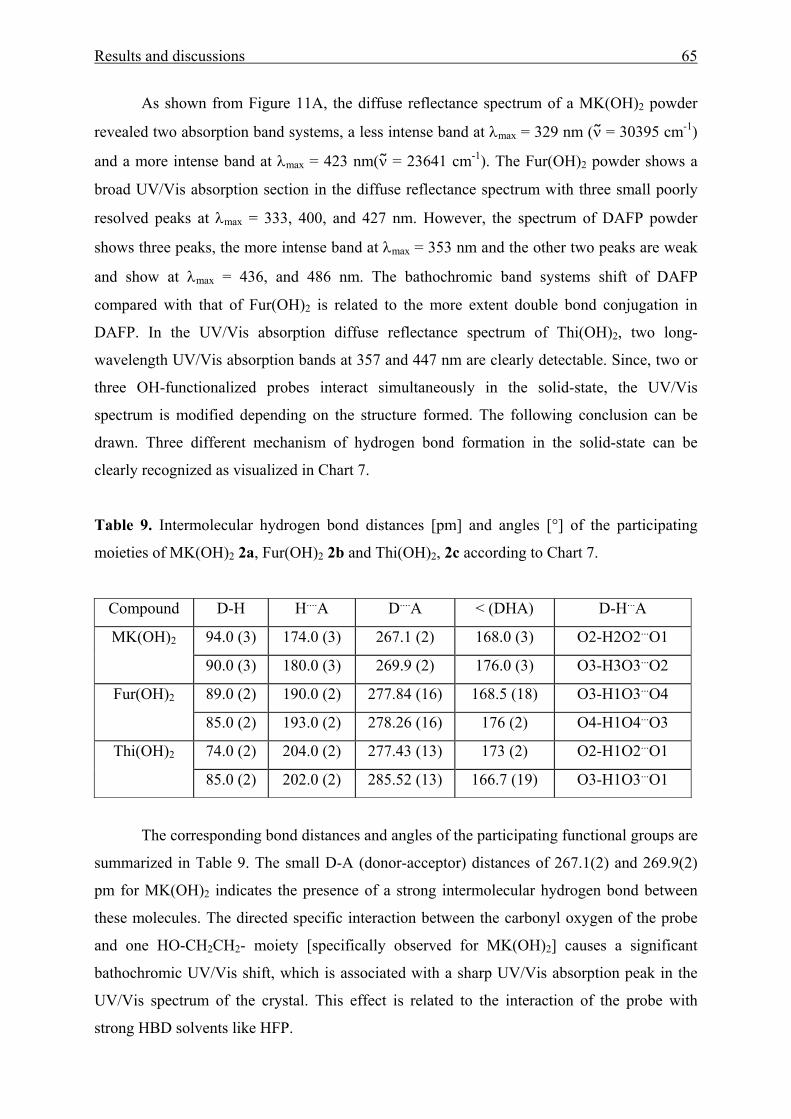
Results and discussions 65
As shown from Figure 11A, the diffuse reflectance spectrum of a MK(OH)2 powder
revealed two absorption band systems, a less intense band at λmax = 329 nm (ν = 30395 cm-1)
and a more intense band at λmax = 423 nm(ν = 23641 cm-1). The Fur(OH)2 powder shows a
broad UV/Vis absorption section in the diffuse reflectance spectrum with three small poorly
resolved peaks at λmax = 333, 400, and 427 nm. However, the spectrum of DAFP powder
shows three peaks, the more intense band at λmax = 353 nm and the other two peaks are weak
and show at λmax = 436, and 486 nm. The bathochromic band systems shift of DAFP
compared with that of Fur(OH)2 is related to the more extent double bond conjugation in
DAFP. In the UV/Vis absorption diffuse reflectance spectrum of Thi(OH)2, two long-
wavelength UV/Vis absorption bands at 357 and 447 nm are clearly detectable. Since, two or
three OH-functionalized probes interact simultaneously in the solid-state, the UV/Vis
spectrum is modified depending on the structure formed. The following conclusion can be
drawn. Three different mechanism of hydrogen bond formation in the solid-state can be
clearly recognized as visualized in Chart 7.
Table 9. Intermolecular hydrogen bond distances [pm] and angles [°] of the participating
moieties of MK(OH)2 2a, Fur(OH)2 2b and Thi(OH)2, 2c according to Chart 7.
The corresponding bond distances and angles of the participating functional groups are
summarized in Table 9. The small D-A (donor-acceptor) distances of 267.1(2) and 269.9(2)
pm for MK(OH)2 indicates the presence of a strong intermolecular hydrogen bond between
these molecules. The directed specific interaction between the carbonyl oxygen of the probe
and one HO-CH2CH2- moiety [specifically observed for MK(OH)2] causes a significant
bathochromic UV/Vis shift, which is associated with a sharp UV/Vis absorption peak in the
UV/Vis spectrum of the crystal. This effect is related to the interaction of the probe with
strong HBD solvents like HFP.
Compound D-H H....A D....A < (DHA) D-H...A
94.0 (3) 174.0 (3) 267.1 (2) 168.0 (3) O2-H2O2...O1 MK(OH)2
90.0 (3) 180.0 (3) 269.9 (2) 176.0 (3) O3-H3O3...O2
89.0 (2) 190.0 (2) 277.84 (16) 168.5 (18) O3-H1O3...O4 Fur(OH)2
85.0 (2) 193.0 (2) 278.26 (16) 176 (2) O4-H1O4...O3
74.0 (2) 204.0 (2) 277.43 (13) 173 (2) O2-H1O2...O1 Thi(OH)2
85.0 (2) 202.0 (2) 285.52 (13) 166.7 (19) O3-H1O3...O1
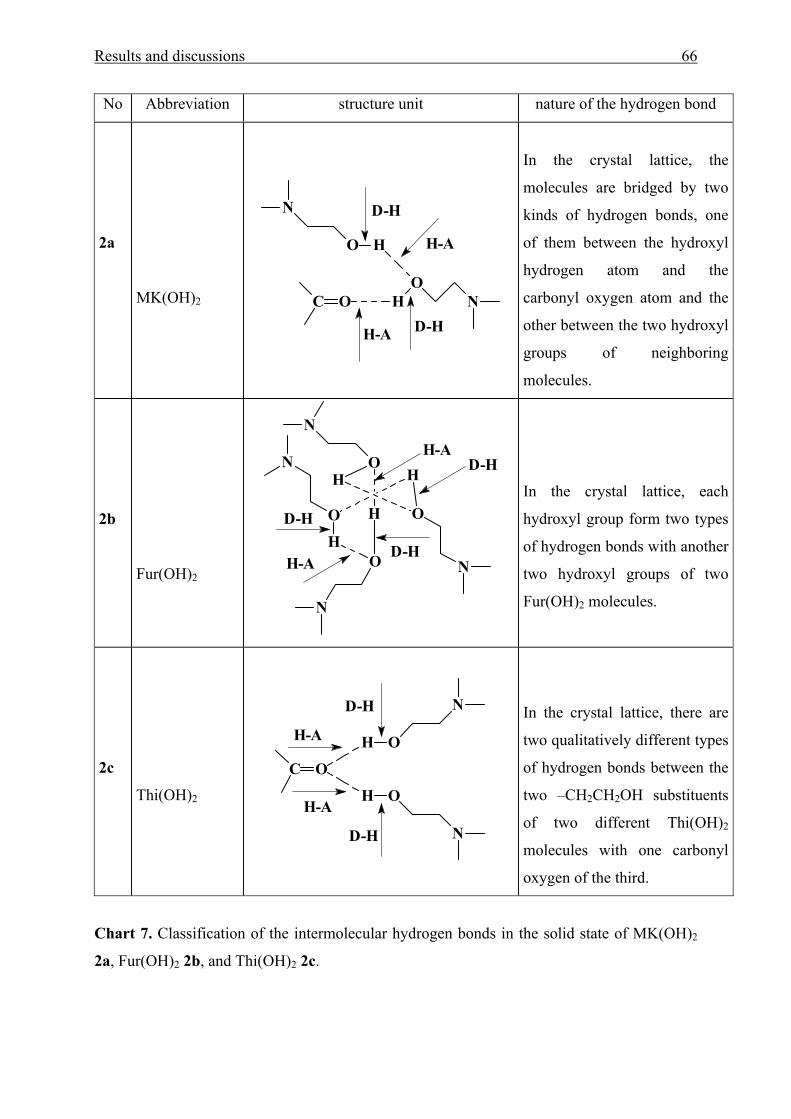
Results and discussions 66
Chart 7. Classification of the intermolecular hydrogen bonds in the solid state of MK(OH)2
2a, Fur(OH)2 2b, and Thi(OH)2 2c.
No Abbreviation structure unit nature of the hydrogen bond
2a
MK(OH)2
C O HO
HO
N
N
D-H
D-HH-A
H-A
In the crystal lattice, the
molecules are bridged by two
kinds of hydrogen bonds, one
of them between the hydroxyl
hydrogen atom and the
carbonyl oxygen atom and the
other between the two hydroxyl
groups of neighboring
molecules.
2b
Fur(OH)2
H
N
O
O
N
H
H
H
O
N
N
O
D-HH-A
D-H
D-H
H-A
In the crystal lattice, each
hydroxyl group form two types
of hydrogen bonds with another
two hydroxyl groups of two
Fur(OH)2 molecules.
2c
Thi(OH)2
C O
H
H
O
N
O
N
D-H
D-H
H-A
H-A
In the crystal lattice, there are
two qualitatively different types
of hydrogen bonds between the
two –CH2CH2OH substituents
of two different Thi(OH)2
molecules with one carbonyl
oxygen of the third.
Results and discussions 67
In the case that specific interactions between the carbonyl oxygen and the HO-
CH2CH2- group do not occur in the solid-state like for Fur(OH)2, therefore no sharp UV/Vis
absorption peak is observed. However, the broad and poorly resolved UV/Vis absorption
bands in the visible spectrum of Fur(OH)2 indicate non-specific π – π interactions and long
ranging dipolar interactions. However, a detailed interpretation of this UV/Vis spectrum
requires a deeper theoretical treatment.
The UV/Vis diffuse reflectance spectrum of the Thi(OH)2 powder shows a long
wavelength absorption at λ = 447 nm due to the strong interaction of two -CH2CH2OH
substituents of two different Thi(OH)2 molecules with one carbonyl oxygen of a third species.
The unprecedented bathochromic UV/Vis shift of the solid observed, would be in agreement
with the strong influence of the β term (of the solvent) on νmax in solution and that especially
the -CH2CH2OH substituents of Thi(OH)2 bear the highest HBD capacity of the compounds
studied. The other UV/Vis band at λ = 357 nm probably relate to the single chromophoric
system.
The complete explanations of all UV/Vis spectroscopic effects observed in the solid-
state relating to the crystal structure is still a challenge for further theoretical work and
promising experimental studies on related supra-molecular solid-state dye systems.
As shown from Figure 11B, three Michler’s Ketone derivatives 4(b-c) and 4f exhibit red-
shifted UV/Vis absorption band maxima (λmax ≈ 400 nm, νmax ≈ 25000 cm-1) in the solid-state
which is comparable to the UV/Vis spectrum in solution of a strong polar solvent like HFP.
The results are summarized in Tab. 10. However, the UV/Vis absorption bands are not
symmetric. They show that different electronic transitions occur in the solid-state. This result
is probably due to the formation of aggregates indicating strong dipolar interactions in the
solid-state. Among the other compounds, 4c and 5 show evidently an additional UV/Vis
maximum bathochromically shifted in its reflectance spectrum.
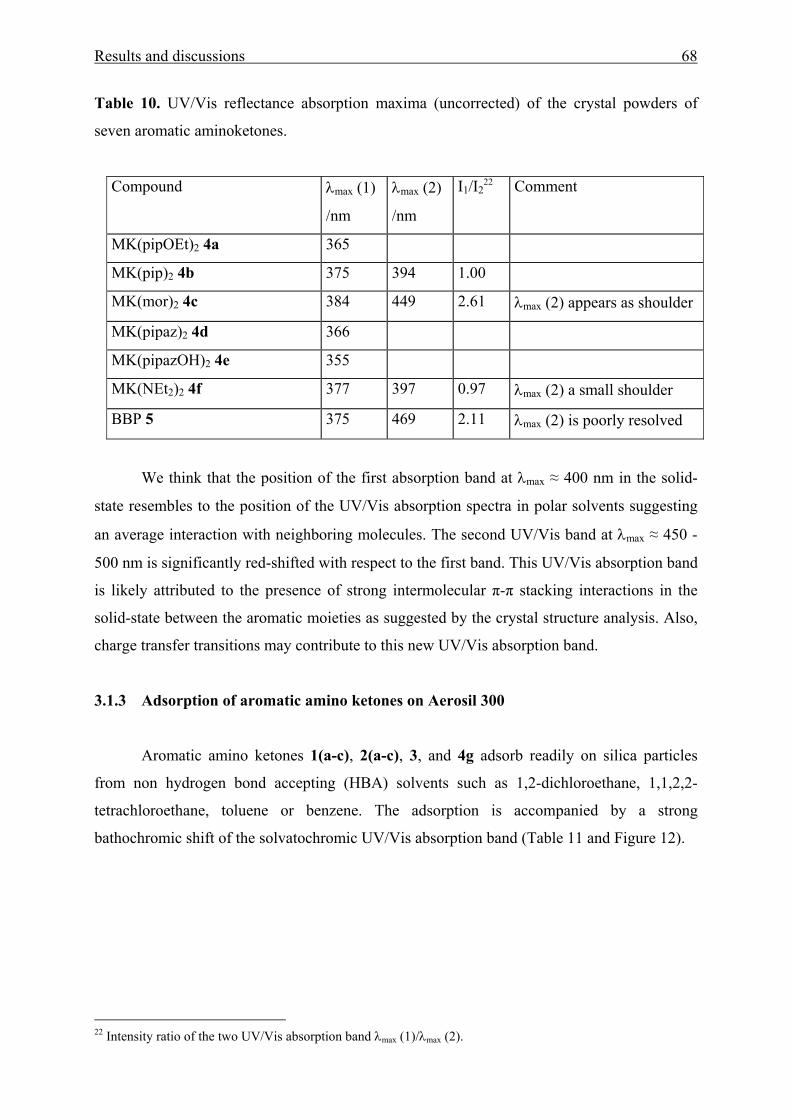
Results and discussions 68
Table 10. UV/Vis reflectance absorption maxima (uncorrected) of the crystal powders of
seven aromatic aminoketones.
Compound λmax (1)
/nm
λmax (2)
/nm
I1/I222 Comment
MK(pipOEt)2 4a 365
MK(pip)2 4b 375 394 1.00
MK(mor)2 4c 384 449 2.61 λmax (2) appears as shoulder
MK(pipaz)2 4d 366
MK(pipazOH)2 4e 355
MK(NEt2)2 4f 377 397 0.97 λmax (2) a small shoulder
BBP 5 375 469 2.11 λmax (2) is poorly resolved
We think that the position of the first absorption band at λmax ≈ 400 nm in the solid-
state resembles to the position of the UV/Vis absorption spectra in polar solvents suggesting
an average interaction with neighboring molecules. The second UV/Vis band at λmax ≈ 450 -
500 nm is significantly red-shifted with respect to the first band. This UV/Vis absorption band
is likely attributed to the presence of strong intermolecular π-π stacking interactions in the
solid-state between the aromatic moieties as suggested by the crystal structure analysis. Also,
charge transfer transitions may contribute to this new UV/Vis absorption band.
3.1.3 Adsorption of aromatic amino ketones on Aerosil 300
Aromatic amino ketones 1(a-c), 2(a-c), 3, and 4g adsorb readily on silica particles
from non hydrogen bond accepting (HBA) solvents such as 1,2-dichloroethane, 1,1,2,2-
tetrachloroethane, toluene or benzene. The adsorption is accompanied by a strong
bathochromic shift of the solvatochromic UV/Vis absorption band (Table 11 and Figure 12).
22 Intensity ratio of the two UV/Vis absorption band λmax (1)/λmax (2).
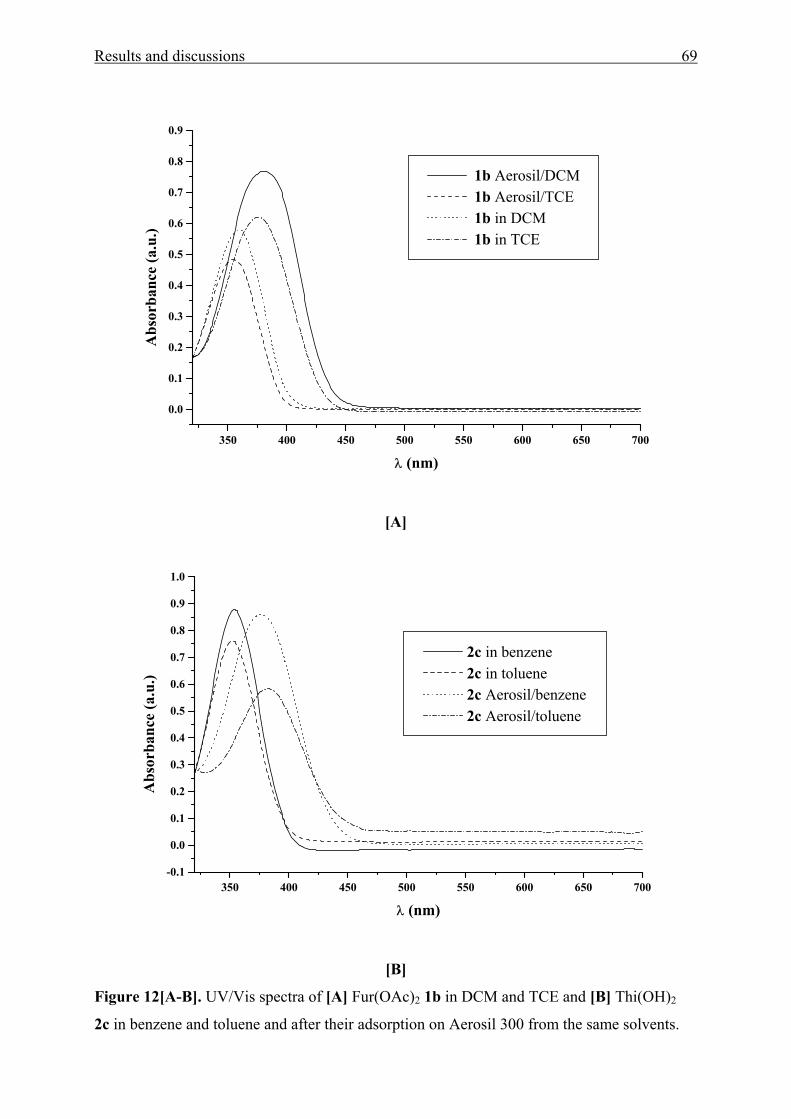
Results and discussions 69
350 400 450 500 550 600 650 700
0.0
0.1
0.2
0.3
0.4
0.5
0.6
0.7
0.8
0.9
1b Aerosil/DCM 1b Aerosil/TCE 1b in DCM 1b in TCE
Abs
orba
nce
(a.u
.)
λ (nm)
[A]
350 400 450 500 550 600 650 700-0.1
0.0
0.1
0.2
0.3
0.4
0.5
0.6
0.7
0.8
0.9
1.0
2c in benzene 2c in toluene 2c Aerosil/benzene 2c Aerosil/toluene
Abs
orba
nce
(a.u
.)
λ (nm)
[B]
Figure 12[A-B]. UV/Vis spectra of [A] Fur(OAc)2 1b in DCM and TCE and [B] Thi(OH)2
2c in benzene and toluene and after their adsorption on Aerosil 300 from the same solvents.
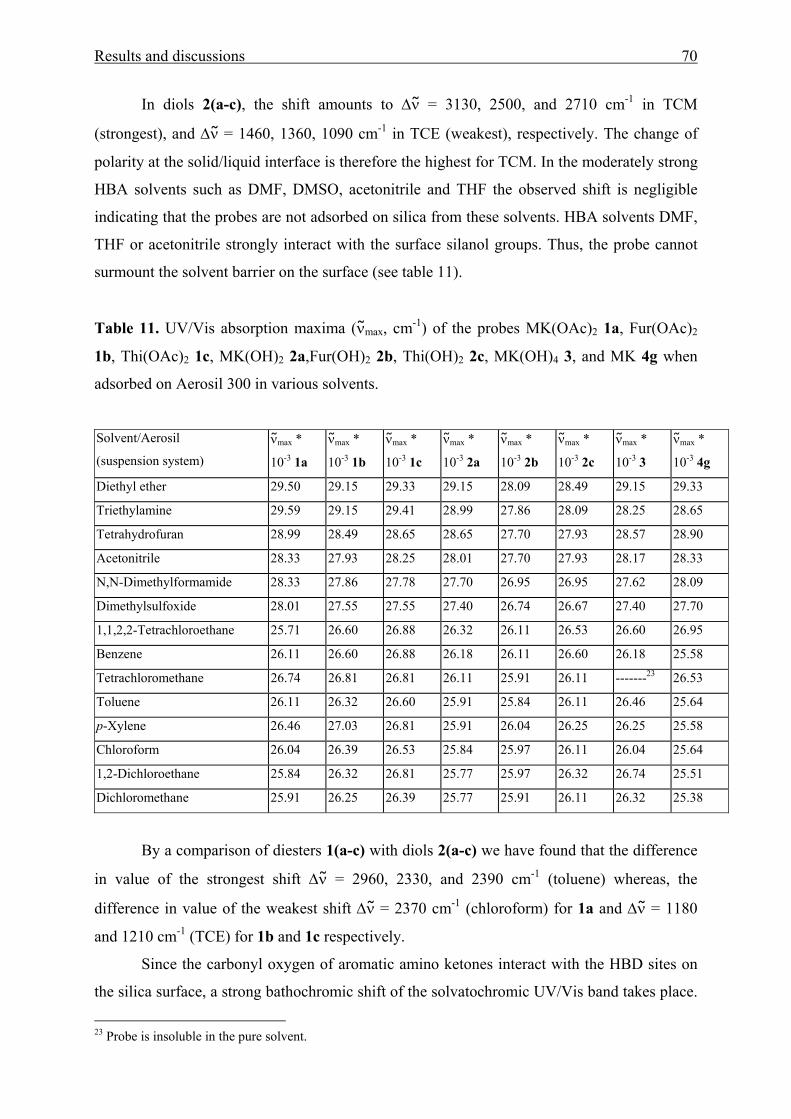
Results and discussions 70
In diols 2(a-c), the shift amounts to ∆ν = 3130, 2500, and 2710 cm-1 in TCM
(strongest), and ∆ν = 1460, 1360, 1090 cm-1 in TCE (weakest), respectively. The change of
polarity at the solid/liquid interface is therefore the highest for TCM. In the moderately strong
HBA solvents such as DMF, DMSO, acetonitrile and THF the observed shift is negligible
indicating that the probes are not adsorbed on silica from these solvents. HBA solvents DMF,
THF or acetonitrile strongly interact with the surface silanol groups. Thus, the probe cannot
surmount the solvent barrier on the surface (see table 11).
Table 11. UV/Vis absorption maxima (νmax, cm-1) of the probes MK(OAc)2 1a, Fur(OAc)2
1b, Thi(OAc)2 1c, MK(OH)2 2a,Fur(OH)2 2b, Thi(OH)2 2c, MK(OH)4 3, and MK 4g when
adsorbed on Aerosil 300 in various solvents.
By a comparison of diesters 1(a-c) with diols 2(a-c) we have found that the difference
in value of the strongest shift ∆ν = 2960, 2330, and 2390 cm-1 (toluene) whereas, the
difference in value of the weakest shift ∆ν = 2370 cm-1 (chloroform) for 1a and ∆ν = 1180
and 1210 cm-1 (TCE) for 1b and 1c respectively.
Since the carbonyl oxygen of aromatic amino ketones interact with the HBD sites on
the silica surface, a strong bathochromic shift of the solvatochromic UV/Vis band takes place.
23 Probe is insoluble in the pure solvent.
Solvent/Aerosil
(suspension system)
ν max *
10-3 1a
ν max *
10-3 1b
ν max *
10-3 1c
ν max *
10-3 2a
ν max *
10-3 2b
ν max *
10-3 2c
ν max *
10-3 3
ν max *
10-3 4g
Diethyl ether 29.50 29.15 29.33 29.15 28.09 28.49 29.15 29.33
Triethylamine 29.59 29.15 29.41 28.99 27.86 28.09 28.25 28.65
Tetrahydrofuran 28.99 28.49 28.65 28.65 27.70 27.93 28.57 28.90
Acetonitrile 28.33 27.93 28.25 28.01 27.70 27.93 28.17 28.33
N,N-Dimethylformamide 28.33 27.86 27.78 27.70 26.95 26.95 27.62 28.09
Dimethylsulfoxide 28.01 27.55 27.55 27.40 26.74 26.67 27.40 27.70
1,1,2,2-Tetrachloroethane 25.71 26.60 26.88 26.32 26.11 26.53 26.60 26.95
Benzene 26.11 26.60 26.88 26.18 26.11 26.60 26.18 25.58
Tetrachloromethane 26.74 26.81 26.81 26.11 25.91 26.11 -------23 26.53
Toluene 26.11 26.32 26.60 25.91 25.84 26.11 26.46 25.64
p-Xylene 26.46 27.03 26.81 25.91 26.04 26.25 26.25 25.58
Chloroform 26.04 26.39 26.53 25.84 25.97 26.11 26.04 25.64
1,2-Dichloroethane 25.84 26.32 26.81 25.77 25.97 26.32 26.74 25.51
Dichloromethane 25.91 26.25 26.39 25.77 25.91 26.11 26.32 25.38
Results and discussions 71
This bathochromic shift can be well interpreted in terms of the result derived from the
solvent influence on νmax for these compounds.
For Michler’s ketone MK and its hydrophilically substituted derivative MK(OH)2 as
polarity indicators, when completely adsorbed on Aerosil 300 in a suitable solvent, a
significant influence of the β term of the solvent upon the UV/Vis absorption maximum has
been found (eq. 28 - 31).
νmax *10-3 [MK] = 28.75 – 18.94 β – 1.88 π* (28)
n = 8 r = 0.97 SD = 0.16 F = 0.0008
νmax *10-3 [MK] = 26.93 – 11.87 β (29)
n = 8 r = 0.79 SD = 0.38 F = 0.0201
νmax *10-3 [MK(OH)2] = 26.94 – 6.11 β – 0.64 π* (30)
n = 8 r = 0.87 SD = 0.12 F = 0.0296
νmax *10-3 [MK(OH)2] = 26.31 – 3.68 β (31)
n = 8 r = 0.68 SD = 0.16 F = 0.0640
However, for MK(OAc)2 adsorbed on Aerosil 300, the influence of the π* term of the
solvent upon the bathochromic band shift is more pronounced (eq. 32 and 33).
νmax *10-3 [MK(OAc)2] = 27.20 – 1.15 β – 1.58 π* (32)
n = 8 r = 0.96 SD = 0.11 F = 0.0017
νmax *10-3 [MK(OAc)2] = 27.02 – 1.45 π* (33)
n = 8 r = 0.96 SD = 0.11 F = 0.0002
α, β, and π* parameters of the solid/liquid (Aerosil 300/solvent) surface interface can
be determined by applying eqs. 23, 25, and 26 respectively. The α value ranged from 1.05 in
Aerosil 300/TCE to 1.29 in Aerosil 300/DCM or Aerosil 300/DCE system. The β value
ranged from 0.33 in Aerosil 300/DCE to 0.89 in Aerosil 300/p-xylene system. However, the
π* value ranged from 0.98 in Aerosil 300/benzene to 1.09 in Aerosil 300/toluene, Aerosil
300/TCM, or Aerosil 300/chloroform system. These α and π* values well agree with values
reported in ref.114
The influence of the silanol groups on the UV/Vis shift is similar to the interaction in
the diol crystals 2(a-c) as shown by comparison the UV/Vis spectra of the pure diol crystal 2a
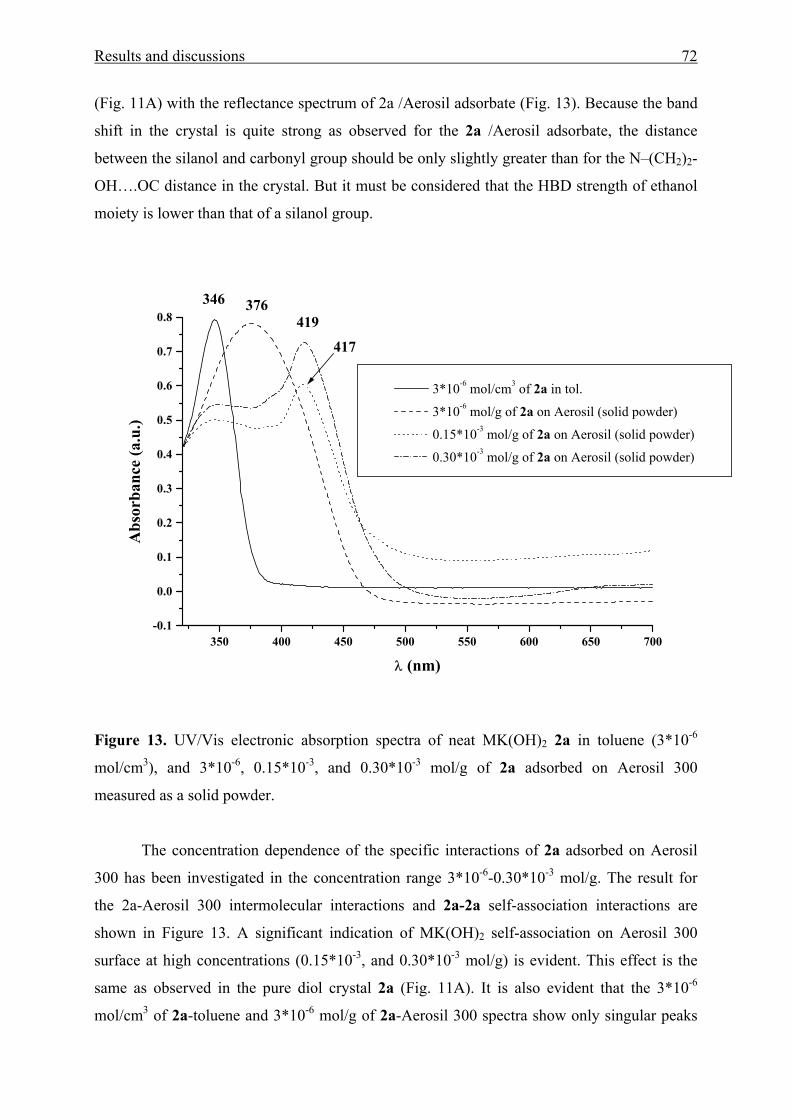
Results and discussions 72
(Fig. 11A) with the reflectance spectrum of 2a /Aerosil adsorbate (Fig. 13). Because the band
shift in the crystal is quite strong as observed for the 2a /Aerosil adsorbate, the distance
between the silanol and carbonyl group should be only slightly greater than for the N–(CH2)2-
OH….OC distance in the crystal. But it must be considered that the HBD strength of ethanol
moiety is lower than that of a silanol group.
350 400 450 500 550 600 650 700-0.1
0.0
0.1
0.2
0.3
0.4
0.5
0.6
0.7
0.8346
417
419376
3*10-6 mol/cm3 of 2a in tol.
3*10-6 mol/g of 2a on Aerosil (solid powder)
0.15*10-3 mol/g of 2a on Aerosil (solid powder)
0.30*10-3 mol/g of 2a on Aerosil (solid powder)
Abs
orba
nce
(a.u
.)
λ (nm)
Figure 13. UV/Vis electronic absorption spectra of neat MK(OH)2 2a in toluene (3*10-6
mol/cm3), and 3*10-6, 0.15*10-3, and 0.30*10-3 mol/g of 2a adsorbed on Aerosil 300
measured as a solid powder.
The concentration dependence of the specific interactions of 2a adsorbed on Aerosil
300 has been investigated in the concentration range 3*10-6-0.30*10-3 mol/g. The result for
the 2a-Aerosil 300 intermolecular interactions and 2a-2a self-association interactions are
shown in Figure 13. A significant indication of MK(OH)2 self-association on Aerosil 300
surface at high concentrations (0.15*10-3, and 0.30*10-3 mol/g) is evident. This effect is the
same as observed in the pure diol crystal 2a (Fig. 11A). It is also evident that the 3*10-6
mol/cm3 of 2a-toluene and 3*10-6 mol/g of 2a-Aerosil 300 spectra show only singular peaks
Results and discussions 73
at λmax = 346, 376 nm, respectively, suggesting that only 2a-toluene and 2a-Aerosil
interactions are observed. The absence of 2a-2a interactions results from the probe
concentration being low in the solvent and on Aerosil (3*10-6 mol/g).
However, the results have clearly shown that adsorption of aromatic amino ketones on
HBD surfaces can be measured readily by the UV/Vis shift of 1(a-c), 2(a-c), 3, or 4g and that
the shift also is influenced by the dipolarity/polarizability of the environment.
3.1.4 Sol-gel materials containing aromatic amino ketones
As mentioned in section 1.3 and Chart 6 (General part), two different types of sol-gel
composites have been produced. MK(OH)2, Fur(OH)2, and/or Thi(OH)2 have been either
simply embedded in organically modified silica (Ormosil) xerogels or chemically linked to 3-
Isocyanatopropyltriethoxysilane before hydrolytic condensation with tetraethylorthosilicate
(TEOS) takes place. MK and MK(OH)4 have been used as control compounds when
physically entrapped to show the influence of the polarity in the periphery on the
solvatochromic shift.
3.1.4.1 Physical entrapment in a microporous silica network
MK(OH)2, Fur(OH)2, Thi(OH)2, MK(OH)4, and MK were entrapped in various
Ormosils (Chart 8). They were prepared using different proportions of methyltrimethoxy-
silane (MTMOS) to tetramethoxysilane (TMOS) according to an established sol-gel
procedure75 which is described in the Experimental section.
Marked differences in the νmax values of MK(OH)2, Fur(OH)2, or Thi(OH)2 as a function of
the MTMOS/TMOS ratio used for the Ormosil system were observed in the presence of
alkanols at the interface (Table 12).
Representative UV/Vis spectra of 2(a-c), 3, and 4g doped Ormosil 5 and 2b doped
Ormosils (1-5) measured as a suspension in 1-hexanol and 1-decanol, respectively, are shown
in Figure 14[A-B]. The shapes of the UV/Vis absorption bands are broad, probably due to the
wide polarity distribution inside the cage of Ormosils.
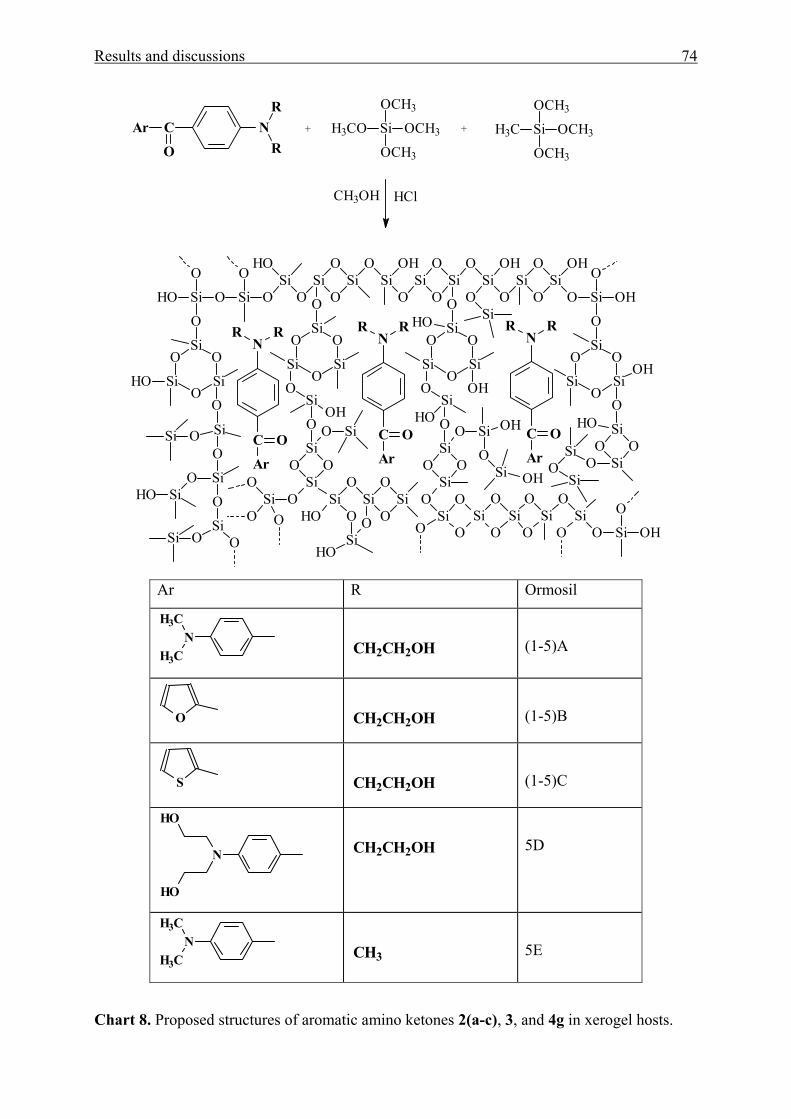
Results and discussions 74
Ar C
O
NR
R+ H3CO Si
OCH3
OCH3
OCH3
H3C Si
OCH3
OCH3
OCH3
+
Ar
C O
NR R
Ar
C O
NR R
Ar
C O
NR R
HClCH3OH
OSi
OSi
OHSi
O
OSi
OSi
O
OSi
OH
OSi
OOSi
OSi
O O O
OHHO
OSi
SiO
SiO
Si
O
Si
O
OH
O
O
O O
SiO
SiO
Si
O
O
HO
O OHSi
O
SiHO
SiO
SiO
OHO
SiO
SiO
OO SiSi
O
O SiO
SiO
OSi
OHOSi
O
O O
SiO
SiO
Si
OOH
O
SiO
SiO
HO
OSi
O
SiSi
O
HO
O
SiO
SiO
Si
O
OSi
OSi Si
OSi
OSi
O
OO
Si
OH
OOOO
Si
SiHO
OH
O
Si
O
Si
O
O
SiO O
HO
Si
OSiHO
Si
O
OHSiO
Ar R Ormosil
NH3C
H3C
CH2CH2OH
(1-5)A
O
CH2CH2OH
(1-5)B
S
CH2CH2OH
(1-5)C
N
HO
HO
CH2CH2OH
5D
NH3C
H3C
CH3
5E
Chart 8. Proposed structures of aromatic amino ketones 2(a-c), 3, and 4g in xerogel hosts.
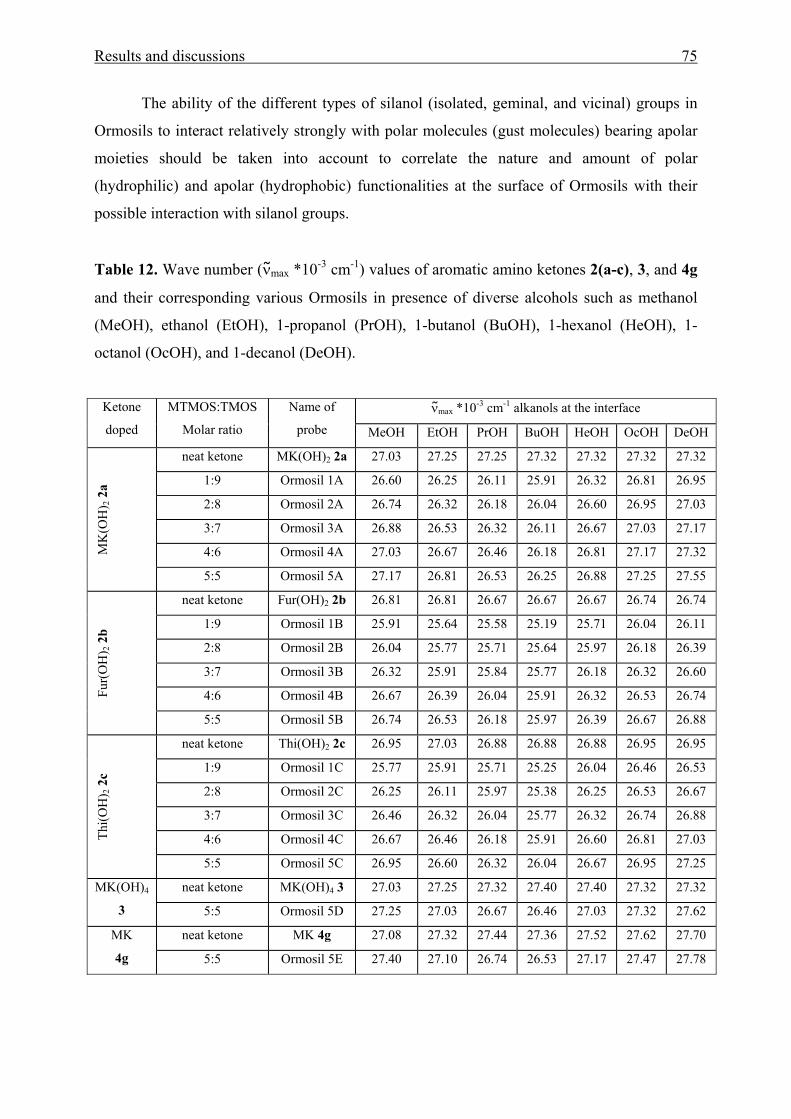
Results and discussions 75
The ability of the different types of silanol (isolated, geminal, and vicinal) groups in
Ormosils to interact relatively strongly with polar molecules (gust molecules) bearing apolar
moieties should be taken into account to correlate the nature and amount of polar
(hydrophilic) and apolar (hydrophobic) functionalities at the surface of Ormosils with their
possible interaction with silanol groups.
Table 12. Wave number (νmax *10-3 cm-1) values of aromatic amino ketones 2(a-c), 3, and 4g
and their corresponding various Ormosils in presence of diverse alcohols such as methanol
(MeOH), ethanol (EtOH), 1-propanol (PrOH), 1-butanol (BuOH), 1-hexanol (HeOH), 1-
octanol (OcOH), and 1-decanol (DeOH).
ν max *10-3 cm-1 alkanols at the interface Ketone
doped
MTMOS:TMOS
Molar ratio
Name of
probe MeOH EtOH PrOH BuOH HeOH OcOH DeOH
neat ketone MK(OH)2 2a 27.03 27.25 27.25 27.32 27.32 27.32 27.32
1:9 Ormosil 1A 26.60 26.25 26.11 25.91 26.32 26.81 26.95
2:8 Ormosil 2A 26.74 26.32 26.18 26.04 26.60 26.95 27.03
3:7 Ormosil 3A 26.88 26.53 26.32 26.11 26.67 27.03 27.17
4:6 Ormosil 4A 27.03 26.67 26.46 26.18 26.81 27.17 27.32 MK
(OH
) 2 2
a
5:5 Ormosil 5A 27.17 26.81 26.53 26.25 26.88 27.25 27.55
neat ketone Fur(OH)2 2b 26.81 26.81 26.67 26.67 26.67 26.74 26.74
1:9 Ormosil 1B 25.91 25.64 25.58 25.19 25.71 26.04 26.11
2:8 Ormosil 2B 26.04 25.77 25.71 25.64 25.97 26.18 26.39
3:7 Ormosil 3B 26.32 25.91 25.84 25.77 26.18 26.32 26.60
4:6 Ormosil 4B 26.67 26.39 26.04 25.91 26.32 26.53 26.74 Fur(
OH
) 2 2
b
5:5 Ormosil 5B 26.74 26.53 26.18 25.97 26.39 26.67 26.88
neat ketone Thi(OH)2 2c 26.95 27.03 26.88 26.88 26.88 26.95 26.95
1:9 Ormosil 1C 25.77 25.91 25.71 25.25 26.04 26.46 26.53
2:8 Ormosil 2C 26.25 26.11 25.97 25.38 26.25 26.53 26.67
3:7 Ormosil 3C 26.46 26.32 26.04 25.77 26.32 26.74 26.88
4:6 Ormosil 4C 26.67 26.46 26.18 25.91 26.60 26.81 27.03 Thi(O
H) 2
2c
5:5 Ormosil 5C 26.95 26.60 26.32 26.04 26.67 26.95 27.25
neat ketone MK(OH)4 3 27.03 27.25 27.32 27.40 27.40 27.32 27.32 MK(OH)4
3 5:5 Ormosil 5D 27.25 27.03 26.67 26.46 27.03 27.32 27.62
neat ketone MK 4g 27.08 27.32 27.44 27.36 27.52 27.62 27.70 MK
4g 5:5 Ormosil 5E 27.40 27.10 26.74 26.53 27.17 27.47 27.78
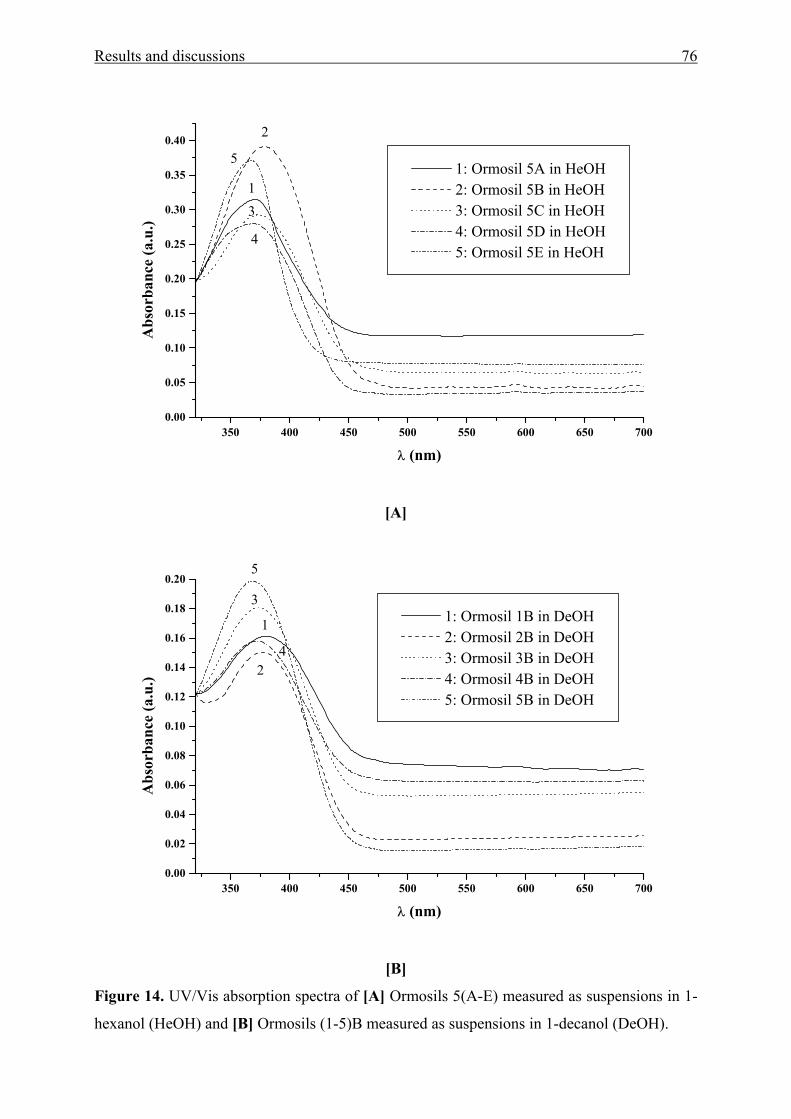
Results and discussions 76
350 400 450 500 550 600 650 7000.00
0.05
0.10
0.15
0.20
0.25
0.30
0.35
0.405
4
3
2
1 1: Ormosil 5A in HeOH 2: Ormosil 5B in HeOH 3: Ormosil 5C in HeOH 4: Ormosil 5D in HeOH 5: Ormosil 5E in HeOH
Abs
orba
nce
(a.u
.)
λ (nm)
[A]
350 400 450 500 550 600 650 7000.00
0.02
0.04
0.06
0.08
0.10
0.12
0.14
0.16
0.18
0.205
4
3
2
1 1: Ormosil 1B in DeOH 2: Ormosil 2B in DeOH 3: Ormosil 3B in DeOH 4: Ormosil 4B in DeOH 5: Ormosil 5B in DeOH
Abs
orba
nce
(a.u
.)
λ (nm)
[B]
Figure 14. UV/Vis absorption spectra of [A] Ormosils 5(A-E) measured as suspensions in 1-
hexanol (HeOH) and [B] Ormosils (1-5)B measured as suspensions in 1-decanol (DeOH).
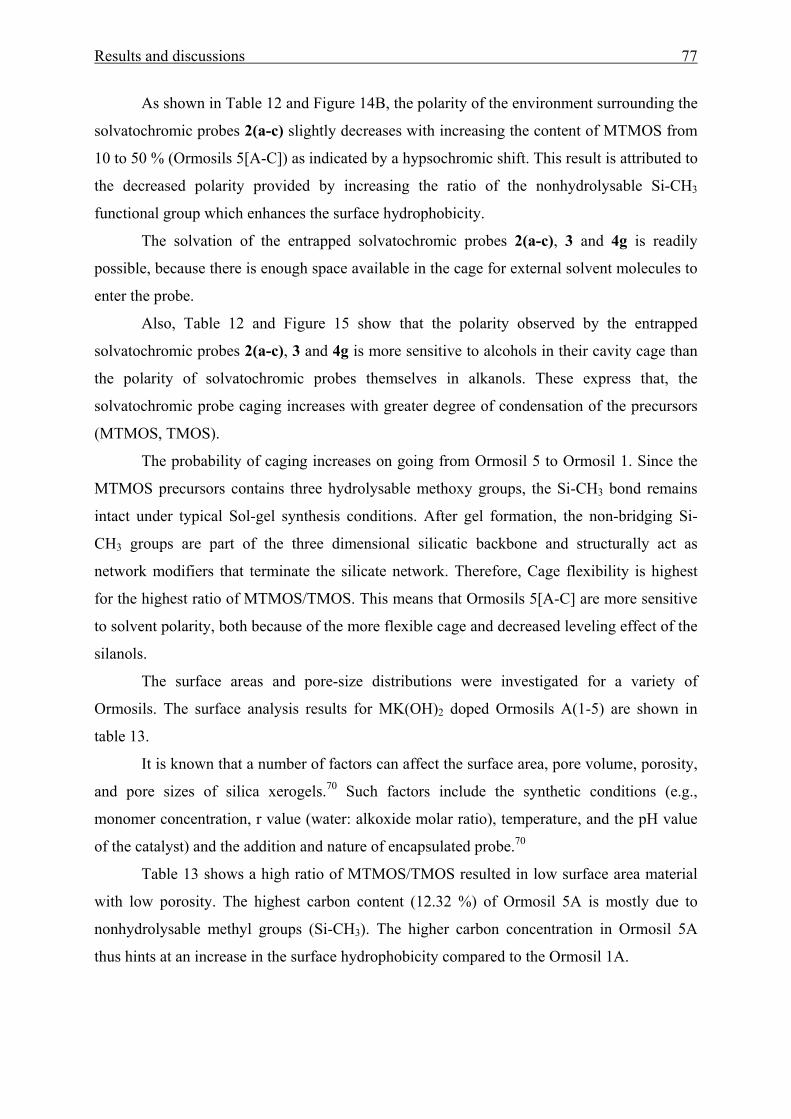
Results and discussions 77
As shown in Table 12 and Figure 14B, the polarity of the environment surrounding the
solvatochromic probes 2(a-c) slightly decreases with increasing the content of MTMOS from
10 to 50 % (Ormosils 5[A-C]) as indicated by a hypsochromic shift. This result is attributed to
the decreased polarity provided by increasing the ratio of the nonhydrolysable Si-CH3
functional group which enhances the surface hydrophobicity.
The solvation of the entrapped solvatochromic probes 2(a-c), 3 and 4g is readily
possible, because there is enough space available in the cage for external solvent molecules to
enter the probe.
Also, Table 12 and Figure 15 show that the polarity observed by the entrapped
solvatochromic probes 2(a-c), 3 and 4g is more sensitive to alcohols in their cavity cage than
the polarity of solvatochromic probes themselves in alkanols. These express that, the
solvatochromic probe caging increases with greater degree of condensation of the precursors
(MTMOS, TMOS).
The probability of caging increases on going from Ormosil 5 to Ormosil 1. Since the
MTMOS precursors contains three hydrolysable methoxy groups, the Si-CH3 bond remains
intact under typical Sol-gel synthesis conditions. After gel formation, the non-bridging Si-
CH3 groups are part of the three dimensional silicatic backbone and structurally act as
network modifiers that terminate the silicate network. Therefore, Cage flexibility is highest
for the highest ratio of MTMOS/TMOS. This means that Ormosils 5[A-C] are more sensitive
to solvent polarity, both because of the more flexible cage and decreased leveling effect of the
silanols.
The surface areas and pore-size distributions were investigated for a variety of
Ormosils. The surface analysis results for MK(OH)2 doped Ormosils A(1-5) are shown in
table 13.
It is known that a number of factors can affect the surface area, pore volume, porosity,
and pore sizes of silica xerogels.70 Such factors include the synthetic conditions (e.g.,
monomer concentration, r value (water: alkoxide molar ratio), temperature, and the pH value
of the catalyst) and the addition and nature of encapsulated probe.70
Table 13 shows a high ratio of MTMOS/TMOS resulted in low surface area material
with low porosity. The highest carbon content (12.32 %) of Ormosil 5A is mostly due to
nonhydrolysable methyl groups (Si-CH3). The higher carbon concentration in Ormosil 5A
thus hints at an increase in the surface hydrophobicity compared to the Ormosil 1A.
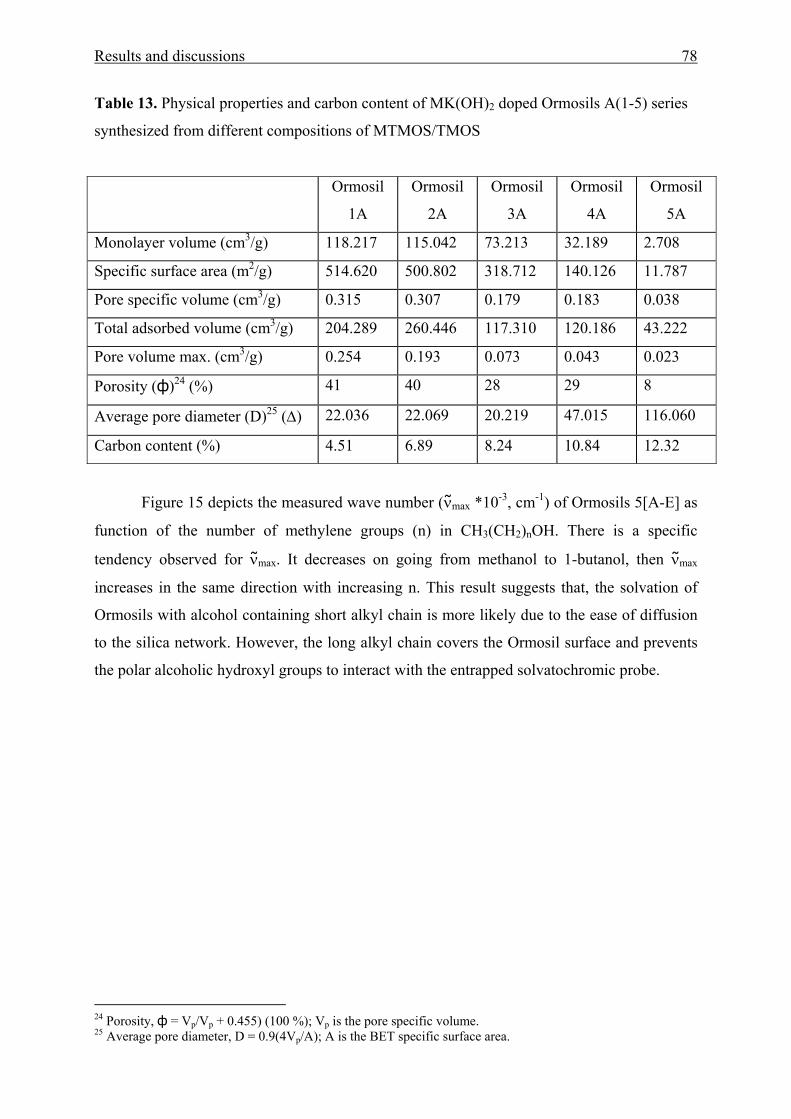
Results and discussions 78
Table 13. Physical properties and carbon content of MK(OH)2 doped Ormosils A(1-5) series
synthesized from different compositions of MTMOS/TMOS
Figure 15 depicts the measured wave number (νmax *10-3, cm-1) of Ormosils 5[A-E] as
function of the number of methylene groups (n) in CH3(CH2)nOH. There is a specific
tendency observed for νmax. It decreases on going from methanol to 1-butanol, then νmax
increases in the same direction with increasing n. This result suggests that, the solvation of
Ormosils with alcohol containing short alkyl chain is more likely due to the ease of diffusion
to the silica network. However, the long alkyl chain covers the Ormosil surface and prevents
the polar alcoholic hydroxyl groups to interact with the entrapped solvatochromic probe.
24 Porosity, ф = Vp/Vp + 0.455) (100 %); Vp is the pore specific volume. 25 Average pore diameter, D = 0.9(4Vp/A); A is the BET specific surface area.
Ormosil
1A
Ormosil
2A
Ormosil
3A
Ormosil
4A
Ormosil
5A
Monolayer volume (cm3/g) 118.217 115.042 73.213 32.189 2.708
Specific surface area (m2/g) 514.620 500.802 318.712 140.126 11.787
Pore specific volume (cm3/g) 0.315 0.307 0.179 0.183 0.038
Total adsorbed volume (cm3/g) 204.289 260.446 117.310 120.186 43.222
Pore volume max. (cm3/g) 0.254 0.193 0.073 0.043 0.023
Porosity (ф)24 (%) 41 40 28 29 8
Average pore diameter (D)25 (∆) 22.036 22.069 20.219 47.015 116.060
Carbon content (%) 4.51 6.89 8.24 10.84 12.32
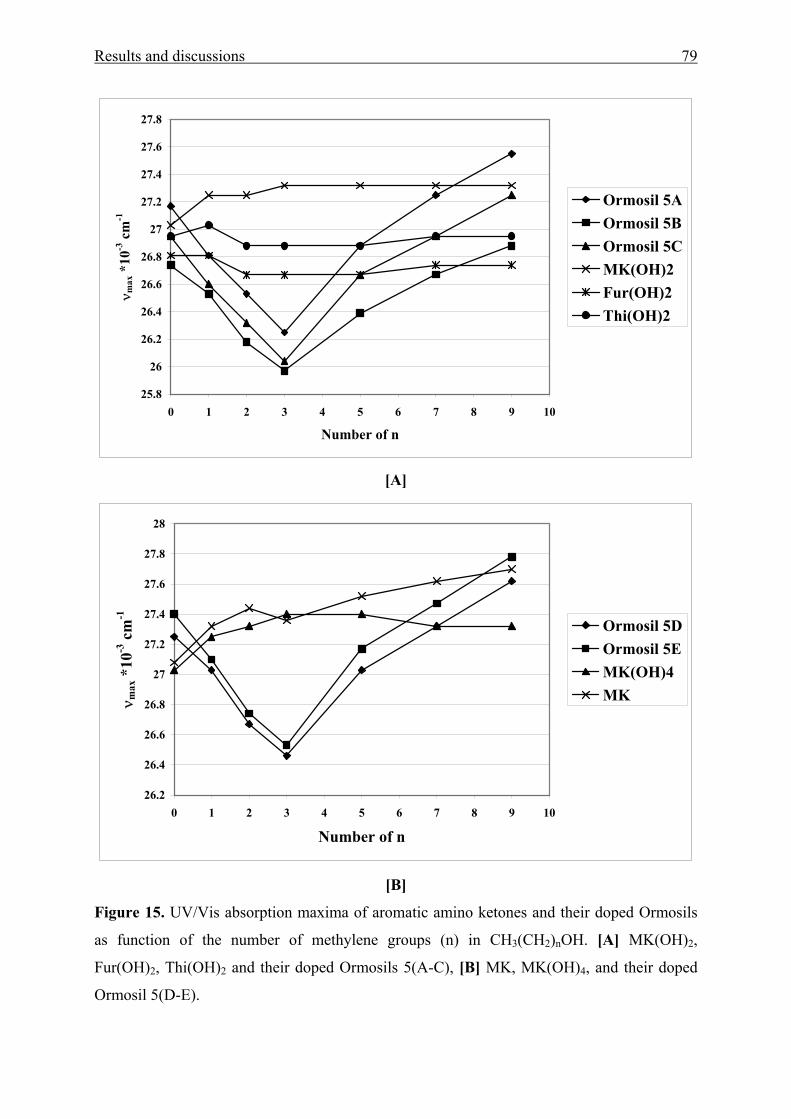
Results and discussions 79
25.8
26
26.2
26.4
26.6
26.8
27
27.2
27.4
27.6
27.8
0 1 2 3 4 5 6 7 8 9 10
Number of n
ν max
*10
-3 c
m-1
Ormosil 5AOrmosil 5BOrmosil 5CMK(OH)2Fur(OH)2Thi(OH)2
[A]
26.2
26.4
26.6
26.8
27
27.2
27.4
27.6
27.8
28
0 1 2 3 4 5 6 7 8 9 10
Number of n
ν max
*10
-3 c
m-1
Ormosil 5DOrmosil 5EMK(OH)4MK
[B]
Figure 15. UV/Vis absorption maxima of aromatic amino ketones and their doped Ormosils
as function of the number of methylene groups (n) in CH3(CH2)nOH. [A] MK(OH)2,
Fur(OH)2, Thi(OH)2 and their doped Ormosils 5(A-C), [B] MK, MK(OH)4, and their doped
Ormosil 5(D-E).
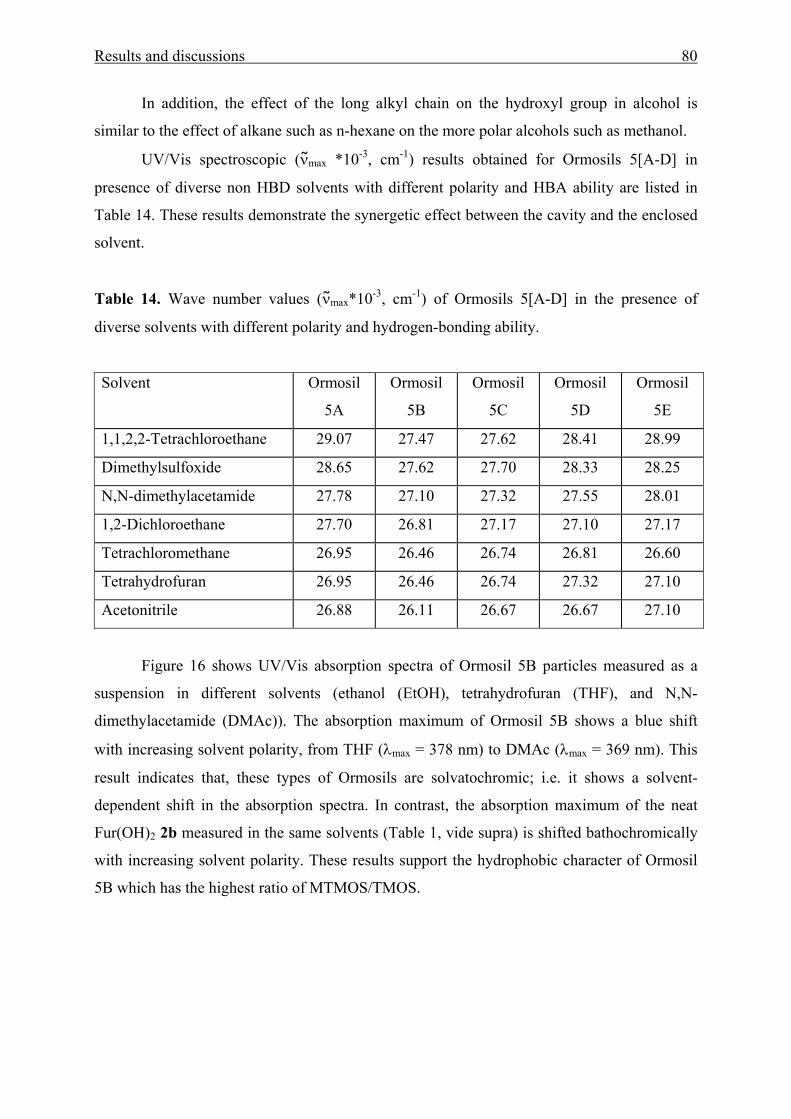
Results and discussions 80
In addition, the effect of the long alkyl chain on the hydroxyl group in alcohol is
similar to the effect of alkane such as n-hexane on the more polar alcohols such as methanol.
UV/Vis spectroscopic (νmax *10-3, cm-1) results obtained for Ormosils 5[A-D] in
presence of diverse non HBD solvents with different polarity and HBA ability are listed in
Table 14. These results demonstrate the synergetic effect between the cavity and the enclosed
solvent.
Table 14. Wave number values (νmax*10-3, cm-1) of Ormosils 5[A-D] in the presence of
diverse solvents with different polarity and hydrogen-bonding ability.
Figure 16 shows UV/Vis absorption spectra of Ormosil 5B particles measured as a
suspension in different solvents (ethanol (EtOH), tetrahydrofuran (THF), and N,N-
dimethylacetamide (DMAc)). The absorption maximum of Ormosil 5B shows a blue shift
with increasing solvent polarity, from THF (λmax = 378 nm) to DMAc (λmax = 369 nm). This
result indicates that, these types of Ormosils are solvatochromic; i.e. it shows a solvent-
dependent shift in the absorption spectra. In contrast, the absorption maximum of the neat
Fur(OH)2 2b measured in the same solvents (Table 1, vide supra) is shifted bathochromically
with increasing solvent polarity. These results support the hydrophobic character of Ormosil
5B which has the highest ratio of MTMOS/TMOS.
Solvent Ormosil
5A
Ormosil
5B
Ormosil
5C
Ormosil
5D
Ormosil
5E
1,1,2,2-Tetrachloroethane 29.07 27.47 27.62 28.41 28.99
Dimethylsulfoxide 28.65 27.62 27.70 28.33 28.25
N,N-dimethylacetamide 27.78 27.10 27.32 27.55 28.01
1,2-Dichloroethane 27.70 26.81 27.17 27.10 27.17
Tetrachloromethane 26.95 26.46 26.74 26.81 26.60
Tetrahydrofuran 26.95 26.46 26.74 27.32 27.10
Acetonitrile 26.88 26.11 26.67 26.67 27.10
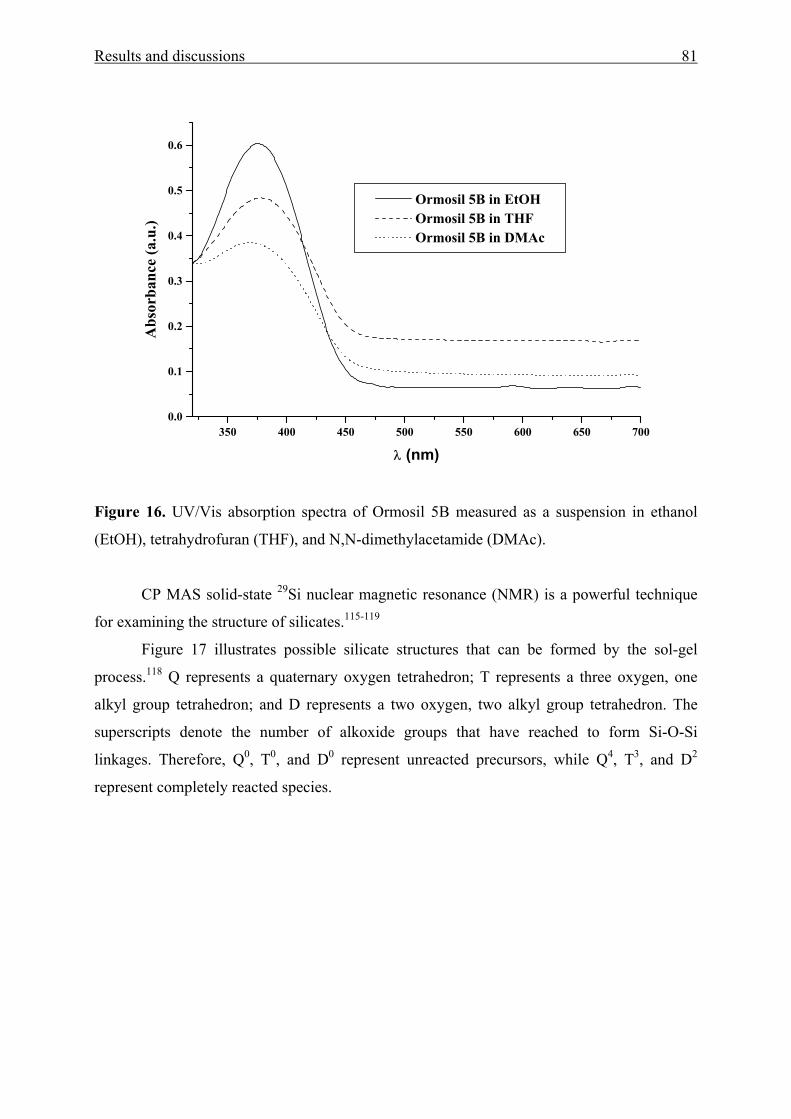
Results and discussions 81
350 400 450 500 550 600 650 7000.0
0.1
0.2
0.3
0.4
0.5
0.6
Ormosil 5B in EtOH Ormosil 5B in THF Ormosil 5B in DMAc
Abs
orba
nce
(a.u
.)
λ (nm)
Figure 16. UV/Vis absorption spectra of Ormosil 5B measured as a suspension in ethanol
(EtOH), tetrahydrofuran (THF), and N,N-dimethylacetamide (DMAc).
CP MAS solid-state 29Si nuclear magnetic resonance (NMR) is a powerful technique
for examining the structure of silicates.115-119
Figure 17 illustrates possible silicate structures that can be formed by the sol-gel
process.118 Q represents a quaternary oxygen tetrahedron; T represents a three oxygen, one
alkyl group tetrahedron; and D represents a two oxygen, two alkyl group tetrahedron. The
superscripts denote the number of alkoxide groups that have reached to form Si-O-Si
linkages. Therefore, Q0, T0, and D0 represent unreacted precursors, while Q4, T3, and D2
represent completely reacted species.
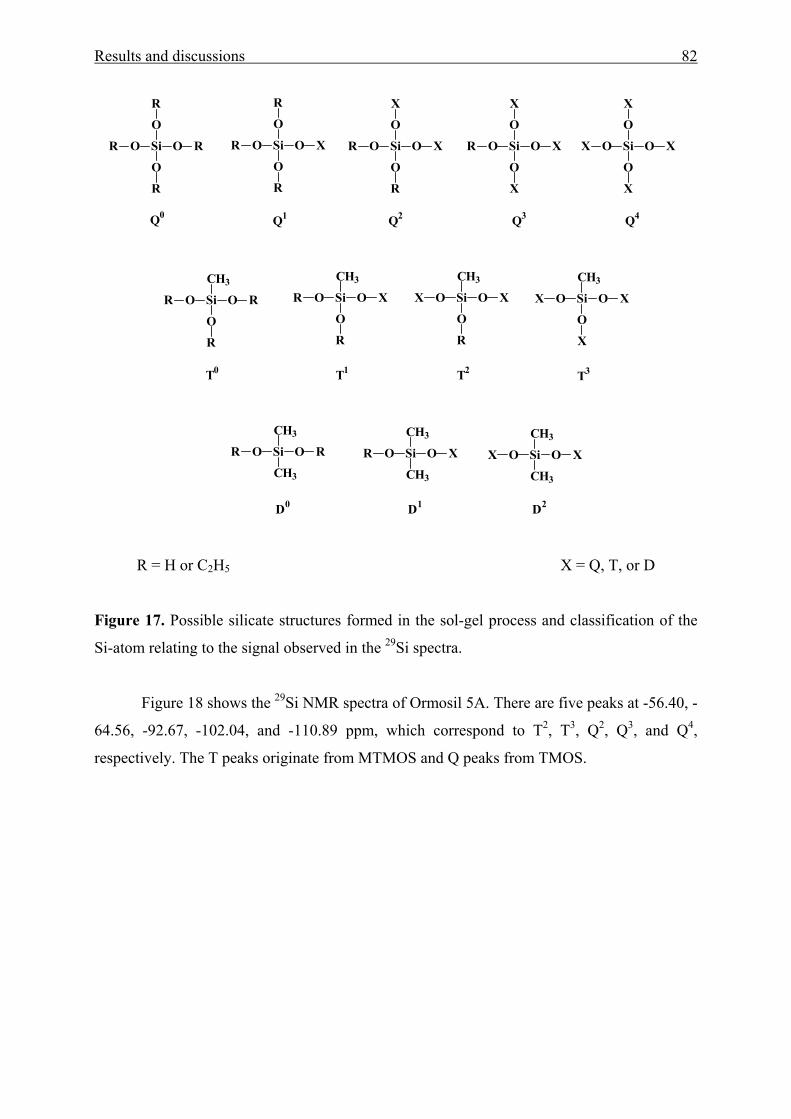
Results and discussions 82
O Si O
O
O
RR
R
R
O Si O
O
O
XR
R
R
O Si O
O
O
XR
X
R
O Si O
O
O
XR
X
X
O Si O
O
O
XX
X
X
Q0 Q1 Q2 Q3 Q4
O Si O
CH3
O
RR
R
O Si O
CH3
O
XR
R
O Si O
CH3
O
XX
R
O Si O
CH3
O
XX
X
T0 T1 T2 T3
O Si O
CH3
CH3
RR O Si O
CH3
CH3
XR O Si O
CH3
CH3
XX
D0 D1 D2
R = H or C2H5 X = Q, T, or D
Figure 17. Possible silicate structures formed in the sol-gel process and classification of the
Si-atom relating to the signal observed in the 29Si spectra.
Figure 18 shows the 29Si NMR spectra of Ormosil 5A. There are five peaks at -56.40, -
64.56, -92.67, -102.04, and -110.89 ppm, which correspond to T2, T3, Q2, Q3, and Q4,
respectively. The T peaks originate from MTMOS and Q peaks from TMOS.
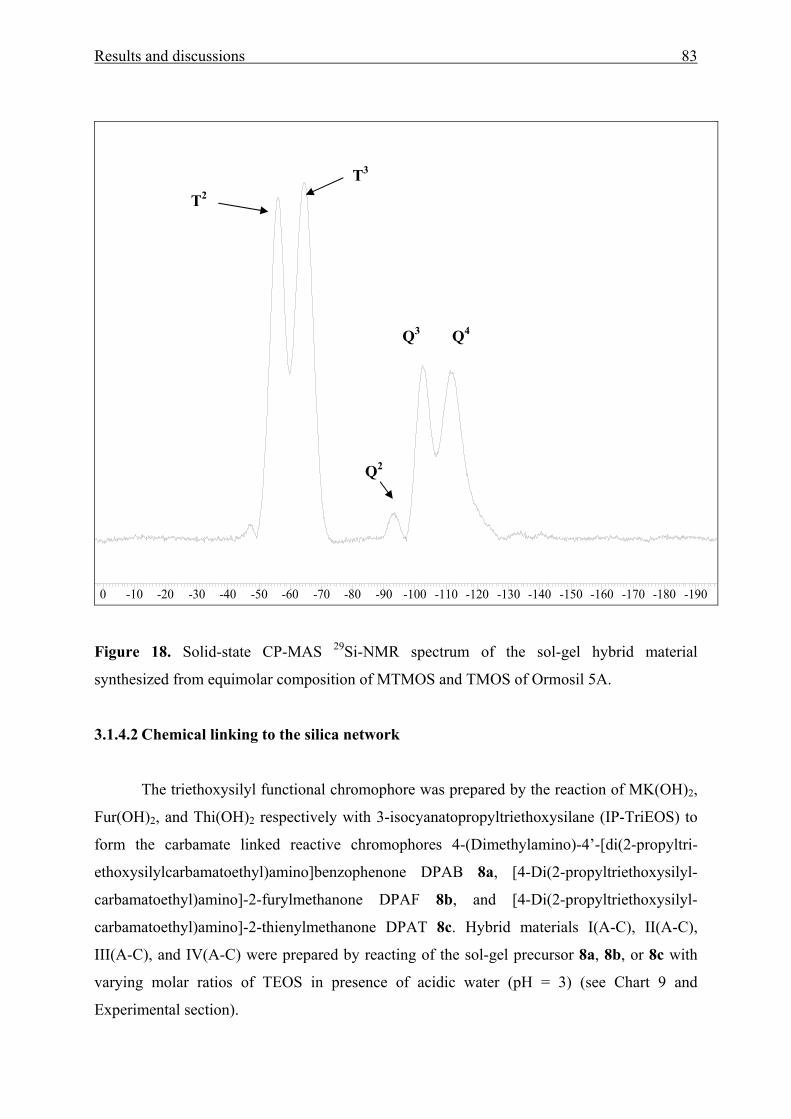
Results and discussions 83
-190-190-180-180-170-170-160-160-150-150-140-140-130-130-120-120-110-110-100-100-90-90-80-80-70-70-60-60-50-50-40-40-30-30-20-20-10-1000
Figure 18. Solid-state CP-MAS 29Si-NMR spectrum of the sol-gel hybrid material
synthesized from equimolar composition of MTMOS and TMOS of Ormosil 5A.
3.1.4.2 Chemical linking to the silica network
The triethoxysilyl functional chromophore was prepared by the reaction of MK(OH)2,
Fur(OH)2, and Thi(OH)2 respectively with 3-isocyanatopropyltriethoxysilane (IP-TriEOS) to
form the carbamate linked reactive chromophores 4-(Dimethylamino)-4’-[di(2-propyltri-
ethoxysilylcarbamatoethyl)amino]benzophenone DPAB 8a, [4-Di(2-propyltriethoxysilyl-
carbamatoethyl)amino]-2-furylmethanone DPAF 8b, and [4-Di(2-propyltriethoxysilyl-
carbamatoethyl)amino]-2-thienylmethanone DPAT 8c. Hybrid materials I(A-C), II(A-C),
III(A-C), and IV(A-C) were prepared by reacting of the sol-gel precursor 8a, 8b, or 8c with
varying molar ratios of TEOS in presence of acidic water (pH = 3) (see Chart 9 and
Experimental section).
Q4 Q3
Q2
T2
T3
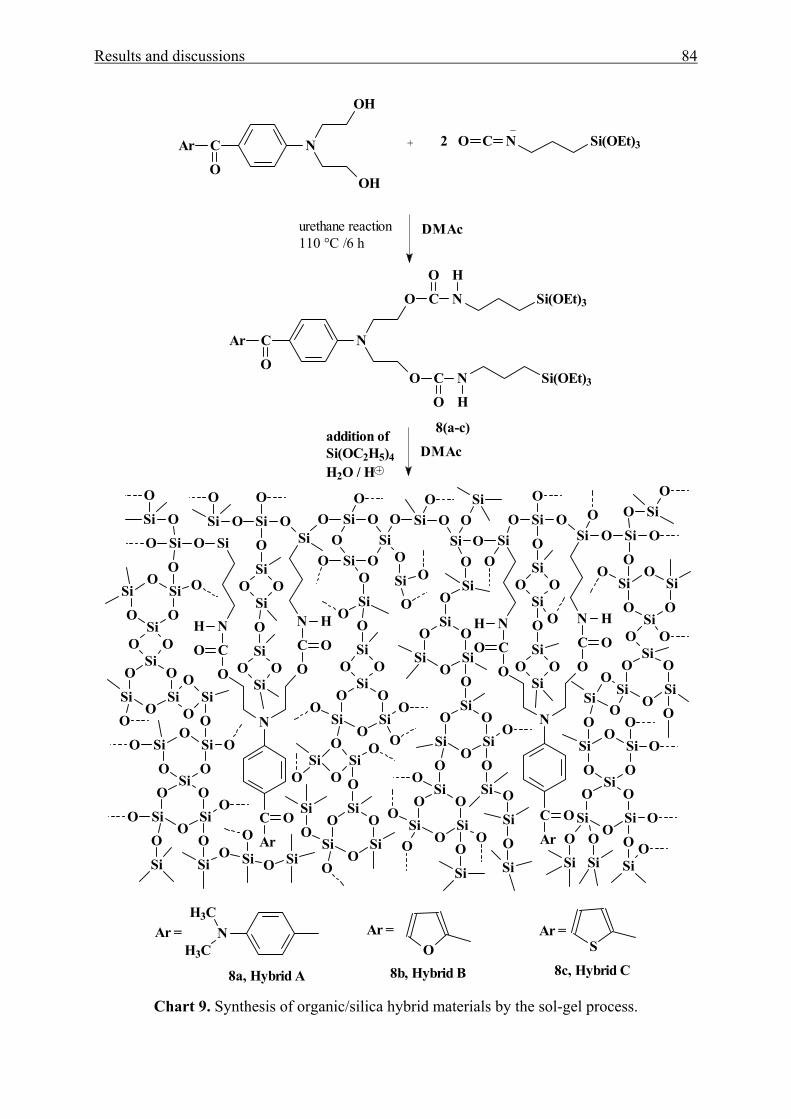
Results and discussions 84
Ar C
O
N
OH
OH
+ 2 O C N Si(OEt)3
DMAcurethane reaction110 °C /6 h
Ar C
O
N
O
O
C N
C N
O H
O H
Si(OEt)3
Si(OEt)3
DMAcaddition ofSi(OC2H5)4H2O / H
8(a-c)
Ar
C O
N
O OC
NC
N
O
HO
H
SiO Si OSi O
SiOSiO
O
OO
SiO
O
SiO
SiO
O
SiO
Si
OO
O
O
SiO
SiO
O
O
O
SiO
SiO
Si
OO
O
Si
OSi
O
O
O
SiO
SiO
O
SiO
SiO
SiO
O
O
SiO
Si
OSi
O
O
OSi
O
O
SiO
Si
O
O
OSi
O
Si
O
O
SiO
Si
OSi
O
O O
Si
O
O
SiO
Si
O
OO
O
Si
O
SiO Si
O
O Si
OSi
OSiO
Ar
C O
N
O OC
NC
N
O
HO
H
Si Si O
OO O Si
O
O
O
SiO
SiO
O
SiO
SiO
O
Si O
O
O
Si
OSi
O
SiOO
OSi
O
O
SiO
Si
OO
SiO
O O
Si
OSi
O
SiO
SiOSi
O
O
O
SiO
Si
O
O OO
O
SiSi SiO
O
SiO
SiO
SiO
SiO
Si
O
O
O
O
SiO
SiO
Si
O
O O
O
SiO
SiO
Si
OSi
O
O OO
O
Si
O
O
SiSi
O
O
NH3C
H3C O SAr = Ar = Ar =
8a, Hybrid A 8b, Hybrid B 8c, Hybrid C
Chart 9. Synthesis of organic/silica hybrid materials by the sol-gel process.
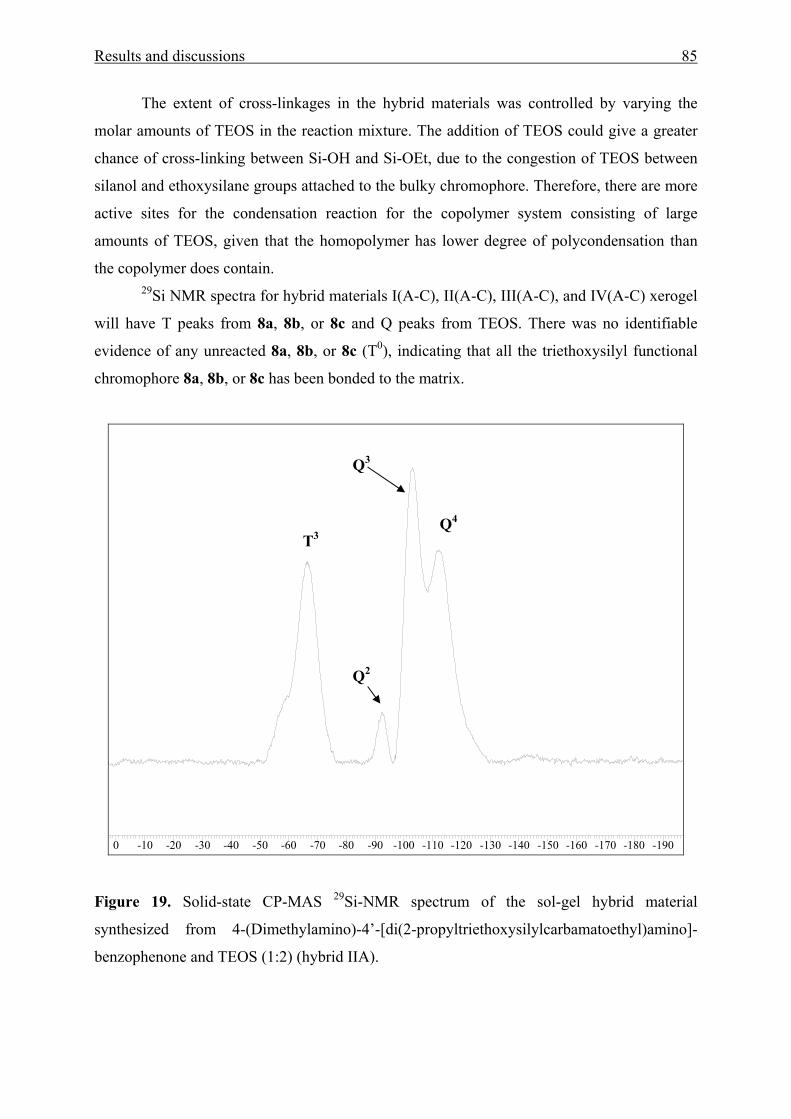
Results and discussions 85
The extent of cross-linkages in the hybrid materials was controlled by varying the
molar amounts of TEOS in the reaction mixture. The addition of TEOS could give a greater
chance of cross-linking between Si-OH and Si-OEt, due to the congestion of TEOS between
silanol and ethoxysilane groups attached to the bulky chromophore. Therefore, there are more
active sites for the condensation reaction for the copolymer system consisting of large
amounts of TEOS, given that the homopolymer has lower degree of polycondensation than
the copolymer does contain.
29Si NMR spectra for hybrid materials I(A-C), II(A-C), III(A-C), and IV(A-C) xerogel
will have T peaks from 8a, 8b, or 8c and Q peaks from TEOS. There was no identifiable
evidence of any unreacted 8a, 8b, or 8c (T0), indicating that all the triethoxysilyl functional
chromophore 8a, 8b, or 8c has been bonded to the matrix.
-190-190-180-180-170-170-160-160-150-150-140-140-130-130-120-120-110-110-100-100-90-90-80-80-70-70-60-60-50-50-40-40-30-30-20-20-10-1000
Figure 19. Solid-state CP-MAS 29Si-NMR spectrum of the sol-gel hybrid material
synthesized from 4-(Dimethylamino)-4’-[di(2-propyltriethoxysilylcarbamatoethyl)amino]-
benzophenone and TEOS (1:2) (hybrid IIA).
Q4
Q3
Q2
T3
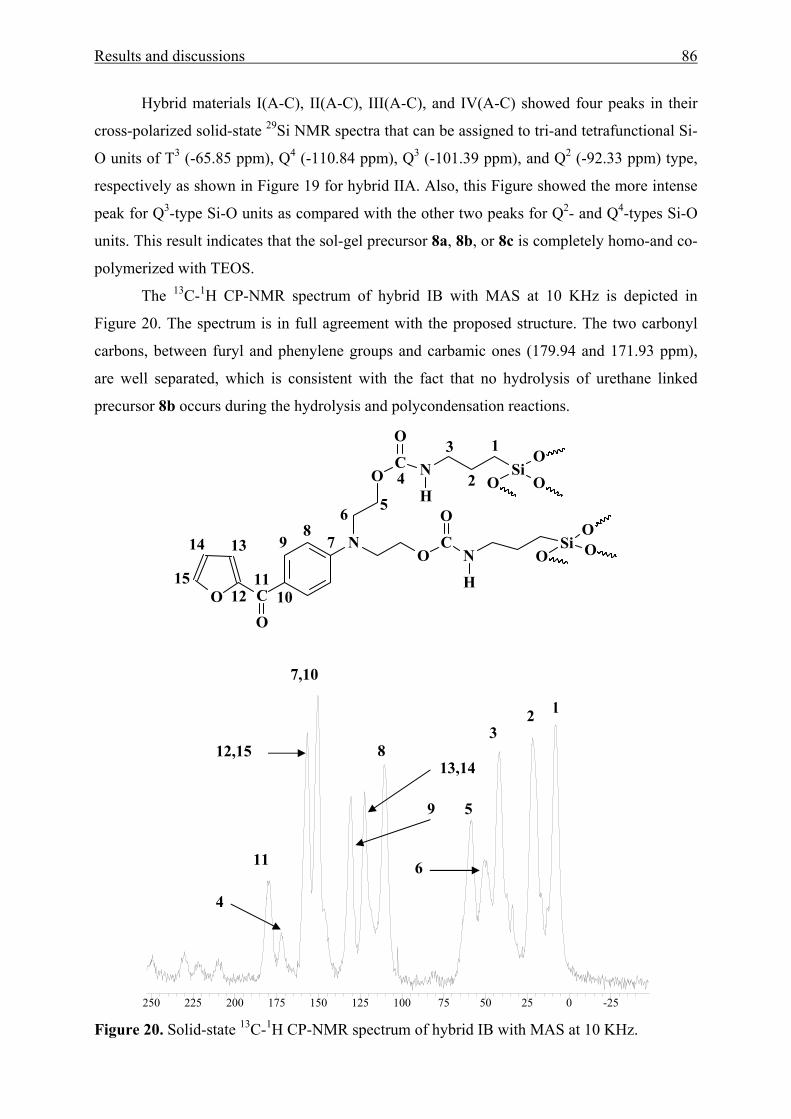
Results and discussions 86
Hybrid materials I(A-C), II(A-C), III(A-C), and IV(A-C) showed four peaks in their
cross-polarized solid-state 29Si NMR spectra that can be assigned to tri-and tetrafunctional Si-
O units of T3 (-65.85 ppm), Q4 (-110.84 ppm), Q3 (-101.39 ppm), and Q2 (-92.33 ppm) type,
respectively as shown in Figure 19 for hybrid IIA. Also, this Figure showed the more intense
peak for Q3-type Si-O units as compared with the other two peaks for Q2- and Q4-types Si-O
units. This result indicates that the sol-gel precursor 8a, 8b, or 8c is completely homo-and co-
polymerized with TEOS.
The 13C-1H CP-NMR spectrum of hybrid IB with MAS at 10 KHz is depicted in
Figure 20. The spectrum is in full agreement with the proposed structure. The two carbonyl
carbons, between furyl and phenylene groups and carbamic ones (179.94 and 171.93 ppm),
are well separated, which is consistent with the fact that no hydrolysis of urethane linked
precursor 8b occurs during the hydrolysis and polycondensation reactions.
O C
O
N
O
O
C
C
O
N
N
H
Si
O
H
Si
O
O O
OO
O
1
2
3
56
78
9
10
4
1112
1314
15
-25-2500252550507575100100125125150150175175200200225225250250
Figure 20. Solid-state 13C-1H CP-NMR spectrum of hybrid IB with MAS at 10 KHz.
1 23
5
6
4
11
813,14
9
12,15
7,10
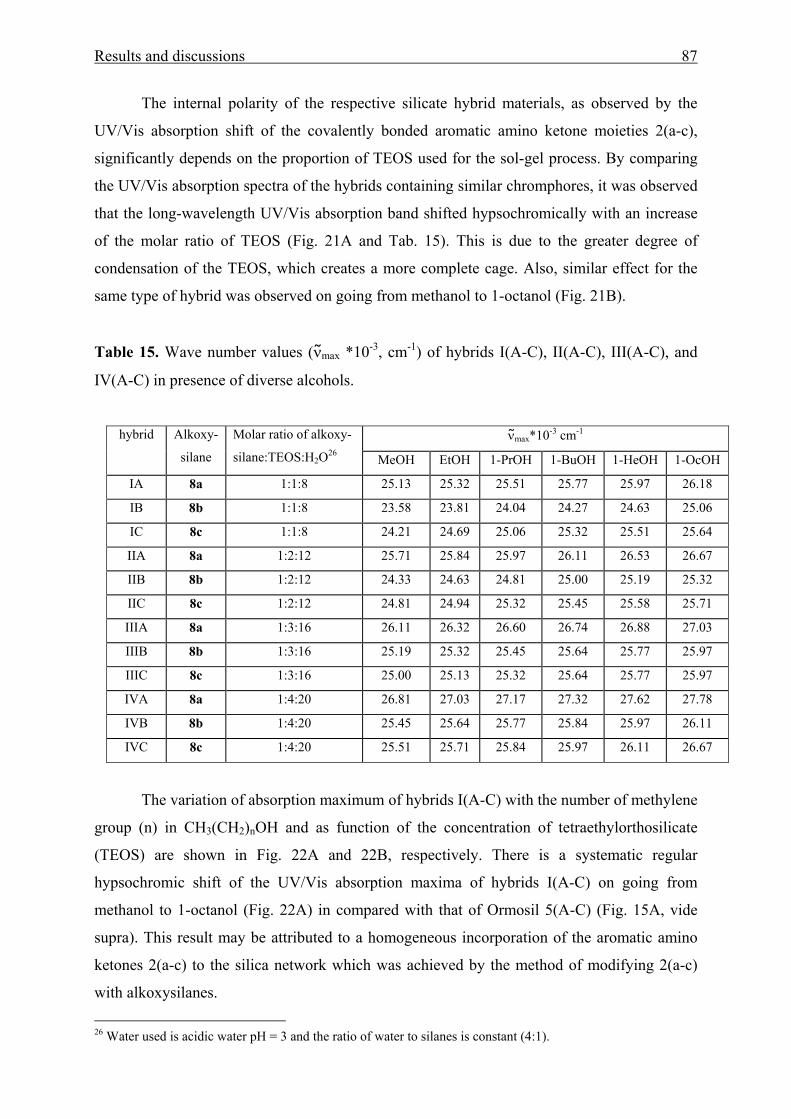
Results and discussions 87
The internal polarity of the respective silicate hybrid materials, as observed by the
UV/Vis absorption shift of the covalently bonded aromatic amino ketone moieties 2(a-c),
significantly depends on the proportion of TEOS used for the sol-gel process. By comparing
the UV/Vis absorption spectra of the hybrids containing similar chromphores, it was observed
that the long-wavelength UV/Vis absorption band shifted hypsochromically with an increase
of the molar ratio of TEOS (Fig. 21A and Tab. 15). This is due to the greater degree of
condensation of the TEOS, which creates a more complete cage. Also, similar effect for the
same type of hybrid was observed on going from methanol to 1-octanol (Fig. 21B).
Table 15. Wave number values (νmax *10-3, cm-1) of hybrids I(A-C), II(A-C), III(A-C), and
IV(A-C) in presence of diverse alcohols.
The variation of absorption maximum of hybrids I(A-C) with the number of methylene
group (n) in CH3(CH2)nOH and as function of the concentration of tetraethylorthosilicate
(TEOS) are shown in Fig. 22A and 22B, respectively. There is a systematic regular
hypsochromic shift of the UV/Vis absorption maxima of hybrids I(A-C) on going from
methanol to 1-octanol (Fig. 22A) in compared with that of Ormosil 5(A-C) (Fig. 15A, vide
supra). This result may be attributed to a homogeneous incorporation of the aromatic amino
ketones 2(a-c) to the silica network which was achieved by the method of modifying 2(a-c)
with alkoxysilanes.
26 Water used is acidic water pH = 3 and the ratio of water to silanes is constant (4:1).
ν max*10-3 cm-1 hybrid Alkoxy-
silane
Molar ratio of alkoxy-
silane:TEOS:H2O26 MeOH EtOH 1-PrOH 1-BuOH 1-HeOH 1-OcOH
IA 8a 1:1:8 25.13 25.32 25.51 25.77 25.97 26.18
IB 8b 1:1:8 23.58 23.81 24.04 24.27 24.63 25.06
IC 8c 1:1:8 24.21 24.69 25.06 25.32 25.51 25.64
IIA 8a 1:2:12 25.71 25.84 25.97 26.11 26.53 26.67
IIB 8b 1:2:12 24.33 24.63 24.81 25.00 25.19 25.32
IIC 8c 1:2:12 24.81 24.94 25.32 25.45 25.58 25.71
IIIA 8a 1:3:16 26.11 26.32 26.60 26.74 26.88 27.03
IIIB 8b 1:3:16 25.19 25.32 25.45 25.64 25.77 25.97
IIIC 8c 1:3:16 25.00 25.13 25.32 25.64 25.77 25.97
IVA 8a 1:4:20 26.81 27.03 27.17 27.32 27.62 27.78
IVB 8b 1:4:20 25.45 25.64 25.77 25.84 25.97 26.11
IVC 8c 1:4:20 25.51 25.71 25.84 25.97 26.11 26.67
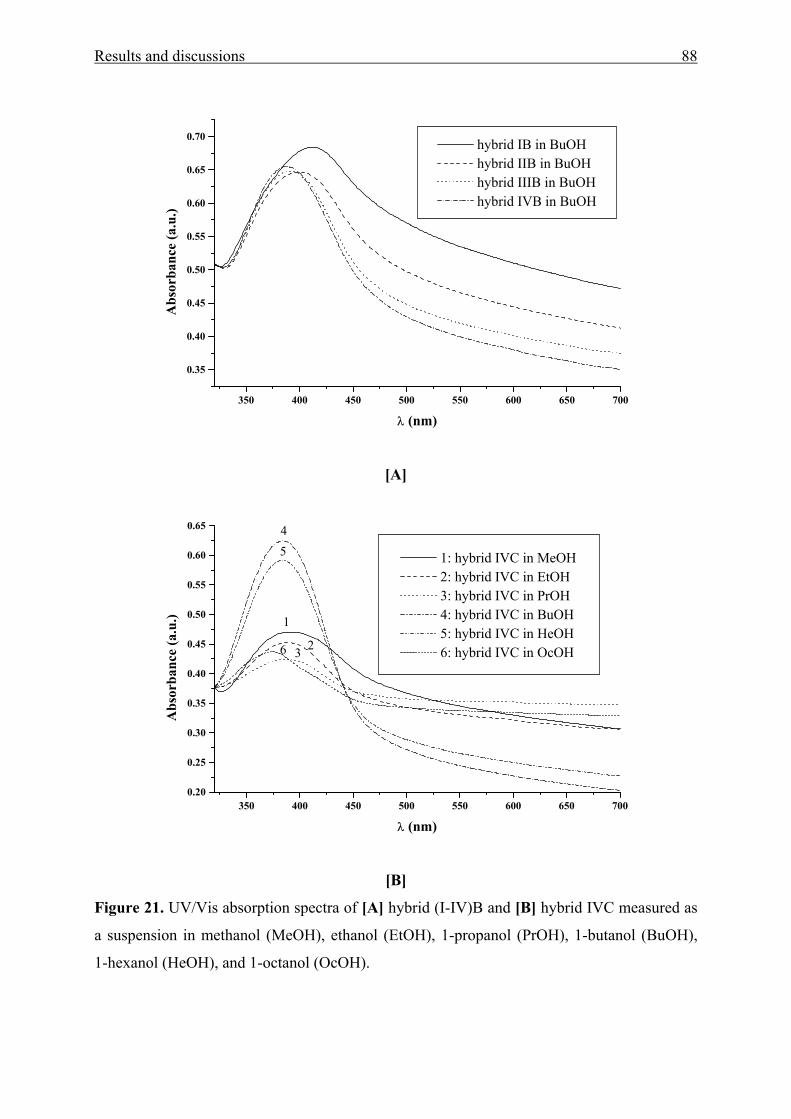
Results and discussions 88
350 400 450 500 550 600 650 700
0.35
0.40
0.45
0.50
0.55
0.60
0.65
0.70 hybrid IB in BuOH hybrid IIB in BuOH hybrid IIIB in BuOH hybrid IVB in BuOH
Abs
orba
nce
(a.u
.)
λ (nm)
[A]
350 400 450 500 550 600 650 7000.20
0.25
0.30
0.35
0.40
0.45
0.50
0.55
0.60
0.65
3
45
6 2
1
1: hybrid IVC in MeOH 2: hybrid IVC in EtOH 3: hybrid IVC in PrOH 4: hybrid IVC in BuOH 5: hybrid IVC in HeOH 6: hybrid IVC in OcOH
Abs
orba
nce
(a.u
.)
λ (nm)
[B]
Figure 21. UV/Vis absorption spectra of [A] hybrid (I-IV)B and [B] hybrid IVC measured as
a suspension in methanol (MeOH), ethanol (EtOH), 1-propanol (PrOH), 1-butanol (BuOH),
1-hexanol (HeOH), and 1-octanol (OcOH).
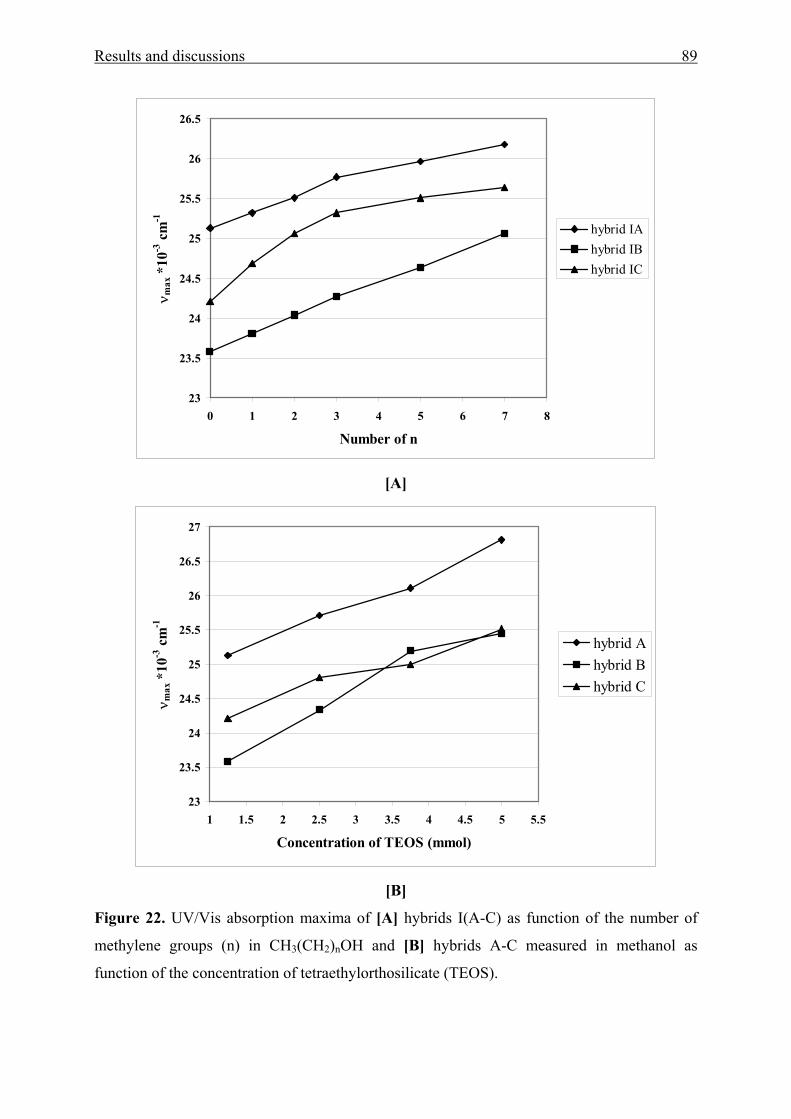
Results and discussions 89
23
23.5
24
24.5
25
25.5
26
26.5
0 1 2 3 4 5 6 7 8
Number of n
ν max
*10
-3 c
m-1
hybrid IAhybrid IBhybrid IC
[A]
23
23.5
24
24.5
25
25.5
26
26.5
27
1 1.5 2 2.5 3 3.5 4 4.5 5 5.5
Concentration of TEOS (mmol)
ν max
*10
-3 c
m-1
hybrid Ahybrid Bhybrid C
[B]
Figure 22. UV/Vis absorption maxima of [A] hybrids I(A-C) as function of the number of
methylene groups (n) in CH3(CH2)nOH and [B] hybrids A-C measured in methanol as
function of the concentration of tetraethylorthosilicate (TEOS).
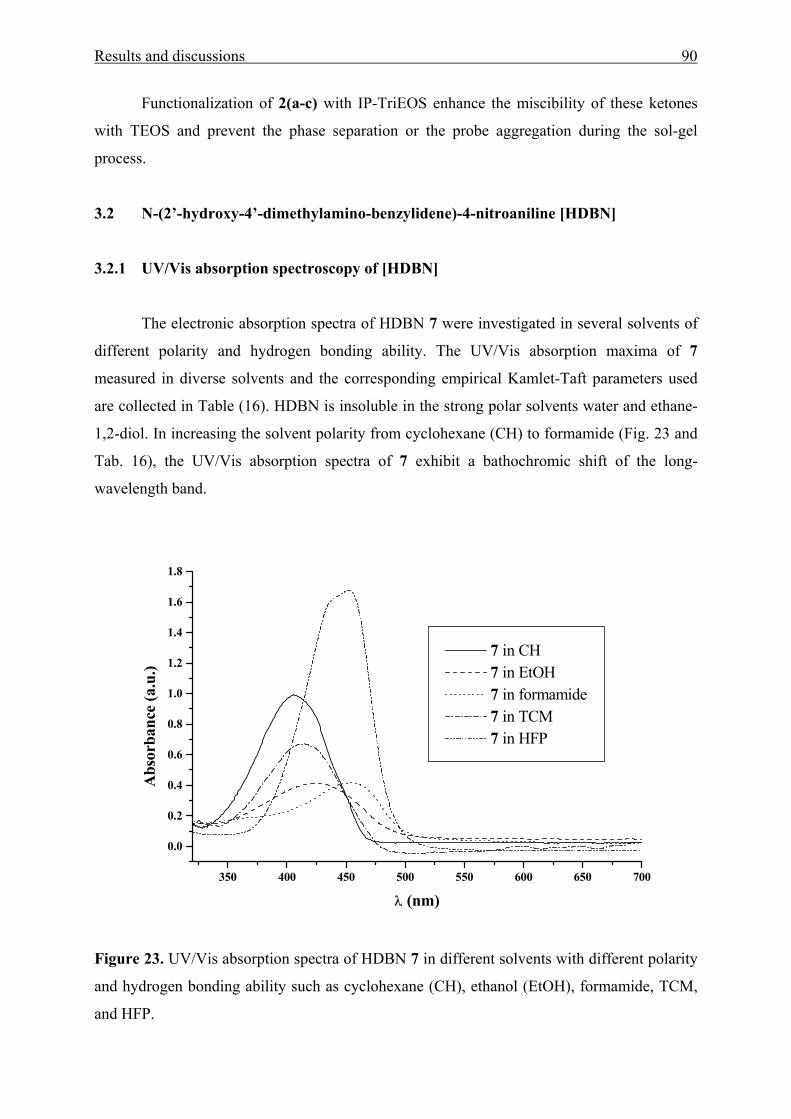
Results and discussions 90
Functionalization of 2(a-c) with IP-TriEOS enhance the miscibility of these ketones
with TEOS and prevent the phase separation or the probe aggregation during the sol-gel
process.
3.2 N-(2’-hydroxy-4’-dimethylamino-benzylidene)-4-nitroaniline [HDBN]
3.2.1 UV/Vis absorption spectroscopy of [HDBN]
The electronic absorption spectra of HDBN 7 were investigated in several solvents of
different polarity and hydrogen bonding ability. The UV/Vis absorption maxima of 7
measured in diverse solvents and the corresponding empirical Kamlet-Taft parameters used
are collected in Table (16). HDBN is insoluble in the strong polar solvents water and ethane-
1,2-diol. In increasing the solvent polarity from cyclohexane (CH) to formamide (Fig. 23 and
Tab. 16), the UV/Vis absorption spectra of 7 exhibit a bathochromic shift of the long-
wavelength band.
350 400 450 500 550 600 650 700
0.0
0.2
0.4
0.6
0.8
1.0
1.2
1.4
1.6
1.8
7 in CH 7 in EtOH 7 in formamide 7 in TCM 7 in HFP
Abs
orba
nce
(a.u
.)
λ (nm)
Figure 23. UV/Vis absorption spectra of HDBN 7 in different solvents with different polarity
and hydrogen bonding ability such as cyclohexane (CH), ethanol (EtOH), formamide, TCM,
and HFP.
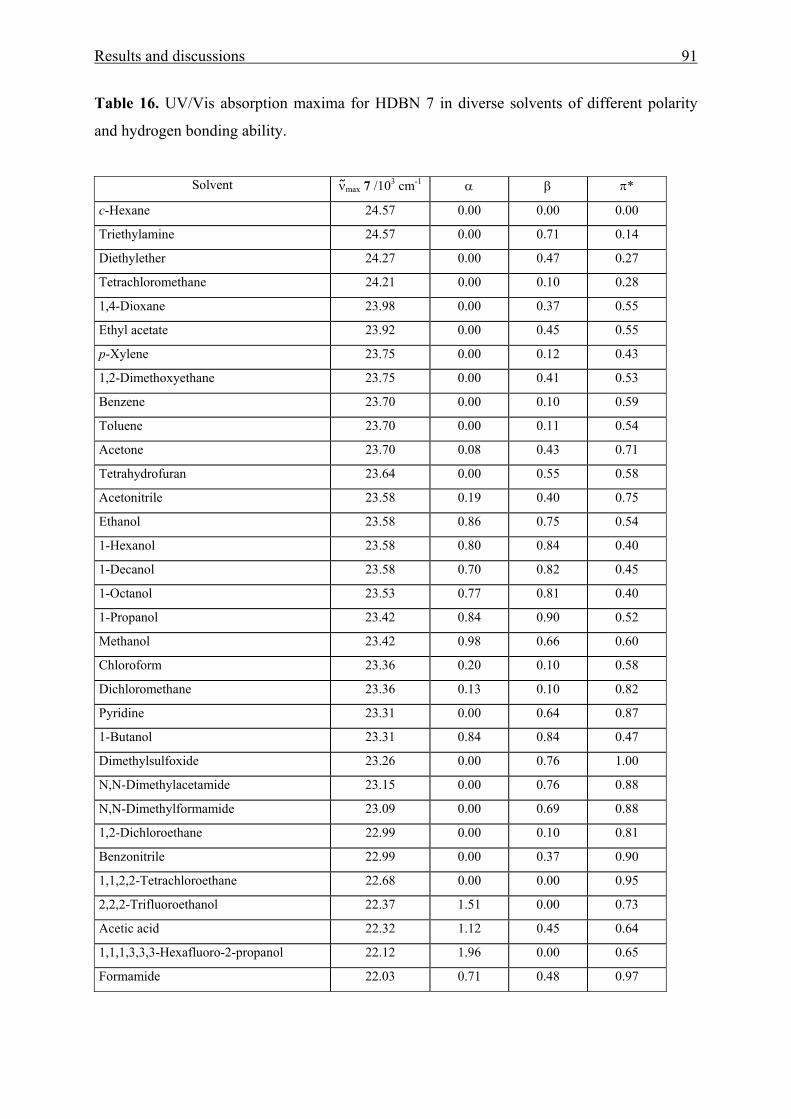
Results and discussions 91
Table 16. UV/Vis absorption maxima for HDBN 7 in diverse solvents of different polarity
and hydrogen bonding ability.
Solvent ν max 7 /103 cm-1 α β π*
c-Hexane 24.57 0.00 0.00 0.00
Triethylamine 24.57 0.00 0.71 0.14
Diethylether 24.27 0.00 0.47 0.27
Tetrachloromethane 24.21 0.00 0.10 0.28
1,4-Dioxane 23.98 0.00 0.37 0.55
Ethyl acetate 23.92 0.00 0.45 0.55
p-Xylene 23.75 0.00 0.12 0.43
1,2-Dimethoxyethane 23.75 0.00 0.41 0.53
Benzene 23.70 0.00 0.10 0.59
Toluene 23.70 0.00 0.11 0.54
Acetone 23.70 0.08 0.43 0.71
Tetrahydrofuran 23.64 0.00 0.55 0.58
Acetonitrile 23.58 0.19 0.40 0.75
Ethanol 23.58 0.86 0.75 0.54
1-Hexanol 23.58 0.80 0.84 0.40
1-Decanol 23.58 0.70 0.82 0.45
1-Octanol 23.53 0.77 0.81 0.40
1-Propanol 23.42 0.84 0.90 0.52
Methanol 23.42 0.98 0.66 0.60
Chloroform 23.36 0.20 0.10 0.58
Dichloromethane 23.36 0.13 0.10 0.82
Pyridine 23.31 0.00 0.64 0.87
1-Butanol 23.31 0.84 0.84 0.47
Dimethylsulfoxide 23.26 0.00 0.76 1.00
N,N-Dimethylacetamide 23.15 0.00 0.76 0.88
N,N-Dimethylformamide 23.09 0.00 0.69 0.88
1,2-Dichloroethane 22.99 0.00 0.10 0.81
Benzonitrile 22.99 0.00 0.37 0.90
1,1,2,2-Tetrachloroethane 22.68 0.00 0.00 0.95
2,2,2-Trifluoroethanol 22.37 1.51 0.00 0.73
Acetic acid 22.32 1.12 0.45 0.64
1,1,1,3,3,3-Hexafluoro-2-propanol 22.12 1.96 0.00 0.65
Formamide 22.03 0.71 0.48 0.97
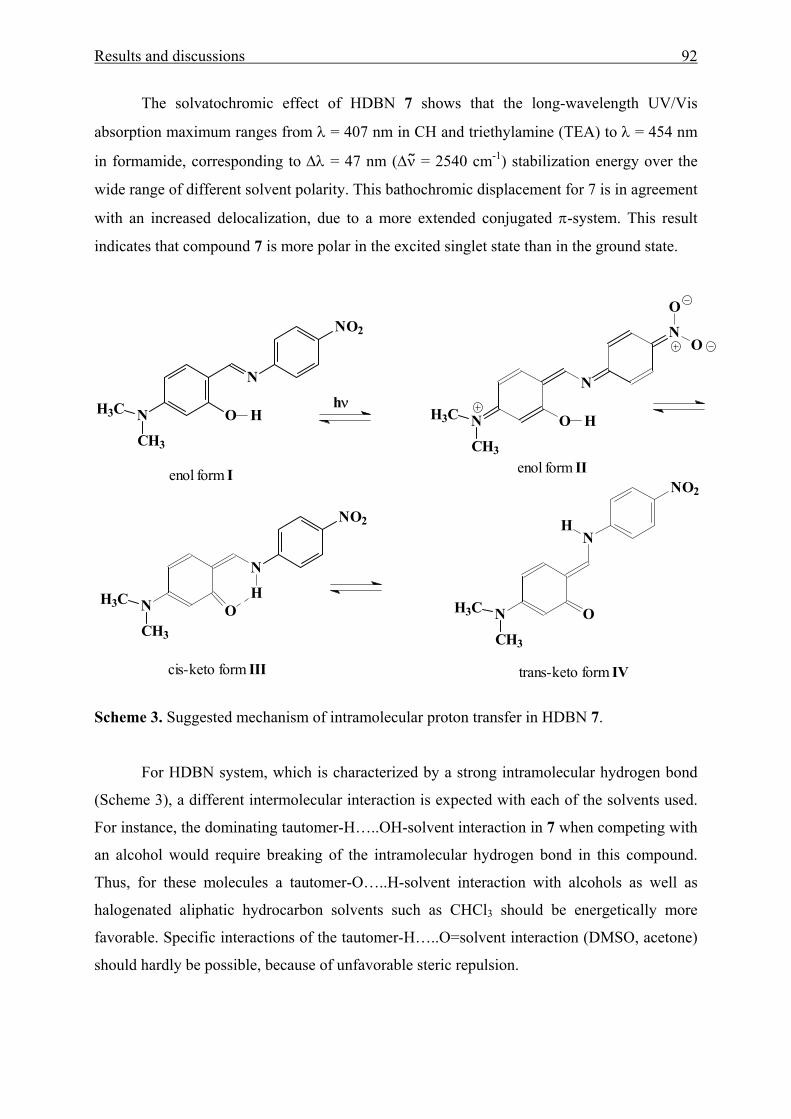
Results and discussions 92
The solvatochromic effect of HDBN 7 shows that the long-wavelength UV/Vis
absorption maximum ranges from λ = 407 nm in CH and triethylamine (TEA) to λ = 454 nm
in formamide, corresponding to ∆λ = 47 nm (∆ν = 2540 cm-1) stabilization energy over the
wide range of different solvent polarity. This bathochromic displacement for 7 is in agreement
with an increased delocalization, due to a more extended conjugated π-system. This result
indicates that compound 7 is more polar in the excited singlet state than in the ground state.
N
NO2
ONH3C
CH3
H NH3C
CH3
N
O
N
O
H
O
N
NO2
NH3C
CH3
OH
hν
enol form I enol form II
cis-keto form III trans-keto form IV
ONH3C
CH3
NH
NO2
Scheme 3. Suggested mechanism of intramolecular proton transfer in HDBN 7.
For HDBN system, which is characterized by a strong intramolecular hydrogen bond
(Scheme 3), a different intermolecular interaction is expected with each of the solvents used.
For instance, the dominating tautomer-H…..OH-solvent interaction in 7 when competing with
an alcohol would require breaking of the intramolecular hydrogen bond in this compound.
Thus, for these molecules a tautomer-O…..H-solvent interaction with alcohols as well as
halogenated aliphatic hydrocarbon solvents such as CHCl3 should be energetically more
favorable. Specific interactions of the tautomer-H…..O=solvent interaction (DMSO, acetone)
should hardly be possible, because of unfavorable steric repulsion.
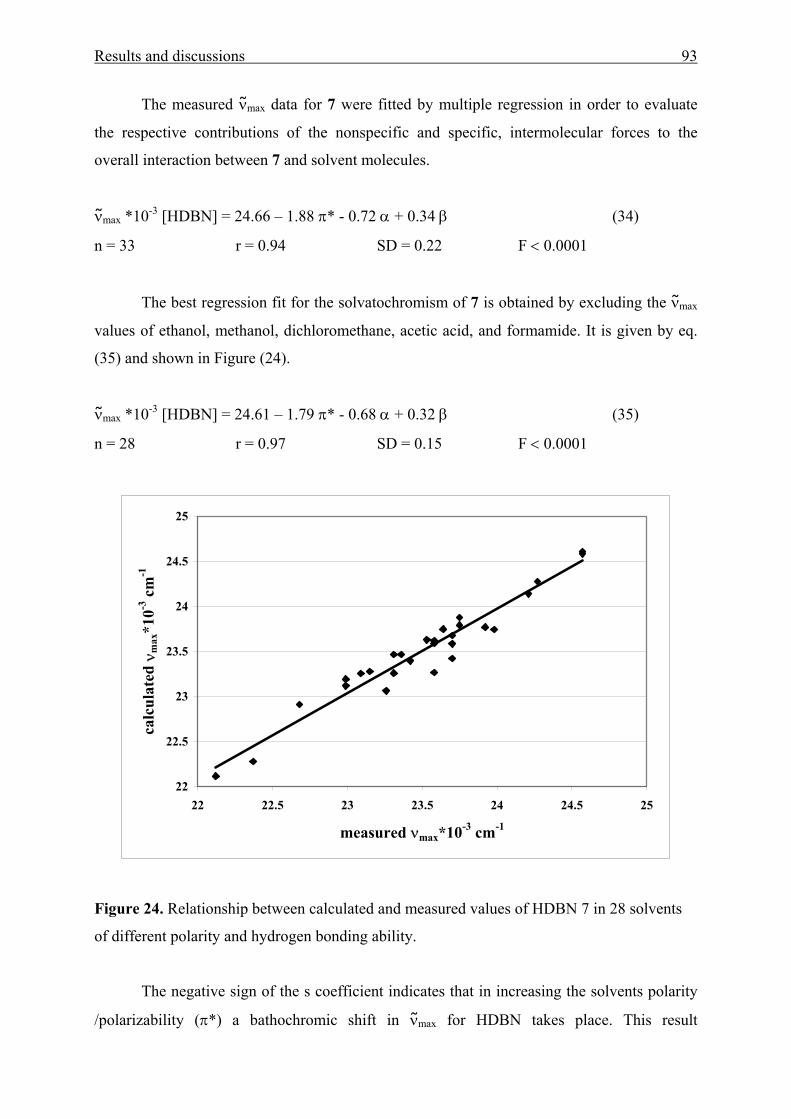
Results and discussions 93
The measured νmax data for 7 were fitted by multiple regression in order to evaluate
the respective contributions of the nonspecific and specific, intermolecular forces to the
overall interaction between 7 and solvent molecules.
νmax *10-3 [HDBN] = 24.66 – 1.88 π* - 0.72 α + 0.34 β (34)
n = 33 r = 0.94 SD = 0.22 F < 0.0001
The best regression fit for the solvatochromism of 7 is obtained by excluding the νmax
values of ethanol, methanol, dichloromethane, acetic acid, and formamide. It is given by eq.
(35) and shown in Figure (24).
νmax *10-3 [HDBN] = 24.61 – 1.79 π* - 0.68 α + 0.32 β (35)
n = 28 r = 0.97 SD = 0.15 F < 0.0001
22
22.5
23
23.5
24
24.5
25
22 22.5 23 23.5 24 24.5 25
measured νmax*10-3 cm-1
calc
ulat
ed ν
max
*10-3
cm
-1
Figure 24. Relationship between calculated and measured values of HDBN 7 in 28 solvents
of different polarity and hydrogen bonding ability.
The negative sign of the s coefficient indicates that in increasing the solvents polarity
/polarizability (π*) a bathochromic shift in νmax for HDBN takes place. This result
Results and discussions 94
demonstrates that the excited singlet state of this molecule becomes more stabilized when the
solvent polarity increases. The negative sign of the a coefficient found for the solvatochromic
UV/Vis absorption shift of HDBN indicates that in increasing the solvent HBD ability a HBD
solvation at the N,N-dimethylamino group is unlikely. The red shift in νmax is in agreement
with an increase in the formation of solute-solvent hydrogen bonding at the nitro group or
azomethine moiety. However, the contribution of the α term on the shift of νmax [HDBN] is
not so important, because the coefficient a (≈ 0.7) is significantly smaller than the coefficient
s (≈ 1.7) from eqs. 34 and 35. This demonstrates that the ability of the solvent to donate
hydrogen bonds is weaker than do solute-solvent dipole-dipole interactions occurring
preferably in the excited singlet state of the above compound. Thus, a satisfactory linear
correlation with high significance is also observed between νmax [HDBN] and solely the
Kamlet-Taft’s solvation parameter π* (36).
νmax *10-3 [HDBN] = 24.51 – 1.72 π* (36)
n = 28 r = 0.74 SD = 0.40 F < 0.0001
On going from a three-parameter equation with π*, α and β, to a two-parameter
equation considering only π* and α, the improvement in r of HDBN does not seem to change
significantly. (eq. 37).
νmax *10-3 [HDBN] = 24.74 – 1.78 π* - 0.67 α (37)
n = 28 r = 0.95 SD = 0.18 F < 0.0001
Therefore, we concluded that the effect of the β term (basicity) of the solvent on the
solvatochromic shift of νmax [HDBN] can be ignored. This indicates that the effect of β, which
should arise from the formation of a hydrogen bond donated from the o-hydroxyl group to the
solvent, is competed by the presence of the intramolecular hydrogen bond in HDBN. The
positive sign from eqs. 34 and 35 for β, however, shows that the breaking of the
intramolecular hydrogen bond brings a weaker effect upon ∆νmax than the expected formation
of the negatively charged phenolate.
Now the question is which role play acid-base interactions at the active centers of
HDBN and how do they contribute to the shift of the solvatochromic UV/Vis band?
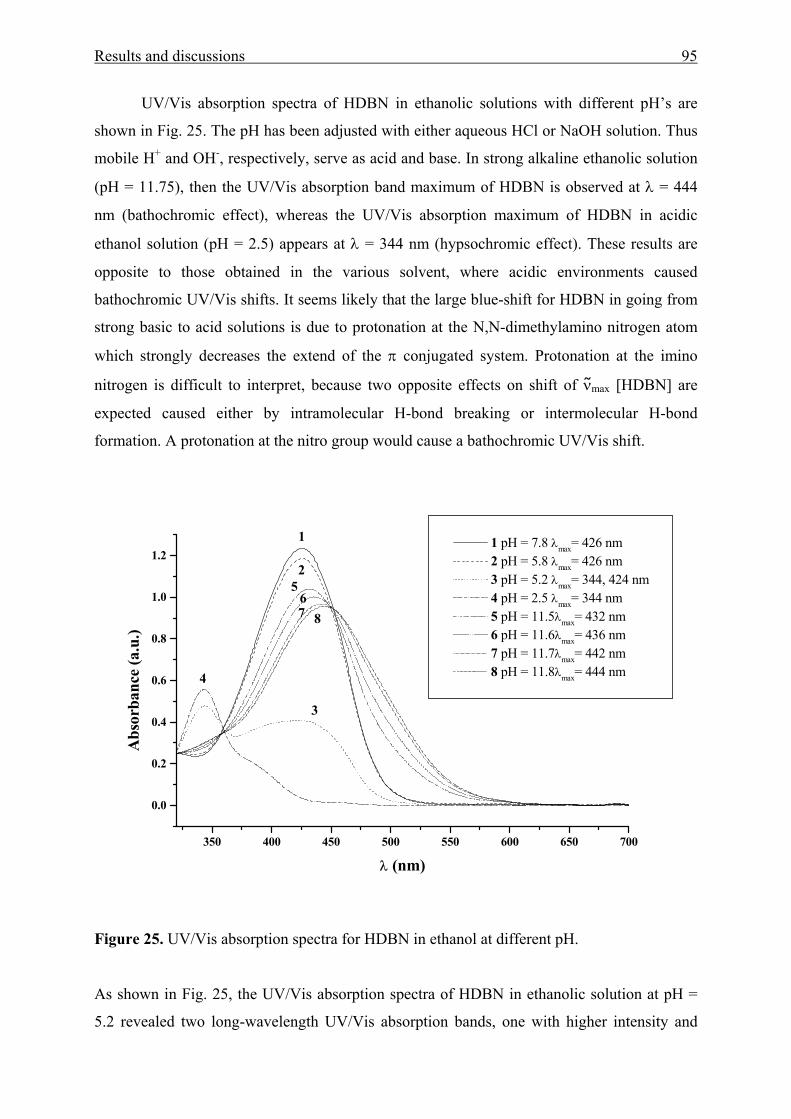
Results and discussions 95
UV/Vis absorption spectra of HDBN in ethanolic solutions with different pH’s are
shown in Fig. 25. The pH has been adjusted with either aqueous HCl or NaOH solution. Thus
mobile H+ and OH-, respectively, serve as acid and base. In strong alkaline ethanolic solution
(pH = 11.75), then the UV/Vis absorption band maximum of HDBN is observed at λ = 444
nm (bathochromic effect), whereas the UV/Vis absorption maximum of HDBN in acidic
ethanol solution (pH = 2.5) appears at λ = 344 nm (hypsochromic effect). These results are
opposite to those obtained in the various solvent, where acidic environments caused
bathochromic UV/Vis shifts. It seems likely that the large blue-shift for HDBN in going from
strong basic to acid solutions is due to protonation at the N,N-dimethylamino nitrogen atom
which strongly decreases the extend of the π conjugated system. Protonation at the imino
nitrogen is difficult to interpret, because two opposite effects on shift of νmax [HDBN] are
expected caused either by intramolecular H-bond breaking or intermolecular H-bond
formation. A protonation at the nitro group would cause a bathochromic UV/Vis shift.
350 400 450 500 550 600 650 700
0.0
0.2
0.4
0.6
0.8
1.0
1.2
876
5
4
3
2
1 1 pH = 7.8 λmax= 426 nm 2 pH = 5.8 λmax= 426 nm 3 pH = 5.2 λmax= 344, 424 nm 4 pH = 2.5 λmax= 344 nm 5 pH = 11.5λmax= 432 nm 6 pH = 11.6λmax= 436 nm 7 pH = 11.7λmax= 442 nm 8 pH = 11.8λmax= 444 nm
Abs
orba
nce
(a.u
.)
λ (nm)
Figure 25. UV/Vis absorption spectra for HDBN in ethanol at different pH.
As shown in Fig. 25, the UV/Vis absorption spectra of HDBN in ethanolic solution at pH =
5.2 revealed two long-wavelength UV/Vis absorption bands, one with higher intensity and
Results and discussions 96
higher energy (λmax = 344 nm) and the other one with a lower intensity and lower energy
(λmax = 424 nm). The position of the first UV/Vis absorption band is attributed to the
protonated form of HDBN. The second band is significantly red-shifted with respect to the
first band by approximately ∆λ = 80 nm. This UV/Vis absorption is likely attributed to the
presence of the quinoid structure of HDBN (Scheme 3), which seems of importance in
ethanolic solutions with pH ≥ 5.8.
3.2.2 X-ray crystal structure analysis in relation to powder reflectance UV/Vis
spectroscopy of HDBN
For these investigations, we have chosen the pure crystal powder of HDBN and
HDBN when entrapped in a sol-gel glass which is comparable to the polarity of methanol. In
both environments, directed dipolar and/or acid base interactions are expected to occur due to
the rigidity of the environment. The X- ray crystal structure analysis of HDBN has been
carried out in order to judge the intense red color of the crystals in relation to structural
features. HDBN crystallizes from benzene at 25 °C as red blocks in the monoclinic space
group P21/c, with a = 1683.380(10), b = 723.06(2), c = 1159.95(2) pm, α = γ = 90, β =
109.568(2)°, V = 1330.33(4)*106 pm3 and Z = 4. Relevant bond distances and angles are
given in the Figure 26A caption.
The observed bond lengths of O3-C9, C7-C8, C8-C9, and N1-C7 were 135.27(19),
143.18(17), 142.2(2) and 129.9(2) pm, respectively. The length of O3-C9 bond that of C7-C8
bond are considerably longer than the standard length of the C=O bond (122.2 pm) and that of
C=C bond (134.0 pm) in conjugated enones,120 respectively, and the length of C8-C9 and that
of N1-C7 bond are considerably shorter than the standard length of the C-C bond (146.4 pm)
in conjugated enones and that of C(sp2)-N bond (135.5 pm) in enamines, respectively. The
results suggest that the molecule HDBN exists in an enol form and also reveals the presence
of strong intramolecular hydrogen bond between the hydroxyl hydrogen atom and the imine
nitrogen atom in the molecule. The intramolecular hydrogen bonding in HDBN has a
profound effect since it holds that molecule in a planar conformation thereby maximizing the
molecular orbital overlap.
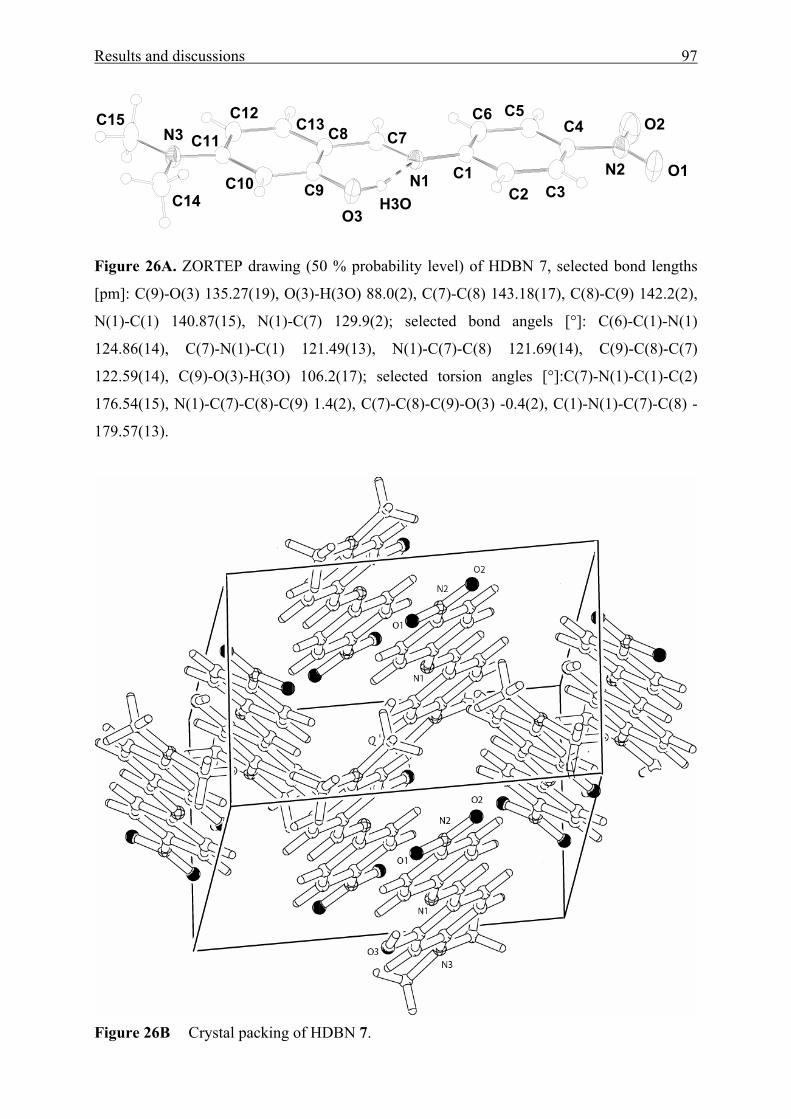
Results and discussions 97
O3C3C2
O1
C14C10 C9 N1
C4
N2C1
N3 C11 C8 C7O2
C5C6C15 C12C13
H3O
Figure 26A. ZORTEP drawing (50 % probability level) of HDBN 7, selected bond lengths
[pm]: C(9)-O(3) 135.27(19), O(3)-H(3O) 88.0(2), C(7)-C(8) 143.18(17), C(8)-C(9) 142.2(2),
N(1)-C(1) 140.87(15), N(1)-C(7) 129.9(2); selected bond angels [°]: C(6)-C(1)-N(1)
124.86(14), C(7)-N(1)-C(1) 121.49(13), N(1)-C(7)-C(8) 121.69(14), C(9)-C(8)-C(7)
122.59(14), C(9)-O(3)-H(3O) 106.2(17); selected torsion angles [°]:C(7)-N(1)-C(1)-C(2)
176.54(15), N(1)-C(7)-C(8)-C(9) 1.4(2), C(7)-C(8)-C(9)-O(3) -0.4(2), C(1)-N(1)-C(7)-C(8) -
179.57(13).
Figure 26B Crystal packing of HDBN 7.
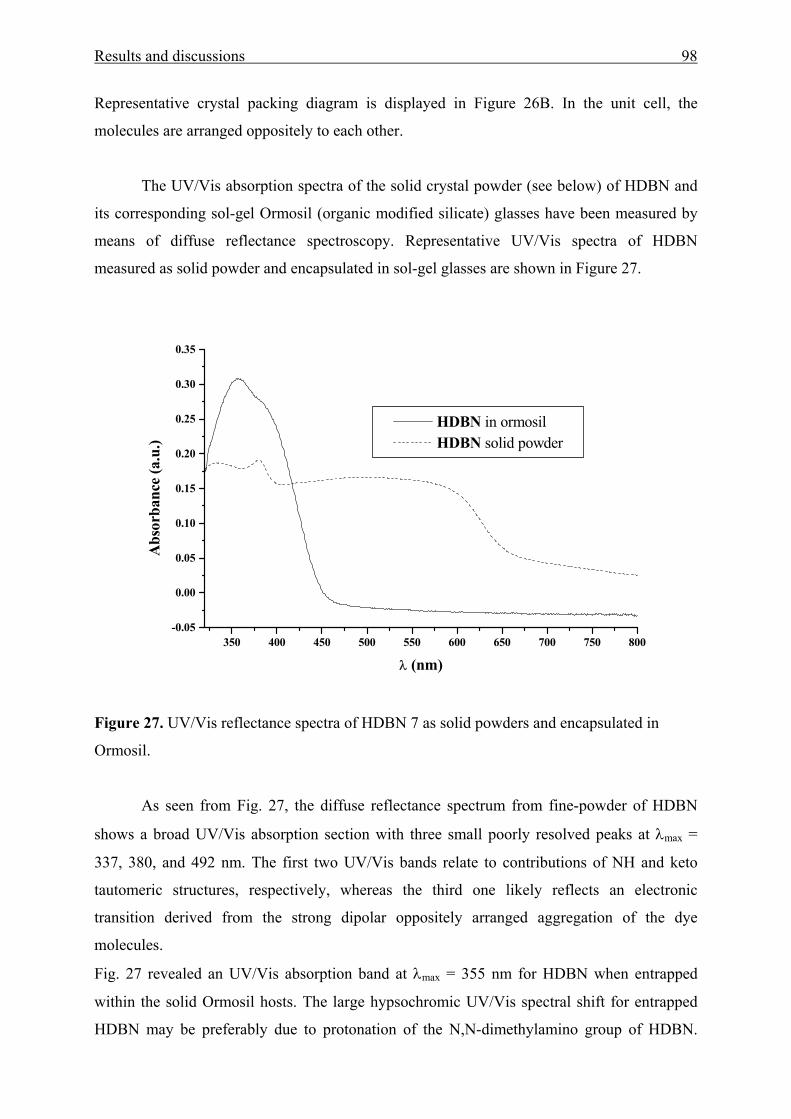
Results and discussions 98
Representative crystal packing diagram is displayed in Figure 26B. In the unit cell, the
molecules are arranged oppositely to each other.
The UV/Vis absorption spectra of the solid crystal powder (see below) of HDBN and
its corresponding sol-gel Ormosil (organic modified silicate) glasses have been measured by
means of diffuse reflectance spectroscopy. Representative UV/Vis spectra of HDBN
measured as solid powder and encapsulated in sol-gel glasses are shown in Figure 27.
350 400 450 500 550 600 650 700 750 800-0.05
0.00
0.05
0.10
0.15
0.20
0.25
0.30
0.35
HDBN in ormosil HDBN solid powder
Abs
orba
nce
(a.u
.)
λ (nm)
Figure 27. UV/Vis reflectance spectra of HDBN 7 as solid powders and encapsulated in
Ormosil.
As seen from Fig. 27, the diffuse reflectance spectrum from fine-powder of HDBN
shows a broad UV/Vis absorption section with three small poorly resolved peaks at λmax =
337, 380, and 492 nm. The first two UV/Vis bands relate to contributions of NH and keto
tautomeric structures, respectively, whereas the third one likely reflects an electronic
transition derived from the strong dipolar oppositely arranged aggregation of the dye
molecules.
Fig. 27 revealed an UV/Vis absorption band at λmax = 355 nm for HDBN when entrapped
within the solid Ormosil hosts. The large hypsochromic UV/Vis spectral shift for entrapped
HDBN may be preferably due to protonation of the N,N-dimethylamino group of HDBN.
Results and discussions 99
Also, since the formation of Schiff base is reversible, the change in the UV/Vis
absorbance may be due to breakage of the Schiff base bond (-CH=N-) in entrapped molecule
at higher pH.
3.2.3 Adsorption of HDBN on Aerosil 300
HDBN adsorbs readily on silica particles from non HBA solvents such as 1,2-
dichloroethane (DCE), TCE, toluene or benzene. The adsorption of HDBN on silica particles
from those solvents is associated with a significant bathochromic shift of the solvatochromic
UV/Vis absorption band (Tab. 17 and Fig. 28). This bathochromic shift can be well
interpreted in terms of the result derived from the solvent influence on νmax [HDBN]. The
increased stabilization of the polar ionic structure (Scheme 3) on silica, which is more
dominant in the excited singlet state than electronic ground state, is well in accord to the result
obtained in the strong dipolar solvents TFE, HFP or formamide. Compared to these solvents,
Aerosil-silica nano-particles in a liquid slurry have α value between 0.9 and 1.4 and π*
between 0.6 and 1.1 as function of HBA capacity and dipolarity/polarizability of solvents
used.114 β of silica particles can be neglected.
For instance, the calculated value of νmax [7/Aerosil] in CH2Cl2 (with α = 0.98 and π* =
1.14 from ref.114 = 22.046 cm-1 (from eq. 37) well agrees with the measured value of νmax
[7/Aerosil in CH2Cl2] = 22.270 cm-1 (from Tab. 17). Accordingly, hydrogen bond formation
which may occur solely at the oxygen atoms of the nitro group when HDBN is adsorbed on
silica enhances the electron push-pull conjugation effect. However, it seems that hydrogen
bonds at the dimethylamino and hydroxyl groups of HDBN on silica are of minor importance.
According to results from the literature, interaction of silanol groups at the nitro group
of push-pull aromates are preferred rather than at N,N-dimethylamino or OH groups.45,121
Additionally, the presence of intramolecular hydrogen bonds in HDBN would require
energy to break and formation a new intermolecular hydrogen bond between the dye indicator
HDBN and silanol group. It seems that HDBN when adsorbed is in a rigid conformation state
fixed and not in a twisted one.
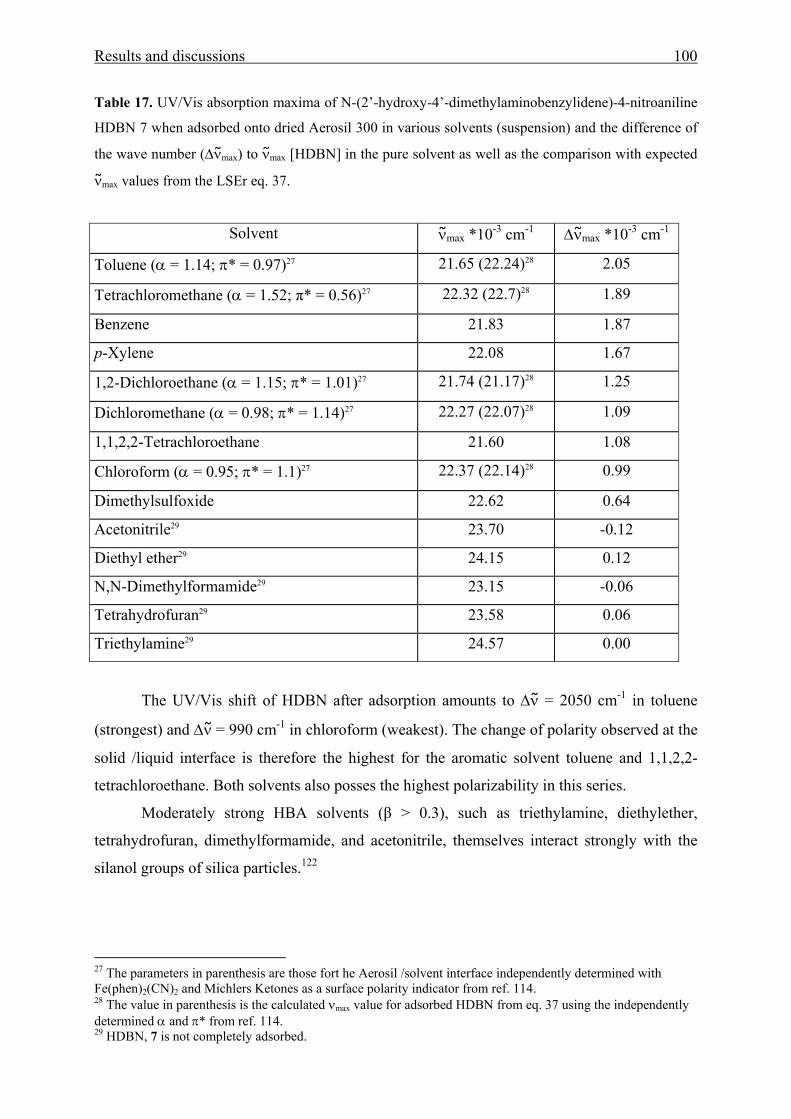
Results and discussions 100
Table 17. UV/Vis absorption maxima of N-(2’-hydroxy-4’-dimethylaminobenzylidene)-4-nitroaniline
HDBN 7 when adsorbed onto dried Aerosil 300 in various solvents (suspension) and the difference of
the wave number (∆νmax) to νmax [HDBN] in the pure solvent as well as the comparison with expected
νmax values from the LSEr eq. 37.
Solvent νmax *10-3 cm-1 ∆ν max *10-3 cm-1
Toluene (α = 1.14; π* = 0.97)27 21.65 (22.24)28 2.05
Tetrachloromethane (α = 1.52; π* = 0.56)27 22.32 (22.7)28 1.89
Benzene 21.83 1.87
p-Xylene 22.08 1.67
1,2-Dichloroethane (α = 1.15; π* = 1.01)27 21.74 (21.17)28 1.25
Dichloromethane (α = 0.98; π* = 1.14)27 22.27 (22.07)28 1.09
1,1,2,2-Tetrachloroethane 21.60 1.08
Chloroform (α = 0.95; π* = 1.1)27 22.37 (22.14)28 0.99
Dimethylsulfoxide 22.62 0.64
Acetonitrile29 23.70 -0.12
Diethyl ether29 24.15 0.12
N,N-Dimethylformamide29 23.15 -0.06
Tetrahydrofuran29 23.58 0.06
Triethylamine29 24.57 0.00
The UV/Vis shift of HDBN after adsorption amounts to ∆ν = 2050 cm-1 in toluene
(strongest) and ∆ν = 990 cm-1 in chloroform (weakest). The change of polarity observed at the
solid /liquid interface is therefore the highest for the aromatic solvent toluene and 1,1,2,2-
tetrachloroethane. Both solvents also posses the highest polarizability in this series.
Moderately strong HBA solvents (β > 0.3), such as triethylamine, diethylether,
tetrahydrofuran, dimethylformamide, and acetonitrile, themselves interact strongly with the
silanol groups of silica particles.122
27 The parameters in parenthesis are those fort he Aerosil /solvent interface independently determined with Fe(phen)2(CN)2 and Michlers Ketones as a surface polarity indicator from ref. 114. 28 The value in parenthesis is the calculated νmax value for adsorbed HDBN from eq. 37 using the independently determined α and π* from ref. 114. 29 HDBN, 7 is not completely adsorbed.
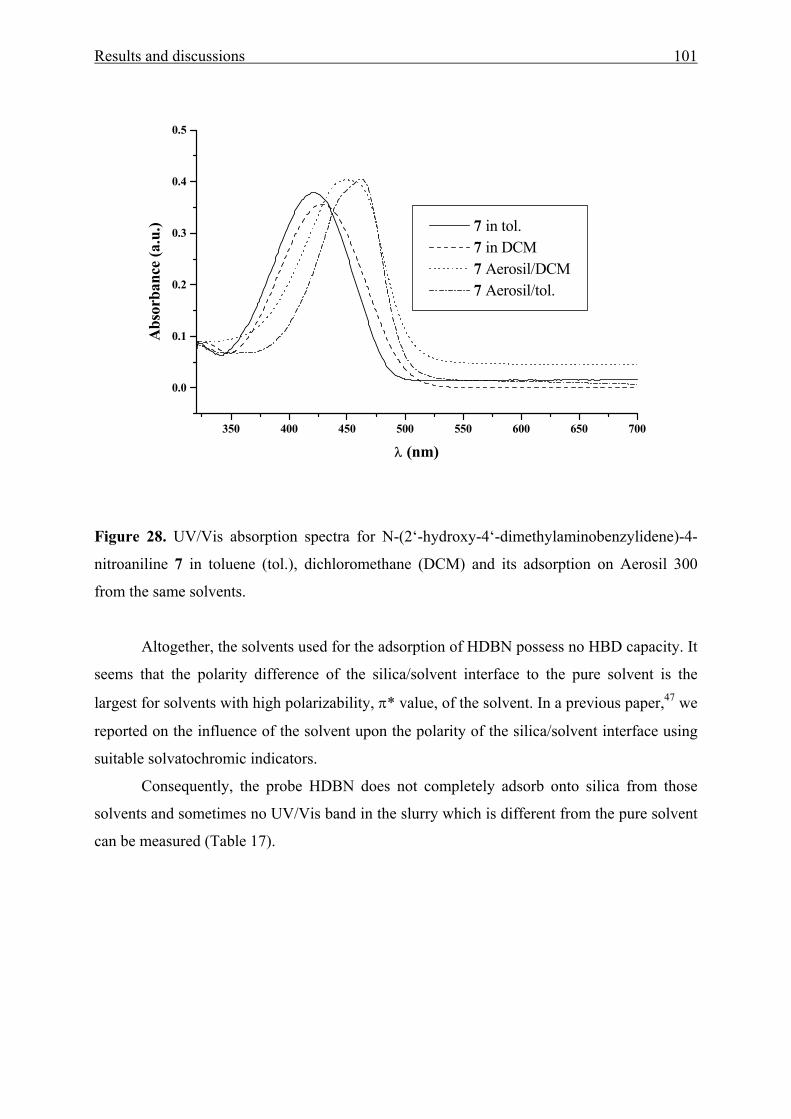
Results and discussions 101
350 400 450 500 550 600 650 700
0.0
0.1
0.2
0.3
0.4
0.5
7 in tol. 7 in DCM 7 Aerosil/DCM 7 Aerosil/tol.
Abs
orba
nce
(a.u
.)
λ (nm)
Figure 28. UV/Vis absorption spectra for N-(2‘-hydroxy-4‘-dimethylaminobenzylidene)-4-
nitroaniline 7 in toluene (tol.), dichloromethane (DCM) and its adsorption on Aerosil 300
from the same solvents.
Altogether, the solvents used for the adsorption of HDBN possess no HBD capacity. It
seems that the polarity difference of the silica/solvent interface to the pure solvent is the
largest for solvents with high polarizability, π* value, of the solvent. In a previous paper,47 we
reported on the influence of the solvent upon the polarity of the silica/solvent interface using
suitable solvatochromic indicators.
Consequently, the probe HDBN does not completely adsorb onto silica from those
solvents and sometimes no UV/Vis band in the slurry which is different from the pure solvent
can be measured (Table 17).

Results and discussions 102
3.3 Poly(benzophenone co-piperazine) and its silica composite
3.3.1 Syntheses and structure analysis
Matrix polymerization can be viewed as an intriguing procedure for the preparation of
homogeneous blends that are otherwise difficulty or practically impossible to prepare.
Poly(benzophenone co-piperazine) 9a has been synthesized by direct polycondensation of
piperazine with 4,4’-difluorobenzophenone in DMSO (solution polymerization).
Poly(benzophenone co-piperazine) modified LiChroprep Si 60 9b was prepared by the same
way. However, in this case the reaction was carried out in the presence of LiChroprep Si 60 as
a template and without solvent as a melt (solid-state polymerization) (Chart 10).
C
O
F F + NNH H
1
23
4
n n
-nHF -nHF
SiO2 + K2CO3
140 °CDMF + K2CO3
140 °C
5 6
1'2' 3'
4'
5'6'
N N C
O
N N HC
O
F
n-1
Chart 10. Synthesis of poly(benzophenone co-piperazine) using two different synthetic
procedures, solution and solid-state polymerization.
Special focus has been made in this work to ascertain whether the solution
polymerization is different from that solid-state polymerization. The structure of these
polymers was elucidated by elemental analysis (C, H, N) and spectroscopic methods (IR,
solid-state-NMR, UV/Vis spectroscopy, and MALDI-TOF MS spectroscopy).
3.3.1.1 Elemental analysis
The theoretical composition for (C17H16ON2)n was calculated at (C, 77.18; H, 6.05; N,
10.59). This is comparable to the experimentally found values for 9a (C, 76.05; H, 5.73; N,
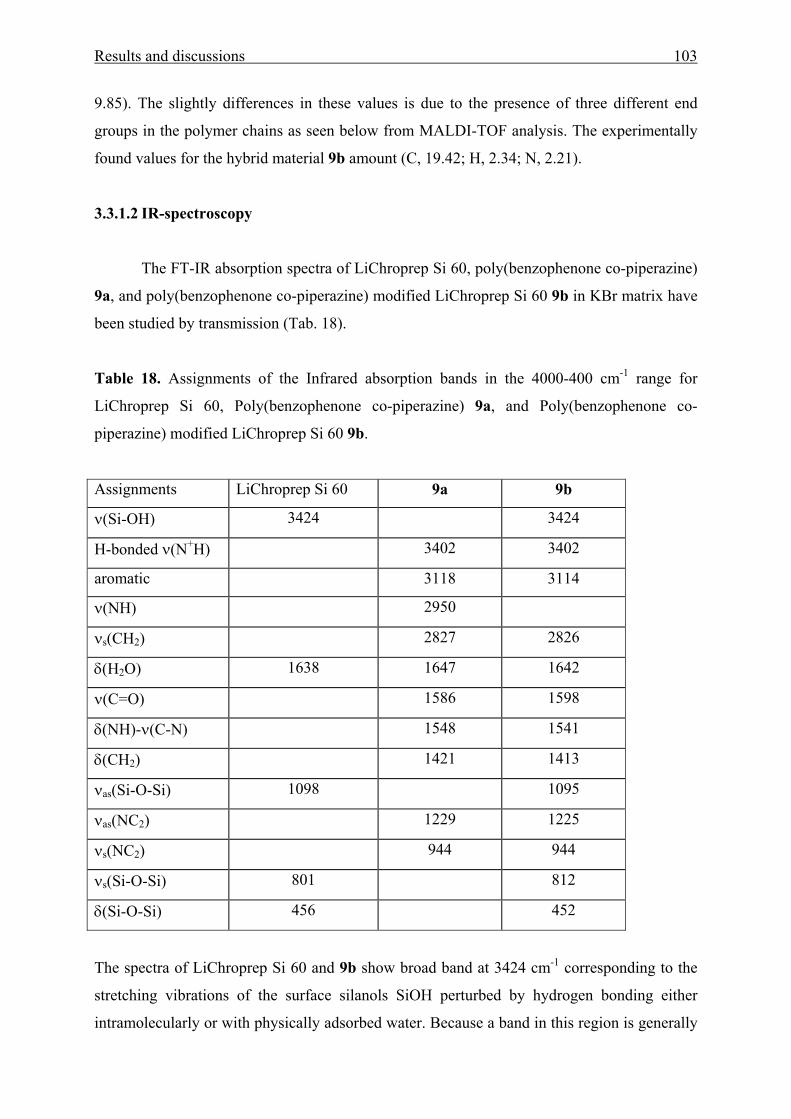
Results and discussions 103
9.85). The slightly differences in these values is due to the presence of three different end
groups in the polymer chains as seen below from MALDI-TOF analysis. The experimentally
found values for the hybrid material 9b amount (C, 19.42; H, 2.34; N, 2.21).
3.3.1.2 IR-spectroscopy
The FT-IR absorption spectra of LiChroprep Si 60, poly(benzophenone co-piperazine)
9a, and poly(benzophenone co-piperazine) modified LiChroprep Si 60 9b in KBr matrix have
been studied by transmission (Tab. 18).
Table 18. Assignments of the Infrared absorption bands in the 4000-400 cm-1 range for
LiChroprep Si 60, Poly(benzophenone co-piperazine) 9a, and Poly(benzophenone co-
piperazine) modified LiChroprep Si 60 9b.
Assignments LiChroprep Si 60 9a 9b
ν(Si-OH) 3424 3424
H-bonded ν(N+H) 3402 3402
aromatic 3118 3114
ν(NH) 2950
νs(CH2) 2827 2826
δ(H2O) 1638 1647 1642
ν(C=O) 1586 1598
δ(NH)-ν(C-N) 1548 1541
δ(CH2) 1421 1413
νas(Si-O-Si) 1098 1095
νas(NC2) 1229 1225
νs(NC2) 944 944
νs(Si-O-Si) 801 812
δ(Si-O-Si) 456 452
The spectra of LiChroprep Si 60 and 9b show broad band at 3424 cm-1 corresponding to the
stretching vibrations of the surface silanols SiOH perturbed by hydrogen bonding either
intramolecularly or with physically adsorbed water. Because a band in this region is generally

Results and discussions 104
associated with a band near 1640 cm-1 (presumably caused by H2O deformation), assignment
to H2O is usually favored. The broad band at 3402 cm-1 in 9a and 9b is attributed to the H-
bonded ν(NH) stretching vibrations. The presence of an intense band at 2827 cm-1 in 9a may
be explained by a strong νs (CH2) stretching vibrations. However, a weak band appears at
2826 cm-1 in case of 9b. The band at 2950 cm-1, which attributed to ν(NH) stretching
vibration, appearing only on 9a. The absence of this band in 9b indicates that the terminal NH
groups in poly(benzophenone co-piperazine) are interacted with the silanol groups to form
SiO-…H-NH+. The C = O stretching mode of carbonyl appears at 1586 and 1598 cm-1 in 9a
and 9b, respectively. The shape of the ν(C = O) band in case of 9b is sharp and blue shifted
(12 cm-1) from that of 9a. This is an indication that in the hybrid 9b the carbonyl group is not
involved in the same kind of interactions (intermolecular hydrogen bonding between the
carbonyl and the NH groups) as in the neat polymer 9a. The peaks at 944 and 1229 or 1225
cm-1 in 9a and 9b are assigned to the symmetric and anti-symmetric stretching bands of the
amine group, respectively, i.e. νs(NC2) and νas(NC2). The peaks observed at 1548 and 1541
cm-1 in 9a and 9b is associated with the NH bending coupled with C-N stretching vibrations.
The low frequency bands at 456 and 452 cm-1 in LiChroprep Si 60 and 9b are attributed to
rocking motions of the oxygen atoms perpendicular to the Si-O-Si plane. On both LiChroprep
Si 60 and 9b spectra, the broad bands at 1098 and 1095 cm-1, characteristic of the
antisymmetric stretching vibration of the Si-O-Si, and the more intense bands at 801 and 812
cm-1 (Si-O-Si symmetric stretching vibrations) are observed.
3.3.1.3 Solid-state NMR
29Si NMR. Solid-state {1H}-29Si CP MAS NMR spectra of LiChroprep Si 60 and
poly(benzophenone co-piperazine) modified LiChroprep Si 60 9b are depicted in Figure 29.
The spectrum of LiChroprep Si 60 reveals three signals at -111.32, -102.05, and -92.69 ppm
(Figure 29 [A]). However, in the case of poly(benzophenone co-piperazine) modified
LiChroprep Si 60 9b, the spectrum represents three peaks at -112.29, -102.67, and -91.95 ppm
(Figure 29 [B]). These signals are usually assigned to the 4Q, 3Q, and 2Q species, respectively.
The raw data from the CP technique reveal that the 4Q:3Q:2Q ratios are 1.0:7.7:0.4 for
LiChroprep Si 60 and 0.7:2.2:0.5 for 9b. There is, however, low cross-polarization efficiency
with the 4Q species because there are fewer H atoms nearby to facilitate the transfer of
polarization. It is reasonable to assume that only 3Q- and 2Q-type silicones provide sites for
adsorption.
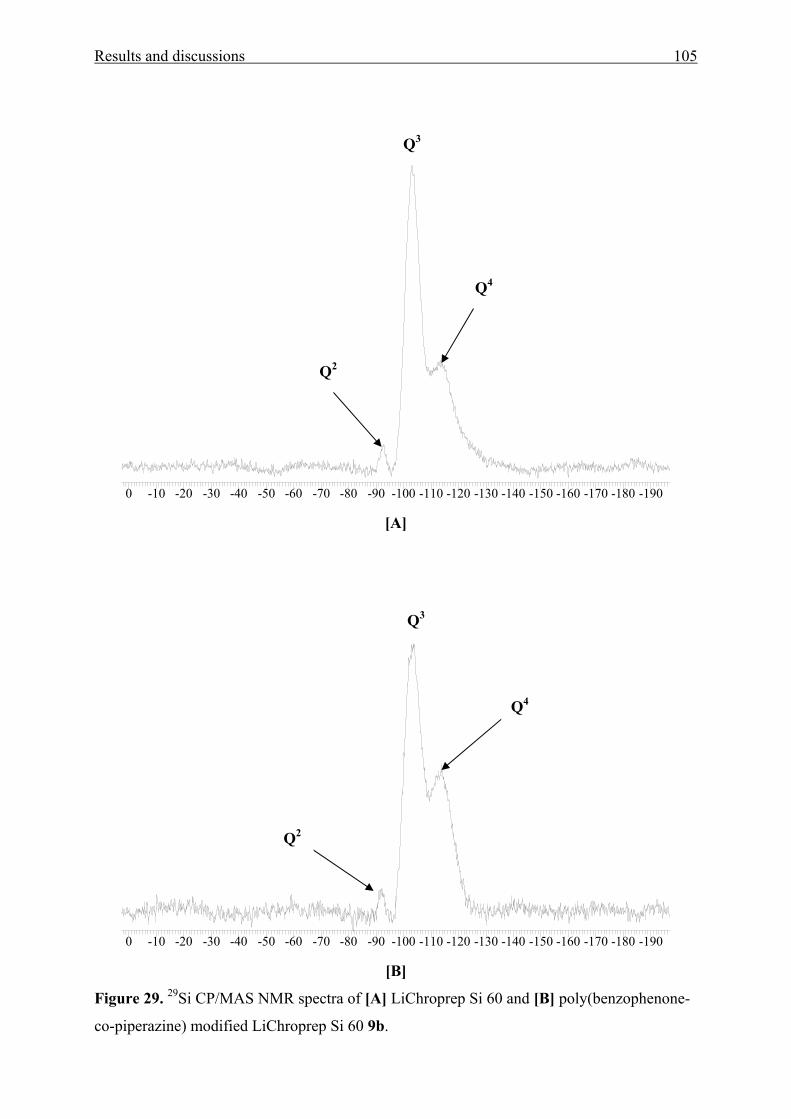
Results and discussions 105
-190-190-180-180-170-170-160-160-150-150-140-140-130-130-120-120-110-110-100-100-90-90-80-80-70-70-60-60-50-50-40-40-30-30-20-20-10-1000 [A]
-190-190-180-180-170-170-160-160-150-150-140-140-130-130-120-120-110-110-100-100-90-90-80-80-70-70-60-60-50-50-40-40-30-30-20-20-10-1000 [B]
Figure 29. 29Si CP/MAS NMR spectra of [A] LiChroprep Si 60 and [B] poly(benzophenone-
co-piperazine) modified LiChroprep Si 60 9b.
Q4
Q2
Q3
Q2
Q4
Q3
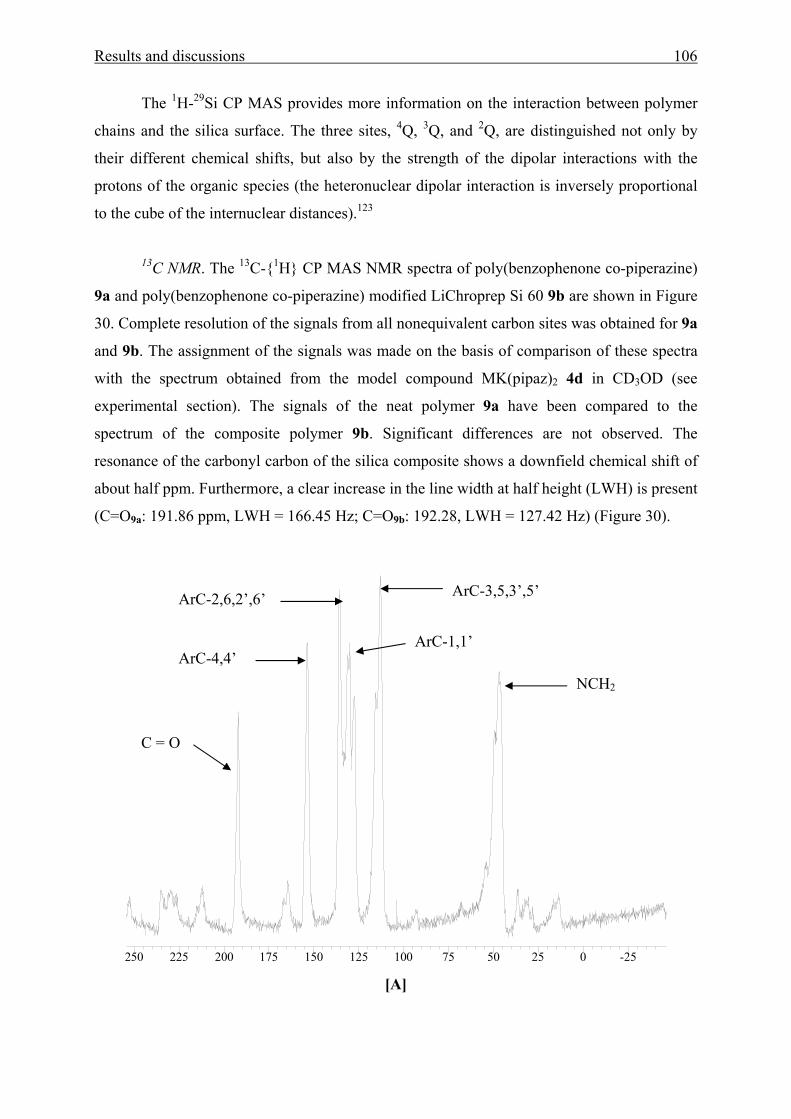
Results and discussions 106
The 1H-29Si CP MAS provides more information on the interaction between polymer
chains and the silica surface. The three sites, 4Q, 3Q, and 2Q, are distinguished not only by
their different chemical shifts, but also by the strength of the dipolar interactions with the
protons of the organic species (the heteronuclear dipolar interaction is inversely proportional
to the cube of the internuclear distances).123
13C NMR. The 13C-{1H} CP MAS NMR spectra of poly(benzophenone co-piperazine)
9a and poly(benzophenone co-piperazine) modified LiChroprep Si 60 9b are shown in Figure
30. Complete resolution of the signals from all nonequivalent carbon sites was obtained for 9a
and 9b. The assignment of the signals was made on the basis of comparison of these spectra
with the spectrum obtained from the model compound MK(pipaz)2 4d in CD3OD (see
experimental section). The signals of the neat polymer 9a have been compared to the
spectrum of the composite polymer 9b. Significant differences are not observed. The
resonance of the carbonyl carbon of the silica composite shows a downfield chemical shift of
about half ppm. Furthermore, a clear increase in the line width at half height (LWH) is present
(C=O9a: 191.86 ppm, LWH = 166.45 Hz; C=O9b: 192.28, LWH = 127.42 Hz) (Figure 30).
-25-2500252550507575100100125125150150175175200200225225250250
[A]
NCH2 ArC-4,4’
C = O
ArC-1,1’
ArC-2,6,2’,6’ ArC-3,5,3’,5’
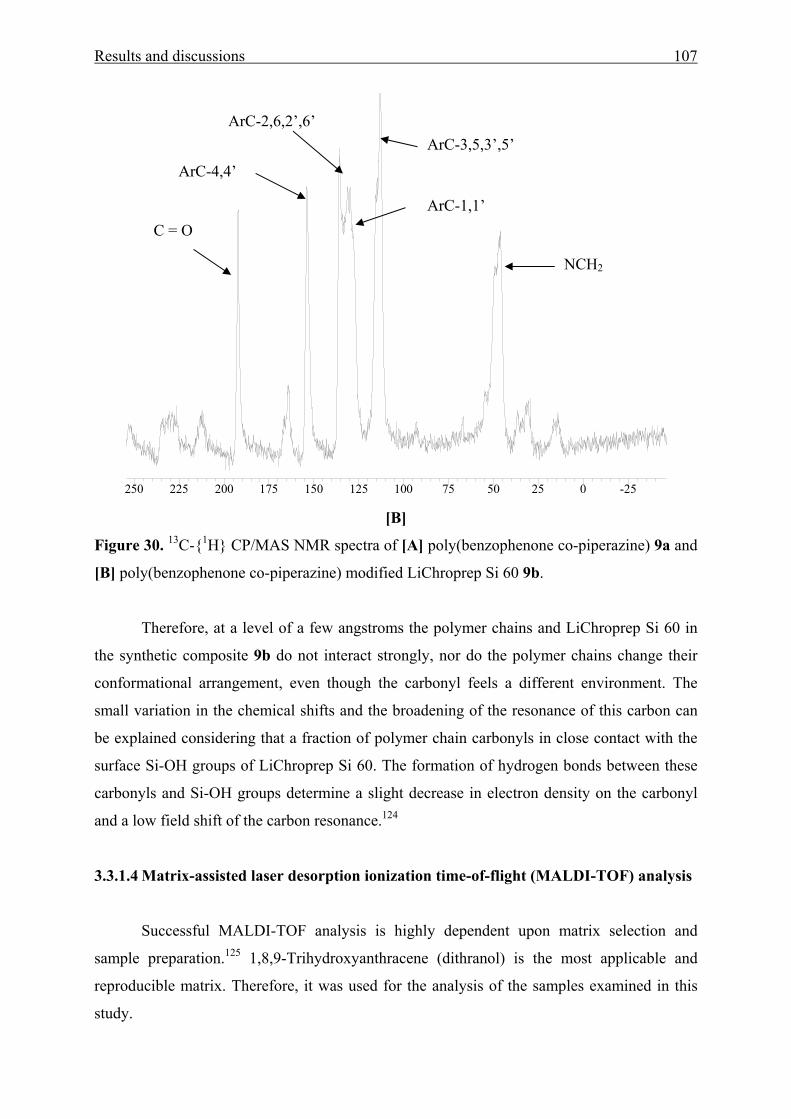
Results and discussions 107
-25-2500252550507575100100125125150150175175200200225225250250 [B]
Figure 30. 13C-{1H} CP/MAS NMR spectra of [A] poly(benzophenone co-piperazine) 9a and
[B] poly(benzophenone co-piperazine) modified LiChroprep Si 60 9b.
Therefore, at a level of a few angstroms the polymer chains and LiChroprep Si 60 in
the synthetic composite 9b do not interact strongly, nor do the polymer chains change their
conformational arrangement, even though the carbonyl feels a different environment. The
small variation in the chemical shifts and the broadening of the resonance of this carbon can
be explained considering that a fraction of polymer chain carbonyls in close contact with the
surface Si-OH groups of LiChroprep Si 60. The formation of hydrogen bonds between these
carbonyls and Si-OH groups determine a slight decrease in electron density on the carbonyl
and a low field shift of the carbon resonance.124
3.3.1.4 Matrix-assisted laser desorption ionization time-of-flight (MALDI-TOF) analysis
Successful MALDI-TOF analysis is highly dependent upon matrix selection and
sample preparation.125 1,8,9-Trihydroxyanthracene (dithranol) is the most applicable and
reproducible matrix. Therefore, it was used for the analysis of the samples examined in this
study.
NCH2
ArC-3,5,3’,5’
ArC-1,1’
ArC-2,6,2’,6’
C = O
ArC-4,4’
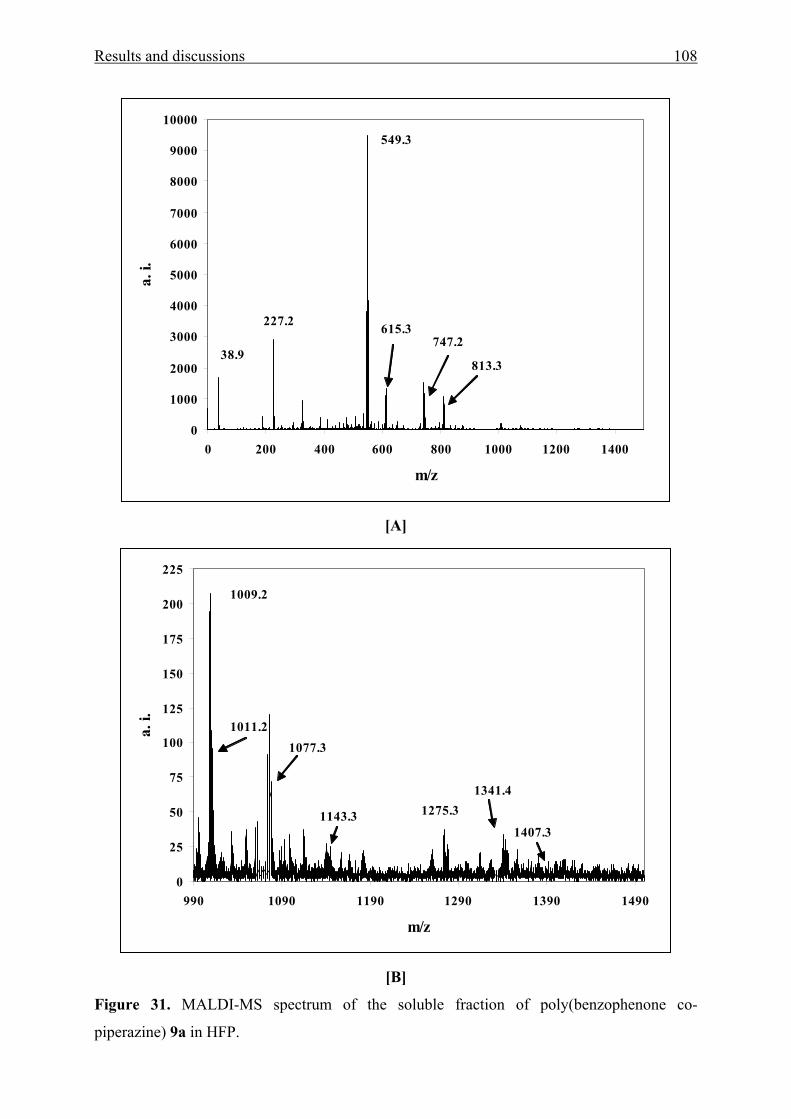
Results and discussions 108
0
1000
2000
3000
4000
5000
6000
7000
8000
9000
10000
0 200 400 600 800 1000 1200 1400
m/z
a. i.
38.9
227.2
549.3
615.3747.2
813.3
[A]
0
25
50
75
100
125
150
175
200
225
990 1090 1190 1290 1390 1490
m/z
a. i. 1011.2
1009.2
1077.3
1143.3 1275.3
1407.3
1341.4
[B]
Figure 31. MALDI-MS spectrum of the soluble fraction of poly(benzophenone co-
piperazine) 9a in HFP.
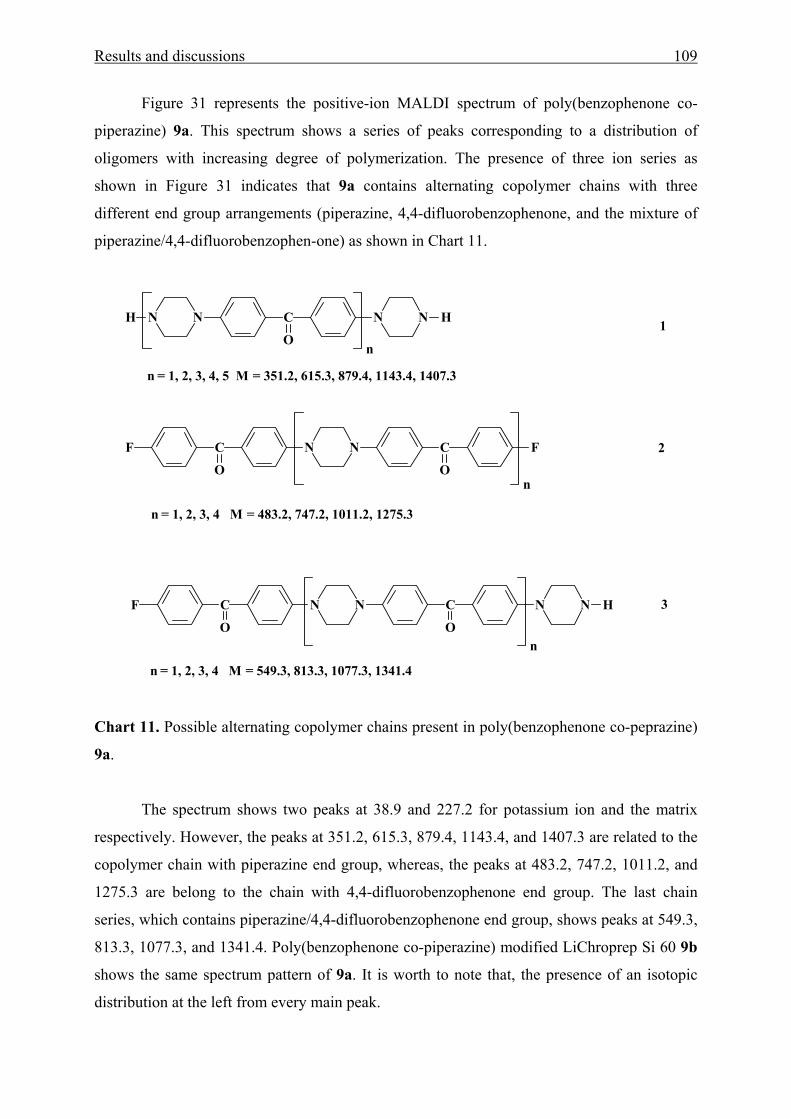
Results and discussions 109
Figure 31 represents the positive-ion MALDI spectrum of poly(benzophenone co-
piperazine) 9a. This spectrum shows a series of peaks corresponding to a distribution of
oligomers with increasing degree of polymerization. The presence of three ion series as
shown in Figure 31 indicates that 9a contains alternating copolymer chains with three
different end group arrangements (piperazine, 4,4-difluorobenzophenone, and the mixture of
piperazine/4,4-difluorobenzophen-one) as shown in Chart 11.
N N C
O
N NH H
F C
O
N N C
O
F
F C
O
N N C
O
N N H
n
n
1
2
3
n = 1, 2, 3, 4, 5 M = 351.2, 615.3, 879.4, 1143.4, 1407.3
n = 1, 2, 3, 4 M = 483.2, 747.2, 1011.2, 1275.3
n = 1, 2, 3, 4 M = 549.3, 813.3, 1077.3, 1341.4
n
Chart 11. Possible alternating copolymer chains present in poly(benzophenone co-peprazine)
9a.
The spectrum shows two peaks at 38.9 and 227.2 for potassium ion and the matrix
respectively. However, the peaks at 351.2, 615.3, 879.4, 1143.4, and 1407.3 are related to the
copolymer chain with piperazine end group, whereas, the peaks at 483.2, 747.2, 1011.2, and
1275.3 are belong to the chain with 4,4-difluorobenzophenone end group. The last chain
series, which contains piperazine/4,4-difluorobenzophenone end group, shows peaks at 549.3,
813.3, 1077.3, and 1341.4. Poly(benzophenone co-piperazine) modified LiChroprep Si 60 9b
shows the same spectrum pattern of 9a. It is worth to note that, the presence of an isotopic
distribution at the left from every main peak.
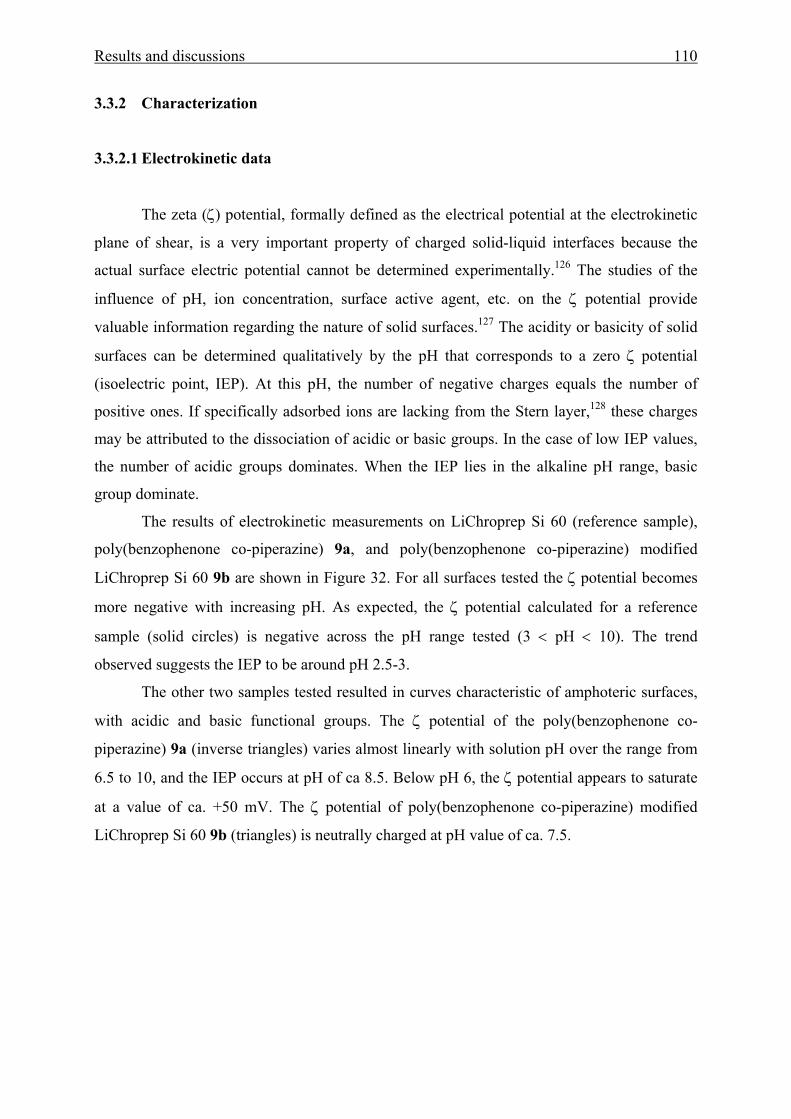
Results and discussions 110
3.3.2 Characterization
3.3.2.1 Electrokinetic data
The zeta (ζ) potential, formally defined as the electrical potential at the electrokinetic
plane of shear, is a very important property of charged solid-liquid interfaces because the
actual surface electric potential cannot be determined experimentally.126 The studies of the
influence of pH, ion concentration, surface active agent, etc. on the ζ potential provide
valuable information regarding the nature of solid surfaces.127 The acidity or basicity of solid
surfaces can be determined qualitatively by the pH that corresponds to a zero ζ potential
(isoelectric point, IEP). At this pH, the number of negative charges equals the number of
positive ones. If specifically adsorbed ions are lacking from the Stern layer,128 these charges
may be attributed to the dissociation of acidic or basic groups. In the case of low IEP values,
the number of acidic groups dominates. When the IEP lies in the alkaline pH range, basic
group dominate.
The results of electrokinetic measurements on LiChroprep Si 60 (reference sample),
poly(benzophenone co-piperazine) 9a, and poly(benzophenone co-piperazine) modified
LiChroprep Si 60 9b are shown in Figure 32. For all surfaces tested the ζ potential becomes
more negative with increasing pH. As expected, the ζ potential calculated for a reference
sample (solid circles) is negative across the pH range tested (3 < pH < 10). The trend
observed suggests the IEP to be around pH 2.5-3.
The other two samples tested resulted in curves characteristic of amphoteric surfaces,
with acidic and basic functional groups. The ζ potential of the poly(benzophenone co-
piperazine) 9a (inverse triangles) varies almost linearly with solution pH over the range from
6.5 to 10, and the IEP occurs at pH of ca 8.5. Below pH 6, the ζ potential appears to saturate
at a value of ca. +50 mV. The ζ potential of poly(benzophenone co-piperazine) modified
LiChroprep Si 60 9b (triangles) is neutrally charged at pH value of ca. 7.5.
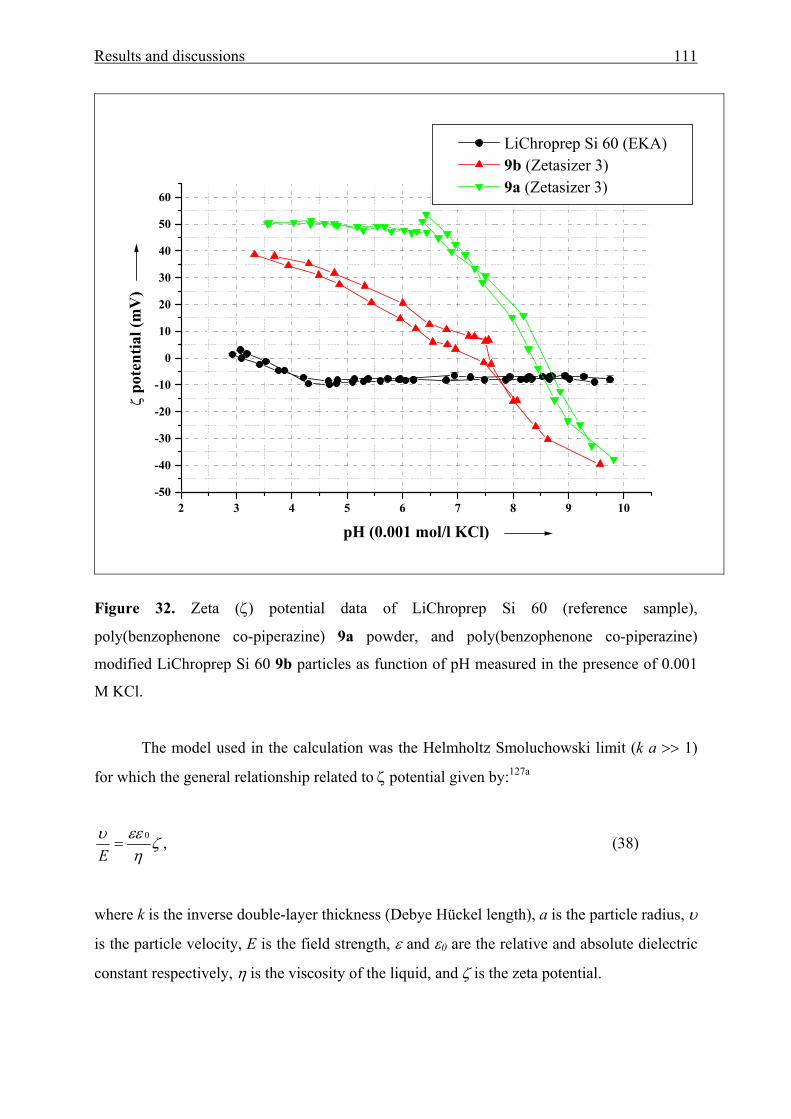
Results and discussions 111
2 3 4 5 6 7 8 9 10-50
-40
-30
-20
-10
0
10
20
30
40
50
60
LiChroprep Si 60 (EKA) 9b (Zetasizer 3) 9a (Zetasizer 3)
ζ po
tent
ial (
mV
)
pH (0.001 mol/l KCl)
Figure 32. Zeta (ζ) potential data of LiChroprep Si 60 (reference sample),
poly(benzophenone co-piperazine) 9a powder, and poly(benzophenone co-piperazine)
modified LiChroprep Si 60 9b particles as function of pH measured in the presence of 0.001
M KCl.
The model used in the calculation was the Helmholtz Smoluchowski limit (k a >> 1)
for which the general relationship related to ζ potential given by:127a
,0 ζη
εευ=
E (38)
where k is the inverse double-layer thickness (Debye Hückel length), a is the particle radius, υ
is the particle velocity, E is the field strength, ε and ε0 are the relative and absolute dielectric
constant respectively, η is the viscosity of the liquid, and ζ is the zeta potential.
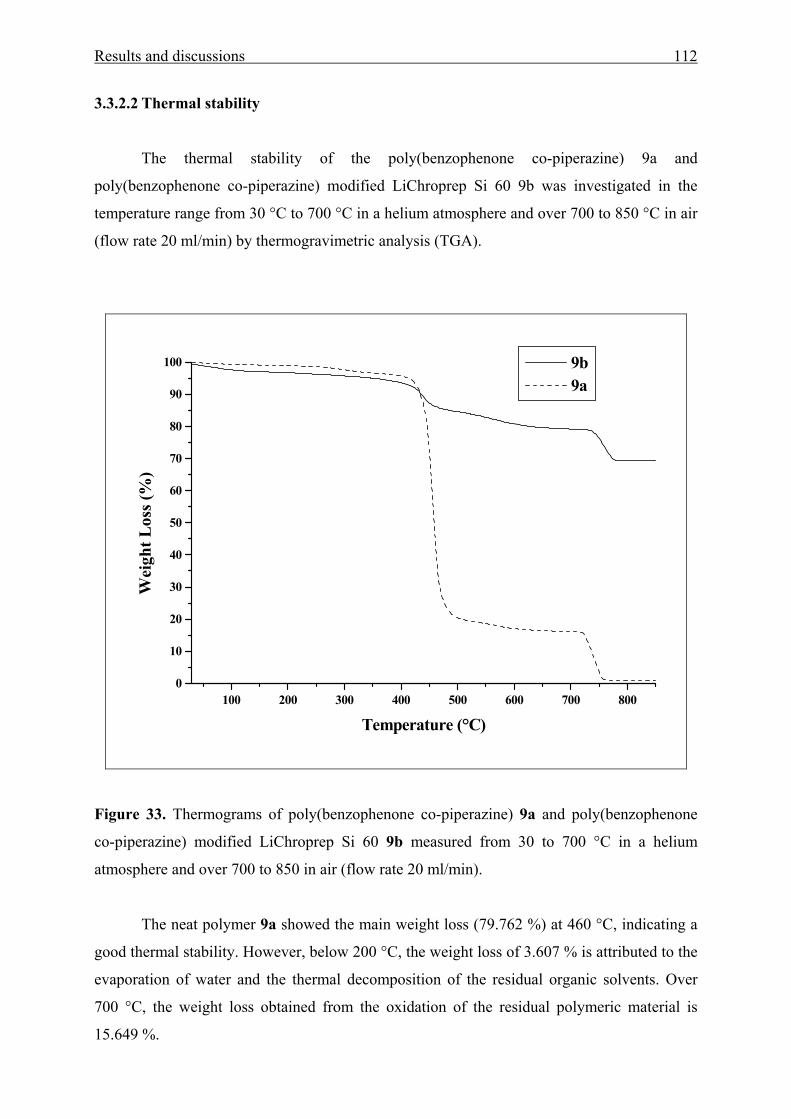
Results and discussions 112
3.3.2.2 Thermal stability
The thermal stability of the poly(benzophenone co-piperazine) 9a and
poly(benzophenone co-piperazine) modified LiChroprep Si 60 9b was investigated in the
temperature range from 30 °C to 700 °C in a helium atmosphere and over 700 to 850 °C in air
(flow rate 20 ml/min) by thermogravimetric analysis (TGA).
100 200 300 400 500 600 700 8000
10
20
30
40
50
60
70
80
90
100 9b 9a
Wei
ght L
oss (
%)
Temperature (°C)
Figure 33. Thermograms of poly(benzophenone co-piperazine) 9a and poly(benzophenone
co-piperazine) modified LiChroprep Si 60 9b measured from 30 to 700 °C in a helium
atmosphere and over 700 to 850 in air (flow rate 20 ml/min).
The neat polymer 9a showed the main weight loss (79.762 %) at 460 °C, indicating a
good thermal stability. However, below 200 °C, the weight loss of 3.607 % is attributed to the
evaporation of water and the thermal decomposition of the residual organic solvents. Over
700 °C, the weight loss obtained from the oxidation of the residual polymeric material is
15.649 %.
Results and discussions 113
Figure 33 shows also the TGA curve of the powder 9b. The weight loss occurs at four
stages, namely, below 200 °C, between 200 and 455 °C, from 455 °C to 700 °C, and between
700 and 750°C (switch to air). Below 200 °C, therefore, the weight loss (3.081 %) is
considered to be due to the evaporation of water and the volatilization and the thermal
decomposition of the remnant of organic solvents. Between 200 and 455 °C, the weight loss
(12.283 %) is attributed to the carbonization or the decomposition of the organic polymer, that
is to say, this weight reduction is due to the loss of carbon, hydrogen, nitrogen, and oxygen.
Between 455 and 700 °C, the weight losses (5.709 %) are probably ascribed to the
further decomposition of the organic polymer. From 700 to 750°C, the weight loss (9.749 %)
is attributed to combustion (air oxidation) of the residual organic polymer, which entrapped or
covalently bonded to the surface of LiChroprep Si 60. As there is no major weight loss
afterwards, it can be considered that, for the powdered sample, the organic polymer has been
completely burnt off. Calculation of the weight loss for every stage with respect to the total
weight loss (30.759 %) for the composite polymer give a weight losses of 9.81, 39.93, 18.56,
and 31.69 % for the previous four stages. Thermal analysis results therefore indicated that this
composite polymer has good thermal stability and the LiChroprep Si 60 enhances this
stability.
Thermally induced phase transition behavior of poly(benzophenone co-piperazine) 9a
was investigated with differential scanning calorimetry (DSC) in a nitrogen atmosphere. DSC
thermogram of 9a obtained with a higher sensitivity is reproduced in Figure 34.
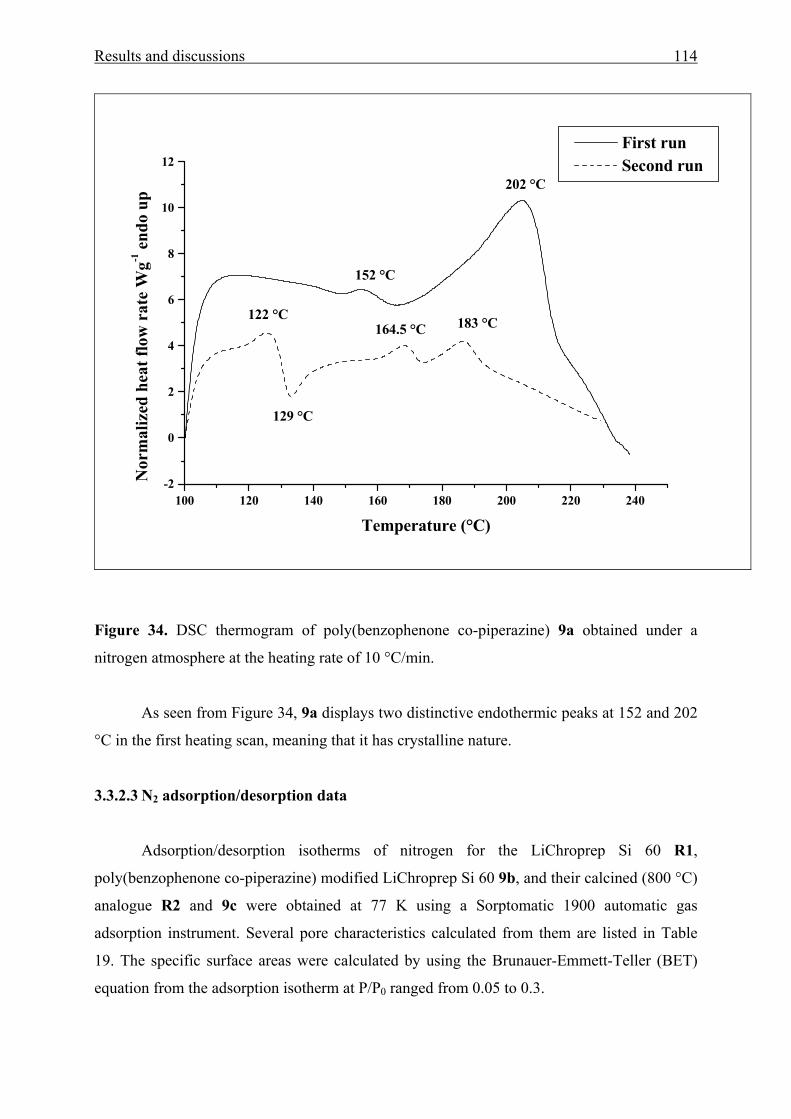
Results and discussions 114
100 120 140 160 180 200 220 240-2
0
2
4
6
8
10
12
183 °C
202 °C
164.5 °C
152 °C
129 °C
122 °C
First run Second run
Nor
mal
ized
hea
t flo
w r
ate
Wg-1
end
o up
Temperature (°C)
Figure 34. DSC thermogram of poly(benzophenone co-piperazine) 9a obtained under a
nitrogen atmosphere at the heating rate of 10 °C/min.
As seen from Figure 34, 9a displays two distinctive endothermic peaks at 152 and 202
°C in the first heating scan, meaning that it has crystalline nature.
3.3.2.3 N2 adsorption/desorption data
Adsorption/desorption isotherms of nitrogen for the LiChroprep Si 60 R1,
poly(benzophenone co-piperazine) modified LiChroprep Si 60 9b, and their calcined (800 °C)
analogue R2 and 9c were obtained at 77 K using a Sorptomatic 1900 automatic gas
adsorption instrument. Several pore characteristics calculated from them are listed in Table
19. The specific surface areas were calculated by using the Brunauer-Emmett-Teller (BET)
equation from the adsorption isotherm at P/P0 ranged from 0.05 to 0.3.
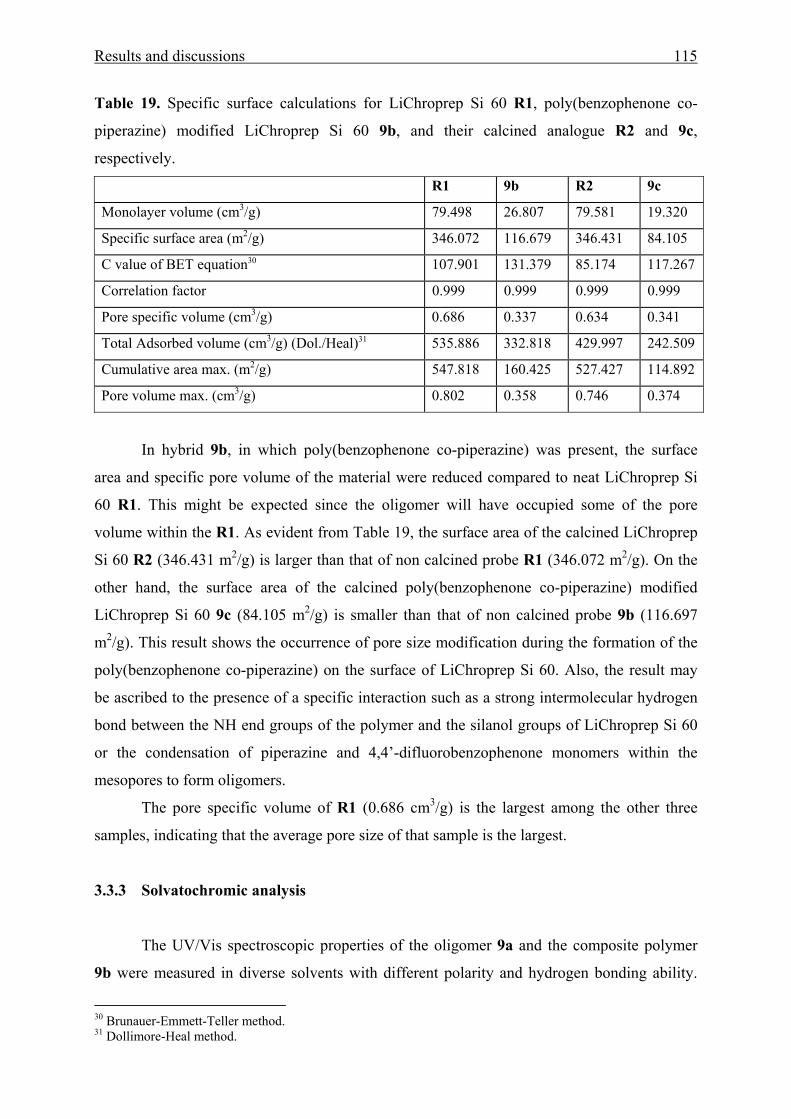
Results and discussions 115
Table 19. Specific surface calculations for LiChroprep Si 60 R1, poly(benzophenone co-
piperazine) modified LiChroprep Si 60 9b, and their calcined analogue R2 and 9c,
respectively.
In hybrid 9b, in which poly(benzophenone co-piperazine) was present, the surface
area and specific pore volume of the material were reduced compared to neat LiChroprep Si
60 R1. This might be expected since the oligomer will have occupied some of the pore
volume within the R1. As evident from Table 19, the surface area of the calcined LiChroprep
Si 60 R2 (346.431 m2/g) is larger than that of non calcined probe R1 (346.072 m2/g). On the
other hand, the surface area of the calcined poly(benzophenone co-piperazine) modified
LiChroprep Si 60 9c (84.105 m2/g) is smaller than that of non calcined probe 9b (116.697
m2/g). This result shows the occurrence of pore size modification during the formation of the
poly(benzophenone co-piperazine) on the surface of LiChroprep Si 60. Also, the result may
be ascribed to the presence of a specific interaction such as a strong intermolecular hydrogen
bond between the NH end groups of the polymer and the silanol groups of LiChroprep Si 60
or the condensation of piperazine and 4,4’-difluorobenzophenone monomers within the
mesopores to form oligomers.
The pore specific volume of R1 (0.686 cm3/g) is the largest among the other three
samples, indicating that the average pore size of that sample is the largest.
3.3.3 Solvatochromic analysis
The UV/Vis spectroscopic properties of the oligomer 9a and the composite polymer
9b were measured in diverse solvents with different polarity and hydrogen bonding ability.
30 Brunauer-Emmett-Teller method. 31 Dollimore-Heal method.
R1 9b R2 9c
Monolayer volume (cm3/g) 79.498 26.807 79.581 19.320
Specific surface area (m2/g) 346.072 116.679 346.431 84.105
C value of BET equation30 107.901 131.379 85.174 117.267
Correlation factor 0.999 0.999 0.999 0.999
Pore specific volume (cm3/g) 0.686 0.337 0.634 0.341
Total Adsorbed volume (cm3/g) (Dol./Heal)31 535.886 332.818 429.997 242.509
Cumulative area max. (m2/g) 547.818 160.425 527.427 114.892
Pore volume max. (cm3/g) 0.802 0.358 0.746 0.374
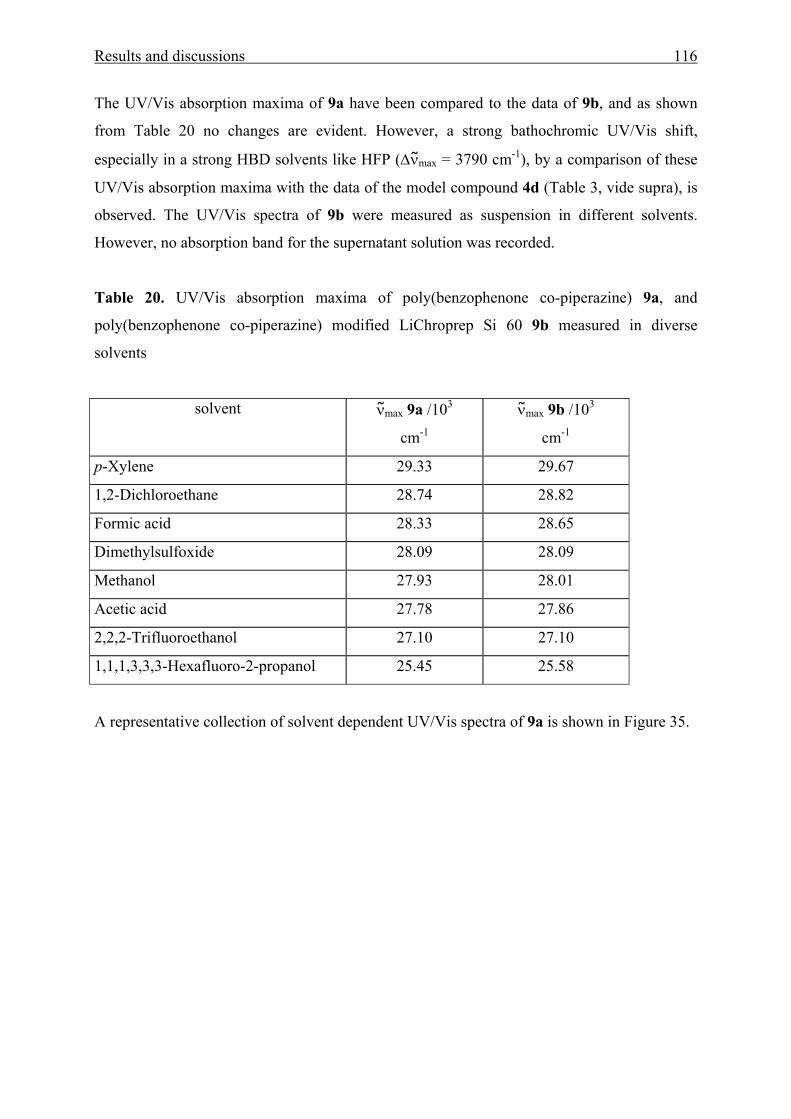
Results and discussions 116
The UV/Vis absorption maxima of 9a have been compared to the data of 9b, and as shown
from Table 20 no changes are evident. However, a strong bathochromic UV/Vis shift,
especially in a strong HBD solvents like HFP (∆ν max = 3790 cm-1), by a comparison of these
UV/Vis absorption maxima with the data of the model compound 4d (Table 3, vide supra), is
observed. The UV/Vis spectra of 9b were measured as suspension in different solvents.
However, no absorption band for the supernatant solution was recorded.
Table 20. UV/Vis absorption maxima of poly(benzophenone co-piperazine) 9a, and
poly(benzophenone co-piperazine) modified LiChroprep Si 60 9b measured in diverse
solvents
solvent νmax 9a /103
cm-1
νmax 9b /103
cm-1
p-Xylene 29.33 29.67
1,2-Dichloroethane 28.74 28.82
Formic acid 28.33 28.65
Dimethylsulfoxide 28.09 28.09
Methanol 27.93 28.01
Acetic acid 27.78 27.86
2,2,2-Trifluoroethanol 27.10 27.10
1,1,1,3,3,3-Hexafluoro-2-propanol 25.45 25.58
A representative collection of solvent dependent UV/Vis spectra of 9a is shown in Figure 35.
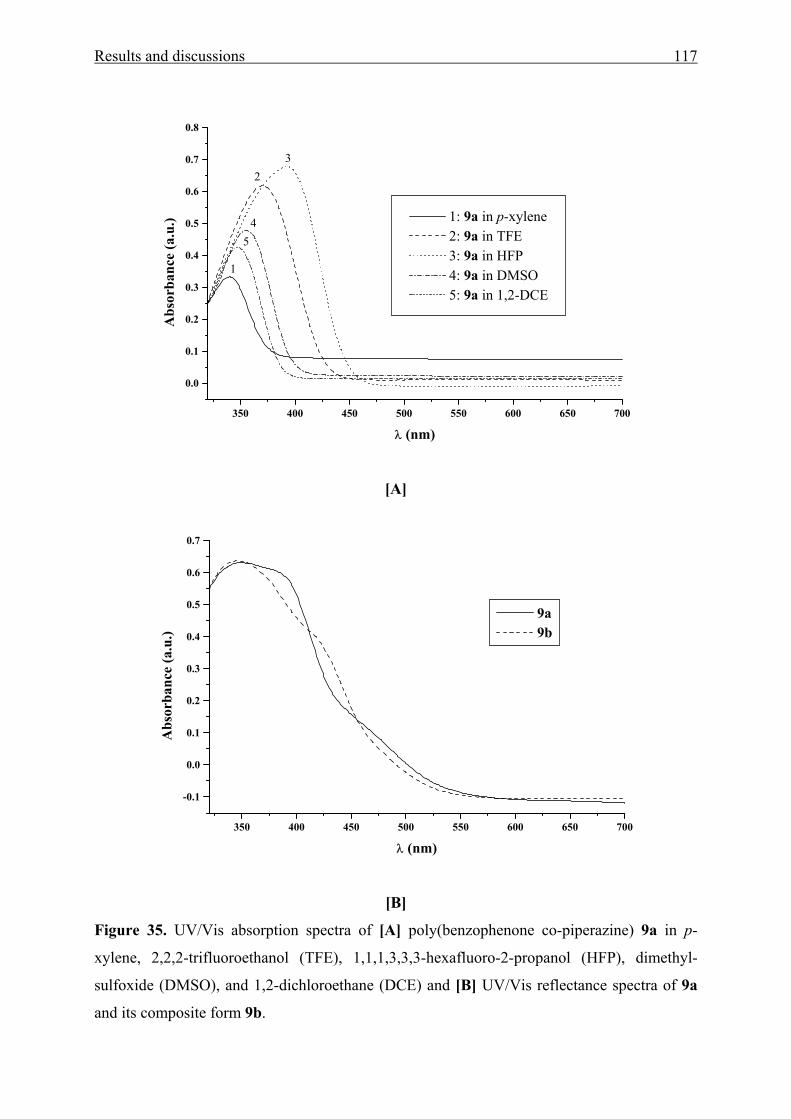
Results and discussions 117
350 400 450 500 550 600 650 700
0.0
0.1
0.2
0.3
0.4
0.5
0.6
0.7
0.8
23
45
1
1: 9a in p-xylene 2: 9a in TFE 3: 9a in HFP 4: 9a in DMSO 5: 9a in 1,2-DCE
Abs
orba
nce
(a.u
.)
λ (nm)
[A]
350 400 450 500 550 600 650 700
-0.1
0.0
0.1
0.2
0.3
0.4
0.5
0.6
0.7
9a 9b
Abs
orba
nce
(a.u
.)
λ (nm)
[B]
Figure 35. UV/Vis absorption spectra of [A] poly(benzophenone co-piperazine) 9a in p-
xylene, 2,2,2-trifluoroethanol (TFE), 1,1,1,3,3,3-hexafluoro-2-propanol (HFP), dimethyl-
sulfoxide (DMSO), and 1,2-dichloroethane (DCE) and [B] UV/Vis reflectance spectra of 9a
and its composite form 9b.
Results and discussions 118
With increasing solvent polarity from p-xylene to HFP, the UV/Vis spectrum of 9a
shows a bathochromic shift of the solvatochromic long-wavelength UV/Vis band (Table 20
and Fig. 35A). The solvatochromic effect of 9a shows that the long-wavelength UV/Vis
absorption maximum ranges from λ = 341 nm in p-xylene to 393 nm in HFP, corresponding
to ∆λ = 52 nm (∆ν =4080 cm-1) stabilization energy between these two solvents of extremely
different polarity.
As shown from Figure 35B, the diffuse reflectance spectra of 9a and 9b powders
revealed two absorption maxima at λmax = 349 and 346 nm respectively. The 9a powder
shows a broad UV/Vis absorption section in the diffuse reflectance spectrum.
The measured νmax data for 9a and 9b were fitted by multiple regression in order to evaluate
the respective contributions of the nonspecific and specific, intermolecular forces to the
overall interaction between 9a or 9b and solvent molecules.
νmax *10-3 [9a] = 30.60 – 2.58 π* - 1.34 α + 0.54 β (39)
n = 8 r = 0.90 SD = 0.68 F = 0.0641
νmax *10-3 [9b] = 31.18 – 3.17 π* - 1.39 α + 0.53 β (40)
n = 8 r = 0.90 SD = 0.72 F = 0.0684
νmax *10-3 [9a] = 30.61 – 2.29 π* - 1.39 α (41)
n = 8 r = 0.89 SD = 0.63 F = 0.0195
νmax *10-3 [9b] = 31.18 – 2.89 π* - 1.44 α (42)
n = 8 r = 0.89 SD = 0.67 F = 0.0206
It is also worth to notice that coefficient a is significantly larger than the coefficient b
in the calculated equations 39 and 40. The significance is improved by ignoring parameter α
in the correlation analysis (eq. 41 and 42). This demonstrates that the ability of the solvent to
donate hydrogen bond is much stronger than the ability to accept hydrogen bond. However, in
the case of MK(pipaz)2 4d, the value of a is smaller than the b value and it can be ignored
from the correlation analysis (Table 5 and eq. 15). This result can be explained in terms of the
presence of the more basic secondary nitrogen atom in 4d which enhances the through space
interaction as discussed in Scheme 2 (vide supra).
Summary 119
IV Summary
This work is divided into three parts. The first part deals with the synthesis of novel
functionalized aromatic amino ketones containing bis-(hydroxyethyl)amino substituent using
three types of reactions including Friedel Craft acylation, aromatic nucleophilic substitution,
and aldol-crotonic condensation reactions. The environmental effects (solvent, solid surfaces,
sol-gel glasses and neighboring molecules in the crystal) on their UV/Vis spectra were
investigated in the second part. From these studies, a large amount of information concerning
the polarity of the solid surfaces, the substituent-effect in aromatic amino ketones on the
solvent polarity parameters, the intermolecular hydrogen bonding in solid crystals and in their
solutions, and the nature of the guest-host interactions have been obtained.
Two different processes based on nucleophilic substitution reactions for synthesis of
poly(benzophenone co-piperazine) were reported in the third part of this thesis. The structure
of this polymer had to be elucidated by spectroscopic methods (FT-IR, solid-state-NMR,
UV/Vis spectroscopy, and MALDI-mass spectroscopy).
Hydrophilically substituted derivatives of Michler’s ketone, MK(OH)2 and MK(OH)4, were
obtained through successive replacement of the dimethylamino groups by (HOCH2CH2)2N
groups. The solvatochromism of these new MK derivatives is slightly modified compared
with MK.
The influence of hydrophilic functionalities as substituents at the periphery of
heterocyclic aromatic aminoketones like Fur(OH)2 or Thi(OH)2 has been successfully studied
to achieve information on aggregation versus solvatochromic properties of polar compounds.
In organic solvents and Ormosil glasses single molecule solvation is observed. This can be
well explained in terms of empirically derived LSE relationship using the Kamlet-Taft
solvents parameter set. Depending on the nature of the aromatic moiety, 4-
(dimethylamino)phenyl, furan, or thiophene, significantly differences in the solid-state
structures and solvatochromic properties are observed which are attributed to the modified
HBD capacity of the –N(CH2CH2OH)2 group and their ability to interact with other species.
In increasing the HBD capacity of the –N(CH2CH2OH)2 substituent, indicated by an increase
of the b coefficient of the Kamlet-Taft LSErs from 4-(dimethylamino)phenyl < 2-furyl < 2-
thienyl, a bathochromic shift of the solvatochromic and crystallochromic long wave UV/Vis
π-π* transition is monitored.
Also, the influence of polar, HBD, and HBA functionalities (e.g. morpholino,
piperidino, piperazino, and N-substituted piperazines) as para-substituents at the peripheries
Summary 120
of aromatic amino ketones of Michler’s ketone type, and also of a piperazino-bridged diketo
derivative, have been studied and have provided detailed information on the solvatochromic
properties of polar compounds in relation to structural features. The influence of the solvent
on the position of the solvatochromic UV/Vis depends on the nature (polarity, basicity, and
steric requirements) of the (+ M) substituent. The stronger the (+ M) effect of the substituent,
the larger the extent of the solvatochromic effect induced by the HBD capacity of the solvent.
The introduction of basic moieties such as piperazine causes a worsening of the LSE
relationships, due to competing acid-base interactions. This sometimes makes interpretation
of the solvatochromism ambiguous.
The interaction of a solvatochromic probe with a surface environment in a solvent can
be well measured by the UV/Vis shift of the adsorbed polarity indicator when adsorbed on
silica in transparent slurries. The quantitative adsorption of the probe dye requires specific
conditions because the solvent competes with the probe. Therefore, unambiguously
measurable UV/Vis absorption maxima of the adsorbed probe cannot be measured for each
solvent used. It seems that a basic requirement is that the probe should be less basic than the
solvent used for the silica slurry. Also, care must be taken to avoid overloading the surface
with the indicator used, as multi-layer adsorption is expected in solution at higher
concentrations as well as interfering absorption from the non-adsorbed probe from the
solution. Acid-base interactions between the probe and the silica surface predominate as
shown by the correlation analyses of νmax (probe) measured at the solvent/Aerosil 300
interface with the Kamlet-Taft solvents parameter set.
Aromatic amino ketones MK(OH)2, Fur(OH)2, Thi(OH)2, MK(OH)4, and MK are a
suitable probes to study the polarity inside Ormosil cages. The results demonstrate that the
polarity varies inside Ormosils as a function of the ratio of MTMOS to TMOS. Furthermore,
the polarity observed by these entrapped ketones is more sensitive to alcohols in their
surrounding than the polarity of solvatochromic probes themselves in alkanols. Therefore,
these specific analyte results in an optical modulation of the probes by encapsulating probe
molecules in a sol-gel host presents itself as viable method for optical chemical sensors.
The synthesis and characterization of novel silica hybrids based on functionalized bis-
(hydroxyethyl)amino aromatic ketones have been reported. The solvatochromic aromatic
amino ketone –attached sol-gel monomers 8(a-c) were homo- and copolymerized with TEOS
Summary 121
by hydrolysis and polycondensation in the presence of acidified water (pH = 3). There was no
identifiable evidence of any unreacted 8a, 8b, or 8c (T0), indicating that all the triethoxysilyl
functional chromophore 8a, 8b, or 8c has been bonded to the matrix.
Salicylidene-anile HDBN, which consider also as a related compound to aromatic
amino ketones has been used as a model for investigating intra- and intermolecular D-A
(donor-acceptor) interactions in various environments by means of UV/Vis spectroscopy. The
introduction of hydrophobic and hydrophilic functionalities at the periphery of salicylidene-
aniles are expected to change solid-state structures in relation to UV/Vis absorption
properties, which makes this kind of compound promising for investigating chromophores in
terms of environmental effects relating to optical properties for application.
HDBN reflects environment influences by manifold shifts of its absorption band in the
UV/Vis spectrum. The LSE analyses show that dipolar interactions preferably contribute to
the environmentally induced color changes. Genuine solvatochromism is suppressed if mobile
protons co-interact with the dimethylamino group. This is observed in acidic aqueous media
and in sol-gel glasses. Hydroxide ions attack the 2’-hydroxy group which causes a
bathochromic shift. The intense red color of the HBDN crystal is attributed to intermolecular
interactions of the oppositely arranged dipolar molecules in the solid-state. The X-ray crystal
structures of aromatic amino ketones 2(a-c) have been determined, to learn how the influence
and control lattice hydroxy group hydrogen bonding using crystal engineering ideas. Hydroxy
group hydrogen bonding results in formation of a network helical arrays of Fur(OH)2
molecules 2b.
The crystallographic structure analysis of MK(OH)2, Fur(OH)2, Thi(OH)2, BBP, and
HDBN and their solid powder UV/Vis reflectance spectra are in accord with the proposed
solvation mechanism. If the crystals of the compounds studied are densely packed, then a new
UV/Vis band at about λ = 450 nm is observed. These effects are perhaps attributable to charge
transfer transitions due to π stacking and induced dipole-dipole interactions. These results
merit deeper theoretical and extended optical studies.
Poly(benzophenone co-piperazine) oligomer contains alternating copolymer chains
with three different end groups (piperazine, 4,4’-difluorobenzophenone, and the mixture of
piperazine/4,4’-difluorobenzophenone). LiChroprep Si 60 in the synthetic composite 9b does
not interact strongly, nor do the polymer chains change their conformational arrangement,
even though the carbonyl feels a different environment. Thermal analysis results of 9a and 9b
Summary 122
indicated that 9b has good thermal stability and the LiChroprep Si 60 enhances this stability.
The UV/Vis spectroscopic properties of the oligomer 9a and the composite polymer 9b were
measured in diverse solvents with different polarity and hydrogen bonding ability. The
UV/Vis absorption maxima of 9a have been compared to the data of 9b, and no changes are
evident.
Experimental section 123
V Experimental section
5.1 General considerations
5.1.1 Instruments
UV/Vis-spectroscopy
UV/Vis spectrometer MCS 400 diode-array spectrometer from Carl Zeiss Jena,
connected with an immersion cell (TSM 5) via glass-fiber optics. A diffuse reflectance
accessory was attached to the spectrometer for diffuse reflectance measurements, which were
carried out with properly characterized crystalline powdered samples using BaSO4 powder as
a reference.
IR-spectroscopy
The FT-IR spectra were recorded at room temperature in the wave number range from
400 to 4000 cm-1 with a resolution of 1 cm-1 using a Perkin-Elmer Fourier transform 1000
spectrometer. The samples LiChroprep Si 60, 9a and 9b were analyzed by the transmission
technique. A sample concentration of 5 % in desiccated KBr was used.
Nuclear magnetic resonance (NMR)-spectroscopy
Varian Gemini 300 FT NMR spectrometer, operating at 300 MHz for 1H and 75 MHz
for 13C. The signals of solvents (CDCl3, CD3OD, or DMSO-d6) were used as internal
standards. All measurements were made at 20 °C. All data are given as: chemical shift δ
[ppm] (multiplicity, coupling constant J, integration, correlated protons) for 1H-NMR and
chemical shift δ [ppm] (correlated carbons) for 13C-NMR.
Solid-state NMR-spectroscopy
Cross-polarization (CP) magic angle spinning (MAS) solid-state 13C and 29Si NMR
spectra were performed on the solid SiO2 xerogels using a Bruker Model Avance-400 Digital
NMR spectrometer, whose 1H, 13C, and 29Si resonance frequencies were 400.13, 100.62, and
Experimental section 124
79.49 MHz, respectively. For the CP spectra, a 5 ms contact time was applied. A MAS Bruker
probe was used with 7 mm ZrO2 rotors, and the spinning speed was set to 6 kHz for 29Si and
10 kHz for 13C. Experiments were run collecting 1000-10000 scans. Chemical shifts are given
as δ from the external polydimethylsilane (PDMS) standard.
Mass spectrometry
ESI-MS spectra were obtained with a Mariner system 5229 spectrometer (Applied
Biosystems) and the EI-MS spectrum with a MAT 95XL.
MALDI-MS analysis
All MALDI-MS were acquired using a Bruker “Biflex III”, MALDI-TOF mass
spectrometer. The instrument is equipped with a N2 laser emitting at 337 nm. All spectra were
recorded in the reflection mode with an acceleration potential of 20 kV and a reflection
potential of 26 kV. Each spectrum is a sum of 100 shots, unless otherwise noted. Polymer
samples were dissolved in HFP at 10 mg/ml. The 1,8,9-trihydroxyanthracene (dithranol)
matrix solution was prepared by dissolving 30 mg in 1 ml of HFP. Matrix and polymer
solutions were mixed in a 10:1 ratio. One to two microliters of matrix/polymer solution was
deposited onto the sample target and air-dried.
Elemental analysis
C, H, N, S quantitative analyses were performed with a Vario-EL from the company
Elementaranalysen GmbH, Hanau.
Thermogravimetric analysis (TGA)
TGA of poly(benzophenone co-piperazine) modified LiChroprep Si 60 9b was
performed using a Perkin-Elmer PE PC Series TGA-7 thermogravimetric analyzer at a
heating rate of 20 °C/min.
Differential scanning calorimetry (DSC) measurements
Experimental section 125
DSC measurements were recorded using a Perkin-Elmer DSC-7 thermal analyzer, in
dry nitrogen atmosphere, with a temperature scanning rate of 10 °C/min. The DSC analyzer is
modified by equipment for program control and data acquisition (ifa GmbH Ulm, Germany).
Electrokinetic measurements
Electrophoresis measurements were performed with a Zetasizer 3 (Malvern, UK). The
velocity of the particles in an electric field of 150 V was measured by Laser Doppler
Anemometric using a He/Ne laser beam. The measuring fluid was a 0.001 M KCl solution
with different pH values between 3 and 10. A commercial Electrokinetic Analyser (EKA)
streaming potential measurement apparatus (Anton Paar KG, Graz, Austria) was used for
LiChroprep Si 60 (reference probe).
N2 adsorption/desorption measurement
N2 adsorption isotherms were measured at 77 K using a Sorptomatic 1900 automatic
gas adsorption apparatus. The pore-size distribution (PSD) was performed by the Dollimore-
Heal (DH) method from which the pore volume was calculated. The surface area was
obtained from the BET (Brunauer-Emmett-Teller) plot.
5.1.2 Working procedures
All experiments were carried out under an atmosphere of argon. Solvents for the
solvatochromic measurements were used as commercially available in the highest available
quality (analytical or spectroscopic grade) and were additionally dried and purified according
to the usual standard methods.1a, 129, 130
5.1.3 Correlation analysis
Multiple regression analysis was performed with the Origin 5.0 statistic programs.
5.1.4 Starting Materials
Experimental section 126
The reagents were of analytical grade and purchased from Lancaster, Aldrich and
Acros. Michler’s ketone was purchased from Merck (Darmstadt), recrystallized twice from
EtOH, and carefully dried before use. The Solvents were dried and distilled as usual. Merck
silica gel 60 (70-230 mesh ASTM) was used for column chromatography. As adsorbents,
Aerosil 300 (BET-surface area 240 m2g-1) was heated at 400 °C for 12 h. After cooling to
room temperature under dried argon, a solution of the probe dye in the corresponding solvent
(about 10-5 mol/dm3) was added to Aerosil 300. Care must be taken to avoid overloading the
surface with the dye used, as multilayer adsorption is expected in solution at higher
concentrations as well as interfering absorptions from the non-adsorbed dye from the solution.
Merck LiChroprep Si 60(40-63 µm) was used as a carrier in synthesis of poly(benzophenone
co-piperazine).
5.2 Synthetic part
5.2.1 Aromatic amino ketones by Friedel Craft acylation reaction
5.2.1.1 General procedure for preparation of 4-Dimethylamino-4’-[di(2-acetoxyethyl)amino]-
benzophenone MK(OAc)2 1a, [4-Di(2-acetoxyethyl)aminophenyl]-2-furylmethanone
Fur(OAc)2 1b, and [4-Di(2-acetoxyethyl)aminophenyl]-2-thienylmethanone Thi(OAc)2 1c
The synthesis of [di(2-acetoxyethyl)amino]benzene was previously described.131
A solution of 52.50 mmol of acid chloride [4-(dimethylamino)benzoyl chloride, 9.64 g, furyl-
2-carbonyl chloride, 6.85 g, 5.19 mL, or thienyl-2-carbonyl chloride, 7.33 g, 5.34 mL] in 30
mL of 1,2-dichloroethane was gradually added to a suspension of anhydrous AlCl3 (8.00 g, 60
mmol) in 20 mL 1,2-dichloroethane at 23 °C. The reaction mixture was Further stirred for 1 h
and then treated with a solution of [di(2-acetoxyethyl)amino]benzene (9.64 g, 50 mmol) in 20
mL 1,2-dichloroethane for 1 h at 23 °C and kept stirring for 4 h at the same temperature. Then
the reaction mixture was poured into water, acidified with 1 N HCl, and extracted with ethyl
acetate. The ethyl acetate extract was washed with water, dried over Na2SO4, and evaporated
under reduced pressure. The residue was purified by column chromatography on silica gel 60
with a mixture from ethyl acetate and n-hexane (2:1) as eluant, affording MK(OAc)2 1a,
Fur(OAc)2 1b, or Thi(OAc)2 1c.
5.2.1.2 4-Dimethylamino-4’-[di(2-acetoxyethyl)amino]benzophenone MK(OAc)2 1a
Experimental section 127
Yield ((10.91 g, 26.45 mmol, 53%), pale yellow viscous oil, C23H28N2O5 [412.20], MS
(EI) m/z (RA, %) 413 (M++1, 1.5), 412 (M+, 4), 339 (15), 148 (30), 106 (26), 87 (100), 45
(15), 43 (81); MS (ESI) 413.2 (M++1); 1H-NMR (CDCl3): δ 7.66 (dd, J = 9.06, 3.02 Hz, 4H,
ArH-2,6,2’,6’), 6.68 (d, J = 9.06 Hz, 2H, ArH-3,5), 6.56 (d, J = 9.06 Hz, 2H, ArH-3’,5’), 4.16
(t, J = 5.91 Hz, 4H, CH2-O), 3.59 (t, J = 5.91 Hz, 4H, CH2-N), 2.91 (s, 6H, N-CH3), 1.94 (s,
6H, C-CH3), 13C-NMR (CDCl3): δ 192.9 (C=O), 170.2 (C=O ester), 152.2 (ArC-4), 149.5
(ArC-4’), 131.7 (ArC-2,6), 131.6 (ArC-2’,6’), 126.2 (ArC-1), 125.2 (ArC-1’), 110.1 (ArC-
3,5), 109.9 (ArC-3’,5’), 60.7 (CH2-O), 49.1 (CH2-N), 39.6 (N-CH3), 20.4 (C-CH3).
5.2.1.3 [4-Di(2-acetoxyethyl)aminophenyl]-2-furylmethanone Fur(OAc)2 1b
Yield (8.62 g, 23.99 mmol, 48%), m.p. 72°C (ethyl acetate), pale-yellow crystals
(Found: C, 63.52; H, 5.75; N, 3.89. C19H21NO6 [359.14], calc. C, 63.51; H, 5.85; N, 3.90%); 1H-NMR (CDCl3): δ 8.04 (d, J = 9.16 Hz, 2H, ArH-2,6), 7.67 (s, 1H, FurH-5’), 7.22 (d, J =
3.48 Hz, 1H, FurH-3’), 6.82 (d, J = 9.16 Hz, 2H, ArH-3,5), 6.58 (dd, J = 3.48, 1.74 Hz, 1H,
FurH-4’), 4.30 (t, J = 6.16 Hz 4H, CH2-O), 3.73 (t, J = 6.16 Hz, 4H, CH2-N), 2.07 (s, 6H, C-
CH3); 13C-NMR (CDCl3): δ 180.8 (C=O), 171.2 (C=O ester), 153.5 (FurC-2’), 151.3 (ArC-4),
146.4 (FurC-5’), 132.5 (ArC-2,6), 126.0 (ArC-1), 119.1 (FurC-3’), 112.3 (FurC-4’), 111.3
(ArC-3,5), 61.4 (CH2-O), 49.9 (CH2-N), 21.2 (C-CH3).
5.2.1.4 [4-Di(2-acetoxyethyl)aminophenyl]-2-thienylmethanone Thi(OAc)2 1c
Yield (9.75 g, 25.97 mmol, 52%), green oil, (Found: C, 59.31; H, 5.64; N, 3.53; S,
8.66. C19H21NO5S [375.11], calc. C, 60.80; H, 5.60; N, 3.73; S, 8.53%); 1H-NMR (CDCl3): δ
7.90 (d, J = 9.16 Hz, 2H, ArH-2,6), 7.65 (d, J = 4.58 Hz, 2H, ThiH-3’,4’), 7.15 (t, J = 4,35 Hz,
1H, ThiH-5’), 6.82 (d, J = 9.16 Hz, 2H, ArH-3,5), 4.30 (t, J = 6.16 Hz 4H, CH2-O), 3.73 (t, J
= 6.16 Hz 4H, CH2-N), 2.07 (s, 6H, C-CH3); 13C-NMR (CDCl3): δ 186.5 (C=O), 171.3 (C=O
ester), 151.2 (ThiC-2’), 144.5 (ArC-4), 133.6 (ThiC-4’), 133.0 (ThC-5’), 132.4 (ArC-2,6),
128.0 (ThiC-3’), 126.8 (ArC-1), 111.3 (ArC-3,5), 61.5 (CH2-O), 50.0 (CH2-N), 21.2 (C-CH3).
5.2.1.5 General procedure for preparation of 4-Dimethylamino-4’-[di(2-hydroxyethyl)amino]-
benzophenone MK(OH)2 2a, [4-Di(2-hydroxyethyl)amino-phenyl]-2-furylmethanone
Fur(OH)2 2b, and [4-Di(2-hydroxyethyl)aminophenyl]-2-thienylmethanone Thi(OH)2 2c
Experimental section 128
4-(Dimethylamino)-4’-[di(acetoxyethyl)amino]benzophenone MK(OAc)2 (0.41 g, 1
mmol), [4-di(2-acetoxyethyl)aminophenyl]-2-furylmethanone Fur(OAc)2 (0.36 g, 1 mmol) or
[4-di(2-acetoxyethyl)aminophenyl]-2-thienylmethanone Thi(OAc)2 (0.38 g, 1 mmol) was
added to a solution of potassium carbonate (0.28 g, 2 mmol) dissolved in methanol and water
20 mL (1:1). The mixture was refluxed for 2 h at 80°C in a water bath. After cooling to room
temperature, the mixture was poured into ice water and neutralized with conc. HCl. The
precipitate was filtered off, washed with water, and crystallized from ethanol to give pure
compound 2a, 2b, or 2c.
5.2.1.6 4-Dimethylamino-4‘-[di(2-hydroxyethyl)amino]benzophenone MK(OH)2 2a
Yield (0.29 g, 0.88 mmol, 88%), m.p. 161-162°C as yellow needles. (Found: C, 69.40;
H, 7.42; N, 8.41; C19H24N2O3 [328.18], requires C, 69.49; H, 7.37; N, 8.53%); 1H-NMR
(CD3OD): δ 7.66 (dd, J = 9.06, 4.39 Hz, 4H, ArH-2,6,2’,6’), 6.81 (d, J = 9.06 Hz, 2H, ArH-
3,5), 6.76 (d, J = 9.06 Hz, 2H, ArH-3’,5’), 3.77 (t, J = 5.91 Hz, 4H, CH2-O), 3.65 (t, J = 5.91
Hz, 4H, CH2-N), 3.06 (s, 6H, N-CH3); 13C-NMR (CD3OD): δ 197.1 (C=O), 155.1 (ArC-4),
153.2 (ArC-4’), 134.0 (ArC-2,6), 133.8 (ArC-2’,6’), 127.2 (ArC-1), 122.3 (ArC-1’), 112.22
(ArC-3,5), 112.16 (ArC-3’,5’), 60.6 (CH2-O), 55.2 (CH2-N), 40.6 (N-CH3); MS (EI) m/z (RA,
%) 329 (M++1, 3), 328 (M+, 12.5), 298 (19), 297 (100), 148 (64), 132 (23), 45 (15), 43 (100),
31 (21); MS (ESI) 329.2 (M++1).
5.2.1.7 [4-Di(2-hydroxyethyl)aminophenyl]-2-furylmethanone Fur(OH)2 2b
Yield (0.23 g, 0.85 mmol, 85%), m.p. 94°C, yellow crystals (Found: C, 65.21; H, 6.16;
N, 5.07. C15H17NO4 [275.12], calculated: C, 65.45; H, 6.18; N, 5.09%); 1H-NMR (CD3OD): δ
7.97 (d, J = 9.32 Hz, 2H, ArH-2,6), 7.85 (dd, 1H, J = 1.74, 0.79 Hz FurH-5’), 7.29 (dd, J =
3.63, 0.79 Hz, 1H, FurH-3’), 6.86 (d, J = 9.32 Hz, 2H, ArH-3,5), 6.69 (dd, 3.63, 1.74 Hz, 1H,
FurH-4’), 3.80 (t, J = 6.16 Hz, 4H, CH2-O), 3.68 (t, J = 6.16 Hz, 4H, CH2-N); 13C-NMR
(CD3OD): δ 181.3 (C=O), 153.2 (FurC-2’), 152.7 (ArC-4), 147.0 (FurC-5’), 132.2 (ArC-2,6),
124.1 (ArC-1), 119.4 (FurC-3’), 112.1 (FurC-4’), 111.2 (ArC-3,5), 59.2 (CH2-O), 53.7 (CH2-
N).
5.2.1.8 [4-Di(2-hydroxyethyl)aminophenyl]-2-thienylmethanone Thi(OH)2 2c
Experimental section 129
Yield (0.26 g, 88%) , m.p. 101°C, canary-yellow crystals (Found: C, 61.69; H, 5.84;
N, 4.73; S, 11.32. C15H17NO3S [291.09], calculated: C, 61.86; H, 5.84; N, 4.81; S, 11.00%); 1H-NMR (CD3OD): δ 7.85 (d, J = 9.32 Hz, 2H, ArH-2,6), 7.71 (dd, J = 3.79, 1.1 Hz, 2H,
ThiH-3’,4’), 7.23 (dd, 3.79, 4.90 Hz, 1H, ThiH-5’), 6.87 (d, J = 9.32 Hz, 2H, ArH-3,5), 3.80
(t, J = 6.16 Hz, 4H, CH2-O), 3.68 (t, J = 6.16 Hz, 4H, CH2-N); 13C-NMR (CD3OD): δ 187.2
(C=O), 152.5 (ThiC-2’), 144.1 (ArC-4), 133.9 (ThiC-4’), 133.1 (ThiC-5’), 132.2 (ArC-2,6),
127.9 (ThiC-3’), 124.9 (ArC-1), 111.2 (ArC-3,5), 59.2 (CH2-O), 53.8 (CH2-N).
5.2.2 Aromatic amino ketones by nucleophilic aromatic substitution reaction
5.2.2.1 4,4’-Bis[di(2-hydroxyethyl)amino]benzophenone MK(OH)4 3
A mixture of 7.64 g (35 mmol) of 4,4’-difluorobenzophenone and 70.00 g (666 mmol)
of diethanolamine was stirred at 150-160 °C for 48 h. The resulting reaction mixture was
distilled under reduced pressure to remove the excess of diethanolamine. The residue was
purified by column chromatography on silica gel using a mixture of ethanol and ethyl acetate
(1:1), affording (3) (8.15 g, 21 mmol, 60%) as a pure yellow viscous oil; C21H28N2O5
[388.20], MS (DEI) m/z (RA, %) 388 (M+, 2), 357 (3.5), 208 (2.5), 180 (3), 132 (10.5), 61
(14.5), 45 (84), 43 (100), 31 (30); MS (ESI) 389.2 (M++1); 1H-NMR (CD3OD): δ 7.63 (d, J =
8.79 Hz, 4H, ArH-2,6,2’,6’), 6.78 (d, J = 8.79 Hz, 4H, ArH-3,5,3’,5’), 3.75 (t, J = 5.50 Hz,
8H, CH2-O), 3.62 (t, J = 5.50 Hz, 8H, CH2-N); 13C-NMR (CD3OD): δ 196.5 (C=O), 152.8
(ArC-4,4’), 133.6 (ArC-1,1’), 126.7 (ArC-2,6,2’,6’), 111.8 (ArC-3,5,3’,5’), 60.2 (CH2-O),
54.8 (CH2-N).
5.2.2.2 4,4’-Bis(4-ethoxycarbonylpiperazino)benzophenone MK(pipOEt)2 4a
4.36 g (20 mmol) of 4,4’-difluorobenzophenone and 12.66 g (80 mmol) of ethyl-N-
piperazine carboxylate was stirred at 140°C under argon for 40 h in 25 mL dimethylsulfoxide.
The resulted reaction mixture was poured into ice water. The crude material was filtered and
washed with water then crystallized from ethyl acetate to give 4a (5.93 g, 12 mmol, 60 %), m.
p. 158 as a slightly yellowish powder.
Found: C, 65.65; H, 6.84; N, 11.14; C27H34N4O5 [494.25], requires C, 65.57; H, 6.93; N,
11.33; 1H-NMR (CDCl3): δ 7.72 (d, J = 8.69 Hz, 4H, ArH-2,6,2’,6’), 6.88 (d, J = 8.69 Hz, 4H,
ArH-3,5,3’,5’), 4.16 (q, J = 7.11 Hz, 4H, COOCH2), 3.62 (t, J = 4.90 Hz, 8H, CH2NCOO),
Experimental section 130
3.30 (t, J = 4.90 Hz, 8H, CH2NPh), 1.27 (t, J = 7.11 Hz, 6H, CH3); 13C-NMR (CDCl3): δ
194.15 (C=O), 155.79 (C=O ester), 153.69 (ArC-4,4’), 132.36 (ArC-2,6,2’,6’), 129.27(ArC-
1,1’), 114.32 (ArC-3,5,3’,5’), 61.94 (OCH2), 48.00 (CH2NCOO), 43.63 (CH2NPh), 15.08
(CH3).
5.2.2.3 4,4’-Bis(piperidino)benzophenone MK(pip)2 4b
21.82 g (100 mmol) of 4,4’-difluorobenzophenone and 34.06 g (400 mmol) of
piperidine were refluxed at 140 °C under argon for 30 h in 100 mL tetramethylene sulphone.
After cooling to room temperature, the solution was poured onto cold water (2 dm3). The
resulting solid was filtered, washed thoroughly with 50 mL water, and dried under vacuum.
After crystallization from ethyl acetate, (22.62 g, 65 mmol, 65 %), m. p. 152 °C (lit.132 140-
142 °C from acetone) of a pale yellow solid crystals of MK(pip)2 4b was obtained.
Found: C, 79.19; H, 7.96; N, 7.96; C23H28N2O [348.22], requires C, 79.27; H, 8.10; N, 8.04; 1H-NMR (CDCl3): δ 7.76 (d, J = 8.69 Hz, 4H, ArH-2,6,2’,6’), 6.92 (d, J = 8.69 Hz, 4H, ArH-
3,5,3’,5’), 3.36 (t, J = 5.37 Hz, 8H, NCH2), 1.72 (m, 12H, NCH2CH2CH2), 1.27 (t, J = 7.11
Hz, 6H, CH3); 13C-NMR (CDCl3): δ 194.23 (C=O), 154.26 (ArC-4,4’), 132.46 (ArC-
2,6,2’,6’), 128.18(ArC-1,1’), 113.87 (ArC-3,5,3’,5’), 49.33 (NCH2), 25.84 (NCH2CH2), 24.77
(NCH2CH2CH2).
5.2.2.4 4,4’-Bis(morpholino)benzophenone MK(mor)2 4c
MK(mor)2 4c was prepared in a similar manner from 21.82 g (100 mmol) of 4,4’-
difluorobenzophenone and 34.85 g (400 mmol) of morpholine. After crystallization from
ethyl acetate at 50 °C, (28.16 g, 80 mmol, 80 %) , m. p. 171 °C (lit.132 162-164 °C from
ethanol) of cream needles from MK(mor)2 4c were obtained.
Found: C, 71.08; H, 6.68; N, 7.94; C21H24N2O3 [352.18], requires C, 71.57; H, 6.86; N, 7.95; 1H-NMR (CDCl3): δ 7.69 (d, J = 8.85 Hz, 4H, ArH-2,6,2’,6’), 6.82 (d, J = 8.85 Hz, 4H, ArH-
3,5,3’,5’), 3.79 (t, J = 4.90 Hz, 8H, OCH2), 3.23 (t, J = 4.90 Hz, 8H, NCH2); 13C-NMR
(CDCl3): δ 194.38 (C=O), 154.01 (ArC-4,4’), 132.39 (ArC-2,6,2’,6’), 129.38 (ArC-1,1’),
113.76 (ArC-3,5,3’,5’), 67.04 (OCH2), 48.24 (NCH2).
5.2.2.5 4,4’-Bis(piperazino)benzophenone MK(pipaz)2 4d
Experimental section 131
8.73 g (40 mmol) of 4,4’-difluorobenzophenone and 34.46 g (400 mol) of piperazine
in 50 mL dimethyl sulfoxide were stirred under argon at 140 °C for 40 h. After cooling to
room temperature, the mixture was poured into ice-water. The precipitate was filtered off ,
washed with water and crystallized at 70 °C from ethanol to give (7.35 g, 21 mmol, 52.5 %),
m. p. 170-172 °C of a pale yellow powder of MK(pipaz)2 4d; C21H26N4O [350.21], MS (EI),
m/z (relative abundance, %) 351 (M++1, 4), 350 (M+, 12), 308 (16), 256 (22), 129 (20), 97
(16), 83 (16), 73 (26), 57 (26), 45 (28), 31 (36); 1H-NMR (CD3OD): δ 7.74 (d, J = 9.00 Hz,
4H, ArH-2,6,2’,6’), 7.10 (d, J = 9.00 Hz, 4H, ArH-3,5,3’,5’), 3.62 (t, J = 5.21 Hz, 8H, NCH2),
3.31 (t, J = 5.21 Hz, 8H, CH2NH); 13C-NMR (CDCl3): δ 196.77 (C=O), 154.97 (ArC-4,4’),
133.54 (ArC-2,6,2’,6’), 130.76 (ArC-1,1’), 115.95 (ArC-3,5,3’,5’), 46.77 (NCH2), 44.80
(CH2NH).
5.2.2.6 4,4’-Bis[4-(2-hydroxyethyl)piperazino]benzophenone MK(pipazOH)2 4e
Piperazine-2-ethanol (6.51 g, 50 mmol) was added at 25 °C. to a mixture of
difluorobenzophenone (5.46 g, 25 mmol) and potassium carbonate (6.9 g, 50 mmol) in dry
dimethylsulfoxide (50 mL). After heating to 140 °C for 48 h, the solution was cooled to room
temperature, and poured into water(1 L). The precipitate was filtered off, and washed several
times with water, dried and recrystallized from ethanol to afford 4e; yield: 7.80 g (18 mmol,
71.2 %) as fine, pale yellow powder with m. p. 115-117 °C; C25H34N4O3 [438.26], MS (ESI),
m/z = 439 (M++1); 1H-NMR (DMSO-d6): δ 7.62 (d, J = 8.37 Hz, 4H, ArH-2,6,2’,6’), 7.00 (d,
J = 8.37 Hz, 4H, ArH-3,5,3’,5’), 3.60 (t, J = 5.5 Hz, 4H, CH2O), 3.28 (t, J = 5.5 Hz, 4H,
NCH2CH2O), 2.44-2.60 (m, 16H, NCH2CH2N); 13C-NMR (DMSO-d6): δ 192.67 (C=O),
153.59 (ArC-4,4’), 131.78 (ArC-2,6,2’,6’), 127.48 (ArC-1,1’), 115.51 (ArC-3,5,3’,5’), 60.56
(CH2O), 58.92 (CH2CH2O), 53.27 (NCH2), 46.87 (NCH2CH2NH).
5.2.2.7 1,4-Bis(4-benzoylphenyl)piperazine BBP 5
4-fluorobenzophenone (2.00 g, 10 mmol), potassium carbonate (1.38 g, 10 mmol), and
anhydrous piperazine (0.43 g, 5 mmol) in dimethylsulfoxide (20 mL) were heated at 140 °C
for 48 h. After cooling to room temperature, the crude reaction mixture is taken up in water
(400 mL) and the precipitate formed was filtered off, and washed several times with water,
dried and purified by column chromatography (silica gel, chloroform/ethyl acetate 2:1)
affording 5; yield: 1.78 g (4 mmol, 80.0 %) as yellow crystals with m.p. 213°C;
Experimental section 132
C30H26N2O2 [446.20], MS (ESI), m/z = 447 (M++1); 1H-NMR (CDCl3): δ 7.86 (d, J = 8.69
Hz, 4H, ArH-2,6,2’,6’), 7.78 (d, J = 8.69 Hz, 4H, ArH-8,12,8’,12’), 7.46-7.58 (m, 6H, ArH-
9,10,11,9’,10’,11’), 6.96 (d, J = 8.85 Hz, 4H, ArH-3,5,3’,5’), 3.60 (s, 8H, NCH2); 13C-NMR
(CDCl3): δ 195.57 (C=O), 153.74 (ArC-4,4’), 139.12 (ArC-1,1’), 132.96 (ArC-2,6,2’,6’),
131.98 (ArC-7,7’), 129.99 (ArC 8,12,8’,12’), 128.54 (ArC-9,11,9’,11’), 128.14 (ArC-10,10’),
113.74 (ArC-3,5,3’,5’), 47.38 (NCH2).
5.2.3 3-[4-Di(2-hydroxyethyl)amino]phenyl-1-(2-furyl)-2-propene-1-one [DAFP]
The synthesis of 4-formyl-4’-[di(2-acetoxyethyl)amino]benzene was previously
described.133
A mixture of 2-acetylfuran (1.10 g, 10 mmol), 4-formyl-4’-[di(2-acetoxyethyl)amino]-
benzene (2.93 g, 10 mmol) and 20 % aqueous sodium hydroxide (5 mL) in methanol (20 mL)
was stirred at room temperature for about 2 h. The resulting solid was washed with water (20
mL), dried and crystallized from ethanol affording DAFP 6; yield: 2.41 g (8 mmol, 80 %) as
orange crystals with m.p. 133-134 °C.
Found: C, 67.55; H, 6.29; N, 4.55; C17H19NO4 [301.13], requires C, 67.76; H, 6.36; N, 4.65; 1H-NMR (CD3OD): δ 7.83 (d, J = 8.85 Hz, 2H, ArH-2,6), 7.75 (dd, 1H, J = 1.74, 0.79 Hz
FurH-5’), 7.48 (dd, J = 3.63, 0.79 Hz, 1H, FurH-3’), 7.40 (d, J = 15.40 Hz, 1H, COCH=CH),
6.80 (d, J = 8.85 Hz, 2H, ArH-3,5), 6.71 (dd, 3.63, 1.74 Hz, 1H, FurH-4’), 6.60 (d, J = 15.90
Hz, 1H, COCH=CH), 3.77 (t, J = 5.79 Hz, 4H, CH2-O), 3.63 (t, J = 5.79 Hz, 4H, CH2-N); 13C-
NMR (CD3OD): δ 180.5 (C=O), 155.6 (FurC-2’), 152.5 (ArC-4), 148.9 (COCH=CH), 147.2
(FurC-5’), 132.5 (ArC-2,6), 124.0 (ArC-1), 119.2 (FurC-3’), 116.7 (COCH=CH), 114.1
(FurC-4’), 113.5 (ArC-3,5), 60.4 (CH2-O), 55.2 (CH2-N).
5.2.4 N-(2’-hydroxy-4’-dimethylaminobenzylidene)-4-nitroaniline [HDBN]
m-N,N-Dimethylaminophenol (13.70 g, 100 mmol) and 4-nitroaniline (15.18 g, 110
mmol) were added to a stirred solution of triethylorthoformate (16 mL, 97 mmol). The
mixture was heated under reflux for 5 min. After the reaction mixture had cooled to room
temp., methanol (30 mL) was added and the mixture was stirred for 5 min, during which time
a red precipitate formed. The red precipitate was filtered off, washed several times with water.
The resulting solid contains N,N’-bis(p-nitrophenyl)-formamidine as a yellow by-product
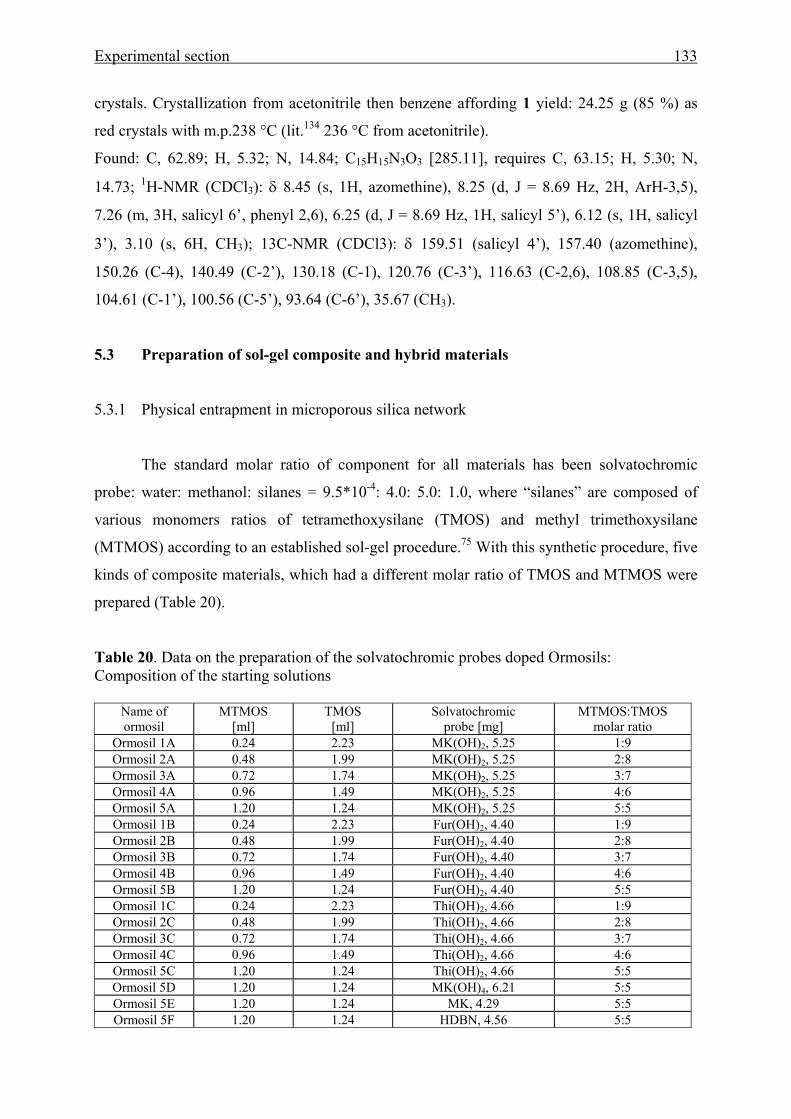
Experimental section 133
crystals. Crystallization from acetonitrile then benzene affording 1 yield: 24.25 g (85 %) as
red crystals with m.p.238 °C (lit.134 236 °C from acetonitrile).
Found: C, 62.89; H, 5.32; N, 14.84; C15H15N3O3 [285.11], requires C, 63.15; H, 5.30; N,
14.73; 1H-NMR (CDCl3): δ 8.45 (s, 1H, azomethine), 8.25 (d, J = 8.69 Hz, 2H, ArH-3,5),
7.26 (m, 3H, salicyl 6’, phenyl 2,6), 6.25 (d, J = 8.69 Hz, 1H, salicyl 5’), 6.12 (s, 1H, salicyl
3’), 3.10 (s, 6H, CH3); 13C-NMR (CDCl3): δ 159.51 (salicyl 4’), 157.40 (azomethine),
150.26 (C-4), 140.49 (C-2’), 130.18 (C-1), 120.76 (C-3’), 116.63 (C-2,6), 108.85 (C-3,5),
104.61 (C-1’), 100.56 (C-5’), 93.64 (C-6’), 35.67 (CH3).
5.3 Preparation of sol-gel composite and hybrid materials
5.3.1 Physical entrapment in microporous silica network
The standard molar ratio of component for all materials has been solvatochromic
probe: water: methanol: silanes = 9.5*10-4: 4.0: 5.0: 1.0, where “silanes” are composed of
various monomers ratios of tetramethoxysilane (TMOS) and methyl trimethoxysilane
(MTMOS) according to an established sol-gel procedure.75 With this synthetic procedure, five
kinds of composite materials, which had a different molar ratio of TMOS and MTMOS were
prepared (Table 20).
Table 20. Data on the preparation of the solvatochromic probes doped Ormosils: Composition of the starting solutions
Name of ormosil
MTMOS [ml]
TMOS [ml]
Solvatochromic probe [mg]
MTMOS:TMOS molar ratio
Ormosil 1A 0.24 2.23 MK(OH)2, 5.25 1:9 Ormosil 2A 0.48 1.99 MK(OH)2, 5.25 2:8 Ormosil 3A 0.72 1.74 MK(OH)2, 5.25 3:7 Ormosil 4A 0.96 1.49 MK(OH)2, 5.25 4:6 Ormosil 5A 1.20 1.24 MK(OH)2, 5.25 5:5 Ormosil 1B 0.24 2.23 Fur(OH)2, 4.40 1:9 Ormosil 2B 0.48 1.99 Fur(OH)2, 4.40 2:8 Ormosil 3B 0.72 1.74 Fur(OH)2, 4.40 3:7 Ormosil 4B 0.96 1.49 Fur(OH)2, 4.40 4:6 Ormosil 5B 1.20 1.24 Fur(OH)2, 4.40 5:5 Ormosil 1C 0.24 2.23 Thi(OH)2, 4.66 1:9 Ormosil 2C 0.48 1.99 Thi(OH)2, 4.66 2:8 Ormosil 3C 0.72 1.74 Thi(OH)2, 4.66 3:7 Ormosil 4C 0.96 1.49 Thi(OH)2, 4.66 4:6 Ormosil 5C 1.20 1.24 Thi(OH)2, 4.66 5:5 Ormosil 5D 1.20 1.24 MK(OH)4, 6.21 5:5 Ormosil 5E 1.20 1.24 MK, 4.29 5:5 Ormosil 5F 1.20 1.24 HDBN, 4.56 5:5
Experimental section 134
Taking into consideration, the molar ratio of silane mixtures (TMOS and MTMOS)
relative to the molar ratio of the other three components (solvatochromic probe, water, and
methanol) was constant in every composite. A typical example for synthesis one kind of
composites (ormosil 5[A-F]) as follow: A mixture of 1.24 mL (8.40 mmol) of tetramethoxy
silane (TMOS), 1.20 mL (8.40 mmol) of methyltrimethoxysilane (MTMOS) (molar ratio of
0.5:0.5), and 2.20 mL of methanol was sonicated for 10 min. and then 0.016 mmol of the
appropriate solvatochromic compound (5.25 mg MK(OH)2, 4.40 mg Fur(OH)2, 4.66 mg
Thi(OH)2, 4.29 mg MK, 6.21 mg MK(OH)4, or 4,56 mg HDBN) dissolved in 0.8 mL
methanol and 1.20 mL of acidic deionized water (pH = 3) to reach r = 4 (molar ratio of
H2O:Silanes) were added, followed by sonication for an additional 10 min. The mixture was
left in air at room temperature for 5 days and then at 60 °C for 2 days. The obtained solid was
ground in a mortar, and the resulting powder was heated at 120 °C for 24 h to complete the
sol-gel reaction. Matrix polarities were determined by UV/Vis absorption spectroscopy of
these materials. For solvent effects, the porous, transparent glasses were equilibrated with the
desired solvent for 30 min prior to measurements.
5.3.2 Chemical linking to the silica network
5.3.2.1 General procedure for preparation of 4-Dimethylamino-4’-[di(2-propyltriethoxysilyl-
carbamatoethyl)amino]benzophenone DPAB 8a, [4-Di(2-propyltriethoxysilylcarbamato-
ethyl)amino]-2-furylmethanone DPAF 8b, [4-Di(2-propyltriethoxysilylcarbamatoethyl)-
amino]-2-thienylmethanone DPAT 8c
3-Isocyanatopropyltriethoxysilane (0.82 g, 2.5 mmol) was added to a solution of 4-
(dimethylamino)-4’-[di(2-hydroxyethyl)amino]benzophenone MK(OH)2 (0.82 g, 2.5 mmol),
[4-di(2-hydroxyethyl)aminophenyl]-2-furylmethanone Fur(OH)2 (0.69 g, 2.5 mmol) or [4-
di(2-hydroxyethyl)aminophenyl]-2-thienylmethanone Thi(OH)2 (0.73 g, 2.5 mmol) in dry
dimethylacetamide (20 mL). The reaction mixture was stirred for 6 h at 110 °C under argon
atmosphere. This solution was used for the in situ sol-gel process. The sample for NMR
analysis was obtained by distillation under reduced pressure.
5.3.2.2 4-(Dimethylamino)-4’-[di(2-propyltriethoxysilylcarbamatoethyl)amino]benzophen-
one DPAB 8a
Experimental section 135
Yield: 1.48 g (90 %) as a yellow viscous liquid. 1H-NMR (CDCl3): δ 7.72 (d, J = 8.79 Hz, 4H, ArH-2,6,2’,6’), 6.76 (d, J = 8.79 Hz, 2H, ArH-
3,5), 6.66 (d, J = 8.79 Hz, 2H, ArH-3’,5’), 4.24 (t, J = 7.14 Hz, 4H, NCH2CH2O), 3.80 (q, J =
6.20 Hz, 12H, OCH2CH3), 3.68 (t, J = 7.14 Hz, 4H, NCH2CH2O), 3.16 (t, J = 7.30 Hz, 4H,
CH2CH2CH2Si), 3.04 (s, 6H, NCH3), 1.60 (m, 4H, CH2CH2CH2Si), 1.20 (t, J = 6.2 Hz, 18H,
OCH2CH3), 0.60 (t, J = 7.30 Hz, 4H, CH2CH2Si); 13C-NMR (CDCl3): δ 193.0 (C=O), 157.3
(CO2N), 153.0 (ArC-4), 151.5 (ArC-4’), 133.6 (ArC-2,6), 133.2 (ArC-2’,6’), 126.5 (ArC-1’),
126.0 (ArC-1’), 112.2 (ArC-3,5), 112.0 (ArC-3’,5’), 61.2 (NCH2CH2O), 58.4 (CH3CH2OSi),
50.9 (NCH2CH2O), 43.4 (CH2CH2CH2Si), 40.0 (NCH3), 24.0 (CH2CH2CH2Si), 18.3
(CH3CH2OSi), 7.5 (CH2CH2Si).
5.3.2.3 [4-Di(2-propyltriethoxysilylcarbamatoethyl)amino]-2-furylmethanone DPAF 8b
Yield: 1.37 g (91 %) as a pale yellow viscous liquid. 1H-NMR (CDCl3): δ 7.92 (d, J = 9.00 Hz, 2H, ArH-2,6), 7.55 (s, 1H, FurH-5’), 7.12 (d, J =
2.69 Hz, 1H, FurH-3’), 6.72 (d, J = 9.00 Hz, 2H, ArH-3,5), 6.48 (s, 1H, FurH-4’), 4.18 (t, J =
6.32 Hz, 4H, NCH2CH2O), 3.72 (q, J = 6.20 Hz, 12H, OCH2CH3), 3.62 (t, J = 6.32 Hz, 4H,
NCH2CH2O), 3.10 (t, J = 7.74 Hz, 4H, CH2CH2CH2Si), 1.55 (m, 4H, CH2CH2CH2Si), 1.14 (t,
J = 6.95 Hz, 18H, OCH2CH3), 0.55 (t, J = 7.74 Hz, 4H, CH2Si); 13C-NMR (CDCl3): δ 180.8
(C=O), 156.7 (CO2N), 153.5 (FurC-2’), 152.1 (ArC-4), 146.3 (FurC-5’), 132.4 (ArC-2,6),
125.6 (ArC-1), 119.2 (FurC-3’), 112.2 (FurC-4’), 111.4 (ArC-3,5), 61.6 (NCH2CH2O), 58.8
(CH3CH2OSi), 50.7 (NCH2CH2O), 43.8 (CH2CH2CH2Si), 23.6 (CH2CH2CH2Si), 18.7
(CH3CH2OSi), 7.8 (CH2CH2Si).
5.3.2.4 [4-Di(2-propyltriethoxysilylcarbamatoethyl)amino]-2-thienylmethanone DPAT 8c
Yield: 1.38 g (89 %) as a canary yellow viscous liquid. 1H-NMR (CDCl3): δ 7.80 (d, J = 8.85 Hz, 2H, ArH-2,6), 7.57 (d, J = 4.74 Hz, 2H, ThiH-
3’,4’), 7.07 (t, J = 4.11 Hz, 1H, ThiH-5’), 6.72 (d, J = 8.85 Hz, 2H, ArH-3,5), 4.16 (t, J = 6.16
Hz 4H, NCH2CH2O), 3.80 (t, J = 6.16 Hz 4H, NCH2CH2O), 3.60 (q, J = 6.20 Hz, 12H,
OCH2CH3), 3.10 (t, J = 7.58 Hz, 4H, CH2CH2CH2Si), 1.52 (m, 4H, CH2CH2CH2Si), 1.16 (t, J
= 6.85 Hz, 18H, OCH2CH3), 0.56 (t, J = 7.58 Hz, 4H, CH2Si); 13C-NMR (CDCl3): δ 186.5
(C=O), 155.8 (CO2N), 151.2 (ThiC-2’), 145.5 (ArC-4), 133.4 (ThiC-4’), 132.9 (ThiC-5’),
132.2 (ArC-2,6), 127.6 (ThiC-3’), 126.9 (ArC-1), 111.3 (ArC-3,5), 61.4 (NCH2CH2O), 58.9
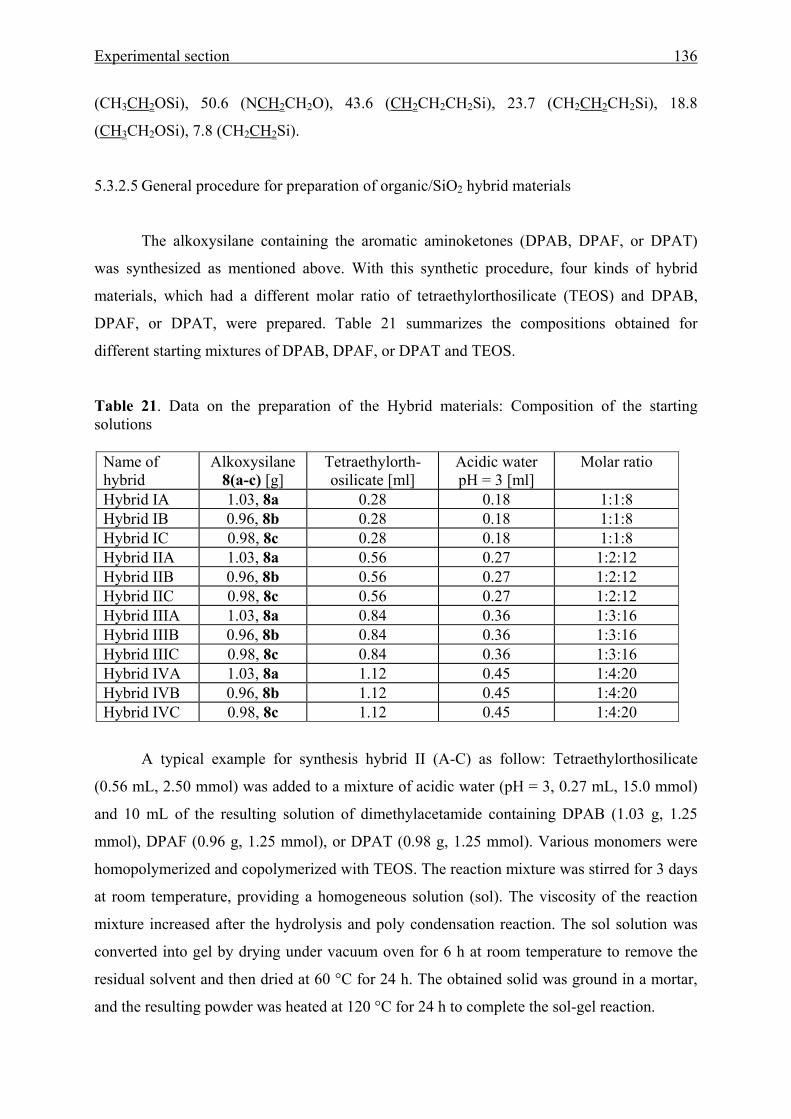
Experimental section 136
(CH3CH2OSi), 50.6 (NCH2CH2O), 43.6 (CH2CH2CH2Si), 23.7 (CH2CH2CH2Si), 18.8
(CH3CH2OSi), 7.8 (CH2CH2Si).
5.3.2.5 General procedure for preparation of organic/SiO2 hybrid materials
The alkoxysilane containing the aromatic aminoketones (DPAB, DPAF, or DPAT)
was synthesized as mentioned above. With this synthetic procedure, four kinds of hybrid
materials, which had a different molar ratio of tetraethylorthosilicate (TEOS) and DPAB,
DPAF, or DPAT, were prepared. Table 21 summarizes the compositions obtained for
different starting mixtures of DPAB, DPAF, or DPAT and TEOS.
Table 21. Data on the preparation of the Hybrid materials: Composition of the starting solutions
A typical example for synthesis hybrid II (A-C) as follow: Tetraethylorthosilicate
(0.56 mL, 2.50 mmol) was added to a mixture of acidic water (pH = 3, 0.27 mL, 15.0 mmol)
and 10 mL of the resulting solution of dimethylacetamide containing DPAB (1.03 g, 1.25
mmol), DPAF (0.96 g, 1.25 mmol), or DPAT (0.98 g, 1.25 mmol). Various monomers were
homopolymerized and copolymerized with TEOS. The reaction mixture was stirred for 3 days
at room temperature, providing a homogeneous solution (sol). The viscosity of the reaction
mixture increased after the hydrolysis and poly condensation reaction. The sol solution was
converted into gel by drying under vacuum oven for 6 h at room temperature to remove the
residual solvent and then dried at 60 °C for 24 h. The obtained solid was ground in a mortar,
and the resulting powder was heated at 120 °C for 24 h to complete the sol-gel reaction.
Name of hybrid
Alkoxysilane 8(a-c) [g]
Tetraethylorth-osilicate [ml]
Acidic water pH = 3 [ml]
Molar ratio
Hybrid IA 1.03, 8a 0.28 0.18 1:1:8 Hybrid IB 0.96, 8b 0.28 0.18 1:1:8 Hybrid IC 0.98, 8c 0.28 0.18 1:1:8 Hybrid IIA 1.03, 8a 0.56 0.27 1:2:12 Hybrid IIB 0.96, 8b 0.56 0.27 1:2:12 Hybrid IIC 0.98, 8c 0.56 0.27 1:2:12 Hybrid IIIA 1.03, 8a 0.84 0.36 1:3:16 Hybrid IIIB 0.96, 8b 0.84 0.36 1:3:16 Hybrid IIIC 0.98, 8c 0.84 0.36 1:3:16 Hybrid IVA 1.03, 8a 1.12 0.45 1:4:20 Hybrid IVB 0.96, 8b 1.12 0.45 1:4:20 Hybrid IVC 0.98, 8c 1.12 0.45 1:4:20
Experimental section 137
5.4. Poly(benzophenone co-piperazine) 9a and its composite form 9b
5.4.1 Solution polymerization
A mixture of 4,4’-difluorobenzophenone (5.46 g, 25 mmol), piperazine (2.16 g, 25
mmol), dry dimethylsulfoxide (25 mL), and potassium carbonate (3.46 g, 25 mmol) was
stirred under argon at 140 °C for 48 h. After cooling to room temperature, the reaction
mixture was poured into water (800 mL). The produced fine precipitate was collected by
centrifugation, and washed with water, methanol, and acetone. Finally, the product was dried
in a vacuum oven at 40 °C over night affording poly(benzophenone co-piperazine) 9a, (5.28
g, 80 %), as a yellow solid.
5.4.2 Solid-state polymerization
A mixture of 4,4’-difluorobenzophenone (4.36 g, 20 mmol), piperazine (1.72 g, 20
mmol), potassium carbonate (2.76 g, 20 mmol), and LiChroprep Si 60 (10 g) as solid support
was magnetically stirred under argon at 140 °C (fusion temperature of the mixed organic
reactants) for 48 h. After cooling to room temperature, the purification of the crude solid
hybrid was achieved by thoroughly washing this solid hybrid with water (48 h), ethanol (24
h), and acetone (24 h) using Soxhlet technique. Finally, the solid hybrid product was dried in
a vacuum oven at 40 °C over night affording hybrid poly(benzophenone co-piperazine) 9b.
5.5 Crystal structure analyses
Crystal structures of MK(OH)2, Fur(OAc)2, Fur(OH)2, Thi(OH)2, MK(OH)2,
MK(pip)2, MK(mor)2, BBP, and HDBN were determined using single-crystal X-ray
diffraction methods. Data collection for these compounds were performed at -100 °C using
graphite monochromatized MoKα (λ = 71.073 pm) radiation on a Bruker AXS SMART
1KCCD area detector. The complete data collection parameters and details of the structure
solution and refinement are given in Tables (22-24).
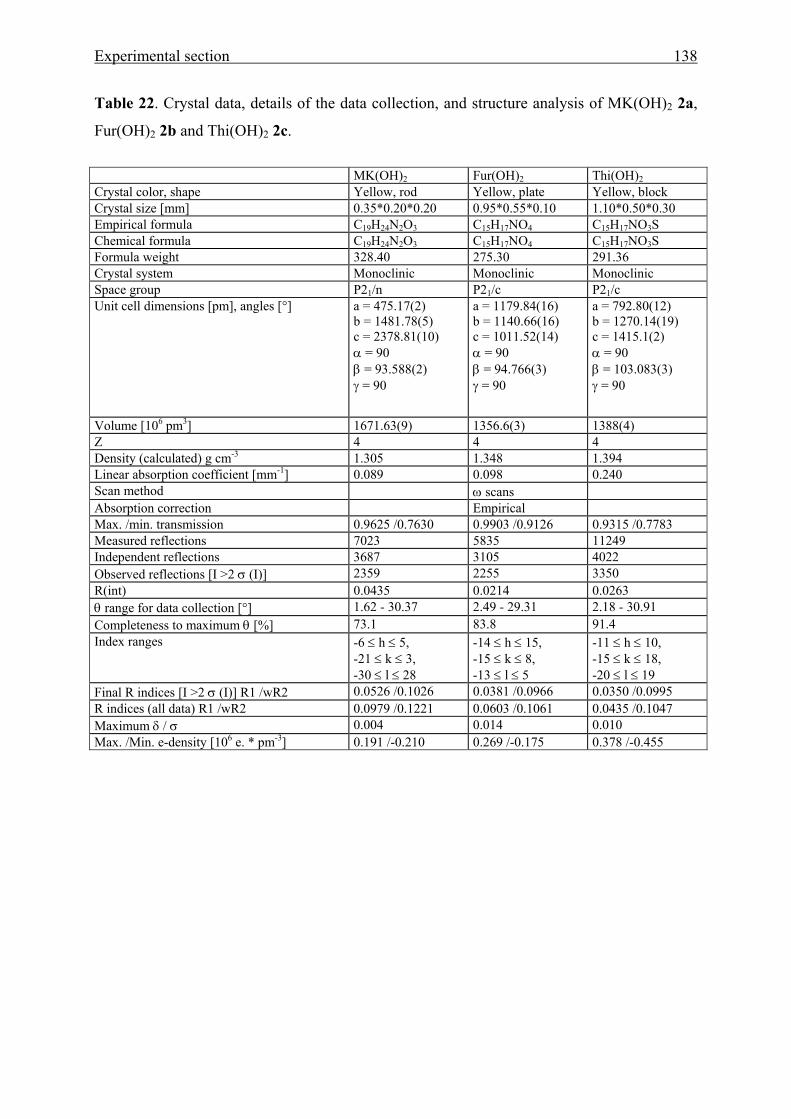
Experimental section 138
Table 22. Crystal data, details of the data collection, and structure analysis of MK(OH)2 2a,
Fur(OH)2 2b and Thi(OH)2 2c.
MK(OH)2 Fur(OH)2 Thi(OH)2 Crystal color, shape Yellow, rod Yellow, plate Yellow, block Crystal size [mm] 0.35*0.20*0.20 0.95*0.55*0.10 1.10*0.50*0.30 Empirical formula C19H24N2O3 C15H17NO4 C15H17NO3S Chemical formula C19H24N2O3 C15H17NO4 C15H17NO3S Formula weight 328.40 275.30 291.36 Crystal system Monoclinic Monoclinic Monoclinic Space group P21/n P21/c P21/c Unit cell dimensions [pm], angles [°] a = 475.17(2)
b = 1481.78(5) c = 2378.81(10) α = 90 β = 93.588(2) γ = 90
a = 1179.84(16) b = 1140.66(16) c = 1011.52(14) α = 90 β = 94.766(3) γ = 90
a = 792.80(12) b = 1270.14(19) c = 1415.1(2) α = 90 β = 103.083(3) γ = 90
Volume [106 pm3] 1671.63(9) 1356.6(3) 1388(4) Z 4 4 4 Density (calculated) g cm-3 1.305 1.348 1.394 Linear absorption coefficient [mm-1] 0.089 0.098 0.240 Scan method ω scans Absorption correction Empirical Max. /min. transmission 0.9625 /0.7630 0.9903 /0.9126 0.9315 /0.7783 Measured reflections 7023 5835 11249 Independent reflections 3687 3105 4022 Observed reflections [I >2 σ (I)] 2359 2255 3350 R(int) 0.0435 0.0214 0.0263 θ range for data collection [°] 1.62 - 30.37 2.49 - 29.31 2.18 - 30.91 Completeness to maximum θ [%] 73.1 83.8 91.4 Index ranges -6 ≤ h ≤ 5,
-21 ≤ k ≤ 3, -30 ≤ l ≤ 28
-14 ≤ h ≤ 15, -15 ≤ k ≤ 8, -13 ≤ l ≤ 5
-11 ≤ h ≤ 10, -15 ≤ k ≤ 18, -20 ≤ l ≤ 19
Final R indices [I >2 σ (I)] R1 /wR2 0.0526 /0.1026 0.0381 /0.0966 0.0350 /0.0995 R indices (all data) R1 /wR2 0.0979 /0.1221 0.0603 /0.1061 0.0435 /0.1047 Maximum δ / σ 0.004 0.014 0.010 Max. /Min. e-density [106 e. * pm-3] 0.191 /-0.210 0.269 /-0.175 0.378 /-0.455
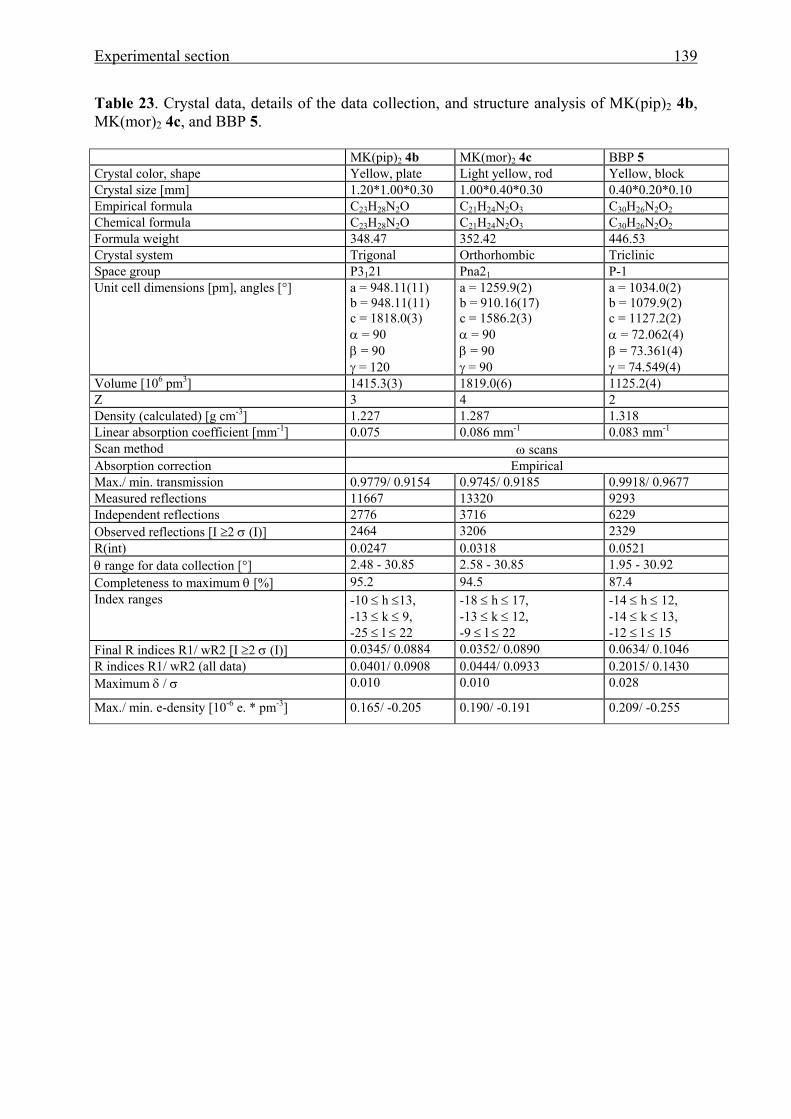
Experimental section 139
Table 23. Crystal data, details of the data collection, and structure analysis of MK(pip)2 4b, MK(mor)2 4c, and BBP 5.
MK(pip)2 4b MK(mor)2 4c BBP 5 Crystal color, shape Yellow, plate Light yellow, rod Yellow, block Crystal size [mm] 1.20*1.00*0.30 1.00*0.40*0.30 0.40*0.20*0.10 Empirical formula C23H28N2O C21H24N2O3 C30H26N2O2 Chemical formula C23H28N2O C21H24N2O3 C30H26N2O2 Formula weight 348.47 352.42 446.53 Crystal system Trigonal Orthorhombic Triclinic Space group P3121 Pna21 P-1 Unit cell dimensions [pm], angles [°] a = 948.11(11)
b = 948.11(11) c = 1818.0(3) α = 90 β = 90 γ = 120
a = 1259.9(2) b = 910.16(17) c = 1586.2(3) α = 90 β = 90 γ = 90
a = 1034.0(2) b = 1079.9(2) c = 1127.2(2) α = 72.062(4) β = 73.361(4) γ = 74.549(4)
Volume [106 pm3] 1415.3(3) 1819.0(6) 1125.2(4) Z 3 4 2 Density (calculated) [g cm-3] 1.227 1.287 1.318 Linear absorption coefficient [mm-1] 0.075 0.086 mm-1 0.083 mm-1 Scan method ω scans Absorption correction Empirical Max./ min. transmission 0.9779/ 0.9154 0.9745/ 0.9185 0.9918/ 0.9677 Measured reflections 11667 13320 9293 Independent reflections 2776 3716 6229 Observed reflections [I ≥2 σ (I)] 2464 3206 2329 R(int) 0.0247 0.0318 0.0521 θ range for data collection [°] 2.48 - 30.85 2.58 - 30.85 1.95 - 30.92 Completeness to maximum θ [%] 95.2 94.5 87.4 Index ranges -10 ≤ h ≤13,
-13 ≤ k ≤ 9, -25 ≤ l ≤ 22
-18 ≤ h ≤ 17, -13 ≤ k ≤ 12, -9 ≤ l ≤ 22
-14 ≤ h ≤ 12, -14 ≤ k ≤ 13, -12 ≤ l ≤ 15
Final R indices R1/ wR2 [I ≥2 σ (I)] 0.0345/ 0.0884 0.0352/ 0.0890 0.0634/ 0.1046 R indices R1/ wR2 (all data) 0.0401/ 0.0908 0.0444/ 0.0933 0.2015/ 0.1430 Maximum δ / σ 0.010 0.010 0.028
Max./ min. e-density [10-6 e. * pm-3] 0.165/ -0.205 0.190/ -0.191 0.209/ -0.255
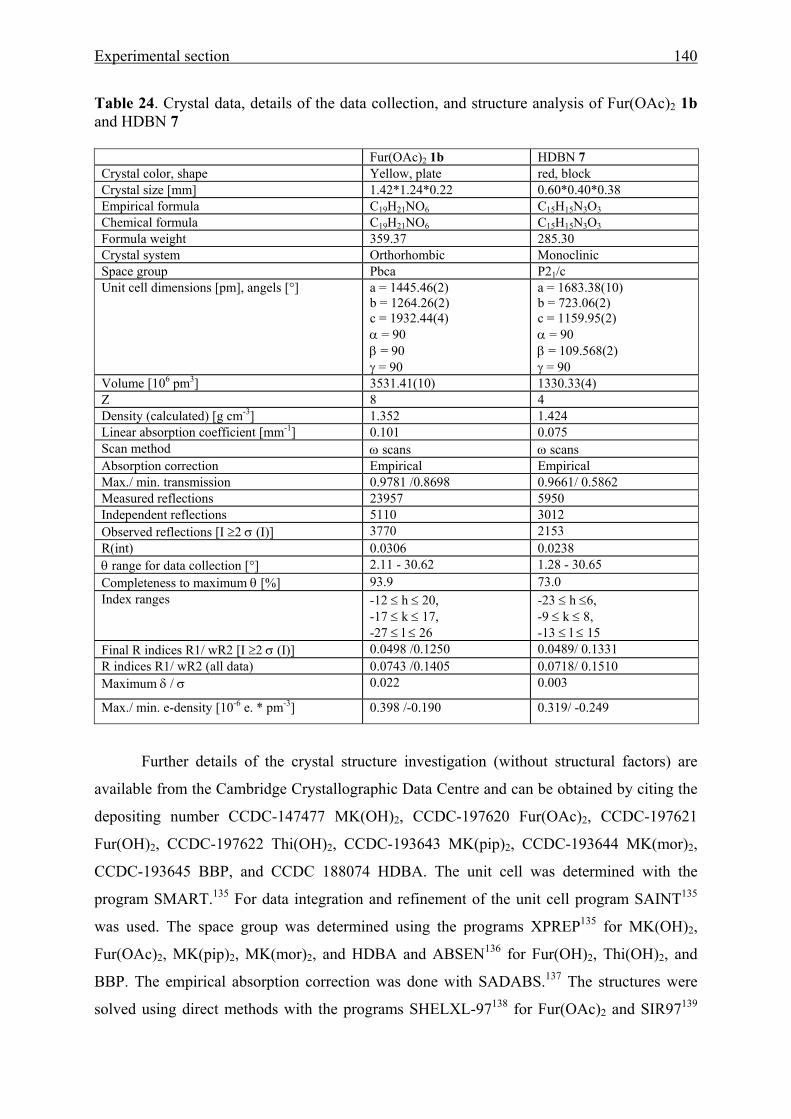
Experimental section 140
Table 24. Crystal data, details of the data collection, and structure analysis of Fur(OAc)2 1b and HDBN 7
Further details of the crystal structure investigation (without structural factors) are
available from the Cambridge Crystallographic Data Centre and can be obtained by citing the
depositing number CCDC-147477 MK(OH)2, CCDC-197620 Fur(OAc)2, CCDC-197621
Fur(OH)2, CCDC-197622 Thi(OH)2, CCDC-193643 MK(pip)2, CCDC-193644 MK(mor)2,
CCDC-193645 BBP, and CCDC 188074 HDBA. The unit cell was determined with the
program SMART.135 For data integration and refinement of the unit cell program SAINT135
was used. The space group was determined using the programs XPREP135 for MK(OH)2,
Fur(OAc)2, MK(pip)2, MK(mor)2, and HDBA and ABSEN136 for Fur(OH)2, Thi(OH)2, and
BBP. The empirical absorption correction was done with SADABS.137 The structures were
solved using direct methods with the programs SHELXL-97138 for Fur(OAc)2 and SIR97139
Fur(OAc)2 1b HDBN 7 Crystal color, shape Yellow, plate red, block Crystal size [mm] 1.42*1.24*0.22 0.60*0.40*0.38 Empirical formula C19H21NO6 C15H15N3O3
Chemical formula C19H21NO6 C15H15N3O3 Formula weight 359.37 285.30 Crystal system Orthorhombic Monoclinic Space group Pbca P21/c Unit cell dimensions [pm], angels [°] a = 1445.46(2)
b = 1264.26(2) c = 1932.44(4) α = 90 β = 90 γ = 90
a = 1683.38(10) b = 723.06(2) c = 1159.95(2) α = 90 β = 109.568(2) γ = 90
Volume [106 pm3] 3531.41(10) 1330.33(4) Z 8 4 Density (calculated) [g cm-3] 1.352 1.424 Linear absorption coefficient [mm-1] 0.101 0.075 Scan method ω scans ω scans Absorption correction Empirical Empirical Max./ min. transmission 0.9781 /0.8698 0.9661/ 0.5862 Measured reflections 23957 5950 Independent reflections 5110 3012 Observed reflections [I ≥2 σ (I)] 3770 2153 R(int) 0.0306 0.0238 θ range for data collection [°] 2.11 - 30.62 1.28 - 30.65 Completeness to maximum θ [%] 93.9 73.0 Index ranges -12 ≤ h ≤ 20,
-17 ≤ k ≤ 17, -27 ≤ l ≤ 26
-23 ≤ h ≤6, -9 ≤ k ≤ 8, -13 ≤ l ≤ 15
Final R indices R1/ wR2 [I ≥2 σ (I)] 0.0498 /0.1250 0.0489/ 0.1331 R indices R1/ wR2 (all data) 0.0743 /0.1405 0.0718/ 0.1510 Maximum δ / σ 0.022 0.003
Max./ min. e-density [10-6 e. * pm-3] 0.398 /-0.190 0.319/ -0.249

Experimental section 141
for Fur(OH)2 and Thi(OH)2. The structure refinement by least-square methods based on F2
was done with SHELXL-97.138
All non-hydrogen atoms were fully refined in the calculated positions, the hydrogen
atoms were taken from the electron density difference map and in both their position and their
thermal parameters refined freely.
The plots of the molecular structures were visualized using the programs ZORTEP140
and PLATON.141
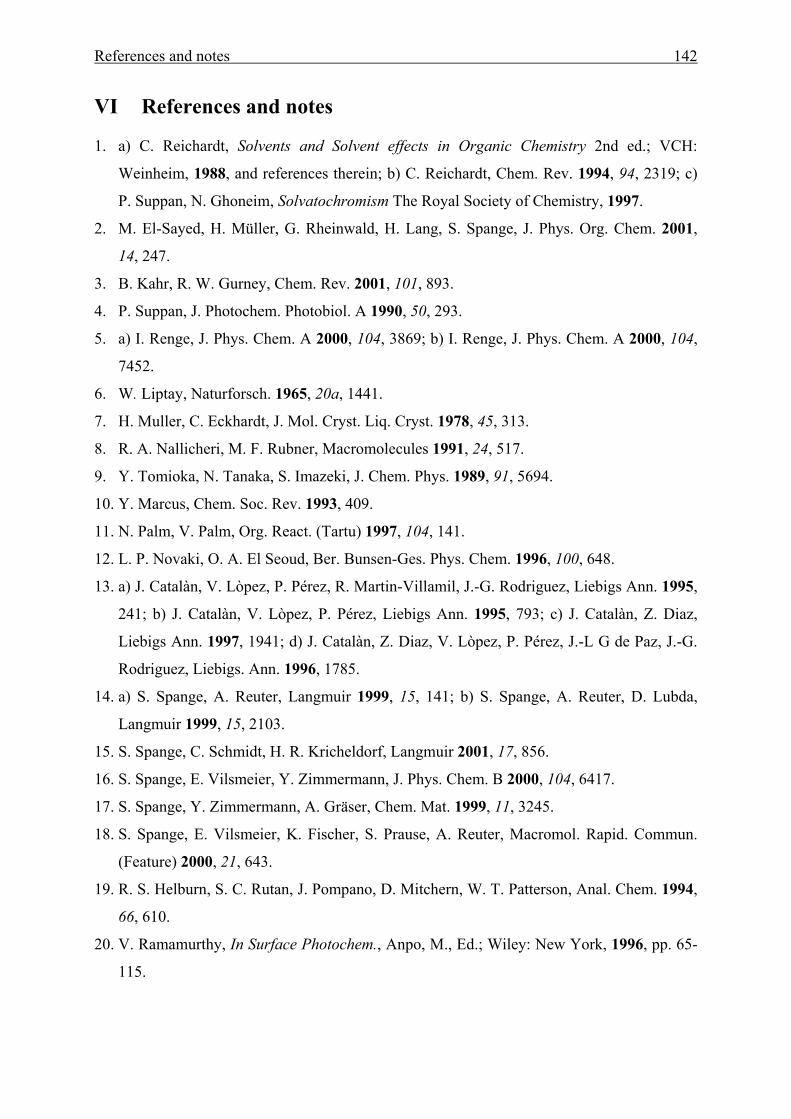
References and notes 142
VI References and notes 1. a) C. Reichardt, Solvents and Solvent effects in Organic Chemistry 2nd ed.; VCH:
Weinheim, 1988, and references therein; b) C. Reichardt, Chem. Rev. 1994, 94, 2319; c)
P. Suppan, N. Ghoneim, Solvatochromism The Royal Society of Chemistry, 1997.
2. M. El-Sayed, H. Müller, G. Rheinwald, H. Lang, S. Spange, J. Phys. Org. Chem. 2001,
14, 247.
3. B. Kahr, R. W. Gurney, Chem. Rev. 2001, 101, 893.
4. P. Suppan, J. Photochem. Photobiol. A 1990, 50, 293.
5. a) I. Renge, J. Phys. Chem. A 2000, 104, 3869; b) I. Renge, J. Phys. Chem. A 2000, 104,
7452.
6. W. Liptay, Naturforsch. 1965, 20a, 1441.
7. H. Muller, C. Eckhardt, J. Mol. Cryst. Liq. Cryst. 1978, 45, 313.
8. R. A. Nallicheri, M. F. Rubner, Macromolecules 1991, 24, 517.
9. Y. Tomioka, N. Tanaka, S. Imazeki, J. Chem. Phys. 1989, 91, 5694.
10. Y. Marcus, Chem. Soc. Rev. 1993, 409.
11. N. Palm, V. Palm, Org. React. (Tartu) 1997, 104, 141.
12. L. P. Novaki, O. A. El Seoud, Ber. Bunsen-Ges. Phys. Chem. 1996, 100, 648.
13. a) J. Catalàn, V. Lòpez, P. Pérez, R. Martin-Villamil, J.-G. Rodriguez, Liebigs Ann. 1995,
241; b) J. Catalàn, V. Lòpez, P. Pérez, Liebigs Ann. 1995, 793; c) J. Catalàn, Z. Diaz,
Liebigs Ann. 1997, 1941; d) J. Catalàn, Z. Diaz, V. Lòpez, P. Pérez, J.-L G de Paz, J.-G.
Rodriguez, Liebigs. Ann. 1996, 1785.
14. a) S. Spange, A. Reuter, Langmuir 1999, 15, 141; b) S. Spange, A. Reuter, D. Lubda,
Langmuir 1999, 15, 2103.
15. S. Spange, C. Schmidt, H. R. Kricheldorf, Langmuir 2001, 17, 856.
16. S. Spange, E. Vilsmeier, Y. Zimmermann, J. Phys. Chem. B 2000, 104, 6417.
17. S. Spange, Y. Zimmermann, A. Gräser, Chem. Mat. 1999, 11, 3245.
18. S. Spange, E. Vilsmeier, K. Fischer, S. Prause, A. Reuter, Macromol. Rapid. Commun.
(Feature) 2000, 21, 643.
19. R. S. Helburn, S. C. Rutan, J. Pompano, D. Mitchern, W. T. Patterson, Anal. Chem. 1994,
66, 610.
20. V. Ramamurthy, In Surface Photochem., Anpo, M., Ed.; Wiley: New York, 1996, pp. 65-
115.
References and notes 143
21. D. J. Macquarrie, S. J. Tavener, G. W. Gray, P. A. Heath, J. S. Rafelt, S. I. Saulzet, J. J. E.
Hardy, J. H. Clark, P. Sutra, D. Brunel, F. di Renzo, F. Fajula, New. J. Chem. 1999, 23,
725.
22. a) S. C. Rutan, J. M. Harris, J. Chromatogr. A 1993, 656, 197; b) J. H. Park, P. W. Carr, J.
Chromatogr. 1989, 465, 137.
23. S. Spange, A. Reuter, E. Vilsmeier, D. Keutel, T. Heinze, W. Linert, J. Polym. Sci. 1998,
36, 1945.
24. M. S. Paley, R. A. Mc Gill, S. C. Howard, S. E. Wallace, J. M. Harris, Macromolecules
1990, 23, 4557.
25. a) S. M. Lindly, T. C. Flowers, J. E. Leffler, J. Org. Chem. 1985, 50, 607; b) C.
Chronister, R. S. Drago, J. Am. Chem. Soc. 1993, 115, 4793.
26. a) P. Müller, Glossary of Terms Used in Physical Organic Chemistry-IUPAC
Recommendations 1994. Pure Appl. Chem.1994, 66, 1077.
27. H. Heinz, U. W. Suter, E. Leontidis, J. Am. Chem. Soc. 2001, 123, 11229.
28. D. Horn, J. Rieger, Angew. Chem. Int. Ed. 2001, 40, 4330, and references cited therein.
29. H.-B. Fu, J.-N. Yao, J. Am. Chem. Soc. 2001, 123, 1434.
30. N. Mataga, T. Kubota Molecular Interactions and Electronic Spectra; Marcel Dekker:
New York, 1970.
31. P. G. Lacroix, J.-C. Daran, P. Cassoux New J. Chem., 1998, 22, 1085.
32. a) J. M. Kamlet, R. W. Taft, J. Am. Chem. Soc. 1976, 98, 377; b) J. M. Kamlet, R. W.
Taft, J. Am. Chem. Soc. 1976, 98, 2886; c) J. M. Kamlet, J.-L. M. Abboud, R. W. Taft, J.
Am. Chem. Soc. 1977, 99, 6027; d) J.-L. M. Abboud, R. W. Taft, J. Phys. Chem. 1979,
83, 412; e) J. M. Kamlet, J.-L. M. Abboud, H. M. Abraham, R. W. Taft, J. Org. Chem.
1983, 48, 2877; f) J. M. Kamlet, R. M. Doherty, J.-L. M. Abboud, H. M. Abraham, R. W.
Taft, CHEMTECH 1986, 566.
33. J. E. Brady, P. W. Carr, J. Phys. Chem. 1982, 86, 3053.
34. P. Suppan, J. Chem. Soc., Faraday Trans. 1, 1975, 71, 539.
35. R. G. Brown, G. Porter, J. Chem. Soc., Faraday Trans. 1, 1977, 73, 1569.
36. E. J. J. Groenen, W. N. Koelman, J. Chem. Soc., Faraday Trans. 2, 1979, 7, 58.
37. S. Spange, D. Keutel, Liebigs Ann. Chem. 1992, 423.
38. M. V. Barnabas, A. Liu, A. D. Trifunac, V. V. Krongauz, C. T. Chang, J. Phys. Chem.
1992, 96, 212.
39. S. Spange, E. Vilsmeier, S. Adolph, A. Fährmann, J. Phys. Org. Chem. 1999, 12, 547.
40. A. Onen, Y. Yagci, Polymer 2001, 42, 6681.
References and notes 144
41. H. Mayr, T. Bug, M. F .Gotta, N. Hering, B. Irrgang, B. Janker, B. Kempf, R. Loos, A.
Ofial, G. Remennikov, H. Schimmel, J. Am. Chem. Soc. 2001, 123, 9500.
42. D. F. Duxbury, Chem. Rev. 1993, 93, 281.
43. S. A. Gorman, J. D. Hepworth, D. Mason, J. Chem. Soc., Perkin Trans. 2, 2000, 1889.
44. S. Spange, D. Keutel, Liebigs Ann. Chem. 1993, 981.
45. S. Spange, A. Reuter, E. Vilsmeier, Colloid Polym. Sci. 1996, 274, 59.
46. S. Spange, D. Keutel, F. Simon, J. Chim. Phys. 1992, 89, 1615.
47. Y. Zimmermann, M. El-Sayed, S. Prause, S. Spange, Monatsh. Chem. 2001, 132, 1347.
48. a) V. Rao, A. Jen, Y. Cai, Chem. Commun. 1996, 1237; b) K. Wong, A. Jen, V. Rao, K.
Drost, R. Mininni, Proc. SPIE 1992, 74, 1775 and references therein.
49. S. Gilmour, S. Marder, J. Perry, L. –T. Cheng, Adv. Mater. 1994, 6, 494; b) A. Jen, Y.
Cai, P. Bedworth, S. Marder, Adv. Mater. 1997, 9, 132.
50. M. Blenkle, P. Boldt, C. Bräuchle, W. Grahn, I. Ledoux, H. Nerenz, S. Stadler, J.
Wichern, J. Zyss, J. Chem. Soc. Perkin Trans. 2, 1996, 1377.
51. F. Effenberger, F. Würthner, Angew. Chem. 1993, 106, 742; Angew. Chem. Int. Ed. 1993,
32, 719.
52. M. H. Werts, M. A. Duin, J. W. Hofstraat, J. W. Verhoeven, Chem. Commun. 1999, 799.
53. S. V. Tsukerman, V. P. Maslennikova, V. F. Lavruskin, Opt. Spektrosk. 1967, 23, 396.
54. F. Würthner, R. Wortmann, K. Meerholz, Chem. Phys. Chem. 2002, 3, 17.
55. R. Herzfeld, P. Nagy, Spectrosc. Lett. 1999, 32, 57.
56. H. Dürr, H. Bouas-Laurent, Photochromism Molecules and Systems 1990 eds., Elesevier,
Amsterdam, Chapter 17.
57. T. Kawato, H. Koyama, H. Kanatomi, M. Isshiki, J. Photochem. 1985, 28, 103.
58. M. D. Cohen, M. J. Schmidt, S. Flavin, J. Chem. Soc. 1964, 2041.
59. T. Kawato, H. Kanatomi, H. Koyama, T. Igarashi, J. Photochem. 1986, 33, 199.
60. a) G.O. Dudek, E. P. Dudek, J. Am. Chem. Soc. 1966, 88, 2407; b) R. S. Becker, W. F.
Richey, J. Am. Chem. Soc. 1967, 89, 1298; c) E. Hadjoudis, F. Milia, J. Seliger, R. Blinc,
V. Zagar, Chem. Phys. 1980, 47, 105; d) T. Inabe, S. Gautier-Luneau, N. Hoshino, K.
Okaniwa, H. Okamoto, T. Mitani, U. Nagashima, Y. Maruyama, Bull. Chem. Soc. Jpn.
1991, 64, 801; e) T. Inabe, I. Luneau, T. Mitani, Y. Maruyama, S. Takeda, Bull. Chem.
Soc. Jpn. 1994, 67, 612; f) K. Wozniak, H. He, J. Klinowski, W. Jones, T. Dziembowska,
E. Grech, J. Chem. Soc. Faraday Trans. 1995, 91, 77; g) A. R. Katritzky, I. Ghiviriga, P.
Leeming, F. Soti, Magn. Reson. Chem. 1996, 34, 518; h) S. H. Alarcon, A. C. Olivieri, A.
Nordon, R. K. Harris, J. Chem. Soc., Perkin Trans. 2, 1996, 2293; i) T. Sekikawa, T.
References and notes 145
Kobayashi, T. Inabe, J. Phys. Chem. A 1997, 101, 644; j) H. Pizzala, M. Carles, W. E.
Stone, A. Thevand, J. Chem. Soc., Perkin Trans. 2, 2000, 935.
61. D. Gegiou, E. Lambi, E. Hadjoudis, J. Phys. Chem. 1996, 100, 17762.
62. B. M. Novak, Adv. Mater. 1993, 5, 422.
63. U. Schubert, N. Hüsing, A. Lorenz, Chem. Mater. 1995, 7, 2010.
64. P. Judeinstein, C. Sanchez, J. Mater. Chem. 1996, 6, 511.
65. J. Wen, G. L. Wilkes, Chem. Mater. 1996, 8, 1667.
66. Y. Chujo, Curr. Opin. Solid state Mater. Eng. 1996, 1, 806.
67. U. Schubert, J. Chem. Soc., Dalton Trans. 1996, 3343.
68. C. J. Brinker, J. Non-Cryst. Solids 1988, 100, 31.
69. R. J. P. Corriu, D. Leclercq, Angew. Chem. Int. Ed. Engl. 1996, 35, 5, 1420.
70. a) C. J. Brinker, G. W. Scherer, Sol-Gel Science; Academic Press: Boston, 1990; b) L. C.
Klein, Sol-Gel Optics, Processing and Applications; Kluwer Academic Press: Boston,
1994; c) E. J. A. Pope, S. Sakka, L. C. Klein, Sol-Gel Science and Technology; American
Ceramic Society: Westerville, 1995.
71. B. Dunn, J. I. Zink, Chem. Mater. 1997, 9, 2280.
72. S. D. Hanna, B. Dunn, J. I. Zink, J. Non-Cryst. Solids 1994, 167, 239.
73. R. Gvishi, U. Narang, F. V. Bright, P. N. Prasad, Chem. Mater. 1995, 7, 1703.
74. M. Ferrer, P. Lianos, Langmuir 1996, 12, 5620.
75. a) C. Rottman, G. S. Grader, Y. De Hazan, D. Avnir, Langmuir 1996, 12, 5505. b) C.
Rottman, G. S. Grader, D. Avnir, Chem. Mater. 2001, 13, 3631.
76. N. Wittouck, F. D. Schryver, I. Snijkers-Hendrickx, J. Sol-Gel. Sci. Technol. 1997, 8,
895.
77. K. Matsui, K. Nozawa, Bull. Chem. Soc. Jpn. 1997, 70, 2331.
78. Q. Deng, Y. Hu, R. B. Moore, C. L. McCormick, K. A. Mauritz, Chem. Mater. 1997, 9,
36.
79. a) J. Samuel, Y. Polevaya, M. Ottolenghi, D. Avnir, Chem. Mater. 1994, 6, 1457; b) D.
Avnir, Acc. Chem. Res. 1995, 28, 328.
80. B. Dunn, J. I. Zink, J. Mater. Chem. 1991, 1, 903.
81. D. Avnir, D. Levy, R. Reisfeld, J. Phys. Chem. 1984, 88, 5956.
82. K. Matsui, F. Momose, Chem. Mater. 1997, 9, 2588.
83. P. Innocenzi, H. Kozuka, T. Yoko, J. Phys. Chem. B 1997, 101, 2285.
84. M. M. Collinson, P. Zambrano, H. Wang, J. Taussig, Langmuir 1999, 15, 662.
85. V. R. Kaufman, D. Avnir, Langmuir 1986, 2, 717.
References and notes 146
86. H. Nishikiori, T. Fujii, J. Phys. Chem. 1997, 101, 3680.
87. R. A. Dunbar, J. D. Jordan, F. V. Bright, Anal. Chem. 1996, 68, 604.
88. A. N. Diaz, J. Lovillo, M. C. R. Peinado, Chem. Mater. 1997, 9, 2647.
89. U. Narang, R. Wang, P. N. Prasad, F. V. Bright, J. Phys. Chem. 1994, 98, 17.
90. U. Narang, J. D. Jordan, F. V. Bright, P. N. Prasad, J. Phys. Chem. 1994, 98, 8101.
91. L. Sieminska, T. W. Zerda, J. Phys. Chem. 1996, 100, 4591.
92. a) R. A. Hill, A. Knoesen, M. A. Mortazavi, Appl. Phys. Lett. 1994, 65, 1733; b) Y.
Zhang, N. Prasad, R. Burzynski, Chem. Mater. 1992, 4, 851; c) R. J. Jeng, Y. M. Chen, A.
K. Jain, J. Kumar, S. K. Tripathy, Chem. Mater. 1992, 4, 972; d) S. Marturunkakul, J. I.
Chen, R. J. Jeng, S. Sengupta, J. Kumar, S. K. Tripathy, Chem. Mater. 1993, 5, 743.
93. J. E. Mark, C. Lee, P. A. Biancon, Hybrid Organic-Inorganic composites; ACS
Symposium Series 585; American Chemical Society: Washington, DC, 1995.
94. a) G. Odian, Principle of Polymerization, 3rd ed., Wiley: New York, 1991; b) A. S. Abu-
Surrah, B. Rieger, Top. Catal. 1999, 7, 165; c) C. E. Ash, J. E. Flood, Polym. Mater. Sci.
Eng. 1997, 76, 110; d) M. J. Mullins, E. P. Woo, J. Macromol. Sci. Rev. Macromol.
Chem. Phys. 1987, C27, 313.
95. F. Y. Xu, J. C. W. Chien, Macromolecules 1993, 26, 3485.
96. a) O. Ozarslan, E. Yildiz, T. Yilmaz, A. Gungor, A. Kuyulu, Macromol. Chem. Phys.
1998, 199, 1887; b) S. Maiti, B. K. Mandal, Prog. Polym. Sci. 1986, 12,111.
97. a) R. L. Danforth, J. M. Machado, J. C. M. Jordaan, Plast. Eng. 1996, 52, 77; b) Z. Jiang,
A. Sen, J. Am. Chem. Soc. 1995, 117, 4455; c) E. Drent, W. W. Jager, Polym. Mater. Sci.
Eng. 1997, 76, 100.
98. Q. T. Zhang, J. M. Tour, J. Am. Chem. Soc. 1997, 119, 5065.
99. M. Perez, C. Fourrier, I. Sigogneau, P. I. Pauwels, C. Palmier, G. W. John, J.-P. Valentin,
S. Halazy, J. Med. Chem. 1995, 38, 3602.
100. M. E. Jung, E. C. Yang, B. T. Vu, M. Kiankarimi, E. Spyrou, J. Kaunitz, J. Med.
Chem. 1999, 42, 3899.
101. E. Mishani, C. S. Dence, F. J. McCarthy, M. J. Welch, Tetrahedron Lett. 1996, 37,
319.
102. S.-H. Zhao, A. K. Miller, J. Berger, L. A. Flippin, Tetrahedron Lett. 1996, 37, 4463.
103. a) G. H. Posner, Angew. Chem. Int. Ed. Engl. 1978, 17, 487; b) A. McKillop, K. W.
Young, Synthesis 1979, 401 and 481; c) M. Balogh, P. Laszlo, Organic Chemistry Using
Clays, Springer-Verlag: Berlin, 1993; d) J. H. Clark, Catalysis of Organic Reactions by
References and notes 147
Supported Inorganic Reagents, VCH Publisher: New York, 1994, e) J. H. Clark, D. J.
Macquarrie, Chem. Commun. 1998, 853.
104. E. P. Giannelis, Appl. Organomet. Chem. 1998, 12, 675.
105. R. Kirshnamoorti, R. A. Vaia, E. P. Giannelis, Chem. Mater. 1998, 8, 1728.
106. O. S. Wolfbeis, Fiber Optic Chemical Sensors and Biosensors, CRC Press, Boca
Raton, FL, Vols. 1 and 2, 1991.
107. a) F. Baldini, S. Bracci, F. Cosi, P. Bechi, F. Pucciani, Appl. Spectrosc. 1994, 48, 549;
b) L. Yang, S. S. Saaverda, Anal. Chem. 1995, 67, 1307.
108. a) K. Suzuki, K. Tohda, Y. Tanda, H. Ohzora, S. Nishihama, H. Inoue, T. Shirai, Anal.
Chem. 1989, 61, 382; b) S. E. Eckert-Tilotta, W. H. Scouten, J. Hines, Appl. Spectrosc.
1991, 45, 491.
109. a) G. J. Mohr, O. S. Wolfbeis, Anal. Chim. Acta 1994, 292, 41; b) H. Lindauer, P.
Czerney, U. W. Grummt, J. Prakt. Chem. 1994, 336, 521; c) F. Lehmann, G. J. Mohr, P.
Czerney, U. W. Grummt, Dyes and Pigments, 1995, 29, 85.
110. F. Effenberger, P. Fisher, W. W. Schoeller, W.-D. Stohrer, Tetrahedron 1978, 34,
2409.
111. S. F. Beach, J. D. Hepworth, J. Sawyer, G. Hallas, R. Marsden, M. M. Mitchell, D. A.
Ibbitson, A. M. Jones, G. T. Neal, J. Chem. Soc., Perkin Trans. 2 1984, 217.
112. T. Gramstad, S. Husebye, K. Maartmann-Moe, J. Säbö, Acta Chem. Scand., Ser. B
1987, 41, 555.
113. a) J. Emsley, D. J. Jones, J. Lucas, Rev. Inorg. Chem. 1981, 3, 1; b) S. Husebye, K.
Maartmann-Moe, R. E. Bozak, K. L. Rinehart, Acta Chem. Scand., Ser. B 1985, 39, 55.
114. a) Y. Zimmermann, S. Anders, Katja Hofmann, S. Spange, Langmuir 2002, 18, 9578;
b) Y. Zimmermann, Ph.D. thesis, Chemnitz-Universität 2002.
115. E. Lippmaa, M. Magi, A. Samoson, G. Engelhardt, A. Grimmer, J. Am. Chem. Soc.
1980, 102, 4889.
116. G. Engelhardt, H. Jancke, E. Lippmaa, A. Samoson, J. Organomet. Chem. 1981, 210,
295.
117. M. Magi, E. Lippmaa, A. Samoson, G. Engelhardt, A. Grimmer, J. Phys. Chem. 1984,
88, 1518.
118. R. Glaser, G. Wilkes, C. Bronnimann, J. Non-Cryst. Solids 1989, 113, 73.
119. J. Kim, J. Plawsky, E. Wagenen, G. Korenowski, Chem. Mater. 1993, 5, 1118.
120. F. H. Allen, O. Kennard, D. G. Watson, L. Brammer, A. G. Orpen, R. Taylor Typical
interatomic distances: organic compounds In International Tables for Crystallography,
References and notes 148
Wilson AJC 1995 The International Union of Crystallography; edn. Kluwer Academic
Publishers, Dordrecht, The Netherlands, Vol. C, pp 685-706.
121. S. M. Lindley, G. C. Flowers, J. E. Leffler, J. Org. Chem. 1985, 50, 607.
122. a) E. M. Arnet, K. F. Cassidy, Rev. Chem. Intermed. 1988, 9, 27; b) H. Winde, P.
Fink, A. Köhler, Z. Chem. 1977, 17, 41; c) W. Pohle, J. Chem. Soc., Faraday Trans. 1,
1982, 78, 2101; d) V. Gutmann, The Donor-Acceptor Approach to Molecular Interactions
1978, Plenum Press, New York.
123. G. Engelhardt, D. Michel, High-Resolution Solid-State NMR of Silicates and Zeolites
1987, Wiley, New York.
124. J.-F. Masson, R. S. J. Manley, Macromolecules 1991, 24, 5921.
125. a) J. C. Blais, M. Tessier, G. Bolback, B. Remaud, L. Rozes, J. Guittard, A. Brunot, E.
Marechal, C. J. Tabet, Int. J. Mass Spectrom. Ion Processes 1995, 144, 131; b) J. Guittard,
M. Tessier, J. C. Blais, G. Bolback, L. Rozes, E. Marechal, C. J. Tabet, J. Mass Spectrom.
1996, 31, 1409; c) S. M. Hunt, P. J. Derrick, M. M. Sheil, Eur. Mass Spectrom. 1998, 4, 1.
126. a) R. J. Hunter, Foundations of Colloid Science 1995, Vol. 1, Oxford University Press,
New York; b) J. H. Masliyah, Electrokinetic Transport Phenomena 1994, AOSTRA,
Edmonton, Alberta, Canada.
127. a) H.-J. Jacobasch, Angew. Makromol. Chem. 1984, 128, 47; b) H.-J. Jacobasch,
Progr. Org. Coatings, 1989, 17, 115.
128. O. Z. Stern, Z. Elektrochem. 1924, 30, 508.
129. D. D. Perrin, W. L. F. Armarego, Purification of Laboratory Chemicals, 3rd ed.,
Pergamon Press, Oxford, 1988.
130. K. Schwetlick et al., Organikum-Organisch-chemisches Grundpraktikum, 21 st ed.,
Wiley-VCH, Weinheim, 2001, chapter F, pp.741-762.
131. N. J. Kartinos, General Aniline and Film Corp., Methine Dyes, U. S. Pat. 1957,
2,811,544; Chem. Abstr. 1958, 52, 4196a.
132. S. F. Beach, J. D. Hepworth, P. Jones, D. Mason, J. Sawyer, J. Chem. Soc., Perkin
Trans. 2 1989, 1087.
133. T. Le Bouder, P. Massiot, H. Le Bozec, Tetrahedron Lett. 1998, 39, 6869.
134. P. Czerney, H. Hartmann, J. Prakt. Chem. 1982, 324, 21.
135. Bruker AXS Inc., Madison, WI, USA, 1998.
136. P. McArdle, J. Appl. Cryst. 1996, 29, 306.
137. G. M. Sheldrick, SADABS V2.01 Program for Empirical Absorption Correction of
Area Detector Data 2000, University of Göttingen, Germany.

References and notes 149
138. G. M. Sheldrick, SHELX97. Programs for Crystal Structure Analysis (Release-97-2),
1997, University of Göttingen, Germany.
139. A. Altomare, M. C. Burla, M. Camalli, G. L. Cascarano, C. Giacovazzo, A.
Guagliardi, A. G. G. Moliterni, G. Polidori, R. Spagna, J. Appl. Cryst. 1999, 32, 115.
140. L. Zsolnai, G. Huttner, 1994, University of Heidelberg, Germany.
141. A. L. Spek, PLATON, A Multipurpose Crystallographic Tool 1999, Utrecht
University, Utrecht, The Netherlands.

Curriculum Vitae 150
Curriculum Vitae
Personal data
Name Mohamed Mohamed Ibrahim El-Sayed
Date of birth 16.11.1966
Place of birth Port-said, Egypt
Parents Kauther El-Gamel and Mohamed El-Sayed
Nationality Egyptian
Civil status Married since 05.10.1995, 2 Children
Name and occupation of wife Hanan Koutta, Dr. Eng., Faculty of Engineering
and Technology, Suez Canal University, Port-said, Egypt
Name of children Mirna El-Sayed and Manar El-Sayed
School Education
1972-1978 Children Education Nationalized Primary School
1978-1981 El Canal Prep School for Boys
1981-1984 El Canal Secondary School for Boys
University Education
1984-1988 Bachelor of Science in Chemistry, Faculty of Science,
Suez Canal University, Ismailia, Egypt
1991-1995 Master Science in Chemistry, Faculty of Science, Suez
Canal University, Ismailia, Egypt
Experience and Skills
1988-1997 Research Assistant, Faculty of Engineering and
Technology and Faculty of Education, Suez Canal
University, Port-said, Egypt. Also, in the same time,
I have occupied the following jobs:
1990-1995 Chemist in El-Naser Salines Co., Port-said, Egypt
1996-1997 Chemist in General Authority for Quality Controlling on
Import and Export., Port-said, Egypt
Since July 1998 Working as Research Fellow under the supervision of
Prof. Dr. S. Spange, Chemnitz University of Technology,
Chemnitz, Germany.

Selbständigkeiterklärung 151
Selbständigkeitserklärung
Hiermit erkläre ich, dass ich die vorliegende Arbeit selbständig und nur unter Verwendung
der angegebenen Literatur und Hilfsmittel angefertigt habe.
Chemnitz, den 20.12.2002