functional characterization of iga ... - stm.sciencemag.org · are applied, leading to the proposal...
TRANSCRIPT

R E S EARCH ART I C L E
MALNUTR I T ION
Functional characterization of IgA-targeted bacterialtaxa from undernourished Malawian children thatproduce diet-dependent enteropathyAndrew L. Kau,1,2 Joseph D. Planer,1 Jie Liu,3 Sindhuja Rao,2 Tanya Yatsunenko,1 Indi Trehan,4,5
Mark J. Manary,4,6 Ta-Chiang Liu,7 Thaddeus S. Stappenbeck,7 Kenneth M. Maleta,6 Per Ashorn,8
Kathryn G. Dewey,9 Eric R. Houpt,3 Chyi-Song Hsieh,2 Jeffrey I. Gordon1*
http:D
ownloaded from
To gain insights into the interrelationships among childhood undernutrition, the gut microbiota, and gut mu-cosal immune/barrier function, we purified bacterial strains targeted by immunoglobulin A (IgA) from the fecalmicrobiota of two cohorts of Malawian infants and children. IgA responses to several bacterial taxa, includingEnterobacteriaceae, correlated with anthropometric measurements of nutritional status in longitudinal studies.The relationship between IgA responses and growth was further explained by enteropathogen burden. Gnotobioticmouse recipients of an IgA+ bacterial consortium purified from the gut microbiota of undernourished children ex-hibited a diet-dependent enteropathy characterized by rapid disruption of the small intestinal and colonic epithelialbarrier, weight loss, and sepsis that could be prevented by administering two IgA-targeted bacterial species from ahealthy microbiota. Dissection of a culture collection of 11 IgA-targeted strains from an undernourished donor, suf-ficient to transmit these phenotypes, disclosed that Enterobacteriaceae interacted with other consortium membersto produce enteropathy. These findings indicate that bacterial targets of IgA responses have etiologic, diagnostic,and therapeutic implications for childhood undernutrition.
//st
by guest on August 15, 2019m
.sciencemag.org/
INTRODUCTION
Childhood undernutrition is a devastating and pervasive global healthproblem that is not due to food insecurity alone, but rather reflects anumber of intra- and intergenerational factors (1–3). The gut micro-biota is one factor being explored to better understand the pathogenesisof undernutrition and to develop more effective treatment and preven-tion strategies. The gut microbiota operates as a metabolic “organ” thatperforms functions required for healthy growth, including vitamin bio-synthesis and biotransformation of food ingredients (4). Recent studiesin Malawi and Bangladesh have shown that the normal pattern of mi-crobiota assembly is disrupted in children with undernutrition: this im-maturity persists after commonly used therapeutic food interventionsare applied, leading to the proposal that disrupted microbiota develop-ment imperils healthy postnatal growth (5, 6).
The microbiota co-develops with the immune system during post-natal life (7, 8), impacting healthy mucosal barrier function and therisk for, and evolution of, enteropathogen infections (9, 10), another con-tributing factor in undernutrition. Immunoglobulin A (IgA) is secretedinto the gut, where it functions by binding bacterial, food, and otherantigens, preventing their direct interaction with the host via immuneexclusion (11). Many features of IgA, including its role in mediating
1Center for Genome Sciences and Systems Biology, Washington University School ofMedicine, St. Louis, MO 63108, USA. 2Department of Medicine, Washington UniversitySchool of Medicine, St. Louis, MO 63110, USA. 3Department of Medicine, Division ofInfectious Diseases and International Health, University of Virginia School of Medicine,Charlottesville, VA 22908, USA. 4Department of Pediatrics, Washington University Schoolof Medicine, St. Louis, MO 63110, USA. 5Department of Paediatrics and Child Health,College of Medicine, University of Malawi, Chichiri, Blantyre 3, Malawi. 6Department ofCommunity Health, College of Medicine, University of Malawi, Chichiri, Blantyre 3, Malawi.7Department of Pathology and Immunology, Washington University School of Medicine,St. Louis, MO 63110, USA. 8Department for International Health, University of Tampere Schoolof Medicine, Tampere 33014, Finland. 9Department of Nutrition, and Program in Internationaland Community Nutrition, University of California, Davis, Davis, CA 95616, USA.*Corresponding author. E-mail: [email protected]
www.Science
host-microbiota homeostasis, its responsiveness to transient antigenicstimulation, and its stability within the intestinal tract, make it an at-tractive molecule to identify microbes that directly interact with the gutmucosal immune system (12–14). Whereas secretory IgA concentrationsin serum, nasal washings, tears, saliva, and duodenal aspirates have beenstudied in children with undernutrition (15–17), little is known about theidentities of the bacterial taxa targeted by IgA in the gut or other bodyhabitats, or about the role of IgA-targeted bacteria in the pathogenesisof childhood undernutrition. Here, we delineate interrelationshipsamong diet, the gut microbiota, gut mucosal barrier function, and en-teropathogen infection in childhood undernutrition by isolating, identi-fying, and then functionally characterizing the gut bacterial targets ofhost IgA responses in members of two cohorts of Malawian children.
RESULTS
Identifying bacterial targets of IgA responses ingnotobiotic mice colonized with fecal microbiota fromtwins discordant for kwashiorkorAs part of ongoing efforts to better understand how the gut micro-biota contributes to undernutrition, we transplanted fecal microbiotasamples collected from a 21-month-old Malawian monozygotic twinpair discordant for kwashiorkor (a form of severe acute undernutri-tion) into separate groups of adult male germ-free C57BL/6J mice (6)(see twin pair 57 in table S1). Mice were fed a sterile macronutrient-and micronutrient-deficient diet, designed to represent the diets of thedonor population, starting 1 week before gavage with the human mi-crobiota, or were maintained on a nutritionally sufficient mouse chowlow in fat and rich in plant polysaccharides (“standard diet”). Transplan-tation is an efficient and reproducible process with capture of themajority of species-level bacterial taxa in recipient animals (6). Con-sistent with our previous report (6), 2 weeks after transplantation,
TranslationalMedicine.org 25 February 2015 Vol 7 Issue 276 276ra24 1

R E S EARCH ART I C L E
by guest on August 15, 2019
http://stm.sciencem
ag.org/D
ownloaded from
mice “humanized” with microbiota from the co-twin with kwashiorkorand fed the Malawian diet (“KM” mice) had lost significantly moreweight than animals fed the same diet but were colonized with micro-biota from the healthy co-twin (“HM”mice). Mice fed the standard dietlost significantly less weight than their counterparts fed the deficientMalawian diet, regardless of their donor microbiota (“KS” and “HS”mice, respectively) (fig. S1A).
We identified IgA-bound components of the transplanted micro-biota and subsequently purified these organisms, in a viable form, fromeach of the four groups of humanized gnotobiotic animals (KM, KS,HM, and HS) by fluorescence-activated cell sorting (FACS) (14, 18–22)(see Materials and Methods and fig. S2, A to G, for details about thesorting protocol). Our goal was to first analyze fecal microbiota sam-ples recovered from these groups of gnotobiotic mice using this method(which we call BugFACS), then to characterize the role of componentsof the enriched IgA+ microbial consortia in mediating disease and/orpromoting health through transfer to germ-free animals, and finally, toapply BugFACS directly to human fecal samples obtained from cohorts ofMalawian infants and children with varying degrees of undernutrition.
IgA-bound bacteria were recovered from fecal samples collectedfrom members of each of the four groups of gnotobiotic mice 13 to16 days after they had been colonized. Samples from individual micewere independently subjected to BugFACS followed by bacterial 16SrRNA gene sequencing of the “input,” IgA+, and IgA− fractions. The dif-ferential representation of each taxon between the IgA+ and IgA−
fractions was expressed in the form of an IgA index (fig. S1, D andE). For a given taxon, the value of the IgA index can range from amaximum of 1.0 (taxon detected exclusively in the IgA+ fraction) toa minimum of −1.0 (present only in the IgA− fraction). The input frac-tion served to define how a taxon’s representation in the IgA+ and IgA−
fractions corresponded to its overall abundance within the fecal sampleand as an internal control to validate enrichment of IgA+ bacteria. TheIgA index value was calculated for each taxon present in a given sampleto give a relative measure of targeting; the index does not provide anabsolute quantitation of the IgA response because the total amount ofIgA bound to each taxon is not determined. Data obtained about a giventaxon in each group of mice subjected to a given treatment were com-bined to compute a mean IgA index value and a P value for its enrich-ment in the IgA+ or IgA− fraction (see Materials and Methods andfigs. S2 and S3, A and B, for a more detailed description and validationof this approach).
The results revealed significant enrichment for members of thefamily-level taxon Enterobacteriaceae in the IgA+ fraction purifiedfrom the fecal microbiota of KM mice (two independent experiments,n = 19 mice; 19 fecal samples analyzed; P < 0.0001, paired Wilcoxonrank sum test; Fig. 1A and table S2). Neither the HM mice that hadreceived the healthy co-twin’s microbiota and were fed the Malawiandiet (n = 15) nor the KS mice that had received the kwashiorkor co-twin’s microbiota but were fed standard mouse chow (n = 9) developeda significant IgA response to Enterobacteriaceae, despite its presencein the microbiota of all treatment groups (Fig. 1A and fig. S1B). In con-trast, the most prominent IgA response in mice colonized with fe-cal microbiota from the healthy co-twin (HM and HS groups) was toAkkermansia muciniphila, the only representative of the family Ver-rucomicrobiaceae detected (Fig. 1B, fig. S1C, and table S2). Among thetaxa that were present in all four groups of mice, Enterobacteriaceaewas the only family-level taxon whose targeting by IgA was significantlygreater in KMmice compared to all three of the other groups of animals
www.Science
(Fig. 1A). Erysipelotrichaceae, a member of the Firmicutes, was a targetof the IgA response in both groups fed the Malawian diet, regardless ofthe source of their human microbiota (Fig. 1C and table S2).
Transmissible diet-dependent pathologic phenotypesWe performed a microbial adoptive transfer experiment to function-ally characterize the IgA+ consortia recovered from mice colonizedwith either the kwashiorkor or the healthy co-twin’s microbiota (KMand HM groups). We focused on the IgA-enriched fraction and a pos-itive selection approach, realizing that the IgA-negative fraction could,in principle, contain a subpopulation of those strains present in the IgA-positive population, and understanding that other IgA-negative strainscould also contribute to disease pathogenesis. Germ-free adult C57BL/6Jmice were started on the Malawian diet 1 week before colonization. Onegnotobiotic isolator contained mice gavaged with 105 sorted IgA+ mi-crobial cells derived from the fecal microbiota of KM mice (KMIgA+
group). Another isolator contained mice gavaged with 105 microorga-nisms from the IgA+ fraction of HM mouse fecal microbiota (HMIgA+
group). A third gnotobiotic isolator contained mice gavaged with a mix-ture of 5 × 10⁴ IgA+ microbes from KMmice and 5 × 10⁴ IgA+ microbesfrom HM mice, so that the total number of microbes administered wasalso 105 per mouse (MixIgA+) (fig. S1F; see fig. S3, B and C, for Hellingerdistance comparisons between the three sorted fractions and docu-mentation of colonization with the IgA+ microbes).
KMIgA+ mice fared poorly over the 2-week period following gavagewith 50% dying within 5 days (Fig. 2A; two independent experiments;n = 20 animals). In contrast, 100% of the HMIgA+ mice survived forthe full course of the experiment despite being maintained on thesame Malawian diet as the KM group and receiving the same numberof sorted microbes (n = 15; two independent experiments). Remark-ably, 100% of the MixIgA+ group also survived over the entire course ofthe experiment (n = 10, two independent experiments; Fig. 2A). More-over, MixIgA+ mice lost less weight than KMIgA+ animals over the firstseveral days after colonization (fig. S4), although they experienced moreweight loss than HMIgA+ animals at later time points [loss: 28.3 ± 1.5%(mean ± SEM) versus 20.7 ± 2.3% 12 days after gavage; P = 0.04, un-paired Wilcoxon rank sum test].
These phenotypes were diet-dependent. Lethality in recipients ofthe IgA+ consortium purified from KM mice was prevented when theywere fed nutrient-sufficient chow rather than the nutrient-deficientMalawian diet. In addition, if the IgA+ fraction was derived from micethat had been colonized with the intact kwashiorkor microbiota butfed a standard chow diet, the recipient KSIgA+ mice exhibited signifi-cantly less weight loss (P < 0.01, Wilcoxon rank sum test; Fig. 2B) andsomewhat reduced mortality (20%; P = 0.3, Fisher’s exact test) evenwhile consuming the Malawian diet (n = 5 mice per treatment group).These results emphasize the transmissible effects of diet and the rela-tive severity of the KMIgA+-induced phenotype.
Lethality phenotype transmissible by the KMIgA+
consortium is ameliorated by IgA-targeted taxa fromthe healthy co-twin’s microbiotaA 16S rRNA analysis was performed on fecal samples obtained fromKMIgA+, HMIgA+, or MixIgA+ mice 13 days after they had been in-oculated with an IgA+ consortium. Clostridium scindens was the onlyspecies-level taxon that satisfied our criteria of being present in the fecalmicrobiota of mice colonized with the healthy co-twin’s microbiota(HM group) or its derivatives (HMIgA+ and MixIgA+ animals), but not
TranslationalMedicine.org 25 February 2015 Vol 7 Issue 276 276ra24 2

R E S EARCH ART I C L E
by guest on August 15, 2019
http://stm.sciencem
ag.org/D
ownloaded from
in mice colonized with the kwashiorkor co-twin’s microbiota (KM group)or its derivatives (“first-generation” KMIgA+ animals) (Fig. 2C). C. scindensis part of a group of Clostridia that induces colonic regulatory T cellsand tolerogenic responses in mice (23, 24).
www.ScienceTranslationalMedicine.org 25
We subsequently tested whether C.scindens and A. muciniphila could pre-vent the lethality caused by the purifiedKMIgA+ consortium. A. muciniphila wasselected because (i) it induced a signifi-cantly more robust IgA response in micecolonized with the healthy co-twin’s com-pared to the kwashiorkor co-twin’s fecalmicrobiota (Fig. 1B), and (ii) its presencehas been associated with healthy, nonin-flamed gut mucosa in humans [abundanceis reduced in the microbiota of patientswith inflammatory bowel disease (25)].A. muciniphila also improves barrier func-tion in a mouse model of diet-inducedobesity (26). An equal mixture ofC. scindensand A. muciniphila (abbreviated CsAm)was introduced into mice 24 hours beforegavage with 105 bacteria from the IgA+
consortium purified from the feces of ani-mals previously colonized with a KMIgA+
consortium. These recipient mice repre-sented “second-generation” KMIgA+ ani-mals (KMF2IgA+) (Fig. 2D). Control groupsconsisted of animals gavaged with heat-killed CsAm 24 hours before introductionof the KMIgA+ consortium, and KMF2IgA+
mice that received no intervention. KMF2IgA+
mice had high mortality (80% within 4 daysof gavage), whereas mice that received liveCsAm experienced significantly less mor-tality (14%; P < 0.01, Fisher’s exact test)compared to mice that were gavaged withan equivalent number of heat-killed CsAm(100% mortality) or that received no inter-vention (two independent experiments ex-amining the protective effect of the CsAmconsortium in mice harboring the KMIgA+
or KMF2IgA+ community; n = 5 to 15 miceper treatment group per experiment; effecton KMF2IgA+ mice shown in Fig. 2E).
We analyzed serum cytokine profiles in10 KMIgA+ mice that survived until the endof the experiment (day 13) and 5 moribundKMIgA+ animals that had to be sacrificed ondays 3 to 4. There was an increase in theserum concentration of a number of cyto-kines in the moribund group, includinggranulocyte colony-stimulating factor, IL-10 (interleukin-10), IL-12p40, IL-1b, IL-6,KC (a mouse IL-8 homolog), and MCP-1 (monocyte chemotactic protein-1) (fig.S5A). This cytokine signature is similar tothat reported inmousemodels of sepsis due
to cecal ligation and puncture (27). Follow-up flow cytometry of micesurviving to day 13 disclosed an increase in B cells (TCR-b−B220+)and activated CD4+ T cells (CD44hiCD62Llow) in themesenteric lymphnodes (MLNs) but not in the spleens of KMIgA+ compared to HMIgA+
n = 19 9 15 10
CA
B
********
*********
****
Treatmentgroup
Treatmentgroup
n.s.
More significant More significant
More enrichedin IgA+
More enrichedin IgA–
Diet: M MS SK K HHMicrobiota:
Ent
erob
acte
riace
ae Ig
A in
dex
KM KS HM HS
***
Ver
ruco
mic
robi
acea
e Ig
A in
dex
KM KS HM HS
–0.2
0
0.2
0.4
0.6
–0.2
0.0
0.2
0.4
0.6
IgA index = –log IgA taxon
+ – log IgA taxon–
log IgAtaxon+ + log IgA taxon
–
Actinomycetaceae
Bacteroidaceae
Porphyromonadaceae
Rikenellaceae
Paenibacillaceae
Enterococcaceae
Eubacteriaceae
Lachnospiraceae
Ruminococcaceae
Erysipelotrichaceae
Phyllobacteriaceae
Rhizobiaceae
Sphingomonadaceae
Desulfovibrionaceae
Enterobacteriaceae
Brachyspiraceae
Verrucomicrobiaceae
Fig. 1. IgA responses in gnotobiotic mice colonized with the fecal microbiota of twins discordantfor kwashiorkor. Diet- and microbiota-associated differences in IgA responses to bacterial taxa present in
gnotobiotic mice containing transplanted microbiota from kwashiorkor or healthy co-twins from discor-dant pair 57. Separate groups of mice received fecal microbiota from either the kwashiorkor (K) or healthy(H) co-twin and were fed an irradiated (sterile) prototypic Malawian (M) diet (KM or HM groups) or a con-trol nutrient-sufficient standard (S) mouse chow (KS and HS groups). Fecal samples collected from recipi-ent mice 13 to 16 days after gavage of the human donor microbiota were analyzed by BugFACS. Resultsshown are from two independent experiments. (A) Enterobacteriaceae were significantly enriched in theIgA+ fraction prepared from the fecal microbiota of KM mice compared to all other groups of animals,indicating the microbiota and diet specificity of the gut mucosal immune response. Each data point re-presents a fecal microbiota sample from a different animal. (B) Mice colonized with the microbiota fromthe healthy co-twin had an IgA response to Verrucomicrobiaceae that was significantly greater than theresponses of mice harboring microbiota from the sibling with kwashiorkor. **P < 0.01; ***P < 0.001; ****P <0.0001 (Wilcoxon rank sum test). (C) Bubble plot depicting IgA responses (defined by the IgA index) todifferent family-level bacterial taxa. Each column represents a different group of gnotobiotic mice. Eachrow shows the relative enrichment of a given family-level taxon in the IgA+ or IgA− fraction. The color ofthe circle represents the direction of enrichment, with darker colors indicating greater significance asdetermined by paired Wilcoxon test (threshold for significantly enriched, P < 0.05). The diameter of a givencircle represents the average magnitude of enrichment for a given taxon in the fecal microbiota of mem-bers of a given treatment group. n, number of gnotobiotic mice analyzed per treatment group (see tableS2 for IgA indices for members of each family-level taxon shown). n.s., not significant. Gray circles indicatethat a taxon was not observed within a given treatment group.February 2015 Vol 7 Issue 276 276ra24 3

R E S EARCH ART I C L E
by guest on August 15, 2019
http://stm.sciencem
ag.org/D
ownloaded from
D
BA
E
C
0
20
40
60
80
100
Experimental day
% S
urvi
val
0 7 14
***
% R
elat
ive
abun
danc
e of
C
. sci
nden
s in
feca
l mic
robi
ota
HM KM KMIgA+ HMIgA+ MixIgA+
0
20
40
60
80
100
Experimental day
% S
urvi
val
0 7 14
**
**
KMIgA+(n = 20)
HMIgA+(n = 15)
MixIgA+(n = 10)
KMF2IgA+
CsAm+KMF2IgA+
HKCsAm+KMF2IgA+
% S
tart
ing
wei
ght 1
3 da
ys a
fter
gava
ge
60
70
80
90
100
KMIgA+
Malawidiet
KMIgA+
Stddiet
KSIgA+
Malawidiet
KSIgA+
Stddiet
HMIgA+
Malawidiet
0
0.1
1.0
10
******* *
***
**
****
*
**
* **
Live C. scindens & A. muciniphila
CsAm +KMF2IgA+
Heat-killed C. scindens & A. muciniphila
No intervention
HK CsAm + KMF2IgA+
KMF2IgA+
IgA
Pac
Blu
e (e
mpt
y)
24 h
Gavage
24 h
KMIgA+
F
% S
tart
ing
wei
ght (
2 da
ys a
fter
gava
ge) E. coli
K. variicolaC. amalonaticus
E. hiraeE. casseliflavus
B. intestinalisB. thetaiotaomicron
B. uniformisB. fragilis
P. distasonisB. acidifaciens
(i)
(ii)
(iii)
80
85
90
95
100*** ****
****
CombinedEnterobacteriaceae &Enterococcus
Bacteroidetes &Enterococcus
(n = 10)(n = 15)
(n = 5)
fr--
--
-l
--
-
.-
--
.
-
-.
r--
-
-
,
t.
.
,ticrobiota of KM or KMIgA+ animals. *P < 0.05; mice (CsAm + KMF2IgA+, n = 15). A third group was gavaged with heat-killed
Fig. 2. Bacterial targets oIgA responses to kwashiorko
and healthy co-twin microbiota introduced into germfree mice. Adult germ-freeC57BL/6J mice were fed an irradiated Malawian diet starting 1 week before gavagewith IgA+ fractions. These fractions were purified from fecamicrobiota obtained from KMor HMmice 42 days after theyhad been colonized with therespective co-twin’s microbiota. After gavage, the recipient mice were maintained onthe Malawian diet. (A) KMIgA+mice (n = 20) experienced significantly greater mortalitythan HMIgA+ mice (n = 15)Mice that received an equivalent number of cells fromIgA+ consortia purified fromHM and KM mouse fecal microbiota did not exhibit mortality during the course of theexperiment (MixIgA+, n = 10)*P< 0.05; **P< 0.01, comparedto the KMIgA+ group (Fisher’s exact test). Results represent datafrom two independent experiments. (B) Impact of dietKMIgA+ mice fed a Malawiandiet lost more weight ovea 2-week period after colonization than did animals colonized with the same IgA+
consortium but fed a standard nutrient-sufficient mousechow. Mice receiving the IgA+
consortium purified from thefecal microbiota of mice harboring the same family 57kwashiorkor donor microbiotabut fed a standard mousechow (KS IgA+ mice) lost lessweight than did KMIgA+ miceregardless of whether theywere fed the Malawian dieor a standard mouse chow*P < 0.05; **P < 0.01; ***P <0.001 (Wilcoxon rank sum test)(C) C. scindens was present inthe fecal microbiota of HMHMIgA+, and MixIgA+ mice bu
was not detectable in the m***P < 0.001; ****P < 0.0001 (Wilcoxon rank sum test). (D) Experimentaldesign of a follow-up experiment where three groups of adult germ-freemalemice were gavaged with an IgA+ consortium purified by BugFACS fromthe fecal microbiota of surviving KMIgA+ mice. All recipients [second-generation (F2) KMF2IgA+ mice] were fed the Malawian diet. The firstgroup of KMF2IgA+ mice received no intervention (n = 10). Another groupreceived an equal mixture of live C. scindens and A. muciniphila by gavage24 hours before introduction of the IgA+ consortium purified from KMIgA+www.Science
C. scindens and A. muciniphila 24 hours before introduction of the IgA+ con-sortium (heat-killed CsAm + KMF2IgA+, n = 5). (E) CsAm + KMF2IgA+ miceexhibited significantly reduced mortality compared to either KMF2IgA+ orheat-killed CsAm + KMF2IgA+ animals. **P < 0.01 (Fisher’s exact test). (F) Effectsof colonizing germ-free mice fed a Malawian diet with different compo-nents of the 11 OTU culture collection, generated from KMF2IgA+ microbiota,on weight. Data for individual mice in each treatment group are plotted.***P < 0.001; ****P < 0.0001 (Wilcoxon rank sum test).
TranslationalMedicine.org 25 February 2015 Vol 7 Issue 276 276ra24 4
R E S EARCH ART I C L E
by guest on August 15, 2019
http://stm.sciencem
ag.org/D
ownloaded from
animals, consistent with the increased delivery ofmicrobes from the guttoMLNand gut barrier dysfunction inKMIgA+ animals (fig. S5, B andC).
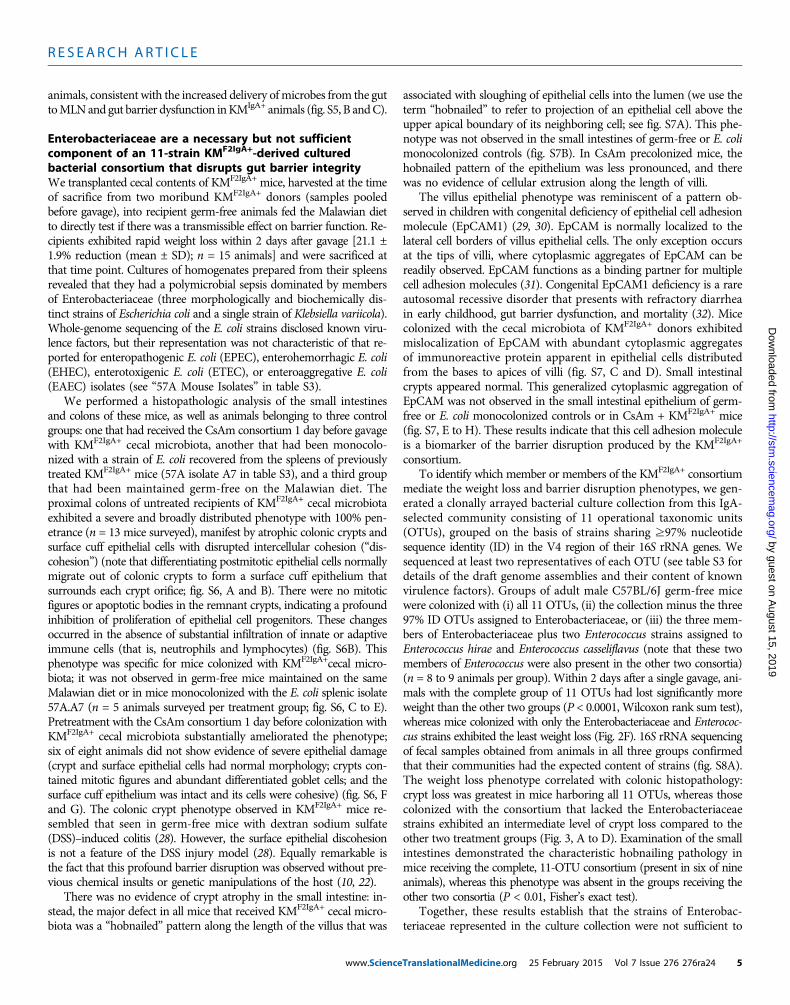
Enterobacteriaceae are a necessary but not sufficientcomponent of an 11-strain KMF2IgA+-derived culturedbacterial consortium that disrupts gut barrier integrityWe transplanted cecal contents of KMF2IgA+ mice, harvested at the timeof sacrifice from two moribund KMF2IgA+ donors (samples pooledbefore gavage), into recipient germ-free animals fed the Malawian dietto directly test if there was a transmissible effect on barrier function. Re-cipients exhibited rapid weight loss within 2 days after gavage [21.1 ±1.9% reduction (mean ± SD); n = 15 animals] and were sacrificed atthat time point. Cultures of homogenates prepared from their spleensrevealed that they had a polymicrobial sepsis dominated by membersof Enterobacteriaceae (three morphologically and biochemically dis-tinct strains of Escherichia coli and a single strain of Klebsiella variicola).Whole-genome sequencing of the E. coli strains disclosed known viru-lence factors, but their representation was not characteristic of that re-ported for enteropathogenic E. coli (EPEC), enterohemorrhagic E. coli(EHEC), enterotoxigenic E. coli (ETEC), or enteroaggregative E. coli(EAEC) isolates (see “57A Mouse Isolates” in table S3).
We performed a histopathologic analysis of the small intestinesand colons of these mice, as well as animals belonging to three controlgroups: one that had received the CsAm consortium 1 day before gavagewith KMF2IgA+ cecal microbiota, another that had been monocolo-nized with a strain of E. coli recovered from the spleens of previouslytreated KMF2IgA+ mice (57A isolate A7 in table S3), and a third groupthat had been maintained germ-free on the Malawian diet. Theproximal colons of untreated recipients of KMF2IgA+ cecal microbiotaexhibited a severe and broadly distributed phenotype with 100% pen-etrance (n = 13 mice surveyed), manifest by atrophic colonic crypts andsurface cuff epithelial cells with disrupted intercellular cohesion (“dis-cohesion”) (note that differentiating postmitotic epithelial cells normallymigrate out of colonic crypts to form a surface cuff epithelium thatsurrounds each crypt orifice; fig. S6, A and B). There were no mitoticfigures or apoptotic bodies in the remnant crypts, indicating a profoundinhibition of proliferation of epithelial cell progenitors. These changesoccurred in the absence of substantial infiltration of innate or adaptiveimmune cells (that is, neutrophils and lymphocytes) (fig. S6B). Thisphenotype was specific for mice colonized with KMF2IgA+cecal micro-biota; it was not observed in germ-free mice maintained on the sameMalawian diet or in mice monocolonized with the E. coli splenic isolate57A.A7 (n = 5 animals surveyed per treatment group; fig. S6, C to E).Pretreatment with the CsAm consortium 1 day before colonization withKMF2IgA+ cecal microbiota substantially ameliorated the phenotype;six of eight animals did not show evidence of severe epithelial damage(crypt and surface epithelial cells had normal morphology; crypts con-tained mitotic figures and abundant differentiated goblet cells; and thesurface cuff epithelium was intact and its cells were cohesive) (fig. S6, Fand G). The colonic crypt phenotype observed in KMF2IgA+ mice re-sembled that seen in germ-free mice with dextran sodium sulfate(DSS)–induced colitis (28). However, the surface epithelial discohesionis not a feature of the DSS injury model (28). Equally remarkable isthe fact that this profound barrier disruption was observed without pre-vious chemical insults or genetic manipulations of the host (10, 22).
There was no evidence of crypt atrophy in the small intestine: in-stead, the major defect in all mice that received KMF2IgA+ cecal micro-biota was a “hobnailed” pattern along the length of the villus that was
www.Science
associated with sloughing of epithelial cells into the lumen (we use theterm “hobnailed” to refer to projection of an epithelial cell above theupper apical boundary of its neighboring cell; see fig. S7A). This phe-notype was not observed in the small intestines of germ-free or E. colimonocolonized controls (fig. S7B). In CsAm precolonized mice, thehobnailed pattern of the epithelium was less pronounced, and therewas no evidence of cellular extrusion along the length of villi.
The villus epithelial phenotype was reminiscent of a pattern ob-served in children with congenital deficiency of epithelial cell adhesionmolecule (EpCAM1) (29, 30). EpCAM is normally localized to thelateral cell borders of villus epithelial cells. The only exception occursat the tips of villi, where cytoplasmic aggregates of EpCAM can bereadily observed. EpCAM functions as a binding partner for multiplecell adhesion molecules (31). Congenital EpCAM1 deficiency is a rareautosomal recessive disorder that presents with refractory diarrheain early childhood, gut barrier dysfunction, and mortality (32). Micecolonized with the cecal microbiota of KMF2IgA+ donors exhibitedmislocalization of EpCAM with abundant cytoplasmic aggregatesof immunoreactive protein apparent in epithelial cells distributedfrom the bases to apices of villi (fig. S7, C and D). Small intestinalcrypts appeared normal. This generalized cytoplasmic aggregation ofEpCAM was not observed in the small intestinal epithelium of germ-free or E. coli monocolonized controls or in CsAm + KMF2IgA+ mice(fig. S7, E to H). These results indicate that this cell adhesion moleculeis a biomarker of the barrier disruption produced by the KMF2IgA+
consortium.To identify which member or members of the KMF2IgA+ consortium
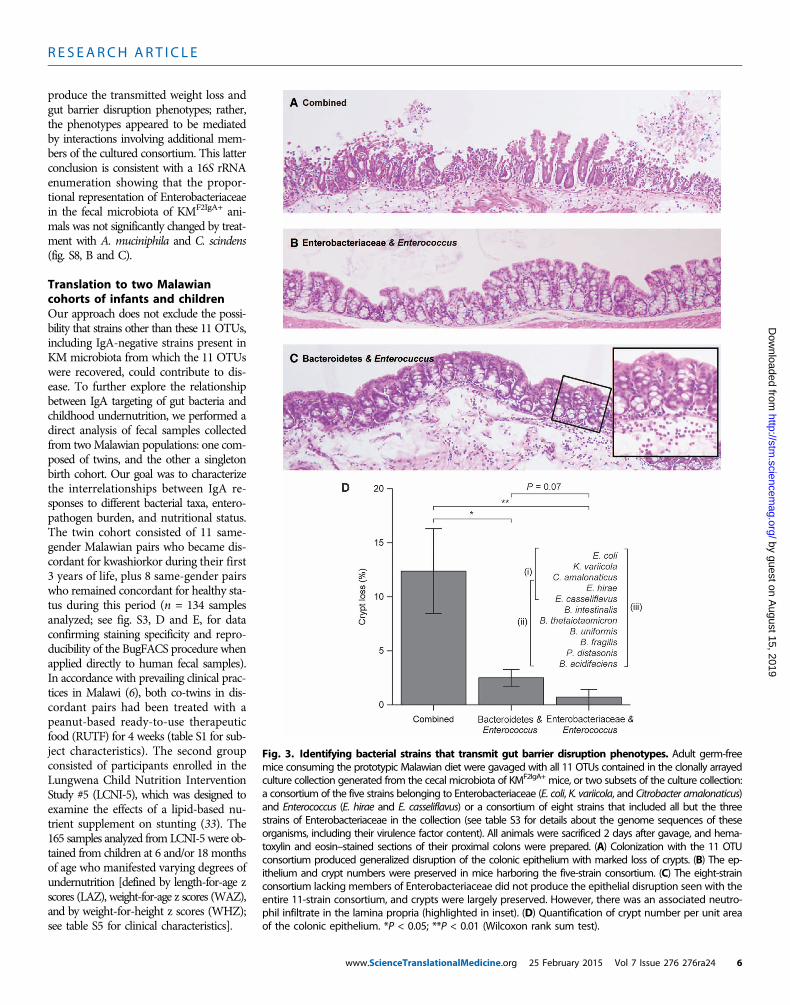
mediate the weight loss and barrier disruption phenotypes, we gen-erated a clonally arrayed bacterial culture collection from this IgA-selected community consisting of 11 operational taxonomic units(OTUs), grouped on the basis of strains sharing ≥97% nucleotidesequence identity (ID) in the V4 region of their 16S rRNA genes. Wesequenced at least two representatives of each OTU (see table S3 fordetails of the draft genome assemblies and their content of knownvirulence factors). Groups of adult male C57BL/6J germ-free micewere colonized with (i) all 11 OTUs, (ii) the collection minus the three97% ID OTUs assigned to Enterobacteriaceae, or (iii) the three mem-bers of Enterobacteriaceae plus two Enterococcus strains assigned toEnterococcus hirae and Enterococcus casseliflavus (note that these twomembers of Enterococcus were also present in the other two consortia)(n = 8 to 9 animals per group). Within 2 days after a single gavage, ani-mals with the complete group of 11 OTUs had lost significantly moreweight than the other two groups (P < 0.0001, Wilcoxon rank sum test),whereas mice colonized with only the Enterobacteriaceae and Enterococ-cus strains exhibited the least weight loss (Fig. 2F). 16S rRNA sequencingof fecal samples obtained from animals in all three groups confirmedthat their communities had the expected content of strains (fig. S8A).The weight loss phenotype correlated with colonic histopathology:crypt loss was greatest in mice harboring all 11 OTUs, whereas thosecolonized with the consortium that lacked the Enterobacteriaceaestrains exhibited an intermediate level of crypt loss compared to theother two treatment groups (Fig. 3, A to D). Examination of the smallintestines demonstrated the characteristic hobnailing pathology inmice receiving the complete, 11-OTU consortium (present in six of nineanimals), whereas this phenotype was absent in the groups receiving theother two consortia (P < 0.01, Fisher’s exact test).
Together, these results establish that the strains of Enterobac-teriaceae represented in the culture collection were not sufficient to
TranslationalMedicine.org 25 February 2015 Vol 7 Issue 276 276ra24 5
R E S EARCH ART I C L E
by guest on August 15, 2019
http://stm.sciencem
ag.org/D
ownloaded from
produce the transmitted weight loss andgut barrier disruption phenotypes; rather,the phenotypes appeared to be mediatedby interactions involving additional mem-bers of the cultured consortium. This latterconclusion is consistent with a 16S rRNAenumeration showing that the propor-tional representation of Enterobacteriaceaein the fecal microbiota of KMF2IgA+ ani-mals was not significantly changed by treat-ment with A. muciniphila and C. scindens(fig. S8, B and C).
Translation to two Malawiancohorts of infants and childrenOur approach does not exclude the possi-bility that strains other than these 11 OTUs,including IgA-negative strains present inKM microbiota from which the 11 OTUswere recovered, could contribute to dis-ease. To further explore the relationshipbetween IgA targeting of gut bacteria andchildhood undernutrition, we performed adirect analysis of fecal samples collectedfrom twoMalawian populations: one com-posed of twins, and the other a singletonbirth cohort. Our goal was to characterizethe interrelationships between IgA re-sponses to different bacterial taxa, entero-pathogen burden, and nutritional status.The twin cohort consisted of 11 same-gender Malawian pairs who became dis-cordant for kwashiorkor during their first3 years of life, plus 8 same-gender pairswho remained concordant for healthy sta-tus during this period (n = 134 samplesanalyzed; see fig. S3, D and E, for dataconfirming staining specificity and repro-ducibility of the BugFACS procedure whenapplied directly to human fecal samples).In accordance with prevailing clinical prac-tices in Malawi (6), both co-twins in dis-cordant pairs had been treated with apeanut-based ready-to-use therapeuticfood (RUTF) for 4 weeks (table S1 for sub-ject characteristics). The second groupconsisted of participants enrolled in theLungwena Child Nutrition InterventionStudy #5 (LCNI-5), which was designed toexamine the effects of a lipid-based nu-trient supplement on stunting (33). The165 samples analyzed from LCNI-5 were ob-tained from children at 6 and/or 18 monthsof age who manifested varying degrees ofundernutrition [defined by length-for-age zscores (LAZ), weight-for-age z scores (WAZ),and by weight-for-height z scores (WHZ);see table S5 for clinical characteristics].
Fig. 3. Identifying bacterial strains that transmit gut barrier disruption phenotypes. Adult germ-free
mice consuming the prototypic Malawian diet were gavaged with all 11 OTUs contained in the clonally arrayedculture collection generated from the cecal microbiota of KMF2IgA+ mice, or two subsets of the culture collection:a consortium of the five strains belonging to Enterobacteriaceae (E. coli, K. variicola, and Citrobacter amalonaticus)and Enterococcus (E. hirae and E. casseliflavus) or a consortium of eight strains that included all but the threestrains of Enterobacteriaceae in the collection (see table S3 for details about the genome sequences of theseorganisms, including their virulence factor content). All animals were sacrificed 2 days after gavage, and hema-toxylin and eosin–stained sections of their proximal colons were prepared. (A) Colonization with the 11 OTUconsortium produced generalized disruption of the colonic epithelium with marked loss of crypts. (B) The ep-ithelium and crypt numbers were preserved in mice harboring the five-strain consortium. (C) The eight-strainconsortium lacking members of Enterobacteriaceae did not produce the epithelial disruption seen with theentire 11-strain consortium, and crypts were largely preserved. However, there was an associated neutro-phil infiltrate in the lamina propria (highlighted in inset). (D) Quantification of crypt number per unit areaof the colonic epithelium. *P < 0.05; **P < 0.01 (Wilcoxon rank sum test).www.ScienceTranslationalMedicine.org 25 February 2015 Vol 7 Issue 276 276ra24 6

R E S EARCH ART I C L E
A strong IgA response to Enterobacteriaceae is indicativeof a pathogenic communitySamples obtained from members of discordant twin pairs at the timewhen one co-twin developed kwashiorkor had significantly more pos-itive IgA indices for Enterobacteriaceae than did members of concordanthealthy pairs (P < 0.01, Wilcoxon rank sum test; Fig. 4, A and B; see table
by guest on August 15, 2019
http://stm.sciencem
ag.org/D
ownloaded from
S4A for the IgA indices for all members ofEnterobacteriaceae, as well as IgA indicesfor other family- and species-level bacterialtaxa identified in the BugFACS analysis).During RUTF treatment, the IgA responseto Enterobacteriaceae decreased significantlyin both kwashiorkor and healthy co-twinsin discordant pairs (Fig. 4C). This latter find-ing provided another demonstration of theeffect of a nutrient-sufficient diet on reduc-ing mucosal immune responses to membersof this bacterial family (see Fig. 1A for acomparison of the IgA index for Entero-bacteriaceae in KM versus KS mice).
We cultured purified IgA+ consortiafrom kwashiorkor co-twins in five of thediscordant pairs under aerobic conditionsto recover and characterize Enterobacteria-ceae that were the targets of their gut mu-cosal IgA responses. Sequencing full-length16S rRNA gene amplicons establishedthat members of Escherichia dominatedthese cultures. Whole-genome shotgun se-quencing of the dominant cultured mor-photypes followed by screening of thecontigs against the 2311 genes in the Viru-lence Factor Database (34) disclosed that thethree sequenced isolates from kwashiorkorco-twin 46’s IgA+ consortium and the twosequenced isolates from kwashiorkor co-twin 26’s IgA+ consortium were EAEC(table S3). The two sequenced strains fromkwashiorkor co-twin 138 and the two strainsfrom kwashiorkor co-twin 207 were ETEC,whereas the kwashiorkor co-twin fromtwin pair 80 harbored an atypical EPECstrain (see table S3 for virulence factorspresent in these sequenced isolates).
We selected fecal microbiota sam-ples, collected at the time of diagnosis withkwashiorkor, from two of these discordanttwin pairs for follow-up functional studies:twin pair 46, where the degree of IgA tar-geting of Enterobacteriaceae was substan-tially higher in the kwashiorkor co-twincompared to his healthy co-twin, and twinpair 80, where there were negligible differ-ences in IgA indices for Enterobacteriaceaebetween the undernourished and healthysiblings (Fig. 4B). IgA+ consortia purifieddirectly from the kwashiorkor co-twin’s fe-cal microbiota, from the healthy co-twin’s
www.Science
microbiota, or a 1:1 mixture of the kwashiorkor and healthy co-twin’sIgA+ microbes was transplanted into separate groups of germ-free ani-mals (n = 5 to 7 animals per treatment group per donor microbiota; totalof six groups). All recipient mice were fed the representative Malawiandiet. Mice receiving the IgA+ consortium recovered from the kwashiorkorco-twin’s microbiota from twin pair 46 lost significantly more weight than
A**
**
Healthyco-twins indiscordant
pairs
Kwashiorkorco-twins indiscordant
pairs
Twinsconcordantfor healthy
status
*
B
C D
Ent
erob
acte
riace
ae I
gA in
dex
–0.5
0
0.5
1.0
At diagnosisof kwashiorkor
On RUTF
Ent
erob
acte
riace
ae Ig
A in
dex
0
0.1
0.2
0.3
0.4
0.5 Healthy co-twins
IgA+ consortium
% S
tart
ing
wei
ght a
t 13
days
60
65
70
75
80
85
90
Kwashiorkor Mix HealthyIgA+ consortium
% S
tart
ing
wei
ght a
t 13
days
60
65
70
75
80
85
90
Kwashiorkor Mix Healthy
****
Twin pair 46 Twin pair 80
EKwashiorkor co-twins
Pre
-dia
gnos
isD
iagn
osis
Wee
k 2
of R
UTF
Wee
k 4
of R
UTF
1 m
o po
st-R
UTF
Pre
-dia
gnos
isD
iagn
osis
Wee
k 2
of R
UTF
Wee
k 4
of R
UTF
1 m
o po
st-R
UTF
Kwashiorkor co-twins Healthy co-twins Twin pair 46 Twin pair 80
n = 6 10 6 11 7 8 9 8 10 7
Enterobacteriaceae
Streptococcaceae
Erysipelotrichaceae
Lachnospiraceae
Veillonellaceae
Lactobacillaceae
Prevotellaceae
Bacteroidaceae
Fig. 4. Enterobacteriaceae are targeted by the gut mucosal IgA response in children from theMalawian twin study. (A) IgA responses were defined by BugFACS of fecal samples obtained from 11
twin pairs discordant for kwashiorkor. Data from five time points are shown. The first column representssamples taken 1.2 ± 0.6 months before diagnosis of kwashiorkor. The second column represents samplestaken at the time of diagnosis. The third and fourth columns are samples taken 2 and 4 weeks after initia-tion of treatment with RUTF, whereas the fifth column represents fecal microbiota characterized 1 monthafter the completion of RUTF therapy. Data represent mean values for the indicated number (n) ofkwashiorkor co-twins and healthy co-twins whose fecal samples were available, and are presented inthe form of a bubble plot. See tables S1 and S4 for clinical characteristics and details of the data sets,including IgA indices for individual taxa identified as present within each family-level taxonomic group foreach individual fecal sample analyzed. (B) At the time of diagnosis, the IgA index for Enterobacteriaceaewas significantly higher in co-twins with kwashiorkor in discordant pairs than in twin pairs concordant forhealthy status (data from twins concordant for healthy status represent the averaged IgA indices of anindividual’s fecal specimens obtained between 6 and 24 months of age to allow for comparison withdiscordant twins of varying ages at the time of diagnosis). Purple and green circles highlight IgA indicesfor co-twins in discordant pairs 46 and 80, who were used for microbial adoptive transfer experiments[see (D) and (E)]. **P < 0.01 (Wilcoxon rank sum test). (C) Treatment of kwashiorkor co-twins in all 11discordant pairs shown in (A and B) with RUTF resulted in a significant decrease in the IgA index scorefor Enterobacteriaceae. *P < 0.05 (Wilcoxon rank sum test). Data represent the average IgA index scoresfor samples obtained 2 and 4 weeks after initiation of RUTF treatment. Mean values ± SEM are plotted.(D) Germ-free mice colonized with a BugFACS-purified IgA+ consortium from the kwashiorkor child in twinpair 46 lost more weight than mice colonized with either the IgA+ consortium purified from the fecal mi-crobiota of his healthy co-twin or a mixture of the two IgA+ populations. **P < 0.01 (Wilcoxon rank sum test).(E) Colonization of germ-free mice with KwashIgA+, HealthyIgA+, or MixIgA+ consortia prepared from discordanttwin pair 80, whose members had similar IgA index values for Enterobacteriaceae [see (B)], did not exhibitsignificant differences in weight loss (n = 5 to 7 mice per treatment group). All mice were fed the Malawiandiet starting 1 week before gavage with the IgA+ consortia. Body weights at the time of sacrifice 13 daysafter gavage were used to plot the data shown (each mouse represented by a circle).TranslationalMedicine.org 25 February 2015 Vol 7 Issue 276 276ra24 7

R E S EARCH ART I C L E
by guest on August 15, 2019
http://stm.sciencem
ag.org/D
ownloaded from
didmice receiving his healthy co-twin’s IgA+ consortiumor the IgA+mix(P < 0.01 for comparison of kwashiorkor IgA+ consortium to mix IgA+
andhealthy IgA+ consortia,Wilcoxon rank sum test; Fig. 4D). In contrast,there was no significant difference in weight loss between recipientsof the healthy co-twin’s IgA+, the kwashiorkor co-twin’s IgA+, ormixIgA+ consortia recovered from twin pair 80 (Fig. 4E).
We used RandomForests, a machine-learning algorithm, to identifytaxa that were most associated with weight phenotypes among the sixdifferent treatment groups. Analysis of 16S rRNA data sets generatedfrom fecalmicrobiota samples collected 1 day before sacrifice frommicecolonized with the various combinations of IgA+ consortia purified fromtwin pair 46 and 80 donor microbiota (n = 36 samples from 36 animals)disclosed that Enterobacteriaceae were most discriminatory, with highestrelative abundances in the fecal microbiota of animals exhibiting thegreatestweight loss (fig. S9). The results provided additional evidence thata high positive IgA index to Enterobacteriaceae is indicative of a commu-nity capable of transmitting disease, at least in a subset of this cohort.
Identifying interrelationships between IgA responsesto bacterial taxa, enteropathogen burden, and nutritionalstatus in the LCNI-5 singleton cohortRecent reports have used multiplex polymerase chain reaction (PCR)assays to characterize the relationship between enteropathogen burdenand diarrheal disease in children living in low-income countries (35, 36).The LCNI-5 singleton cohort, sampled at 6 and 18 months of age, andexhibiting a broad range of nutritional phenotypes (anthropometricscores), provided an opportunity to systematically assess the extent towhich enteropathogen burden correlates with nutritional status and IgAresponses. An expanded TaqMan Array Card (35) was used to assay fecalsamples collected from 114 individuals for 39 genes that are known mark-ers for bacterial and viral pathogens, helminths, and protozoans. Path-ogen carriage rates were very high in this population (see table S6, A andB, for summary and individual subject results, respectively). The totalnumber of virulence factors detected within an individual’s fecal micro-biota negatively correlated with nutritional status at 18 months. Bacterialvirulence factors were the major contributors [when these factors wereconsidered alone, Spearman r value of −0.37 for WHZ (P = 0.005), rvalue of −0.29 for WAZ (P = 0.032); correlation was not significant forLAZ]. No significant correlations between WHZ or WAZ and bacterialpathogen burden were identified at 6 months of age, although a signifi-cant correlation existed between LAZ and viral pathogen burden (tableS6A; r −0.23, P = 0.019).
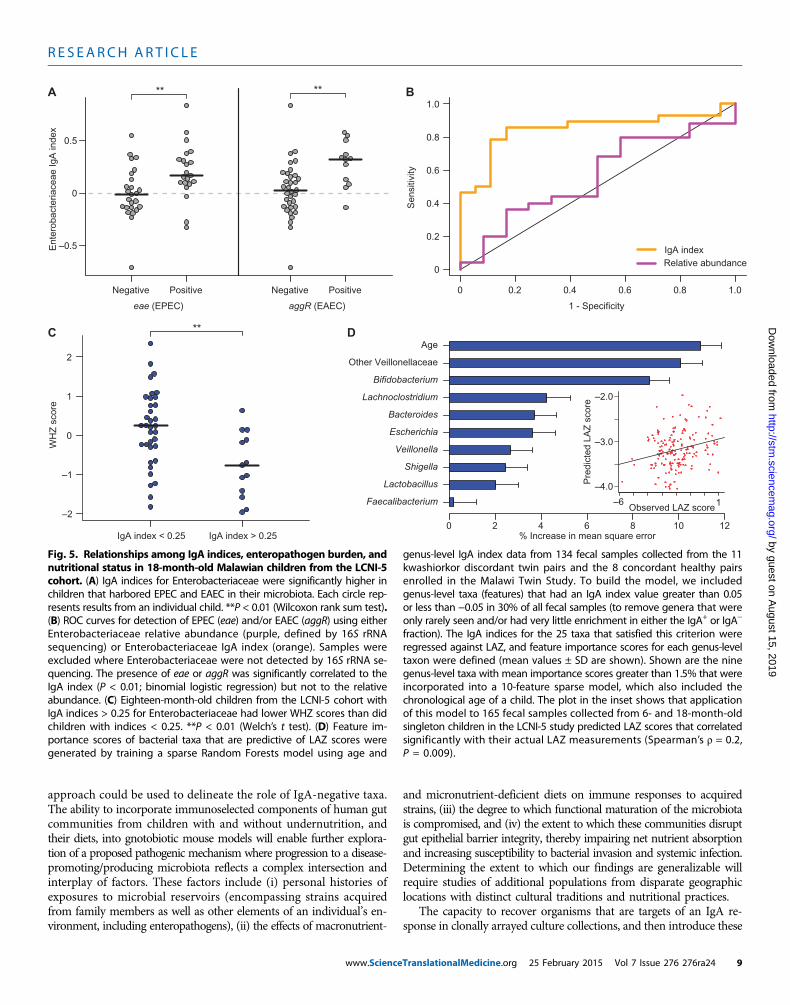
Using this molecular diagnostic method, we examined whether IgAresponses (table S4B) correlated with enteropathogen representation inthe fecal microbiota of LCNI-5 participants. The most statistically sig-nificant relationship involved Enterobacteriaceae: the IgA index to thisfamily was significantly higher when EPEC or EAECwas present (as judgedby a positive test for eae and aggR, respectively) (P < 0.01, Wilcoxon ranksum test; Fig. 5A; the relationship was not significant for ETEC). Thereceiver operating characteristic (ROC) curve presented in Fig. 5Bshows that an IgA index cutoff of ≥0.05 had a specificity and sen-sitivity of 83 and 86%, respectively, for the presence of EPEC (eae+)or EAEC (aggR+). In contrast, the relative abundance of Entero-bacteriaceae defined by 16S rRNA analysis of the input fecal sampleused for BugFACS did not correlate with the presence of EPEC orEAEC (P > 0.05, binomial logistic regression; Fig. 5B).
In addition to insights about the presence or absence of these en-teropathogens, a positive IgA index to Enterobacteriaceae provided
www.Science
additional information about health status. First, we tested a range ofcutoffs for the IgA index and found that a value of 0.25 best discri-minated healthy from undernourished 18-month-old children inLCNI-5 [P < 0.01 (WHZ) and P < 0.05 (WAZ), Welch’s t test; Fig.5C]. Second, combining a positive test for eae (EPEC) and an IgA index>0.25 revealed a statistically significant relationship to LAZ scores (P <0.05, Wilcoxon rank sum test; table S7). Third, turning to 6-month-oldinfants, we observed that a positive test for eae and an IgA index >0.25was associated with better (more positive) LAZ andWAZ scores com-pared to infants with IgA indices <0.25 (P < 0.01,Wilcoxon rank sumtest; table S7). Fourth, 6-month old children with high IgA indices (re-gardless of pathogen carriage) had significantly better LAZ scores at18months compared to thosewith an index<0.25 (P = 0.0001,Wilcoxonrank sum test; n= 20 and 25, respectively). In addition, theworsening ofLAZ scores between 6 and 18months of age was significantly greater inchildren with the lower IgA indices for Enterobacteriaceae [−0.58 ±0.13 (mean ± SEM) in children with IgA indices <0.25 versus −0.15 ±0.14 in children with indices >0.25, P = 0.03; table S7]. In light of thehigh carriage rates of EPEC and EAEC at 6 months (93% for eae oraggR), these data suggest that the ability tomount a robust IgA responseat an early age in children harboring these enteropathogens may helpprotect against growth faltering.
Finally, to further characterize the relationship between IgA re-sponse and nutritional status, we used Random Forests to identify taxawhose IgA targeting was correlated with LAZ scores in the Malawiantwin cohort. Nine genus-level taxa with mean feature importance scoresgreater than 1.5% were incorporated into a 10-feature sparse model thatalso included the chronologic age of a child (Fig. 5D). This RandomForests–based model was then applied to the LCNI-5 cohort; the resultsrevealed that the model’s predicted LAZ scores correlated with observedLAZ measurements (Spearman’s r = 0.20; P = 0.009). In addition tomembers of Enterobacteriaceae, taxa belonging to two groups in theFirmicutes, the family Veillonellaceae and the genus Lachnoclostridium(of which C. scindens is a member), were major contributors to the ac-curacy of prediction (Fig. 5D). As with Enterobacteriaceae, there was anage effect with Veillonellaceae; IgA indices for this family significantlyand positively correlated with LAZ at 6 months (Spearman’s r = 0.25;P = 0.017), but not at 18 months.
DISCUSSION
Integrating our gnotobiotic mouse data with data from the Malawiancohorts, we find that children with undernutrition harbor disease-promoting/producing (dysbiotic) gut microbial communities char-acterized by disrupted normal postnatal assembly (immaturity) (5, 6),targeting of specific bacterial taxa by the IgA response, and increasedenteropathogen burden. These targets of the gut mucosal IgA responses,prominently represented by members of Enterobacteriaceae and asso-ciated enteropathogenic strains, transmit a weight loss phenotype anddisrupt gut barrier function in gnotobiotic mice through mechanismsthat are not solely mediated by Enterobacteriaceae, but rather requireinteractions among members of this family and other IgA-targeted com-ponents of the microbiota. Moreover, we have identified IgA-targetedbacterial taxa (C. scindens, A. muciniphila) that promote health by amelio-rating the effects of KMIgA+ consortia.
Although our gnotobiotic mouse studies focused on the contribu-tions of IgA-targeted bacterial taxa to disease pathogenesis, a similar
TranslationalMedicine.org 25 February 2015 Vol 7 Issue 276 276ra24 8
R E S EARCH ART I C L E
by guest on August 15, 2019
http://stm.sciencem
ag.org/D
ownloaded from
approach could be used to delineate the role of IgA-negative taxa.The ability to incorporate immunoselected components of human gutcommunities from children with and without undernutrition, andtheir diets, into gnotobiotic mouse models will enable further explora-tion of a proposed pathogenic mechanism where progression to a disease-promoting/producing microbiota reflects a complex intersection andinterplay of factors. These factors include (i) personal histories ofexposures to microbial reservoirs (encompassing strains acquiredfrom family members as well as other elements of an individual’s en-vironment, including enteropathogens), (ii) the effects of macronutrient-
www.Science
and micronutrient-deficient diets on immune responses to acquiredstrains, (iii) the degree to which functional maturation of the microbiotais compromised, and (iv) the extent to which these communities disruptgut epithelial barrier integrity, thereby impairing net nutrient absorptionand increasing susceptibility to bacterial invasion and systemic infection.Determining the extent to which our findings are generalizable willrequire studies of additional populations from disparate geographiclocations with distinct cultural traditions and nutritional practices.
The capacity to recover organisms that are targets of an IgA re-sponse in clonally arrayed culture collections, and then introduce these
eae (EPEC)
Ent
erob
acte
riace
ae Ig
A in
dex
–0.5
0
0.5
Negative Positive Negative Positive 0 0.2 0.4 0.6 0.8 1.0
0
0.2
0.4
0.6
0.8
1.0
1 - Specificity
Sen
sitiv
ity
IgA indexRelative abundance
WH
Z s
core
–2
–1
0
1
2
IgA index < 0.25 IgA index > 0.25
Faecalibacterium
Lactobacillus
Shigella
Veillonella
Escherichia
Bacteroides
Lachnoclostridium
Bifidobacterium
Other Veillonellaceae
Age
% Increase in mean square error0 2 4 6 8 10 12
C D**
–6 1
–4.0
–3.0
–2.0
Observed LAZ score
Pre
dict
ed L
AZ
sco
re
A B** **
aggR (EAEC)
Fig. 5. Relationships among IgA indices, enteropathogen burden, andnutritional status in 18-month-old Malawian children from the LCNI-5
genus-level IgA index data from 134 fecal samples collected from the 11kwashiorkor discordant twin pairs and the 8 concordant healthy pairs
cohort. (A) IgA indices for Enterobacteriaceae were significantly higher inchildren that harbored EPEC and EAEC in their microbiota. Each circle rep-resents results from an individual child. **P < 0.01 (Wilcoxon rank sum test).(B) ROC curves for detection of EPEC (eae) and/or EAEC (aggR) using eitherEnterobacteriaceae relative abundance (purple, defined by 16S rRNAsequencing) or Enterobacteriaceae IgA index (orange). Samples wereexcluded where Enterobacteriaceae were not detected by 16S rRNA se-quencing. The presence of eae or aggR was significantly correlated to theIgA index (P < 0.01; binomial logistic regression) but not to the relativeabundance. (C) Eighteen-month-old children from the LCNI-5 cohort withIgA indices > 0.25 for Enterobacteriaceae had lower WHZ scores than didchildren with indices < 0.25. **P < 0.01 (Welch’s t test). (D) Feature im-portance scores of bacterial taxa that are predictive of LAZ scores weregenerated by training a sparse Random Forests model using age and
enrolled in the Malawi Twin Study. To build the model, we includedgenus-level taxa (features) that had an IgA index value greater than 0.05or less than −0.05 in 30% of all fecal samples (to remove genera that wereonly rarely seen and/or had very little enrichment in either the IgA+ or IgA−
fraction). The IgA indices for the 25 taxa that satisfied this criterion wereregressed against LAZ, and feature importance scores for each genus-leveltaxon were defined (mean values ± SD are shown). Shown are the ninegenus-level taxa with mean importance scores greater than 1.5% that wereincorporated into a 10-feature sparse model, which also included thechronological age of a child. The plot in the inset shows that applicationof this model to 165 fecal samples collected from 6- and 18-month-oldsingleton children in the LCNI-5 study predicted LAZ scores that correlatedsignificantly with their actual LAZ measurements (Spearman’s r = 0.2,P = 0.009).
TranslationalMedicine.org 25 February 2015 Vol 7 Issue 276 276ra24 9
R E S EARCH ART I C L E
organisms into gnotobiotic mice fed different diets, provides a poten-tially powerful tool in a preclinical discovery platform designed to fur-ther characterize the combinatorial interactions that are required toeffect pathology and to identify disease-modifying as well as disease-preventing next-generation probiotics that are naturally occurring gutorganisms adapted to the gut ecosystems of individuals living in areaswhere childhood undernutrition is rampant.
Finally, our studies suggest that performing time series studies of IgAresponses to gut bacteria during early childhood in healthy versus under-nourished individuals could be used to characterize the normal codeve-lopment of mucosal immunity/barrier function and the microbiota,stratify populations at risk for or with already manifest undernutrition,define the efficacy (including thedurability) of current and future therapeuticinterventions, andperhapsbetter define theoptimal timingof vaccinationsin populations where undernutrition is prevalent [for example, (37, 38)].
by guest on August 15, 2019
http://stm.sciencem
ag.org/D
ownloaded from
MATERIALS AND METHODS
Human study designHuman study protocols were approved by the College of MedicineResearch Ethics Committee of the University of Malawi, the EthicsCommittee at the Pirkanmaa Hospital District, Finland, and the HumanResearch ProtectionOffice ofWashingtonUniversity School ofMedicine.
Malawi Twin Study. This clinical trial has been described in aprevious publication (6). Briefly, twins were recruited from five vil-lages in southern Malawi: Makhwira, Mitondo, M’biza, Chamba, andMayaka. A team of American and local health care workers visited eachsite on amonthly basis, measured height and weight, and screened chil-dren for pitting edema of the lower extremities. Fecal specimens werecollected every 3months from twin pairswho remained healthy. In twinpairs where one co-twin developed kwashiorkor, both co-twins wereswitched to a peanut-based RUTF. Sampling of fecal specimens was in-creased to biweekly while children were receiving RUTF. Fecal spec-imens were flash-frozen in liquid nitrogen shortly after they wereproduced and stored at −80°C before analysis.
LCNI-5 Study. Details of this study may be found at clinicaltrials.gov(ID: NCT00524446) (33). Infants were sampled at 6 months of age be-fore any nutritional intervention, whereas samples obtained at 18 monthswere from members of group D (corn-soy blend, which had no statis-tically significant effect on growth phenotypes).
Mouse study designAll experiments involvingmicewere performedwith protocols approvedby the Washington University Animal Studies Committee. Assignmentof mice tomicrobial and diet treatment groups was not blinded becausethe different diets and the different microbial consortia used were de-liberately assembled and administered by the same investigators whoperformed the animal husbandry and collected the phenotypic data.However, immunostained slides were evaluated in a blinded manner.The numbers of mice assigned to each treatment group in each exper-iment and the number of independent repetitions of a given experimen-tal design are described in the text and below, as are the statistical testsused to determine the significance of observed differences.
Gnotobiotic mouse experimentsThe Malawian diet was based on food consumption patterns in thecatchment area and consisted primarily of corn flour, mustard
www.ScienceT
greens, yellow onions, and tomatoes purchased from Whole FoodsMarket (stores located in St. Louis, MO). Details of how the diet wasassembled/cooked are described in an earlier publication (6). Batchesof diet were aliquoted (500 or 750 g) into plastic bags that were vacuum-sealed, and then placed in a second bag and sterilized by g-irradiation(STERIS Co.). Food was stored for up to 12 months at 4°C. Nutritionalanalyses were performed by NP Analytical Laboratories.
Adult germ-free male C57BL/6J mice were maintained on a strict12-hour light cycle (lights on at 6:00 a.m.) in flexible plastic gnotobioticisolators (Class Biologically Clean Ltd.). Mice were weaned onto anautoclaved, standard mouse chow diet low in fat and rich in plant poly-saccharides (B&K Universal, diet 7378000). Seven days before introduc-tion of human gut microbes by gavage, animals were switched to theMalawian diet or, in the case of controls, maintained on the mouse chow.
Aliquots (about 100 to 200 mg) of previously frozen fecal samples,obtained from members of discordant twin pairs at the time of diag-nosis of kwashiorkor in one of the co-twins, were suspended in 1 ml ofsterile phosphate-buffered saline (PBS) supplemented with 0.1% cys-teine under anaerobic conditions, vortexed vigorously for 5 min at roomtemperature, placed on ice, and then allowed to undergo gravity sedimen-tation for 5 to 10 min. A 200-ml aliquot of this suspension was subse-quently introduced into germ-free mice by gavage [see (6) for detailsof sample preparation, handling, and gavage protocols].
Sample preparation for BugFACSMouse fecal pellets (~10 to 50 mg wet weight), frozen at −80°C imme-diately after collection, were suspended in sterile PBS by vortexing,placed on ice, and allowed to sediment by gravity for 5 to 10 min. A200-ml aliquot of the resulting clarified fecal suspension was passedthrough a 70-mm sterile nylon mesh filter into a new sterile tube.Bacteria that passed through the filter were then pelleted by centrif-ugation (10,000g for 1 min at 24°C). The cell-free supernatant wasremoved; the pellet was washed by resuspension in an additional1ml of PBS and again centrifuged. The resulting pellet was resuspendedin 100 ml of PBS containing a 1:50 dilution of polyclonal goat anti-mouse IgA conjugated to DyLight 649 (Abcam) and incubated on icefor 30 min. The suspension was then washed with 1 ml of sterile PBS,pelleted again by centrifugation, and 200 ml of 0.9%NaCl/ 0.1MHepesbuffer (pH 7.2) containing a 1:4000 dilution of SYTO BC (Invitrogen/Life Technologies) was added.
Human fecal samples (20- to 100-mg aliquots), previously frozenat −80°C, were processed as above and stained with a goat anti-humanIgA antibody conjugated to DyLight 649 (Abcam; note that there wasno significant relationship between the weight of the fecal aliquot andIgA staining efficiency).
Samples were sorted using a FACSAria III (BD Biosciences) instru-ment in a laminar flow biocontainment hood (BioProtect IV Safety Cab-inet, Baker Co.). Fecal samples were analyzed without the use of a neutraldensity filter to allow the maximum degree of sensitivity for small parti-cles. Threshold settingswere set to theminimal allowable voltage for sidescatter (SSC). The gating strategies used to collect different bacterialpopulations are shown in fig. S1. We collected 20,000 to 50,000 eventsfrom the IgA+ population and a minimum of 100,000 events from theIgA− and input populations into sterile tubes (the terms “events” and “mi-crobes” are used interchangeably). Each fraction (typically 50 to 200 ml)was stored at −20°C before sequencing of bacterial 16S rRNA genes.
Multiple precautions were taken to minimize potential contamina-tion of sorted fractions: (i) freshly autoclaved PBS was used for sheath
ranslationalMedicine.org 25 February 2015 Vol 7 Issue 276 276ra24 10

R E S EARCH ART I C L E
by guest on August 15, 2019
http://stm.sciencem
ag.org/D
ownloaded from
fluid; (ii) the flow cytometer was sterilized according to the manufac-turer’s recommended protocol; (iii) the sheath fluid filter was replacedroutinely; and (iv) 16S rRNA analysis was performed on samplescollected from the flow cytometer droplet stream before and afterevery sort, thus permitting identification of any sequences that did notoriginate from the sorted sample.
A simplified in vitro system using a monoclonal IgA antibody gen-erated against Bacteroides thetaiotaomicron (39) verified that this ap-proach could be used to isolate and quantify IgA-bound bacteria (fig.S2, A to G). Analysis of fecal samples collected from adult convention-ally raised wild-type C57BL/6J mice revealed robust IgA targetingto members of the microbiota, whereas analysis of fecal communi-ties obtained from C57BL/6J Rag1−/− animals that lack B and T cellsproduced no IgA staining above background, confirming the specific-ity of the BugFACS procedure (fig. S3A).
Bacterial 16S rRNA gene analysesDNA was prepared from fecal samples by bead beating, followed byphenol-chloroform extraction. Bacterial V2 16S rRNA gene ampliconswere generated using barcoded primers. PCR was performed witheither 5 PRIME HotMaster Mix or Invitrogen High Fidelity PlatinumTaq according to the manufacturer’s protocols and with cycling con-ditions described in (40).
In the case of BugFACS, we added 1 ml of the IgA+, IgA−, or inputfractions directly to the PCRMasterMix containingPCRprimers (threereplicate 20-ml reactions per sample). Cycling conditions consisted of95°C for 10 min followed by 30 to 35 cycles of 95°C for 20 s, 52°Cfor 20 s, and 65°C for 60 s. “No-template” controls were run with everysample to ensure that therewasno contaminationof the barcodedprimersor reagents. PCR products were subjected to gel electrophoresis to con-firm the presence of amplicons, which were then quantified (Qubit,Invitrogen). Barcoded amplicons were pooled from the different sam-ples for subsequent multiplex pyrosequencing (454 Titanium FLXchemistry; see tables S1 and S4 for information about the data sets).
Pyrosequencer reads were demultiplexed and clustered on thebasis of 97% ID against the Greengenes reference OTU database (41).De novo OTUs were generated from unmatched sequences using theUCLUST method in QIIME version 1.5 (42). Data were filtered so thateach sample had at least 1000 reads, and each 97% ID OTU had to beobserved at least twice across all samples. We assigned taxonomy toOTUs using RDP 2.4 trained on a custom database derived from (i) se-quence data downloaded from the Greengenes “Isolated named strains16S” database and (ii) modified phylogeny from the National Centerfor Biotechnology Information taxonomy database (41, 43). Data wererarefied to a depth of 1000 reads per sample for analyses that requiredthe use of 97% ID OTU level taxonomy.
In calculating the IgA index, we first summarized taxonomy to phy-lum, class, order, family, genus, and species levels. The threshold used fordesignating that a taxon was called “Present” was ≥0.1% relative abun-dance in either the IgA+, IgA−, or input fractions. A pseudocount (equalto 0.001, which was the lower limit of detection of fractional represen-tation in the community) was then added to every taxon detected inboth the IgA+ and IgA− fractions generated from every fecal sample.The sum of the fractional abundance of a given taxon and the pseudo-count was log-transformed before performing a paired Wilcoxon test[using R (44)] comparing the significance of differences in abundancesof that taxon in the IgA+ to IgA− fractions prepared from a group ofsamples. If a taxon was not detected in a given sample, that sample was
www.ScienceT
excluded from analysis of that taxon. IgA index values of zero representsamples in which a taxon was detected in equal proportions in both theIgA+ and IgA− fractions, or was detected in the input fraction but notthe IgA+ or IgA− fractions.
The following criteria were used to define sequences as arisingfrom “contaminants” from the flow cytometer: (i) after OTU pickingand taxonomy assignments, contaminating OTUs had to constitute>1% of the pre- and postsort sheath flow-through sequences; (ii) theseOTUs had to be detected on at least three separate sorting runs; (iii) ifan OTU met criteria (i) and (ii) and was assigned to a genus, all OTUswith the same genus-level assignment were removed from our analysisof BugFACS data. Samples with fewer than 1000 reads after removingcontaminating sequences were not included in the analysis.
Transplantation of IgA+ microbial populationsinto gnotobiotic miceWhen sorting gut microbes for subsequent transplantation of the IgA+
population into mice, we maintained the viability of bacteria by mini-mizing exposure to oxygen as follows: (i) all sample preparation steps,including staining with SYTO BC and the DyLight 649–conjugatedgoat anti-mouse IgA or goat anti-human IgA, were performed in ananaerobic chamber (Coy Laboratory Products; atmosphere composedof 75% N2/20% CO2/5% H2); (ii) all buffers used during the prepara-tion and staining steps (PBS and 0.1 M Hepes/0.9% NaCl) were sup-plemented with 0.1% cysteine HCl; (iii) all buffers were stored in theanaerobic chamber for a minimum of 48 hours before use; (iv) plastic-ware used for preparing samples was stored under anaerobic conditionsfor a minimum of 3 days before use; (v) for steps requiring centrifuga-tion outside of the anaerobic chamber, microbes were first placed insealed 2-ml screwtop tubes (Axygen) before exiting the chamber, andthen returned to the chamber before additional processing.
Fecal pellets were harvested from KM and HM mice 42 days afterthey had been gavaged with the corresponding human co-twin’s fecalmicrobiota. We combined filtered fecal suspensions from three micein the KM or in the HM group to generate a pooled microbiota thatwas subsequently used to purify IgA+ consortia that were introducedinto germ-free recipients to produce KMIgA+ and HMIgA+ animals. Sim-ilarly, KMF2IgA+ fractions were generated from the combined fecalsupernatants from five KMIgA+ mice. (KMF2IgA+ animals are the thirdgeneration of mice harboring a microbiota derived from one of theMalawian co-twins, and the second generation of mice receiving anIgA-enriched consortium.)
Note thatmicrobes were sorted with SSC, or with both forward scat-ter (FSC) and SSC thresholds at the minimal possible settings. Once asufficient number of events were collected, we centrifuged the sortedmicrobes (10,000g, 5 min, 4°C), aspirated the supernatant, and resus-pended the microbial cell pellet in a volume of PBS/0.1% cysteine suf-ficient to capture 100,000 events in 200 ml. Sorted bacteria were sealed intubes in the anaerobic chamber, brought to the gnotobiotic facility(10-min trip), introduced into the isolator after sterilization of the tube’ssurface (Clidox), and then gavaged into germ-free mouse recipients.
Other assays of mucosal immune functionWe vaccinated KM and HM mice with oral cholera toxin and oval-bumin (45) on days 21, 28, and 35 after gavage of human donor mi-crobiota in one experiment and on day 21 in a repeat experiment. Eachdose of vaccine contained 10 mg of cholera toxin and 10 mg of hen eggovalbumin (Sigma) dissolved in sodium bicarbonate (pH 8.0). Vaccines
ranslationalMedicine.org 25 February 2015 Vol 7 Issue 276 276ra24 11

R E S EARCH ART I C L E
by guest on August 15, 2019
http://stm.sciencem
ag.org/D
ownloaded from
were mixed and filter-sterilized by passage through a 0.22-mm-diameterfilter, and then administered in a volume of 200 ml by gavage. No re-producible differences were observed between KM and HM mice asjudged by serum enzyme-linked immunosorbent assay (ELISA).
Serum cytokine analysisSera were collected from mice at the time of sacrifice by retro-orbitalphlebotomy and frozen at −80°C until use. Serum cytokine analysiswas performed with a MAGPIX plate reader (Bio-Rad) and Bio-PlexPro Assay Kit according to the manufacturer’s instructions.
Histochemical and immunohistochemical analysesThe small intestine and colon were flushed and fixed overnight with4% paraformaldehyde in PBS, and then transferred to 70% ethanol forstorage. The fixed small intestine was cut open along its cephalocau-dal axis and rolled up with the villi pointing outward. These “Swissrolls” were secured by embedding in 2% agar. The material was thenparaffin-embedded and cut into 5-mm-thick sections that were stainedwith hematoxylin and eosin. The proximal third of the colon was alsoopened along its cephalocaudal axis and pinned lumen-side up onparaffin; multiple colons from animals in the same treatment groupwere stacked one on the other, secured with agar, and then stack-embedded in paraffin before sectioning and staining.
Small and large intestine samples were examined, in a blindedfashion, for epithelial disruption, crypt number, and neutrophilicinfiltrate (in the crypt or lamina propria). The hobnailing patternof small intestinal epithelium was also noted when present.
Cellular patterns of EpCAM localization were defined by immuno-staining. Deparaffinized sections of small intestine were incubated witha 1:500 dilution of a rabbit polyclonal anti-human EpCAM (kindly sup-plied by M. Udey, Dermatology Branch, Center for Cancer Research,National Institutes of Health) followed by a 1:500 dilution of donkeyanti-rabbit Alexa Fluor 594 IgG1 (Invitrogen). Immunostained slideswere evaluated in a blinded manner and scored for the presence andlocation of apical cytoplasmic aggregates in the epithelium below thevillus tip.
“Probiotic” interventionsA. muciniphila BAA-835 and C. scindens 35704 were obtained fromthe American Type Culture Collection. Both strains were grown over-night at 37°C in gut microbiota medium [GMM (46)] under strictanaerobic conditions. Organisms harvested in stationary phase weremixed in equal numbers, pelleted by centrifugation (10,000g, 1 min,24°C), and resuspended in PBS with 0.1% cysteine. As many of thesemanipulations as possible were conducted in an anaerobic Coy cham-ber (see above). Tubes containing bacteria were sealedwhen they had tobe removed from the Coy chamber (for example, for centrifugation andduring transport to the gnotobiotic facility for gavage intomice). A sep-arate aliquot of the culture was autoclaved (121°C for 20min) to kill theorganisms, including spores associated with C. scindens, and was thenintroduced into separate groups of animals as a heat-killed control.
Generation and characterization of arrayedculture collections
In vitro culture of IgA+ fractions prepared from the fecal mi-crobiota of children with kwashiorkor. Fecal specimens from kwa-shiorkor co-twins in discordant pairs, collected at the time of theirdiagnosis, were subjected to BugFACS under nonreducing conditions.
www.ScienceT
Bacteria (105) from the IgA+ gatewere collected, plated onto Luria broth(LB) agar plates, and incubated overnight at 37°C under aerobic con-ditions. Colonies were picked into LB broth (Difco) and grown over-night to stationary phase. DNA was harvested from stationary-phasecultures (phenol-chloroform) and purified (QIAquick PCRPurificationKit, Qiagen). Full-length amplicons from bacterial 16S rRNA geneswere generated using primers 8F and 1391R and ReddyMix MasterMix (Thermo Scientific; cycling conditions were 95°C for 10 min, fol-lowed by 35 cycles of 95°C for 45 s, 56°C for 45 s, then 72°C for 2min).Amplicons were purified (QIAquick PCR Purification kit) and se-quenced (Sanger method) in both directions using the amplificationprimers (Retrogen). Sequences were assembled using BioEdit (47) andreferenced against the Greengenes database (41) to obtain species-levelidentification.
For bacterial genome sequencing, purified genomicDNAwas shearedtwice for 10 min on ice using a Bioruptor XL sonicator (Diagenode) setto “high.” Libraries [500 base pairs (bp)] were prepared for each of thestrains listed in table S3 for sequencing on the Illumina MiSeq instru-ment (paired-end 250-nucleotide reads). Multiplex sequencing of allstrains was achieved using an 8-bp barcode for each individual strain(48). Sequences were assembled using MIRA (49) (version 4.0.2), andthe resulting contigs were used for comparison to a library of knownvirulence factors (34). Whole-genome assemblies were compared topublically available sequenced isolates (50).
Generation of clonally arrayed culture collections from the cecalcontents of KMF2IgA+ mice. Cecal contents were harvested 2 days aftercolonization of germ-freemice with a KMF2IgA+microbiota. Homogen-ized cecal contents were spread onto GMM agar plates and incubatedfor 48hours at 37°Cunder anaerobic conditions. The contents of the plateswere recovered with a sterile tissue culture cell scraper and resuspendedin sterile PBS supplemented with 15% glycerol and 0.1% cysteine. Ali-quots were sealed in glass vials under anaerobic conditions and stored at−80°C until use. Clonally arrayed culture collections were generated byfirst diluting an aliquot of the scraped culture collection ontoGMMagarplates. After 2 days of anaerobic growth at 37°C, 376 individual colonieswere picked into four 96 deep-well plates, each containing liquid GMMmedium, and grown for 48 hours under anaerobic conditions. Aliquotsfrom each well of the arrayed culture collection that exhibited growthwere used to generate glycerol stocks.GenomicDNAwas extracted fromthe remaining contents of each well and used to generate V4 16S rRNAamplicons for sequencing. Whole-genome sequencing was subsequentlyperformed on two isolates from each OTU represented in the arrayedculture collection as described above.
Separate groups of mice were gavaged with a pool generated fromall wells containing Enterobacteriaceae strains, or a pool containing allnon-Enterobacteriaceae strains, or a pool containing both the Entero-bacteriaceae and non-Enterobacteriaceae components of the arrayedculture collection. Our strategy of pooling of multiple independentisolates from the arrayed culture collection was intended to adequatelyrepresent strain-level diversity in the recipient animals.
FACS analysis of B cell and T cell populations recoveredfrom gnotobiotic miceMLNs and spleens were collected at the time of sacrifice and kept at4°C until processing. All tissue processing was conducted in sterilePBS supplemented with 0.1% bovine serum albumin (Sigma). Tissueswere mechanically homogenized and passed through a nylon filter(mesh diameter, 70 mm; BD Falcon). Erythrocytes were removed from
ranslationalMedicine.org 25 February 2015 Vol 7 Issue 276 276ra24 12

R E S EARCH ART I C L E
by guest on August 15, 2019
http://stm.sciencem
ag.org/D
ownloaded from
splenic samples using ammonium chloride lysis (ACK Lysing Buffer,Gibco). Lymphocyte surface markers were stained using the followingantibodies: PerCP-Cy5.5 anti–TCR-b, V500 anti-B220, and fluoresceinisothiocyanate (FITC) anti-CD8 from BD Biosciences, plus allophyco-cyanin (APC) anti-CD4, phycoerythrin (PE) anti-CD44, and PE-Cy7anti-CD62L from eBioscience. We also stained for FoxP3 using aneFluor 450–labeled antibody (eBioscience) with fixation/permeabilizationbuffer followed by permeabilization/staining with 0.01% saponin/0.009% sodium azide (eBioscience) supplemented with 1% rat serum(Sigma-Aldrich).
Using Random Forests to predict LAZ scores as afunction of IgA index values in the Malawian twinand LCNI-5 cohortsOur training data set came from the Malawian Twin cohort. To buildthe model, we included only those genus-level bacterial taxa that hadan IgA index value greater than 0.05 or less than −0.05 in 30% of allfecal samples; 25 satisfied this criterion, which was designed to removetaxa that were only rarely seen and/or were only minimally enrichedin either the IgA+ or the IgA− fraction. Next, we regressed the IgA in-dices for these 25 taxa against LAZ scores using the Random Forestspackage as implemented in R (51). Random Forests is a supervisedlearning method that allows the user to assess the contribution of taxa(“features”) to the accuracy of the overall regression. Feature impor-tance scores are quantified as the percent increase in mean squared er-ror when values (in this case IgA indices) belonging to a feature arerandomly permuted. We determined feature importance scores for eachgenus-level taxon using 1000 iterations with 500 trees per iteration. Wealso included chronologic age as an additional feature. We then incor-porated only those taxa (and chronologic age of the subject in months)that yielded mean importance scores greater than 1.5% to produce asparse model (52) that explained 18% of the variance relating to LAZin the training set. We used this sparse model to predict LAZ scoresfrom an individual’s IgA index in the LCNI-5 cohort.
Enteropathogen detection by quantitative PCRExtracted nucleic acids were assayed with TaqMan Array Cards as de-scribed (35) to detect a panel of enteropathogens, including severalbelonging to Enterobacteriaceae, such as Enteroaggregative E. coli(EAEC, targeting aggR, aaiC, and aatA genes), EPEC (targeting eaeand bfpA), ETEC (targeting both heat-stable and heat-labile toxingenes), Shiga toxin–producing E. coli (targeting stx1 and stx2), Entero-invasive E. coli (EIEC, targeting ipaH), Salmonella spp. (targeting ttr),and Shigella spp. (targeting ipaH). Extraction blanks were included toexclude laboratory contamination. A quantification cycle (Cq) cutoffof 35 was applied to determine positivity based on the lower limit ofdetection of the assays. Copy numbers of each positive target werecalculated from standard curves and normalized to the combined ex-traction and amplification efficiency derived from the quantities of anextrinsic control (phocine herpes virus) that was incorporated intoboth the extraction and detection steps.
Statistical methodsStatistical analyses were performed in R version 3.1.1. P < 0.05 was con-sidered significant. Bar graphs are presented as mean values with errorbars representing the SEM except where otherwise noted. Horizontalbars shown with individual data points represent sample means unlessotherwise noted. Specific statistical tests are noted in the figure legends.
www.ScienceT
SUPPLEMENTARY MATERIALS
www.sciencetranslationalmedicine.org/cgi/content/full/7/276/276ra24/DC1Fig. S1. Characterization of gnotobiotic mice receiving intact uncultured fecal microbiota fromdiscordant twins and the experimental design for subsequent transplantation of IgA+ consortiapurified from their fecal microbiota into germ-free recipients.Fig. S2. Validation of BugFACS using an artificial two-member bacterial community.Fig. S3. Control experiments validating the specificity of BugFACS.Fig. S4. Combining HMIgA+ and KMIgA+ consortia attenuates early weight loss in recipientgnotobiotic animals.Fig. S5. Serum cytokine profiles in KMIgA+ animals and a comparison of immunophenotypes inrecipients of KMIgA+, HMIgA+, and MixIgA+ consortia.Fig. S6. KMF2IgA+ microbiota transmits a colonic epithelial discohesion phenotype to recipientgnotobiotic mice.Fig. S7. IgA-targeted bacterial taxa in the kwashiorkor microbiota disrupt the small intestinal ep-ithelial barrier in recipient gnotobiotic mice.Fig. S8. Representation of bacterial taxa within the gut microbiota of gnotobiotic mice colonizedwith IgA+ consortia.Fig. S9. Heatmap of bacterial family-level taxa represented in the fecal microbiota of gnotobioticmice sampled 12 days after receiving IgA+ consortia from discordant twin pair 46 or 80.Table S1. Clinical characteristics of Malawian twin microbiota donors.Table S2. IgA indices determined from BugFACS analysis of fecal samples obtained from micecolonized with the fecal microbiota of co-twins discordant for kwashiorkor (pair 57).Table S3. Characteristics of the genome sequences and content of virulence factors of Entero-bacteriaceae isolates obtained from in vitro culture of IgA+ consortia or from spleens of micecolonized with KMF2IgA+ cecal microbiota (originating from donor 57A).Table S4. IgA indices and relative abundances of family- and genus-level bacterial taxa in twocohorts of Malawian infants.Table S5. Clinical characteristics of individuals from the LCNI-5.Table S6. Multiplex quantitative PCR analysis of enteropathogen burden in members of theLCNI-5 cohort.Table S7. Subgroup analysis of LCNI-5 cohort.
REFERENCES AND NOTES
1. World Health Organization, Levels and Trends in Child Malnutrition, UNICEF-WHO-The WorldBank Joint Child Malnutrition Estimates (2012); http://who.int/nutgrowthdb/estimates/en/(2012).
2. R. E. Black, C. G. Victora, S. P. Walker, Z. A. Bhutta, P. Christian, M. de Onis, M. Ezzati,S. Grantham-McGregor, J. Katz, R. Martorell, R. Uauy, Maternal and child undernutritionand overweight in low-income and middle-income countries. Lancet 382, 427–451 (2013).
3. M. T. Ruel, H. Alderman; Maternal and Child Nutrition Study Group, Nutrition-sensitiveinterventions and programmes: How can they help to accelerate progress in improvingmaternal and child nutrition? Lancet 382, 536–551 (2013).
4. T. Yatsunenko, F. E. Rey, M. J. Manary, I. Trehan, M. G. Dominguez-Bello, M. Contreras,M. Magris, G. Hidalgo, R. N. Baldassano, A. P. Anokhin, A. C. Heath, B. Warner, J. Reeder,J. Kuczynski, J. G. Caporaso, C. A. Lozupone, C. Lauber, J. C. Clemente, D. Knights, R. Knight,J. I. Gordon, Human gut microbiome viewed across age and geography. Nature 486,222–227 (2012).
5. S. Subramanian, S. Huq, T. Yatsunenko, R. Haque, M. Mahfuz, M. A. Alam, A. Benezra,J. DeStefano, M. F. Meier, B. D. Muegge, M. J. Barratt, L. G. VanArendonk, Q. Zhang,M. A. Province, W. A. Petri Jr., T. Ahmed, J. I. Gordon, Persistent gut microbiota immaturityin malnourished Bangladeshi children. Nature 510, 417–421 (2014).
6. M. I. Smith, T. Yatsunenko, M. J. Manary, I. Trehan, R. Mkakosya, J. Cheng, A. L. Kau, S. S. Rich,P. Concannon, J. C. Mychaleckyj, J. Liu, E. Houpt, J. V. Li, E. Holmes, J. Nicholson, D. Knights,L. K. Ursell, R. Knight, J. I. Gordon, Gut microbiomes of Malawian twin pairs discordant forkwashiorkor. Science 339, 548–554 (2013).
7. K. Honda, D. R. Littman, The microbiome in infectious disease and inflammation. Annu.Rev. Immunol. 30, 759–795 (2012).
8. Y. Belkaid, T. W. Hand, Role of the microbiota in immunity and inflammation. Cell 157,121–141 (2014).
9. S. Fukuda, H. Toh, K. Hase, K. Oshima, Y. Nakanishi, K. Yoshimura, T. Tobe, J. M. Clarke,D. L. Topping, T. Suzuki, T. D. Taylor, K. Itoh, J. Kikuchi, H. Morita, M. Hattori, H. Ohno, Bifido-bacteria can protect from enteropathogenic infection through production of acetate. Nature469, 543–547 (2011).
10. T. Hashimoto, T. Perlot, A. Rehman, J. Trichereau, H. Ishiguro, M. Paolino, V. Sigl, T. Hanada,R. Hanada, S. Lipinski, B. Wild, S. M. Camargo, D. Singer, A. Richter, K. Kuba, A. Fukamizu,
ranslationalMedicine.org 25 February 2015 Vol 7 Issue 276 276ra24 13

R E S EARCH ART I C L E
by guest on August 15, 2019
http://stm.sciencem
ag.org/D
ownloaded from
S. Schreiber, H. Clevers, F. Verrey, P. Rosenstiel, J. M. Penninger, ACE2 links amino acidmalnutrition to microbial ecology and intestinal inflammation. Nature 487, 477–481(2012).
11. C. R. Stokes, J. F. Soothill, M. W. Turner, Immune exclusion is a function of IgA. Nature 255,745–746 (1975).
12. Y. Cong, T. Feng, K. Fujihashi, T. R. Schoeb, C. O. Elson, A dominant, coordinated T regulatorycell-IgA response to the intestinal microbiota. Proc. Natl. Acad. Sci. U.S.A. 106, 19256–19261(2009).
13. K. Suzuki, B. Meek, Y. Doi, M. Muramatsu, T. Chiba, T. Honjo, S. Fagarasan, Aberrant expan-sion of segmented filamentous bacteria in IgA-deficient gut. Proc. Natl. Acad. Sci. U.S.A.101, 1981–1986 (2004).
14. S. Hapfelmeier, M. A. Lawson, E. Slack, J. K. Kirundi, M. Stoel, M. Heikenwalder, J. Cahenzli,Y. Velykoredko, M. L. Balmer, K. Endt, M. B. Geuking, R. Curtiss III, K. D. McCoy, A. J. Macpherson,Reversible microbial colonization of germ-free mice reveals the dynamics of IgA immune re-sponses. Science 328, 1705–1709 (2010).
15. D. W. Beatty, B. Napier, C. C. Sinclair-Smith, K. McCabe, E. J. Hughes, Secretory IgA synthesis inKwashiorkor. J. Clin. Lab. Immunol. 12, 31–36 (1983).
16. S. Sirisinha, R. Suskind, R. Edelman, C. Asvapaka, R. E. Olson, Secretory and serum IgA in chil-dren with protein-calorie malnutrition. Pediatrics 55, 166–170 (1975).
17. V. Reddy, N. Raghuramulu, C. Bhaskaram, Secretory IgA in protein-calorie malnutrition.Arch. Dis. Child 51, 871–874 (1976).
18. L. A. van der Waaij, G. Mesander, P. C. Limburg, D. van der Waaij, Direct flow cytometry ofanaerobic bacteria in human feces. Cytometry 16, 270–279 (1994).
19. K. E. Shroff, K. Meslin, J. J. Cebra, Commensal enteric bacteria engender a self-limiting hu-moral mucosal immune response while permanently colonizing the gut. Infect. Immun. 63,3904–3913 (1995).
20. K. B. Amor, P. Breeuwer, P. Verbaarschot, F. M. Rombouts, A. D. Akkermans, W. M. De Vos,T. Abee, Multiparametric flow cytometry and cell sorting for the assessment of viable,injured, and dead bifidobacterium cells during bile salt stress. Appl. Environ. Microbiol.68, 5209–5216 (2002).
21. C. F. Maurice, H. J. Haiser, P. J. Turnbaugh, Xenobiotics shape the physiology and geneexpression of the active human gut microbiome. Cell 152, 39–50 (2013).
22. N. W. Palm, M. R. de Zoete, T. W. Cullen, N. A. Barry, J. Stefanowski, L. Hao, P. H. Degnan, J. Hu,I. Peter, W. Zhang, E. Ruggiero, J. H. Cho, A. L. Goodman, R. A. Flavell, Immunoglobulin a coat-ing identifies colitogenic bacteria in inflammatory bowel disease. Cell 158, 1000–1010 (2014).
23. K. Atarashi, T. Tanoue, K. Oshima, W. Suda, Y. Nagano, H. Nishikawa, S. Fukuda, T. Saito,S. Narushima, K. Hase, S. Kim, J. V. Fritz, P. Wilmes, S. Ueha, K. Matsushima, H. Ohno, B. Olle,S. Sakaguchi, T. Taniguchi, H. Morita, M. Hattori, K. Honda, Treg induction by a rationallyselected mixture of Clostridia strains from the human microbiota. Nature 500, 232–236(2013).
24. K. Atarashi, T. Tanoue, T. Shima, A. Imaoka, T. Kuwahara, Y. Momose, G. Cheng, S. Yamasaki,T. Saito, Y. Ohba, T. Taniguchi, K. Takeda, S. Hori, I. I. Ivanov, Y. Umesaki, K. Itoh, K. Honda, In-duction of colonic regulatory T cells by indigenous Clostridium species. Science 331, 337–341(2011).
25. C. W. Png, S. K. Lindén, K. S. Gilshenan, E. G. Zoetendal, C. S. McSweeney, L. I. Sly, M. A. McGuckin,T. H. Florin, Mucolytic bacteria with increased prevalence in IBD mucosa augment in vitroutilization of mucin by other bacteria. Am. J. Gastroenterol. 105, 2420–2428 (2010).
26. A. Everard, C. Belzer, L. Geurts, J. P. Ouwerkerk, C. Druart, L. B. Bindels, Y. Guiot, M. Derrien,G. G. Muccioli, N. M. Delzenne, W. M. de Vos, P. D. Cani, Cross-talk between Akkermansiamuciniphila and intestinal epithelium controls diet-induced obesity. Proc. Natl. Acad. Sci. U.S.A.110, 9066–9071 (2013).
27. S. Zhu, M. Ashok, J. Li, W. Li, H. Yang, P. Wang, K. J. Tracey, A. E. Sama, H. Wang, Spermineprotects mice against lethal sepsis partly by attenuating surrogate inflammatory markers.Mol. Med. 15, 275–282 (2009).
28. S. L. Pull, J. M. Doherty, J. C. Mills, J. I. Gordon, T. S. Stappenbeck, Activated macrophagesare an adaptive element of the colonic epithelial progenitor niche necessary for regen-erative responses to injury. Proc. Natl. Acad. Sci. U.S.A. 102, 99–104 (2005).
29. J. Strnad, A. E. Hamilton, L. S. Beavers, G. C. Gamboa, L. D. Apelgren, L. D. Taber, J. R. Sportsman,T. F. Bumol, J. D. Sharp, R. A. Gadski, Molecular cloning and characterization of a humanadenocarcinoma/epithelial cell surface antigen complementary DNA. Cancer Res. 49,314–317 (1989).
30. S. V. Litvinov, M. P. Velders, H. A. Bakker, G. J. Fleuren, S. O. Warnaar, Ep-CAM: A humanepithelial antigen is a homophilic cell–cell adhesion molecule. J. Cell Biol. 125, 437–446(1994).
31. M. Ladwein, U. F. Pape, D. S. Schmidt, M. Schnölzer, S. Fiedler, L. Langbein, W. W. Franke,G. Moldenhauer, M. Zöller, The cell–cell adhesion molecule EpCAM interacts directly withthe tight junction protein claudin-7. Exp. Cell Res. 309, 345–357 (2005).
32. M. Sivagnanam, J. L. Mueller, H. Lee, Z. Chen, S. F. Nelson, D. Turner, S. H. Zlotkin, P. B. Pencharz,B. Y. Ngan, O. Libiger, N. J. Schork, J. E. Lavine, S. Taylor, R. O. Newbury, R. D. Kolodner,H. M. Hoffman, Identification of EpCAM as the gene for congenital tufting enteropathy.Gastroenterology 135, 429–437 (2008).
www.ScienceT
33. C. Mangani, K. Maleta, J. Phuka, Y. B. Cheung, C. Thakwalakwa, K. Dewey, M. Manary,T. Puumalainen, P. Ashorn, Effect of complementary feeding with lipid-based nutrient sup-plements and corn-soy blend on the incidence of stunting and linear growth among 6- to18-month-old infants and children in rural Malawi. Matern. Child Nutr. 10.1111/mon.12068(2013).
34. L. Chen, Z. Xiong, L. Sun, J. Yang, Q. Jin, VFDB 2012 update: Toward the genetic diversity andmolecular evolution of bacterial virulence factors. Nucleic Acids Res. 40, D641–D645 (2012).
35. J. Liu, J. Gratz, C. Amour, G. Kibiki, S. Becker, L. Janaki, J. J. Verweij, M. Taniuchi, S. U. Sobuz,R. Haque, D. M. Haverstick, E. R. Houpt, A laboratory-developed TaqMan Array Card forsimultaneous detection of 19 enteropathogens. J. Clin. Microbiol. 51, 472–480 (2013).
36. J. Liu, F. Kabir, J. Manneh, P. Lertsethtakarn, S. Begum, J. Gratz, S. M. Becker, D. J. Operario,M. Taniuchi, L. Janaki, J. A. Platts-Mills, D. M. Haverstick, M. Kabir, S. U. Sobuz, K. Nakjarung,P. Sakpaisal, S. Silapong, L. Bodhidatta, S. Qureshi, A. Kalam, Q. Saidi, N. Swai, B. Mujaga,A. Maro, B. Kwambana, M. Dione, M. Antonio, G. Kibiki, C. J. Mason, R. Haque, N. Iqbal, A. K. Zaidi,E. R. Houpt, Development and assessment of molecular diagnostic tests for 15 enteropatho-gens causing childhood diarrhoea: A multicentre study. Lancet Infect. Dis. 14, 716–724 (2014).
37. M. N. Huda, Z. Lewis, K. M. Kalanetra, M. Rashid, S. M. Ahmad, R. Raqib, F. Qadri, M. A. Underwood,D. A. Mills, C. B. Stephensen, Stool microbiota and vaccine responses of infants. Pediatrics 134,e362–e372 (2014).
38. F. Qadri, T. R. Bhuiyan, D. A. Sack, A. M. Svennerholm, Immune responses and protection inchildren in developing countries induced by oral vaccines. Vaccine 31, 452–460 (2013).
39. D. A. Peterson, N. P. McNulty, J. L. Guruge, J. I. Gordon, IgA response to symbiotic bacteriaas a mediator of gut homeostasis. Cell Host Microbe 2, 328–339 (2007).
40. P. J. Turnbaugh, M. Hamady, T. Yatsunenko, B. L. Cantarel, A. Duncan, R. E. Ley, M. L. Sogin,W. J. Jones, B. A. Roe, J. P. Affourtit, M. Egholm, B. Henrissat, A. C. Heath, R. Knight, J. I. Gordon,A core gut microbiome in obese and lean twins. Nature 457, 480–484 (2009).
41. T. Z. DeSantis, P. Hugenholtz, N. Larsen, M. Rojas, E. L. Brodie, K. Keller, T. Huber, D. Dalevi,P. Hu, G. L. Andersen, Greengenes, a chimera-checked 16S rRNA gene database and work-bench compatible with ARB. Appl. Environ. Microbiol. 72, 5069–5072 (2006).
42. J. G. Caporaso, J. Kuczynski, J. Stombaugh, K. Bittinger, F. D. Bushman, E. K. Costello, N. Fierer,A. G. Pena, J. K. Goodrich, J. I. Gordon, G. A. Huttley, S. T. Kelley, D. Knights, J. E. Koenig, R. E. Ley,C. A. Lozupone, D. McDonald, B. D. Muegge, M. Pirrung, J. Reeder, J. R. Sevinsky, P. J. Turnbaugh,W. A. Walters, J. Widmann, T. Yatsunenko, J. Zaneveld, R. Knight, QIIME allows analysis of high-throughput community sequencing data. Nat. Methods 7, 335–336 (2010).
43. V. K. Ridaura, J. J. Faith, F. E. Rey, J. Cheng, A. E. Duncan, A. L. Kau, N. W. Griffin, V. Lombard,B. Henrissat, J. R. Bain, M. J. Muehlbauer, O. Ilkayeva, C. F. Semenkovich, K. Funai, D. K. Hayashi,B. J. Lyle, M. C. Martini, L. K. Ursell, J. C. Clemente, W. Van Treuren, W. A. Walters, R. Knight,C. B. Newgard, A. C. Heath, J. I. Gordon, Gut microbiota from twins discordant for obesitymodulate metabolism in mice. Science 341, 1241214 (2013).
44. The R Development Core Team, R: A Language and Environment for Statistical Computing(R Foundation for Statistical Computing, Vienna, Austria, 2011); http://R-project.org/.
45. L. Fahlén-Yrlid, T. Gustafsson, J. Westlund, A. Holmberg, A. Strömbeck, M. Blomquist,G. G. MacPherson, J. Holmgren, U. Yrlid, CD11chigh dendritic cells are essential for activa-tion of CD4+ T cells and generation of specific antibodies following mucosal immuniza-tion. J. Immunol. 183, 5032–5041 (2009).
46. A. L. Goodman, G. Kallstrom, J. J. Faith, A. Reyes, A. Moore, G. Dantas, J. I. Gordon, Extensivepersonal human gut microbiota culture collections characterized and manipulated in gnoto-biotic mice. Proc. Natl. Acad. Sci. U.S.A. 108, 6252–6257 (2011).
47. T. A. Hall, BioEdit: A user-friendly biological sequence alignment editor and analysisprogram for Windows 95/98/NT. Nucleic Acids Symp. Ser. 41, 95–98 (1999).
48. S. L. Chen, M. Wu, J. P. Henderson, T. M. Hooton, M. E. Hibbing, S. J. Hultgren, J. I. Gordon,Genomic diversity and fitness of E. coli strains recovered from the intestinal and urinarytracts of women with recurrent urinary tract infection. Sci. Transl. Med. 5, 184ra160 (2013).
49. B. Chevreux, T. Wetter, S. Suhai, Genome sequence assembly using trace signals and ad-ditional sequence information. Comput. Sci. Biol. 99, 45–56 (1999).
50. J. J. Faith, J. L. Guruge, M. Charbonneau, S. Subramanian, H. Seedorf, A. L. Goodman, J. C. Clemente,R. Knight, A. C. Heath, R. L. Leibel, M. Rosenbaum, J. I. Gordon, The long-term stability of thehuman gut microbiota. Science 341, 1237439 (2013).
51. A. Liaw, M. Wiener, Classification and regression by randomForest. R News 2, 18–22 (2002).52. R. Díaz-Uriarte, S. Alvarez de Andrés, Gene selection and classification of microarray data
using random forest. BMC Bioinformatics 7, 3 (2006).
Acknowledgments: We thank D. O’Donnell, M. Karlsson, and S. Wagoner for help with gnotobiotichusbandry; S. Deng, J. Guruge, and M. Meier for their superb technical assistance; and S. Subramanian,P. Ahern, and other members of the Gordon laboratory for their many helpful comments duringthe course of this study. Funding: This work was supported by grants from the Bill & MelindaGates Foundation and the NIH (R01 DK30292; J.I.G.). A.L.K. is the recipient of an NIH Ruth L. KirschsteinNational Research Service Award (F32 DK091044); part of his salary was also supported by agrant from Danone. J.D.P. is a member of the Washington University Medical Scientist TrainingProgram (NIH GM007200). Author contributions: A.L.K., J.D.P., and J.I.G. designed theexperiments. S.R. and C.-S.H. helped develop flow cytometry protocols for enriching IgA-coated
ranslationalMedicine.org 25 February 2015 Vol 7 Issue 276 276ra24 14

R E S EARCH ART I C L E
bacteria. M.J.M. and I.T. designed, enrolled, and collected specimens from Malawian twins. K.M.M.,P.A., and K.G.D. directed the clinical study design, enrollment, and clinical data and samplecollection for LCNI-5. E.R.H. developed protocols for TaqMan Array–based measurements ofpathogens. A.L.K., J.D.P., S.R., T.Y., T.-C.L., T.S.S., and J.L. performed experiments. A.L.K., J.D.P., andJ.I.G. analyzed the data. A.L.K., J.D.P., and J.I.G. wrote the paper. Competing interests: J.I.G. iscofounder of Matatu Inc., a company characterizing the role of diet-by-microbiota interactionsin animal health. A nonprovisional patent application entitled “Method of isolating and char-acterizing microorganisms that are targets of host immunity” (serial no. 14/398,087) has beenfiled by Washington University related to the techniques described in this paper. The otherauthors declare that they have no competing interests. Data and materials availability: 16SrRNA data sets are available through the European Nucleotide Archive (ENA; study accessionnumber PRJEB5989). Reads from shotgun sequencing data sets generated from cultured bac-
www.ScienceT
terial strains and assembled contigs are available through ENA (accession numbers PRJEB8296to PRJEB8306).
Submitted 12 December 2014Accepted 5 February 2015Published 25 February 201510.1126/scitranslmed.aaa4877
Citation: A. L. Kau, J. D. Planer, J. Liu, S. Rao, T. Yatsunenko, I. Trehan, M. J. Manary, T.-C. Liu,T. S. Stappenbeck, K. M. Maleta, P. Ashorn, K. G. Dewey, E. R. Houpt, C.-S. Hsieh, J. I. Gordon,Functional characterization of IgA-targeted bacterial taxa from undernourished Malawianchildren that produce diet-dependent enteropathy. Sci. Transl. Med. 7, 276ra24 (2015).
ranslationalMedicine.org 25 February 2015 Vol 7 Issue 276 276ra24 15
by guest on August 15, 2019
http://stm.sciencem
ag.org/D
ownloaded from
children that produce diet-dependent enteropathyFunctional characterization of IgA-targeted bacterial taxa from undernourished Malawian
and Jeffrey I. GordonLiu, Thaddeus S. Stappenbeck, Kenneth M. Maleta, Per Ashorn, Kathryn G. Dewey, Eric R. Houpt, Chyi-Song Hsieh Andrew L. Kau, Joseph D. Planer, Jie Liu, Sindhuja Rao, Tanya Yatsunenko, Indi Trehan, Mark J. Manary, Ta-Chiang
DOI: 10.1126/scitranslmed.aaa4877, 276ra24276ra24.7Sci Transl Med
implications for the diagnosis and treatment of childhood undernutrition.Enterobacteriaceae interacted with other community members to produce pathology. These findings haveDissecting a collection of cultured IgA-targeted bacterial strains from an undernourished donor revealed that was prevented by a nutrient-sufficient diet or two IgA-targeted bacterial species from a healthy donor's microbiota.of the gut lining (epithelium), weight loss, and sepsis in animals consuming a nutrient-deficient Malawian diet. This undernutrition. Transplanting IgA-bound bacteria from undernourished children to germ-free mice led to disruptionauthors demonstrate that IgA responses to several types of bacteria, including Enterobacteriaceae, correlate with samples collected during the first 2 years of life from Malawian children using a method called BugFACS, thesediagnostic and therapeutic implications for childhood undernutrition. Purifying IgA-targeted microbes from fecal
show that bacterial targets of gut immunoglobulin A (IgA) responses haveet al.In a new study, Kau BugFACS Inc.
ARTICLE TOOLS http://stm.sciencemag.org/content/7/276/276ra24
MATERIALSSUPPLEMENTARY http://stm.sciencemag.org/content/suppl/2015/02/23/7.276.276ra24.DC1
CONTENTRELATED
http://science.sciencemag.org/content/sci/365/6449/eaau4732.fullhttp://science.sciencemag.org/content/sci/365/6449/eaau4735.fullhttp://science.sciencemag.org/content/sci/365/6449/109.fullhttp://stm.sciencemag.org/content/scitransmed/10/439/eaan1217.fullhttp://science.sciencemag.org/content/sci/352/6293/1533.fullhttp://science.sciencemag.org/content/sci/349/6253/1172.fullhttp://science.sciencemag.org/content/sci/352/6293/1581.fullhttp://science.sciencemag.org/content/sci/352/6293/1515.fullhttp://science.sciencemag.org/content/sci/352/6291/1261.fullhttp://science.sciencemag.org/content/sci/352/6289/1116.fullhttp://science.sciencemag.org/content/sci/351/6279/1296.fullhttp://science.sciencemag.org/content/sci/350/6256/aac5992.fullhttp://science.sciencemag.org/content/sci/349/6252/1101.fullhttp://science.sciencemag.org/content/sci/349/6252/1058.fullhttp://science.sciencemag.org/content/sci/349/6251/993.fullhttp://science.sciencemag.org/content/sci/349/6251/989.fullhttp://science.sciencemag.org/content/sci/349/6251/929.full
Terms of ServiceUse of this article is subject to the
is a registered trademark of AAAS.Science Translational Medicinetitle licensee American Association for the Advancement of Science. No claim to original U.S. Government Works. TheScience, 1200 New York Avenue NW, Washington, DC 20005. 2017 © The Authors, some rights reserved; exclusive
(ISSN 1946-6242) is published by the American Association for the Advancement ofScience Translational Medicine
by guest on August 15, 2019
http://stm.sciencem
ag.org/D
ownloaded from
REFERENCES
http://stm.sciencemag.org/content/7/276/276ra24#BIBLThis article cites 49 articles, 20 of which you can access for free
PERMISSIONS http://www.sciencemag.org/help/reprints-and-permissions
Terms of ServiceUse of this article is subject to the
is a registered trademark of AAAS.Science Translational Medicinetitle licensee American Association for the Advancement of Science. No claim to original U.S. Government Works. TheScience, 1200 New York Avenue NW, Washington, DC 20005. 2017 © The Authors, some rights reserved; exclusive
(ISSN 1946-6242) is published by the American Association for the Advancement ofScience Translational Medicine
by guest on August 15, 2019
http://stm.sciencem
ag.org/D
ownloaded from