functional flower traits and their diversity drive ... · pdf filefunctional flower traits and...
TRANSCRIPT
EV-1
Functional flower traits and their diversity drive pollinator visitation
Felix Fornoff, Alexandra-Maria Klein, Florian Hartig, Gita Benadi, Christine Venjakob, H. Martin Schaefer and Anne Ebeling
F. Fornoff ([email protected]) and A.-Maria Klein, Faculty of Environment and Natural Resources, Nature Conservation and Landscape Ecology, Univ. of Freiburg, Freiburg, Germany. – F. Hartig, Faculty of Biology and Pre-Clinical Medicine, Theoretical Ecology, Univ. of Regensburg, Regensburg, Germany, and: Faculty of Environment and Natural Resources, Biometry and Environmental System Analysis, Univ. of Freiburg, Freiburg, Germany. – G. Benadi, Faculty of Environment and Natural Resources, Biometry and Environmental System Analysis, Univ. of Freiburg, Freiburg, Germany. – C. Venjakob, Inst. of Ecology, Ecosystem Functions, Leuphana Univ. of Lüneburg, Lüneburg, Germany. – H. M. Schaefer, Inst. of Biology I, Evolutionary Biology and Animal Ecology, Faculty of Biology, Univ. of Freiburg, Germany. – A. Ebeling, Inst. of Ecology, Univ. of Jena, Jena, Germany.
Recent studies have shown that the diversity of flowering plants can enhance pollinator richness and visitation frequency and thereby increase the resilience of pollination. It is assumed that flower traits explain these effects, but it is still unclear which flower traits are responsible, and knowing that, if pollinator richness and visitation frequency are more driven by mass-ratio effects (mean trait values) or by trait diversity.
Here, we analyse a three-year data set of pollinator observations collected in a European grassland plant diversity experi-ment (The Jena experiment). The data entail comprehensive flower trait measurements, including reward traits (nectar and pollen amount), morphological traits (height, symmetry, area, colour spectra) and chemical traits (nectar-amino acid and nectar-sugar concentration). We test if pollinator species richness and visitation frequency of flower communities depend on overall functional diversity combining all flower traits within a community, single trait diversities (within trait variation) and community-weighted means of the single traits, using Bayesian inference.
Overall functional diversity did not affect pollinator species richness, but reduced visitation frequency. When looking at individual flower traits separately, we found that single trait diversity of flower reflectance and flower morphology were important predictors of pollinator visitation frequency. Moreover, independent of total flower abundance, community-weighted means of flower height, area, reflectance, nectar-sugar concentration and nectar-amino acid concentration strongly affected both pollinator species richness and visitation frequency.
Our results, challenge the idea that functional diversity always positively affects ecosystem functions. Nonetheless, we demonstrate that both single trait diversity and mass-ratio effects of flower traits play an important role for diverse and frequent flower visits, which underlines the functionality of flower traits for pollination services.
Human activities alter global ecosystems, often with the consequence of decreasing species diversity (Cardinale et al. 2012, Naeem et al. 2012). Many studies have found that the resulting loss of functional diversity has negative effects on ecosystem functions and services provided by these systems (Hooper and Vitousek 1997, Tilman et al. 1997, Bunker et al. 2005). Understanding the key dimensions of functional diversity that maintain ecosystem functioning is therefore of great interest, both from a practical and scientific viewpoint.
Two mechanisms are widely discussed for explaining trait effects on ecosystem functioning (Dias et al. 2013): 1) diversity effects influencing ecosystem functions via comple-mentarity or nonadditive effects (synergism, antagonism) (Callaway 1995), 2) mass-ratio effects, traits expressed by the most abundant species within a community dominate ecosystem functions, represented by community-weighted means (CWM) (Hector 1998, Grime 1998). We are only beginning to understand general patterns with respect to
these mechanisms, and the mechanisms that mediate these effects are still understudied for many important ecosystems. Moreover, many ecosystem functions depend on trophic interactions, but the majority of studies investigating trait effects on ecosystem functions focus on one trophic level (Hooper et al. 2005, Bello et al. 2010).
Plant–pollinator systems are key trophic interactions fuelling plant reproduction. They strongly respond to changes in biodiversity and are subject to substantial alterations of diversity and community composition by human interven-tions. Previous studies found that plant species richness increases pollinator species richness and visitation frequency (Ebeling et al. 2008, Fründ et al. 2010). Frequent and diverse visitations will likely increase pollination success (Brittain et al. 2013, Fründ et al. 2013, Garibaldi et al. 2013).
For comprehensibility, we use the term pollinator for all flower visitors, though it needs to be mentioned that not every flower visitation event results in the transfer of pollen (King et al. 2013).
© 2016 The Authors. Oikos © 2016 Nordic Society OikosSubject Editor: Anna Traveset. Editor-in-Chief: Dries Bonte. Accepted 23 November 2016
Oikos 000: 001–011, 2017 doi: 10.1111/oik.03869
EV-2
Different pollinators prefer distinct floral traits, or are excluded by them (Blüthgen and Klein 2011). It is gener-ally assumed that diverse plant communities attract a more species rich pollinator community because they provide a higher diversity of flower traits that allow more pollinator species to coexist via niche partitioning (McGill et al. 2006). Junker et al. (2015), who simulated pollinator–flower inter-actions, found that species richness of pollinators increases with overall functional diversity of plant communities and we expected to find the same pattern. Additionally, we expected a negative effect of overall functional diversity of all flower traits in a community (FDQ) on visitation frequency at the plant community level, as the most abundant polli-nators in our data set were generalists. For generalists high
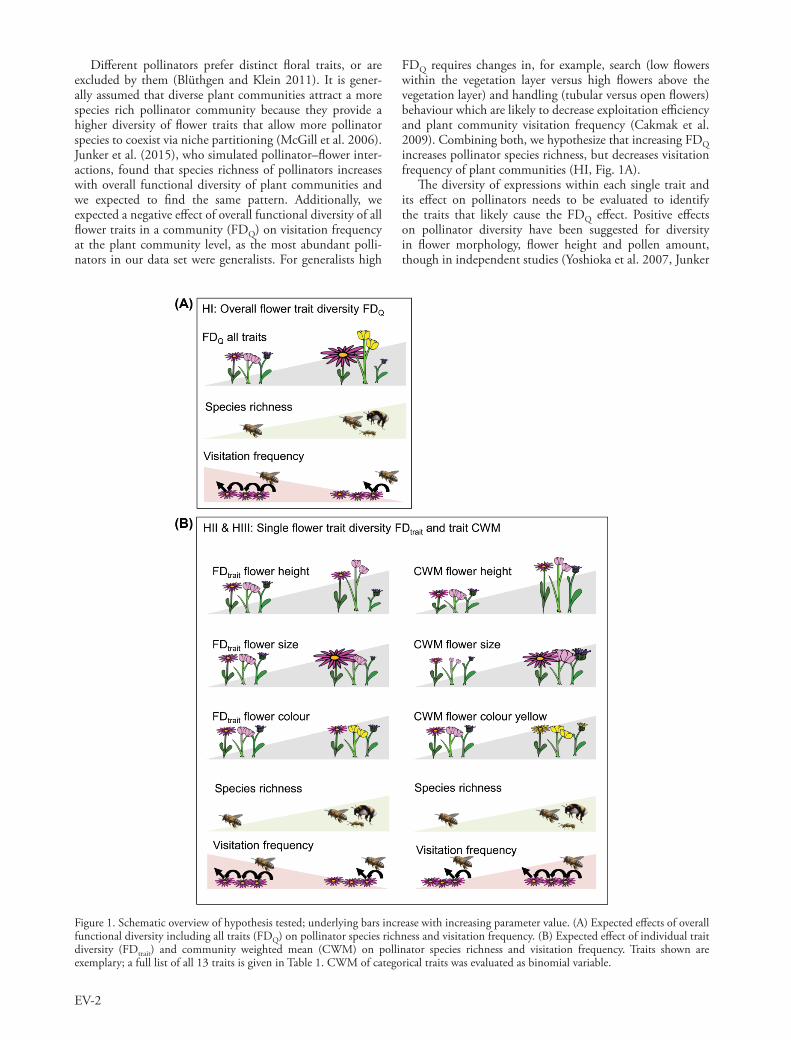
FDQ requires changes in, for example, search (low flowers within the vegetation layer versus high flowers above the vegetation layer) and handling (tubular versus open flowers) behaviour which are likely to decrease exploitation efficiency and plant community visitation frequency (Cakmak et al. 2009). Combining both, we hypothesize that increasing FDQ increases pollinator species richness, but decreases visitation frequency of plant communities (HI, Fig. 1A).
The diversity of expressions within each single trait and its effect on pollinators needs to be evaluated to identify the traits that likely cause the FDQ effect. Positive effects on pollinator diversity have been suggested for diversity in flower morphology, flower height and pollen amount, though in independent studies (Yoshioka et al. 2007, Junker
Figure 1. Schematic overview of hypothesis tested; underlying bars increase with increasing parameter value. (A) Expected effects of overall functional diversity including all traits (FDQ) on pollinator species richness and visitation frequency. (B) Expected effect of individual trait diversity (FDtrait) and community weighted mean (CWM) on pollinator species richness and visitation frequency. Traits shown are exemplary; a full list of all 13 traits is given in Table 1. CWM of categorical traits was evaluated as binomial variable.
EV-3
et al. 2013, 2015). A comprehensive analysis of the diver-sity effect of flower traits is still missing. We expected that for each functional trait the diversity of trait expressions (FDtrait) within a flower community should increase pollina-tor species richness and decrease visitation frequency by the same mechanisms as described for FDQ.
The mass-ratio hypothesis postulates that the dominant trait expressions have the strongest effect on the function of interest (Hector 1998, Grime 1998). Flower visitation fre-quency is frequently driven by the most frequent pollinators, generally the social bees. These groups of bees are known to be polylectic, though individuals of e.g. bumble bees develop flower constancy to specialize on profitable abundant flowers (Chittka et al. 1999). Direct traits that represent pollen or nectar rich flowers, e.g. sugar, nectar and pollen, or indirect traits, e.g. colour or height, could act as attractors for these species. Accordingly, pollinator visitation frequency should be increased by high relative values (mass-ratio) of the most attractive trait expressions in flower communities.
A limitation of many of the existing studies is that they are either of theoretical nature, or that they use only a subset of traits. Consequently, the inherent importance of flower traits, and whether diversity or mass-ratio effects are driv-ing pollinator diversity, is currently not well understood. Dias et al. (2013) proposed that in order to disentangle the effects of functional diversity and community composition (mass-ratio) both should be considered within the same analysis. Few examples follow this approach and the major-ity identifies mass-ratio effects as main driver (Díaz et al. 2007, Mokany et al. 2008, Schumacher and Roscher 2009, Laughlin 2011, Lavorel et al. 2011, Mouillot et al. 2011, but see Schuldt et al. 2014). In our study we therefore distinguish mass-ratio effects represented by trait community-weighted mean (CWM) and single trait diversity (FDtrait) effects within one regression model.
We hypothesise, that community-weighted mean trait values influence flower visitation frequency, but flower com-munity FDtrait has a negative effect on visitation frequency (HII, Fig. 1B). Furthermore, pollinator species richness of a plant community may be affected by trait effects and additionally increases with sample size. As such, pollinator species richness is correlated with visitation frequency and therefore, should respond to the same CWMs as visitation frequency. We therefore formulate as third hypothesis that pollinator species richness responds to flower community single trait diversity (FDtrait) as well as trait community-weighted mean (HIII, Fig. 1B).
Methods
Experimental design and pollinator flower observations
Data were collected at The Jena Experiment (Thuringia, Germany; 50°55′N, 11°35′E; 130 m a.s.l., Supplementary material Appendix 1 Fig. A1), a grassland diversity experi-mental site established in 2002. The experiment consists of communities of common European grassland species sown in 82 20 20 m plots arranged in a regular grid. Species composition was maintained by weeding of invading plant
species. The diversity gradient consists of 16 treatment plots each for monocultures, two-species mixtures, four-species mixtures and eight-species mixtures, 14 treatment plots of 16-species mixtures and four treatment plots of 60 species mixtures. Each mixture was compiled randomly (except for 60 species mixtures containing all species). For more details on the realized species and the general set up of the Jena Experiment see Roscher et al. (2004).
Observations of flower–pollinator interactions and blos-som cover were recorded; each flower-visiting insect and the visited plant species was documented at species level. Unknown pollinator species were captured for later identi-fication. In 2008 all 82 plots (including not weeded only grass plots) were included into the analyses, but only 73 in 2005 and 2006, due to non-flowering of the remaining nine plots (only grass plots). Data collection in 2005 and 2006 consisted of three surveys of 6 min per plot, each within a square of 80 80 cm (25 May, 16 June, 19 August and 10 June, 18 June, 5 August, respectively; Ebeling et al. 2008). In 2008 four surveys of 6 min per plot were conducted (5 May, 1 June, 16 July, 6 August; Hudewenz et al. 2012), resulting in 766 plot observations (3 times 73 plots in 2005 3 times 73 plots in 2006 4 times 82 plots in 2008) and overall 4596 minutes observation time. Blossom cover was estimated for each plant species after each pollina-tor observation as percentage cover of the total flower area of sampled core areas.
Flower traits
During the whole observation period we found 44 of the 60 plant species in flower and conducted trait measurements for all of these species, although nectar extraction was not possible for all species (Supplementary material Appendix 1 Methods A1). Traits ranged from flower reflectance, height and inflorescence area to sugar and amino acid content of nectar (for a full list of all 13 traits see Table 1). All traits were measured on ten blossoms of different plant individuals from the monoculture plots at the experimental field sites during the vegetation period in 2011. In order to determine blossom colour, we measured light reflectance spectra using fiber optic spectrometer and a standardized light source. Since we have no information on the visual perception range for all pollinators recorded we classified the spectra into four binomial categories (400–680 nm each category 70 nm), blue, green, yellow and red (spectra show local maxima at the respective range), e.g. purple flowers obtain the value 0 for green and yellow and 1 for blue and red. UV reflec-tance was taken from the database BiolFlor (< www.biolflor.de >; Klotz et al. 2002), which assigns the numbers from one to seven to ranges of reflectance intensity (one 0–7%, two 8–15%, three 16–27%, four 28–39%, five 40–66%, six 67–85%, seven 85–100%; Klotz et al. 2002). Flower height and inflorescence area were measured using a calliper. Flower height is the distance between the flower and the surface. Flower area was calculated for floral units (FU), an aggregation of flowers which a pollinator can access without flying (individual flower of single flowering species e.g. Ranunculus acris or full flower stand of composite flow-ers of e.g. Leontodon autumnalis) or whole umbel including several blossoms (Heracleum sphondylium or pseudo umbels

EV-4
Two response variables, pollinator visitation rate and species richness, and all trait indices were calculated on the plot level to analyse the trait effects of flower communities on pollinator communities. Functional diversity was calcu-lated using the function dbFD of the R package ‘FD’ in the software R (< www.r-project.org >; Laliberté and Legendre 2010). We used the index of functional diversity based on the quadratic entropy of Rao (1982) that incorporates both the relative abundances of species (in our study: blossom cover) and a measure of the pairwise functional differences between species as suggested by Botta-Dukát (2005)
FD d p pi
S
j i
S
ij i j==
−
= +∑ ∑
1
1
1 (1)
where dij is the difference between the ith and jth species and pi is the proportion of the species i of the total commu-nity. As suggested by Botta-Dukát we use Euclidean distance divided by the number of traits
dn
X Xijk
n
ik jk= −( )=
∑1
1
2 (2)
where n is the number of traits considered, Xik is the value of trait k in species i.
Trait selection was based on their assumed importance for flower–pollinator interactions. Table 1 shows these traits, their unit, range and data structure. All traits listed in Table 1 (n 13) were included to calculate overall trait diversity (FDQ) using formula (1). Each trait was individ-ually used (n 1) in formula (1) to calculate single trait diversity (FDtrait).
In addition to trait diversity, we calculated community-weighted means (CWM) for each individual trait. CWM values express the abundance-weighted mean values of numerical variables or the percentage of relative abundance of each factor level of categorical variables, where n is the number of species in a community, pi is the proportion of the species i of the total community and trait the trait value of the species i.
of Achillea millefolium). For round FUs area (A) is calculated by A pi r² for non-round FUs we assumed a rectangle and calculated length width (e.g. for Lathyrus pratensis, with of FU height of FU). Flower symmetry was also judged based on FUs not the individual flower, seen from the side to which the flower opens, for e.g. Asteraceae and Apiaceae: radial symmetry, Fabaceae: lateral symmetry. Nec-tar content (nectar production) was measured using glass capillaries on overnight gauze bagged flowers in the morning between 6 to 12 a.m. The same nectar was used for sugar content (sucrose, fructose and glucose) and amino acid (ala-nine, arginine, aspartic acid, cystine, glutamic acid, glycine, histidine, isoleucine, leucine, lysine, methionine, phenyla-lanine, proline, serine, threonine, tyrosine, valine) analysis via HPLC. Pollen amount was categorized into little/high pollen availability. Details of the nectar and pollen collec-tion and chemical analyses are in the Supplementary mate-rial Appendix 1 Methods A1. The flowering length (in days) was measured, by daily investigation of marked FUs. Stamen number and location of individual flowers or florets were determined in the field and supplemented using the plant identification book Rothmaler (Jäger et al. 2013). BiolFlor data base (Klotz et al. 2002) was used to complement the trait information of nectar amount for six plant species and for colour of one species, since no measurements in the field were taken for this plants and traits.
Statistical analyses
Of the 766 plot observations, 231 observations did not have a single blossom in flower. Diversity cannot sensibly be calculated for these plots and they were therefore excluded (see also Austin and Meyers 1996). Additionally, 49 observations did not have sufficient information to calculate total amino acid single trait diversity, due to insufficient amounts of nectar sampled for chemical analyses and were also excluded. Hence, our total sample size available for statistical analysis comprised 486 plots.
Table 1. Flower traits used to calculate overall functional diversity (FDQ), single trait diversities (FDtrait) and CWMs. Blossom cover represents the weighting value for flower functional diversity calculations.
Nr. Trait Unit/coding Levels/range/raw unit Data structure Ecological importance
1 Blossom colour 1/0 400–470 nm (blue) integer flower recognition1/0 471–540 nm (green) integer flower recognition1/0 541–610 nm (yellow) integer flower recognition1/0 611–680 nm (red) integer flower recognition
2 Blossom UV reflectance 1–6 0–7, 8–15, 16–27, 28–39, 40–66, 67–85%
continuous flower recognition, sugar availability
3 Flower height cm 4.5–58.5 continuous flower recognition, attractiveness, foraging range of visitor (low versus high)
4 Inflorescence area mm² 4.2–86.19 continuous flower recognition, availability of space for simultaneous visitation
5 Flower symmetry 1/0 radial/bilateral integer adaptation to certain visitor community6 Nectar amount 1–4 no, little, medium, high categorical visitor reward7 Sugar content in nectar mmol ml–1 31.4–888.2 continuous visitor reward8 Amino acid content in nectar mmol ml–1 5.8–165.3 continuous visitor reward9 Pollen 1/0 little/high integer visitor reward
10 Flowering length day 2–51.2 continuous duration of resource availability11 Stamen location 1/0 inside/outside integer accessibility of resource12 Stamen number 2–15 2–15 continuous visitor reward, accessibility of resource13 Nectar accessibility 1/0 open /hidden integer filter for visitor morphological traits
Blossom cover % 1–50 continuous amount of available flowers per plot

EV-5
mer and Stukalov 2014) and jagsUI (Kellner 2015). MCMC chains were considered converged at Rhat values (potential scale reduction factor) 1.05 (Gelman et al. 2003). A Bayesian analysis does not provide p-values for effect sizes, but the posterior distribution that is calculated can still be intuitively interpreted: it provides the probability that the effect is positive or negative. Note that the p-value is often misinterpreted as exactly this probability (Cohen 1994). We considered model parameters with 95% credible intervals on either positive or negative value as substantial evidence for an effect towards positive and negative values, respectively. Note that the p-value is often misinterpreted as exactly this probability (Cohen 1994).
Data deposition
All data used in this manuscript is deposited at PANGAEA: doi:10.1594/PANGAEA.869777.
Results
Pollinator community and community overall functional diversity (FDQ)
In total 67 species of pollinators (17 solitary bees, 24 social bees (one Apis, two Halictus, six Bombus, 15 Lasioglossum), 21 Syrphidae and five wasps of unknown genus) were visit-ing blossoms of 44 plant species. Species richness of pollina-tors and plant species within individual plots and censuses ranged from zero to six and zero to 14, respectively. The data consisted of 6450 individual observations (6191 bees), of which 3982 observations belonged to Apis mellifera, 1888 Bombus, 230 syrphids, 136 solitary and semi-social bees and 29 wasps. Wild bees represented 61% and syrphids 30% of the overall species. Two bee species were specialized on a single plant family, but both were observed only once. All other species were flower generalists, hence visit flowers of a variety of different plant families (Westrich 1990). We considered flies and wasps of this study as generalist since these species do not tend to develop strong specialisations. Therefore, we regarded our observed pollinator community as generalist community. Pollinator visitation frequency was correlated with pollinator species richness (Spearman’s r 0.89, p 0.001). FDQ was positively correlated with plant species richness (Spearman’s r 0.78, p 0.001).
In order to test hypothesis I, blossom cover and FDQ were used as predictors for pollinator species richness and visitation frequency in model 1.1 and 1.2. The models identified a strong positive correlation between blossom cover and pollinator species richness and visitation frequency. As expected, visitation frequency was negatively affected by FDQ, but no clear signal was found for species richness (Table 3, Fig. 1, 2). Visitation frequency showed exponen-tial increase over our measured range of 1–50% blossom cover, whereas species richness indicated saturation within the range. The model for visitation frequency showed a large degree of uncertainty about the FDQ parameter. This high variation may have been due to high variation between sam-ples and sampling seasons represented as random terms in Fig. 2. Model 1.1 (species richness) identified 89% of the
CWM p traiti
n
i= ×=∑
1 (3)
All parameters were standardized by subtracting their mean value and dividing by their standard deviation. Therefore, effect sizes are more comparable, but should not be inter-preted as relative to their natural units. Prior to statistical analysis, all covariates were investigated for collinearity and variables with correlation values higher than 0.65 were excluded from the model (for an overview see Supplementary material Appendix 1 Fig. A1–A2) (Dormann et al. 2013), but will be discussed accordingly. FDtrait and FDQ indi-ces were correlated to varying amounts, therefore it was necessary to explore the effects of both in separate mod-els. Zero-inflation and overdispersion are common for this type of pollinator count data and therefore we modelled the responses (pollinator species richness and visitation fre-quency, Table 2) with zero-inflated Poisson generalized linear mixed effects models (ZIP GLMM) with covariates depend-ing on our respective hypotheses.The models used for testing hypothesis I were:(1.1) Species richness ∼ ZIP (cover FDQ random)(1.2) Visitation frequency ∼ ZIP (cover FDQ random)The models used for testing hypothesis II and III were:(2.1) Species richness ∼ ZIP (cover CWM1 CWMi FDtrait 1
FDtrait i random)(2.2) Visitation frequency ∼ ZIP (cover CWM1 CWMi
FDtrait 1 FDtrait i random)
Here, for each trait i CWM and FDtrait are added. ZIP refers to the following GLMM structure:yijk ∼ Poisson (lijk Iijk)log (lijk) a b1 m1
ijk b2 m2ijk . . . eijk uj vjk
Iijk ∼ Bernoulli (Z)eijk ∼ Normal (0, O)uj ∼ Normal (0, sPlot)vk ∼ Normal (0, sSurvey)
The response (y) is dependent on l calculated by the linear regression with parameters; intercept (a), prior (bl), predictor variable (ml) and the random terms (e, u and v) and the incidence of a non-zero observation (I). The random terms (ε, u and v) in the model included survey ID (v, levels 1 to 10) nested within plots (u, levels 1 to 82) representing the experimental design and an observation level random effect (e), controlled by the overdispersion parameter (O, levels 1 to 486). We expected the variance between sampling seasons to be greater than the variance between years, there-fore we did not include year as a random term but expected the random term season to also capture variation between years. We specified mildly informative priors (mean 0, sigma 10) for the main effects. This technique, also known as the “Bayesian Lasso”, avoids overfitting in complex mod-els (Park and Casella 2008). One advantage of this method over AIC-based model selection is that it is more conserva-tive regarding effect sizes, due to preference for low effect sizes introduced by the prior. In contrast, AIC-based model selection can lead to overestimation of effects, particularly when predictors are collinear.
Bayesian posteriors for the models were estimated using JAGS ver. 3.4.0 and the R-packages: rjags (Plummer; Plum-

EV-6
height was positively correlated with visitation frequency and moderately correlated with CWM of flower area (Pearson’s r 0.65, p 0.001). CWM of nectar-sugar concentra-tion was positively correlated with visitation frequency. Green reflectance was negatively correlated with visita-tion frequency and a priori correlated with white flowers since other flowers rarely reflected strongly in this range. CWM of amino acid amount was negatively correlated with visitation frequency.
FDtrait of floral unit symmetry was negatively correlated with visitation frequency. Since floral unit symmetry- and nectar access FDtrait were strongly positively correlated (Pearson’s r 0.84, p 0.001) the effects of both traits were indistinguishable in this analysis and floral unit symmetry FDtrait results will be discussed as flower morphology FDtrait from now on. Colour FDtrait was correlated with UV FDtrait (Pearson’s r 0.75, p 0.001), in the model we used UV FDtrait only but will refer to it as reflectance FDtrait from now on. Reflectance FDtrait was positively correlated with visita-tion frequency. Figure 3 shows tested parameters and their effect distributions, Table 3 all influential parameters includ-ing their effect size, credible intervals and effect direction of posterior samples.
observed zeros as originating from the Poisson distribution and 11% as additional zeros, whereas model 1.2 (visitation frequency) identified all observed zeros as true zeros belong-ing to the Poisson distributed response with respect to the fitted model, the same pattern is present in model 2.1 and 2.2 (Table 3).
Single trait diversity (FDtrait) and community mean (CWM) of individual traits
In order to test for hypothesis II and III, we used two differ-ent models, one for species richness (2.1) and one for visita-tion frequency (2.2). As predictor variables, blossom cover, CWM and FDtrait for each flower trait entered both models. In general, we found the same patterns of trait effects for pol-linator species richness and visitation frequency. Additionally, flower cover had a strong positive effect on both response variables (Fig. 3, Table 3). Zero-inflation showed the same pattern as discussed for model 1.1 and 1.2, where only pol-linator species richness data was zero inflated.
In support of hypothesis II, flower visitation frequency was influenced by the CWMs of four traits, but also responded to two trait FDtrait measures. CWM of flower
Figure 2. Estimated models for pollinator visitation frequency (model 1.2) and species richness (model 1.1) in response to the strong effect of blossom cover (A, C) and negative effect of FDQ on visitation frequency (B) which is absent for species richness (D). Solid lines represent mean estimated effect of blossom cover and FDQ. Shaded areas represent 95% credible intervals, keeping the other parameter at 1 and 0 for FDQ and blossom cover, respectively. Dotted lines represent mean model estimates for the random effect sampling season, which shows for panel A that variation is largely independent of sampling season, whereas substantial variation between sampling seasons exists for panels (B), (C) and (D).

EV-7
model 2.2. Surprisingly, no FDtrait measure was positively correlated with species richness (Fig. 3, Table 3).
Discussion
Using, to the best of our knowledge, the largest and most complete data set on pollinators and flower traits collected so far in a controlled biodiversity manipulation experiment, we tested overall trait diversity, single trait diversity and community-weighted mean effects of 13 flower traits on pol-linator visitation frequency and pollinator species richness. Our results, based on plot community observations, showed that pollinator visitation frequency declined with increasing overall trait diversity (FDQ) of plant communities and that pollinator species richness was not affected by FDQ, in a gen-eralist dominated pollinator community. When comparing single trait diversities (FDtrait) and community mean values (CWM) of single traits, we found evidence for diversity and mass-ratio effects influencing pollinator–flower interactions. Moreover, flower reflectance, flower height/area, flower mor-phology, nectar-sugar concentration and nectar-amino acid concentration were the most important traits shaping this plant–insect interaction. Additionally, the analyses under-lined the pronounced positive effect of increasing blossom cover on pollinator diversity.
Effects of overall trait diversity (FDQ) on pollinator visitation
Cadotte et al. (2011) predicted a positive correlation between functional diversity and ecosystem functions. We showed that the opposite was true because FDQ reduced one proxy of pollination service, visitation frequency. This supported hypothesis I where we expected that increasing FDQ of all flower traits of a community is associated with a decrease in visitation frequency in pollinator communi-ties dominated by generalist bees. An explanation is that a polylectic pollinator foraging on a trait-diverse flower com-munity needs to alter its handling behaviour in respect to changing flower traits, increasing the time spent per flower (Cakmak et al. 2009). In consequence decreased exploita-tion efficiency leads to decreased attractiveness of diverse communities. Many polylectic bee species have developed flower constancy to counterbalance efficiency loss, allowing them to efficiently exploit flowers of the same species. This behavioural adaptation could also explain decreased flower visits in our trait diverse plant communities, since a flower constant pollinator only visits flowers of the trait combina-tion it has chosen for its actual foraging bout. Theoretically, in pollinator communities with larger proportions of spe-cialised species, the same mechanism should decrease visita-tion frequency given equal pollinator species abundances.
As expected in hypothesis III, three of the CWM parameters strongly influenced visitation frequency (flower height, colour green and nectar-amino acid concentration) and were also correlated with pollinator species richness in
Figure 3. Estimated effect sizes for all single functional flower traits for visitation frequency and species richness. For each variable, medians (points), 50% credible intervals (thick line) and 95% credible intervals (thin line) of the posterior are shown. Note, that variables were standardized, meaning that effect sizes are directly comparable. (**) denotes more than 95% posterior probability on either positive or negative values, (–) denotes the absence of such a signal. To allow model convergence one of each pair of auto-correlated predictors was excluded. Therefore is the effect of flower height CWM represented by flower area CWM, of flower access CWM by bilateral symmetry CWM, of stamen number CWM by stamen location CWM and of colour yellow and white CWM by colour green CWM. Auto-correlations between colour FDtrait and UV FDtrait are jointly represented and discussed as reflectance FDtrait and of flower access and symmetry FDtrait as morphology FDtrait.
Table 2. Data range, abundance of zeros and probability distribution for species richness and visitation frequency of all pollinators for all three years pooled.
Response variable No. values 0 No. values 0 Range Distribution Lambda
Species richness 230 303 0–6 Poisson 0.7Visitation frequency 230 303 0–419 ZI-Poisson unknown

EV-8
they result from more continuous provision of flowers over time in more diverse plant communities (i.e. a lower prob-ability of periods with zero flowers, Supplementary material Appendix 1 Fig. A4).
Effect of community-weighted means on pollinator richness and visitation frequency
Mass-ratio effects include positive biodiversity effects resulting from dominance of certain species or trait expres-sions comprising the highest influence on the function of interest (Huston 1997, Aarssen 1997).
As expected, visitation frequency was primarily influenced by mass-ratio effects, in particular positive by flower height and negative by dominance of green in flower reflectance and amino acid concentration. Further, pollinator richness was affected by the same set of CMWs and in the same direction as visitation frequency. Additionally, high sugar CWM had a positive effect on pollinator species richness. Both results are in accordance with our hypothesis that 1) pollinator visita-tion frequency of a generalist pollinator community is mainly driven by mass-ratio effects. 2) High visitation frequencies are correlated with high species richness, potentially explain-ing the congruent effect of CWMs on pollinator species richness in our analysis. In the following we will discuss in detail the influential traits identified by our analysis.
Flower height CWM
Flower height/area was positively correlated with visitation frequency and pollinator species richness. In our study, high/large flowers were represented by a diversity of families including Asteraceae, Apiaceae and Ranunculaceae and attracted a diverse and frequently visiting pollinator community (see also Hegland and Totland 2005). This observation can be explained by a generally high conspicu-ousness of tall or large floral units for pollinators benefiting the whole plant community (Donnelly et al. 1998). Alter-natively, the attractiveness of large floral units, for example composed flowers, could arise from high resource availability.
The dilution of trait expressions would decrease visitation frequency of specialized and flower constant pollinators, especially if flower communities expressing the same trait values but with low diversity are nearby, as provided by the Jena Experiment set up.
The lack of an effect of functional diversity on pollinator species richness can be attributed to the lack of specialized pollinators. Even though some abundantly observed spe-cies show specialisation on certain traits (Bombus lapidarius: short tongue – open flower, Bombus pascuorum: long tongue – tubular flower), most have developed ways to still access trait mismatching flowers (e.g. short tonged bees destruc-tively open tubular flowers at the basis; Stout et al. 2000). Furthermore, phylogenetically distant pollinator groups including Coleopterans and some Dipterans were not or rarely observed, hence our results account for highly general-ist-dominated communities and the observed patterns could be reversed in communities hosting a larger proportion of specialised or phylogenetically distant pollinators as shown by a simulation of a similar grassland community by Junker et al. (2015).
A previous study of the same data set by Ebeling et al. (2008) found pollinator species richness and visitation fre-quency to increase with flower species richness. Although flower species richness and FDQ are highly correlated, our analysis showed a negative effect of FDQ on visitation fre-quency, in contrast to the positive effect of flower species richness found by Ebeling et al. (2008). We argue that this difference can be explained by the different temporal resolu-tion of the analyses. Ebeling et al. (2008) pooled all six surveys of flower and pollinator communities at the plot level over a two year period, including observations of zero pollinators in plots with zero flower cover. In our study, we tested individu-ally for each point in time whether a relationship between flower traits and pollinator visitations existed. In contrast to Ebeling et al. (2008), this required removing plots where no flowers occurred from the data. We summarize that the effects found by Ebeling et al. (2008) only become apparent when considering a larger time interval. These effects were not visible or even reversed at any given point in time, because
Table 3. Parameter estimates with a clear posterior signal ( 95% of posterior with same sign as mean regression coefficient (Mean) of the ZIP-GLMMs and extend of zero-inflation. Results are presented for model 1.1 and 1.2 testing combined trait diversity effects and for model 2.1 and 2.2 testing FDtrait and CWM effects on visitation frequency and species richness. Values represent means, lower and upper margins of 95% credible intervals, and exact proportion of posterior with the same sign as the mean (f).
Visitation frequency Species richness
Mean lower CI upper CI f Mean lower CI upper CI f
Model 1.1 and 1.2 Intercept –1.379 –2.542 –0.503 1 –1.227 –1.660 –0.818 1Blossom cover 1.207 0.871 1.602 1 0.532 0.405 0.660 1FDQ –0.217 –0.424 0.011 0.966Zero-inflation 0.801 0.726 0.878 1
Model 2.1 and 2.2 Intercept –1.545 –2.659 –0.534 0.993 –1.317 –1.753 –0.913 1Blossom cover 1.299 1.023 1.637 1 0.594 0.449 0.738 1Flower height CWM 0.421 0.068 0.791 0.990 0.330 0.144 0.524 1UV diversity 0.181 –0.002 0.378 0.973Nectar-sugar CWM –0.304 0.003 0.614 0.976Symmetry diversity –0.351 –0.608 –0.095 0.996Amino acid CWM –0.787 –1.096 –0.471 1 –0.234 –0.407 –0.066 0.997Green CWM –0.551 –0.890 –0.237 0.998 –0.185 –0.376 0.004 0.972Zero-inflation 0.886 0.808 0.959 1

EV-9
the discrepancy between our results and their simulations, though species richness and degree of species specialisation should have the strongest effect. Consequently we think that niche differentiation is either not present in relatively species poor generalist pollinator communities, or not measurable due to the smaller plot size. The surprising result that pol-linator visitation frequency responded to single trait diver-sity is supported by Hegland and Totland (2005) and Balzan et al. (2014), who assign the positive effect of functional diversity manly to the addition of highly attractive flower species at high functional diversity levels. This explanation can be mostly excluded in our experimental set up theoreti-cally including all flower species at all trait diversity levels. We discuss the observed correlations between FDtrait and flower visitation frequency in detail in the following.
Flower reflectance FDtrait
Since Knuth (1891) found UV signals in flowers, it was shown that pollinators use these patterns for flower identifi-cation and localization of rewards (Petropoulou et al. 2001, Binkenstein et al. 2013). In contrast to diversity in other far distance recognition traits, for example flower height or area, a diverse reflectance pattern in flower communities more reliably indicates a variety of flower species. Given that pollen and nectar production varies with time and species (Pacini et al. 2003), a diversity of flowers may indicate stable reward provision for generalist species with high probability of finding resources needed, at all times of the day.
Flower morphology FDtrait
Higher flower morphology FDtrait was associated with lower visitation frequency. We expected the FDtrait of flower morphology to be positively correlated with pollinator species richness, since flower tube depth, for example, is known as a trait selecting for short or long tonged pollinators (Fontaine et al. 2006, Stang et al. 2006). In the tested community the low proportion of specialized pollinators and the behav-ioural adaptations of morphologically different pollinators to access nectar or pollen of morphologically distant flowers can weaken positive morphology FDtrait–pollinator species richness effects. The expected preference of generalist pol-linators exhibiting flower constancy for plant communities with low trait diversity could explain the negative effect of morphology FDtrait on visitation frequency.
Conclusion
The mechanisms of pollinator–flower interactions are complex. Multiple traits may affect flower visitation, rang-ing from long-distance attraction (colour, height, area), over nectar/pollen accessibility (symmetry, tube depth and size) or indicators of nectar/pollen presence (UV, scent) to chemical information of sugar and amino acid concentra-tions of nectar. Our analyses demonstrated the prevailing importance of long-distance attraction and direct reward measures. Hence we suggest that flower communities vari-able in colour and constant in morphology, providing large flowers or flowers higher than the average grassland vegeta-tion and providing high sugar but low amino acid concen-
Nectar sugar CWM
Pollinator visitation frequency increased with nectar sugar concentration. Nectar samples were not taken in parallel to pollinator observations, but provided estimates for the flower species nectar production and nectar chemical composition. Given that our collection method for nectar was indicative for nectar standing crop (Zimmerman 1988), we showed that high availability of one of the most important reward traits in a plant community attracted many pollinators. The effect is certainly saturating at higher sugar concentrations due to maximal nectar viscosity and optimal foraging theory balancing water and sugar needs of pollinators.
Nectar amino acid CWM
Effects of nectar amino acid concentrations on bees are controversially discussed (Willmer 1980, Alm et al. 1990). We found negative effects of high amino acid concentra-tions on pollinator diversity and abundance. Generally, nectar-dependent pollinators such as butterflies respond more strongly to amino acid concentrations in nectar whereas most other pollinators primarily rely on pollen for amino acid supply (Alm et al. 1990). We conclude that a hymenoptera dominated pollinator community avoids high nectar amino acid concentrations. A possible mechanistic explanation of our finding was given by Carter et al. (2006) who reported that proline, the prevailing amino acid in our study, was a deterrent of Apis mellifera at high concentra-tions in nectar. Additionally, it needs to be mentioned, that nectar sampling was not aligned with pollinator observations and high variability of nectar-amino acid concentrations are shown for temperate plants (Willmer 1980); consequently uncontrolled factors could have led to methodological bias in this result.
Colour CWM
The flower reflectance spectrum in the human green range (471–540 nm) was negatively correlated with visitation frequency and species richness. In our study, reflectance in the green spectrum strongly correlated with reflectance in all colour spectra (except UV), which leads to human white flowers. As reported by other authors (Lamborn and Ollerton 2000, Zych 2006) Apiaceae, which comprised in our study most of human white flowers, seem rather unattractive for bees, the major visitor and most diverse group in this study.
Effects of single trait diversity (FDtrait) on pollinator richness and visitation frequency
Unlike the predictions of hypotheses II and III, FDtrait indices were correlated with visitation frequency rather than with pollinator species richness. Pollinator species richness should be affected by single trait diversity driven by niche partitioning and complementarity of pollinators (Junker et al. 2015). In Junker et al. (2015) the species/abundance ratio was 250/2549 in our study it was 67/6450 indicat-ing a more diverse pollinator community of the first; the observed plot area was 3.5 times larger than in our analysis. Both, differences in scale and species richness could lead to

EV-10
Chittka, L. et al. 1999. Flower constancy, insect psychology and plant evolution. – Naturwissenschaften 86: 361–377.
Cohen, J. 1994. The earth is round (P-less-than.05). – Am. Psychol. 49: 997–1003.
Dias, A. T. C. et al. 2013. An experimental framework to identify community functional components driving ecosystem processes and services delivery. – J. Ecol. 101: 29–37.
Díaz, S. et al. 2007. Incorporating plant functional diversity effects in ecosystem service assessments. – Proc. Natl Acad. Sci. USA 104: 20684–20689.
Donnelly, S. E. et al. 1998. Pollination in Verbascum thapsus (Scrophulariaceae): the advantage of being tall. – Am. J. Bot. 85: 1618–1625.
Dormann, C. F. et al. 2013. Collinearity: a review of methods to deal with it and a simulation study evaluating their perform-ance. – Ecography 36: 27–46.
Ebeling, A. et al. 2008. How does plant richness affect pollinator richness and temporal stability of flower visits? – Oikos 117: 1808–1815.
Fontaine, C. et al. 2006. Functional diversity of plant–pollinator interaction webs enhances the persistence of plant communities. – PLoS Biol. 4: e1.
Fründ, J. et al. 2010. Pollinator diversity and specialization in relation to flower diversity. – Oikos 119: 1581–1590.
Fründ, J. et al. 2013. Bee diversity effects on pollination depend on functional complementarity and niche shifts. – Ecology 94: 2042–2054.
Garibaldi, L. A. et al. 2013. Wild pollinators enhance fruit set of crops regardless of honey bee abundance. – Science 339: 1608–1611.
Gelman, A. et al. 2003. Bayesian data analysis. – Chapman and Hall/CRC.
Grime, J. P. 1998. Benefits of plant diversity to ecosystems: imme-diate, filter and founder effects. – J. Ecol. 86: 902–910.
Hector, A. 1998. The effect of diversity on productivity: detecting the role of species complementarity. – Oikos 82: 597–599.
Hegland, S. J. and Totland, Ø. 2005. Relationships between species’ floral traits and pollinator visitation in a temperate grassland. – Oecologia 145: 586–594.
Hooper, D. U. and Vitousek, P. M. 1997. The effects of plant composition and diversity on ecosystem processes. – Science 277: 1302–1305.
Hooper, D. U. et al. 2005. Effects of biodiversity on ecosystem functioning: a consensus of current knowledge. – Ecol. Monogr. 75: 3–35.
Hudewenz, A. et al. 2012. Herbivore and pollinator responses to grassland management intensity along experimental changes in plant species richness. – Biol. Conserv. 150: 42–52.
Huston, M. A. 1997. Hidden treatments in ecological experiments: re-evaluating the ecosystem function of biodiversity. – Oecologia 110: 449–460.
Jäger, E. et al. 2013. Rothmaler-Exkursionsflora von Deutschland, Gefässpflanzen: Atlasband. – Springer.
Junker, R. R. et al. 2013. Specialization on traits as basis for the niche-breadth of flower visitors and as structuring mechanism of ecological networks. – Funct. Ecol. 27: 329–341.
Junker, R. R. et al. 2015. Functional and phylogenetic diversity of plant communities differently affect the structure of flower–visitor interactions and reveal convergences in floral traits. – Evol. Ecol. 29: 437–450.
Kellner, K. 2015. jagsUI: a wrapper around rjags to streamline JAGS analyses. – < https://cran.r-project.org/web/packages/jagsUI >.
King, C. et al. 2013. Why flower visitation is a poor proxy for pollination: measuring single-visit pollen deposition, with implications for pollination networks and conservation. – Meth. Ecol. Evol. 4: 811–818.
trations are more attractive. Moreover, generalist pollinator visitation frequency to flower communities decreased with overall flower functional diversity (this study), but increased with plant species richness when diverse flower phenolo-gies increase the duration of flower provision (Ebeling et al. 2008). The consequences thereof for pollination quality of crop monocultures or diverse grasslands need to be evaluated by future studies. In general, diversity effects act on pollina-tor visitation frequency and mass-ratio effects of certain traits are important for this essential ecosystem function by affect-ing pollinator visitation frequency and species richness.
Acknowledgements – We thank the technical staff of the Jena Experiment for their work in maintaining the field site and support during measurements and the many student helpers for weeding the experimental plots. Further we thank Martina Stang and Marcos-Méndez for their valuable comments on the manuscript during the review process.Funding – The study was funded by the Deutsche Forschungsge-meinschaft (FOR 1451).
References
Aarssen, L. W. 1997. High productivity in grassland ecosystems: effected by species diversity or productive species? – Oikos 80: 183–184.
Alm, J. et al. 1990. Preference of cabbage white butterflies and honey bees for nectar that contains amino acids. – Oecologia 84: 53–57.
Austin, M. P. and Meyers, J. A. 1996. Current approaches to modelling the environmental niche of eucalypts: implication for management of forest biodiversity. – For. Ecol. Manage. 85: 95–106.
Balzan, M. V. et al. 2014. Augmenting flower trait diversity in wildflower strips to optimise the conservation of arthropod functional groups for multiple agroecosystem services. – J. Insect Conserv. 18: 713–728.
Bello, F. de et al. 2010. Towards an assessment of multiple ecosys-tem processes and services via functional traits. – Biodivers. Conserv. 19: 2873–2893.
Binkenstein, J. et al. 2013. Increasing land-use intensity decreases floral colour diversity of plant communities in temperate grasslands. – Oecologia 173: 461–471.
Blüthgen, N. and Klein, A.-M. 2011. Functional complementarity and specialisation: the role of biodiversity in plant–pollinator interactions. – Basic Appl. Ecol. 12: 282–291.
Botta-Dukát, Z. 2005. Rao’s quadratic entropy as a measure of functional diversity based on multiple traits. – J. Veg. Sci. 16: 533–540.
Bunker, D. E. et al. 2005. Species loss and aboveground carbon storage in a tropical forest. – Science 310: 1029–1031.
Brittain, C. et al. 2013. Synergistic effects of non-Apis bees and honey bees for pollination services. – Proc. R. Soc. B 280: 20122767.
Cadotte, M. W. et al. 2011. Beyond species: functional diversity and the maintenance of ecological processes and services. – J. Appl. Ecol. 48: 1079–1087.
Cakmak, I. et al. 2009. Different solutions by bees to a foraging problem. – Anim. Behav. 77: 1273–1280.
Callaway, R. M. 1995. Positive interactions among plants. – Bot. Rev. 61: 306–349.
Cardinale, B. J. et al. 2012. Biodiversity loss and its impact on humanity. – Nature 486: 59–67.
Carter, C. et al. 2006. A novel role for proline in plant floral nectars. – Naturwissenschaften 93: 72–79.

EV-11
Plummer, M. and Stukalov, A. 2014. Rjags: Bayesian graphical models using MCMC. – < https://CRAN.R-project.org/package=rjags >.
Rao, C. R. 1982. Diversity and dissimilarity coefficients: a unified approach. – Theor. Popul. Biol. 21: 24–43.
Roscher, C. et al. 2004. The role of biodiversity for element cycling and trophic interactions: an experimental approach in a grassland community. – Basic Appl. Ecol. 5: 107–121.
Schuldt, A. et al. 2014. Functional and phylogenetic diversity of woody plants drive herbivory in a highly diverse forest. – New Phytol. 202: 864–873.
Schumacher, J. and Roscher, C. 2009. Differential effects of functional traits on aboveground biomass in semi-natural grasslands. – Oikos 118: 1659–1668.
Stout, J. C. et al. 2000. Nectar robbing, forager efficiency and seed set: bumblebees foraging on the self incompatible plant Linaria vulgaris (Scrophulariaceae). – Acta Oecol. 21: 277–283.
Stang, M. et al. 2006. Asymmetric specialization and extinction risk in plant–flower visitor webs: a matter of morphology or abundance? – Oecologia 151: 442–453.
Tilman, D. et al. 1997. the influence of functional diversity and composition on ecosystem processes. – Science 277: 1300–1302.
Westrich, P. 1990. Die Wildbienen Baden-Württembergs. – Eugen Ulmer Verlag.
Willmer, P. G. 1980. The effects of insect visitors on nectar constituents in temperate plants. – Oecologia 47: 270–277.
Yoshioka, Y. et al. 2007. Ability of bumblebees to discriminate differences in the shape of artificial flowers of Primula sieboldii (Primulaceae). – Ann. Bot. 99: 1175–1182.
Zimmerman, M. 1988. pollination biology of montane plants: relationship between rate of nectar production and standing crop. – Am. Midl. Nat. 120: 50–57.
Zych, M. 2006. On flower visitors and true pollinators: the case of protandrous Heracleum sphondylium. – Plant Syst. Evol. 263: 159–179.
Klotz, S. et al. 2002. BIOLFLOR – Eine Datenbank mit biologisch-ökologischen Merkmalen zur Flora von Deutschland. – BfN-Schriftenvertrieb im Landwirtschaftsverlag GmbH.
Knuth, P. 1891. Die Einwirkung der Blütenfarben auf der photog-raphischen Platte. – Biol. Centralbl. 48: 160–165.
Laliberté, E. and Legendre, P. 2010. A distance-based framework for measuring functional diversity from multiple traits. – Ecology 91: 299–305.
Lamborn, E. and Ollerton, J. 2000. Experimental assessment of the functional morphology of inflorescences of Daucus carota (Apiaceae): testing the “fly catcher effect.” – Funct. Ecol. 14: 445–454.
Laughlin, D. C. 2011. Nitrification is linked to dominant leaf traits rather than functional diversity. – J. Ecol. 99: 1091–1099.
Lavorel, S. et al. 2011. Using plant functional traits to understand the landscape distribution of multiple ecosystem services. – J. Ecol. 99: 135–147.
McGill, B. J. et al. 2006. Rebuilding community ecology from functional traits. – Trends Ecol. Evol. 21: 178–185.
Mokany, K. et al. 2008. Functional identity is more important than diversity in influencing ecosystem processes in a temperate native grassland. – J. Ecol. 96: 884–893.
Mouillot, D. et al. 2011. Functional structure of biological communities predicts ecosystem multifunctionality. – PLoS ONE 6: e17476.
Naeem, S. et al. 2012. The functions of biological diversity in an age of extinction. – Science 336: 1401–1406.
Pacini, E. et al. 2003. Nectar biodiversity: a short review. – Plant Syst. Evol. 238: 7–21.
Park, T. and Casella, G. 2008. The Bayesian lasso. – J. Am. Stat. Assoc. 103: 681–686.
Petropoulou, Y. et al. 2001. Improved flower advertisement, pollinator rewards and seed yield by enhanced UV-B radiation in the Mediterranean annual Malcolmia maritima. – New Phytol. 152: 85–90.
Plummer, M. JAGS: A program for analysis of Bayesian graphical models using Gibbs sampling. – < http://mcmc-jags.sourceforge.net >.
Supplementary material (available online as Appendix oik-03869 a < www.oikosjournal.org/appendix/oik-03869 >). Appendix 1.