functional mapping of neural pathways in rodent brain in vivo using manganese-enhanced...
TRANSCRIPT

NMR IN BIOMEDICINENMR Biomed. 2004;17:554–568Published online in Wiley InterScience (www.interscience.wiley.com). DOI:10.1002/nbm.937
Functional mapping of neural pathways in rodent brainin vivo using manganese-enhanced three-dimensionalmagnetic resonance imaging
Takashi Watanabe, Jens Frahm and Thomas Michaelis*
Biomedizinische NMR Forschungs GmbH am Max-Planck-Institut fur biophysikalische Chemie, Gottingen, Germany
Received 12 March 2004; Revised 1 October 2004; Accepted 1 October 2004
ABSTRACT: This work presents three-dimensional MRI studies of rodent brain in vivo after focal and systemic
administration of MnCl2. Particular emphasis is paid to the morphology and dynamics of Mn2þ-induced MRI signal
enhancements, and the physiological mechanisms underlying cerebral Mn2þ uptake and distribution. It turns out that
intravitreal and intrahippocampal injections of MnCl2 emerge as useful tools for a delineation of major axonal connections
in the intact central nervous system. Subcutaneous administrations may be exploited to highlight regions involved in
fundamental brain functions such as the olfactory bulb, inferior colliculus, cerebellum and hippocampal formation.
Specific insights into the processes supporting cerebral Mn2þ accumulation may be obtained by intraventricular MnCl2injection as well as by pharmacologic modulation of, for example, hippocampal function. Taken together, Mn2þ-enhanced
MRI opens new ways for mapping functioning pathways in animal brain in vivo with applications ranging from
assessments of transgenic animals to follow-up studies of animal models of human brain disorders. Copyright # 2004
John Wiley & Sons, Ltd.
KEYWORDS: magnetic resonance imaging; manganese; neural tract tracer; contrast agent; brain morphology; brain
function; hippocampus; visual pathway
INTRODUCTION
Since the pioneering work of Koretsky and coworkers,1,2
the use of Mn2þ ions has attracted growing attention bothin the MRI community and among researchers in neu-roscience. Particular interest in the use of Mn2þ stemsfrom its potential as an MRI contrast agent for functionalmapping of animal brain in vivo. Exploring variousadministration routes the technique has been optimizedfor a large number of brain systems and a variety ofvertebrates (e.g. see other papers in this volume).
In principle, the approach relies upon the fact that Mn2þ
can be taken up by excitable neurons as an analog to Ca2þ
through voltage-gated divalent cation channels.3,4 Forexample, in cultured cerebellar granule cells, the entryof extracellular Mn2þ via Ca2þ-permeant channels hasbeen demonstrated using fluorescence quenching of in-tracellular indicator dyes after cellular stimulation eitherby depolarization using a high potassium concentration orby glutamatergic agonists.5 These data support the notionthat the uptake of extracellular Mn2þ by a neuron isdirectly coupled to its physiologic activity and function.
Here, we review recent in vivo MRI findings of Mn2þ-induced signal enhancements in the brain of behavingmice and rats which have been obtained 2–72 hours afterfocal or systemic administration of a single dose ofMnCl2.
MATERIALS AND METHODS
Animals and MRI
All studies were performed in accordance with Germananimal protection laws and approved by the responsiblegovernmental authority. MRI was carried out at 2.35 Tusing a MRBR 4.7/400 mm magnet (Magnex Scientific,Abingdon, UK) equipped with B-GA20 gradients(200 mm inner diameter, 100 mT m�1 maximumstrength) and driven by a DBX system (Bruker Biospin,Ettlingen, Germany).
Copyright # 2004 John Wiley & Sons, Ltd. NMR Biomed. 2004;17:554–568
*Correspondence to: T. Michaelis, Biomedizinische NMR ForschungsGmbH, 37070 Gottingen, Germany.E-mail: [email protected]
Abbreviations used: APV, DL-2-amino-5-phosphonovaleric acid;BBB, blood–brain barrier; CA1–CA4, hippocampal subfields; Ce,cerebellum; CNR, contrast-to-noise ratio; CNS, central nervous sys-tem; CP, choroid plexus; CSF, cerebrospinal fluid; DG, dentate gyrus;Fi, fimbria; FLASH, fast low angle shot; Fx, precommissural fornix;GL, granule cell layer; Hb, habenula; HF, hippocampal formation; Hi,hilus; IC, inferior colliculus; IP, interpeduncular nucleus; ISF, inter-stitial fluid; L, stratum lucidum; LGN, lateral geniculate nucleus; LSD,dorsolateral septal nucleus; MRI, magnetic resonance imaging; OB,olfactory bulb; ON, optic nerve; OPN, olivary pretectal nucleus;OT, optic tract; Pi, pineal gland; Pit, pituitary gland; Ret, retina;ROI, region-of-interest; S, subiculum; SC, superior colliculus; SCN,suprachiasmatic nucleus; SD, standard deviation; SNR, signal-to-noiseratio; SP, stratum pyramidale; TSN, triangular septal nucleus; VHC,ventral hippocampal commissure.

For in vivo MRI the animals were kept under anesthesiausing 0.2–1.5% halothane in a 7:3 mixture of N2O andO2. After being relaxed, the animals were intubated witha purpose-built endotracheal tube, and artificially venti-lated with an animal respirator. Rats and mice wereplaced in a supine and prone position, respectively, withtheir heads firmly fixed in a purpose-built stereotaxicdevice. The rectal body temperature was maintainedconstant at 37� 1 �C using heated water blankets. Aftereach measurement the animals were recovered fromanesthesia and returned to their cages with free accessto food and water.
For rats radiofrequency excitation and signal receptionwere accomplished with use of a birdcage coil (154 mminner diameter) and a saddle-shaped surface coil (40 mmdiameter), respectively. Mice were studied with a Helm-holtz excitation coil (100 mm diameter) and an ellipticalsurface coil (20 mm anterior–posterior, 12 mm left–right)for signal reception.
Image acquisitions were based on a T1-weighted gra-dient-echo MRI sequence (radiofrequency-spoiled three-dimensional FLASH) yielding a spatial resolution ran-ging from 195� 195� 125mm3 for rats to an isotropicresolution of 117mm for mice.6 Explicit values are givenin the figure captions. For a more detailed description ofexperimental methods, readers are referred to the originalpublications.7–10
Manganese administration
The visual pathway of rats was studied using a 5 mininjection of an aqueous solution of MnCl2 (0.1ml,1000 mM) following experimental procedures describedelsewhere.7 Briefly, injections were performed underanesthesia by inserting a needle into the vitreous bodyof the left eye with the aid of a microscope. Properplacement of the needle was verified by observing themagnified image of the tip through the lens of theanimal’s eye. After 15 min the needle was slowly with-drawn to minimize the loss of MnCl2 from leakage at theinjection site.
The hippocampal system of C57BL/6J mice was stu-died with use of stereotaxic bilateral microinjections ofMnCl2 (0.25 ml, 5–200 mM) into the posterior hippocam-pal formation.10 Similarly, mouse studies of the cerebraluptake and distribution of Mn2þ from the CSF employedstereotaxic injections of MnCl2 (0.25 ml, 5 mM) into theleft lateral ventricle. Systemic administrations in micewere accomplished by means of subcutaneous injectionsof MnCl2 (5 ml/kg body weight, 20 mM).8
Data analysis
For image analysis anatomic cross-sections were ob-tained by multiplanar reconstructions from the original
three-dimensional (3D) MRI data sets. Quantitative eva-luations of the signal-to-noise ratio (SNR), here definedas the MRI signal intensity divided by the standarddeviation of the noise, were performed using softwaresupplied by the manufacturer. Standardized regions-of-interest (ROI) were selected in close accordance toresolved anatomic structures.
RESULTS
Intravitreal manganese administration
Figure 1 shows a pronounced anterograde Mn2þ enhance-ment of retinal projections in rat brain after injection ofan aqueous MnCl2 solution into the left vitreous body.7
The images represent selected sections from a 3D MRIdata set obtained 24 h after injection. They result in aclear delineation of the retina, the axonal tract andterminal fields including the suprachiasmatic nuclei.Because the vitreous body serves as a closed reservoirfor Mn2þ ions, sufficient amounts of MnCl2 can beadministered near to retinal neurons without damagingtheir cellular membrane integrity. Therefore, the ob-served MRI signal enhancement may be assigned to theneuronal uptake of Mn2þ ions rather than to their diffu-sion into the intracellular space through torn neuronalmembranes.
The enhancement of the rat retinal projection pathwayis best delineated by maximum intensity projectionsshown in Fig. 2. A comparison of results obtained atvarious stages after injection revealed an optimal CNRand good anatomic continuity of enhanced structures at24 h post-injection. While early data sets exhibited in-sufficient transport of Mn2þ ions beyond the opticchiasm, examinations at 48 h post-injection or latersuffered from fading contrast. It should be noted, how-ever, that the axonal terminal areas showed less decline ofthe Mn2þ-induced contrast between 24 and 72 h post-injection than the optic tract, which represents the pro-jecting portion of the axons.
A quantitative analysis of the SNR in structures withincreasing distance from the injection site confirms theseobservations. Table 1 summarizes SNR values for theenhanced optic nerve (nearest to the injection site), thecontralateral optic tract (medial distance) and the con-tralateral superior colliculus (largest distance) as well asfor control regions in the cortex and basal ganglia. Thesequential acquisitions at different time points allowedfor an estimate of the velocity of the Mn2þ enhancementalong the projection fibers. For example, a weak butunequivocal enhancement of the superior colliculus wasdetected about 8 h after injection in all animals. From the3D MRI data the length of the pathway from the opticdisc to the superior colliculus was determined to be22.5� 0.9 mm which results in a speed of about2.8 mm h�1 for the axonal transport of Mn2þ ions.
MANGANESE-ENHANCED MRI OF RODENT BRAIN 555
Copyright # 2004 John Wiley & Sons, Ltd. NMR Biomed. 2004;17:554–568

The in vivo Mn2þ mapping of the rat visual pathway isin general agreement with the well-documented projec-tions identified by conventional invasive methods. Inrodents, the great majority of the optic nerve fibers areknown to cross at the chiasm.11 The fibers then enter the
Figure 1. Manganese-induced MRI signal enhancement ofthe rat retinal projection pathway 24 h after injection of0.1ml MnCl2 (1000mM) into the left vitreous body (T1-weighted 3D FLASH, TR/TE¼15/4.2ms, 25� flip angle,195�195� 125mm3 resolution). Enhanced structures referto the left retina (Ret), left optic nerve (ON), right optic tract(OT), right and left suprachiasmatic nucleus (SCN), rightlateral geniculate nucleus (LGN), right olivary pretectal nu-cleus (OPN), and right superior colliculus (SC). [Adapted andreproduced fromWatanbe T, Michaelis T, Frahm J. Mappingof retinal projections in the living rat using high-resolution3D gradient-echo MRI with MN2þ -induced contrast. Magn.Reson. Med. 2001; 46: 424–429. Copyright # 2001 JohnWiley & Sons, Inc. Reprinted with permission of Wiley-Liss,Inc., a subsidiary of John Wiley & Sons, Inc.] 7
Figure 2. Maximum intensity projections of the retinalprojection pathway (same animal as in Fig. 1) at (top) 8 h,(middle) 24 h and (bottom) 48 h after MnCl2 injection intothe left vitreous body (rostro-caudal view to minimize over-lap of enhanced structures with high intensities from fat andvessels). For other parameters see Fig. 1. [Adapted andreproduced from Watanabe T, Michaelis T, Frahm J. Map-ping of retinal projections in the living rat using high-resolution 3D gradient-echo MRI with MN2þ -induced con-trast. Magn. Reson. Med. 2001; 46: 424–429. Copyright #2001 John Wiley & Sons, Inc. Reprinted with permission ofWiley-Liss, Inc., a subsidiary of John Wiley & Sons, Inc.]7
Table 1. SNR of the rat visual pathway after intravitreous injection of 0.1 ll MnCl2 (1000mM)
Region ROI 8 h 24 h 48 h 72 h(mm2) (n¼ 3) (n¼ 4) (n¼ 4) (n¼ 3)
Left optic nerve 0.20 22.0� 0.7 25.0� 3.9 22.6� 3.1 20.1� 4.4Right optic tract 0.34 18.2� 2.1 19.5� 2.0 18.9� 1.6 17.7� 1.8Superior colliculus 0.57 26.9� 1.5 32.0� 1.9 29.1� 3.3 28.8� 3.3Cortex 0.95 19.1� 1.1 18.5� 1.7 19.2� 0.8 18.4� 1.9Basal ganglia 0.95 17.1� 0.8 16.6� 1.1 17.4� 1.1 16.9� 0.5
The data represent mean values� SD averaged across animals.
556 T. WATANABE ET AL.
Copyright # 2004 John Wiley & Sons, Ltd. NMR Biomed. 2004;17:554–568
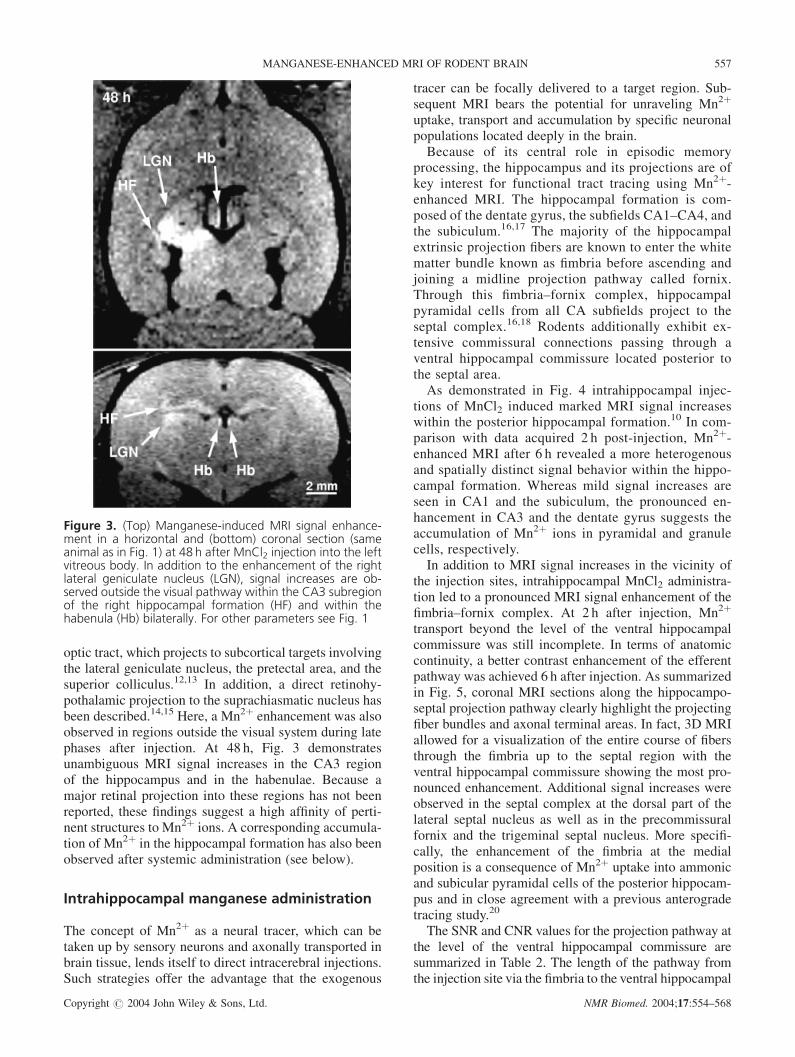
optic tract, which projects to subcortical targets involvingthe lateral geniculate nucleus, the pretectal area, and thesuperior colliculus.12,13 In addition, a direct retinohy-pothalamic projection to the suprachiasmatic nucleus hasbeen described.14,15 Here, a Mn2þ enhancement was alsoobserved in regions outside the visual system during latephases after injection. At 48 h, Fig. 3 demonstratesunambiguous MRI signal increases in the CA3 regionof the hippocampus and in the habenulae. Because amajor retinal projection into these regions has not beenreported, these findings suggest a high affinity of perti-nent structures to Mn2þ ions. A corresponding accumula-tion of Mn2þ in the hippocampal formation has also beenobserved after systemic administration (see below).
Intrahippocampal manganese administration
The concept of Mn2þ as a neural tracer, which can betaken up by sensory neurons and axonally transported inbrain tissue, lends itself to direct intracerebral injections.Such strategies offer the advantage that the exogenous
tracer can be focally delivered to a target region. Sub-sequent MRI bears the potential for unraveling Mn2þ
uptake, transport and accumulation by specific neuronalpopulations located deeply in the brain.
Because of its central role in episodic memoryprocessing, the hippocampus and its projections are ofkey interest for functional tract tracing using Mn2þ-enhanced MRI. The hippocampal formation is com-posed of the dentate gyrus, the subfields CA1–CA4, andthe subiculum.16,17 The majority of the hippocampalextrinsic projection fibers are known to enter the whitematter bundle known as fimbria before ascending andjoining a midline projection pathway called fornix.Through this fimbria–fornix complex, hippocampalpyramidal cells from all CA subfields project to theseptal complex.16,18 Rodents additionally exhibit ex-tensive commissural connections passing through aventral hippocampal commissure located posterior tothe septal area.
As demonstrated in Fig. 4 intrahippocampal injec-tions of MnCl2 induced marked MRI signal increaseswithin the posterior hippocampal formation.10 In com-parison with data acquired 2 h post-injection, Mn2þ-enhanced MRI after 6 h revealed a more heterogenousand spatially distinct signal behavior within the hippo-campal formation. Whereas mild signal increases areseen in CA1 and the subiculum, the pronounced en-hancement in CA3 and the dentate gyrus suggests theaccumulation of Mn2þ ions in pyramidal and granulecells, respectively.
In addition to MRI signal increases in the vicinity ofthe injection sites, intrahippocampal MnCl2 administra-tion led to a pronounced MRI signal enhancement of thefimbria–fornix complex. At 2 h after injection, Mn2þ
transport beyond the level of the ventral hippocampalcommissure was still incomplete. In terms of anatomiccontinuity, a better contrast enhancement of the efferentpathway was achieved 6 h after injection. As summarizedin Fig. 5, coronal MRI sections along the hippocampo-septal projection pathway clearly highlight the projectingfiber bundles and axonal terminal areas. In fact, 3D MRIallowed for a visualization of the entire course of fibersthrough the fimbria up to the septal region with theventral hippocampal commissure showing the most pro-nounced enhancement. Additional signal increases wereobserved in the septal complex at the dorsal part of thelateral septal nucleus as well as in the precommissuralfornix and the trigeminal septal nucleus. More specifi-cally, the enhancement of the fimbria at the medialposition is a consequence of Mn2þ uptake into ammonicand subicular pyramidal cells of the posterior hippocam-pus and in close agreement with a previous anterogradetracing study.20
The SNR and CNR values for the projection pathway atthe level of the ventral hippocampal commissure aresummarized in Table 2. The length of the pathway fromthe injection site via the fimbria to the ventral hippocampal
Figure 3. (Top) Manganese-induced MRI signal enhance-ment in a horizontal and (bottom) coronal section (sameanimal as in Fig. 1) at 48 h after MnCl2 injection into the leftvitreous body. In addition to the enhancement of the rightlateral geniculate nucleus (LGN), signal increases are ob-served outside the visual pathway within the CA3 subregionof the right hippocampal formation (HF) and within thehabenula (Hb) bilaterally. For other parameters see Fig. 1
MANGANESE-ENHANCED MRI OF RODENT BRAIN 557
Copyright # 2004 John Wiley & Sons, Ltd. NMR Biomed. 2004;17:554–568

commissure was determined to be 4.3� 0.5 mm in bothhemispheres. An evaluation of the time course of SNRincreases demonstrates that 2 h are sufficient to transportMn2þ ions from the posterior hippocampus to the ventralhippocampal commissure, but that-at least for a 5 mM
solution of MnCl2-this process has not led to a saturationof the local Mn2þ concentration.
Subcutaneous manganese administration
Observations of Mn2þ-induced MRI signal enhance-ments in response to a focal exposure of retinal or
hippocampal neurons to MnCl2 confirm the capabilityof Mn2þ ions to specifically label neuronal populationsand to map connected axonal tracts. Beyond this quali-tative understanding, regional differences in Mn2þ affi-nity between brain systems and even within a singlesystem may be related to quantitative differences in brainfunction. Such effects should also become detectableafter systemic applications of MnCl2 which are expectedto yield specific cerebral enhancements discernable froma non-specific ‘background’ MRI signal enhancement of‘less active’ brain tissue. In fact, high-resolution auto-radiography demonstrated Mn2þ ions to accumulate inthe olfactory bulb, olfactory nuclei, inferior colliculi,
Figure 4. (Top) Manganese-induced MRI signal enhancement of the brain of a C57BL/6Jmouse (left) 2 h and (right) 6 h after intrahippocampal injection of 0.25 ml of MnCl2(200mM) in horizontal sections (T1-weighted 3D FLASH, TR/TE¼17/7.6ms, 25� flip angle,117�156� 156mm3 interpolated to 117mm isotropic resolution). In contrast to pro-nounced signal increases in and around the posterior hippocampal formation early afterinjection, MRI at 6 h reveals a more heterogenous and spatially distinct signal behavior.(Bottom) The left hippocampal formation of a C57BL/6J mouse in (left) a histologic section(courtesy of Rosen et al.)19 and (right) a corresponding MRI section 6 h after intrahippo-campal MnCl2 injection (magnified view of top right image). The latter demonstrates MRIsignal enhancement in the dentate gyrus (DG) and CA3 subfield as well as milder signalincreases in the CA1 subfield and subiculum (S). [Reprinted from Neuroimage, 22;Watanabe T, Radulovic J, Spiess J, Natt O, Boretius S, Frahm J, Michaelis T. In vivo 3DMRI staining of the mouse hippocampal system using intrecerebral injection of MnCl2; 860–867. Copyright # 2004, with permission from Elsevier.]10
558 T. WATANABE ET AL.
Copyright # 2004 John Wiley & Sons, Ltd. NMR Biomed. 2004;17:554–568

Figure 5. (Left) Manganese-induced MRI signal enhancement alongthe hippocampo-septal projection pathway of a C57BL/6J mouse (sameanimal as in Fig. 4) 6 h after intrahippocampal injection of MnCl2 and(right) corresponding magnified views. Arrowheads and dashed linesindicate enhanced structures such as the medial part of the fimbria (Fi)bilaterally, the ventral hippocampal commissure (VHC), the dorsal partof the lateral septal nucleus (LSD) bilaterally, the precommissural fornix(Fx), and the triangular septal nucleus (TSN). For other parameters seeFig. 4. [Reprinted from Neuroimage, 22; Watanabe T, Radulovic J,Spiess J, Natt O, Boretius S, Frahm J, Michaelis T. In vivo 3DMRI stainingof the mouse hippocampal system using intrecerebral injection ofMnCl2; 860–867. Copyright# 2004, with permission from Elsevier.]10
Table 2. SNR and CNR of the ventral hippocampal commissure and the cortex of C57BL/6J mice after intrahippo-campal injection of 0.25 ll MnCl2 (5mM)
Region ROI Control 2 h 6 h(mm2) (n¼ 3) (n¼ 4) (n¼ 3)
SNR VHC 0.50 24.6� 1.2 28.9� 1.7* 32.1� 1.9**Cortex 0.50 20.7� 1.4 22.2� 1.0 23.8� 1.3*
CNR VHC – cortex — 3.9� 0.3 6.7� 1.0* 8.3� 0.8**
The data represent mean values� SD averaged across animals; *p< 0.05, **p< 0.01 (unpaired t-test vs control).
MANGANESE-ENHANCED MRI OF RODENT BRAIN 559
Copyright # 2004 John Wiley & Sons, Ltd. NMR Biomed. 2004;17:554–568

amygdala, thalamus, hippocampal formation and cere-bellum after systemic administration.21–23 Moreover,non-MRI studies indicated that Mn2þ reaches the brainacross the BBB and blood-CSF barrier.24–26
Figure 6 reveals spatially distinct short-term and long-term MRI signal enhancements in mouse brain aftersystemic MnCl2 application.9 For MRI, a subcutaneousroute was chosen in order to provide a sustained supply ofMn2þ ions via a slow rate of absorption into the systemiccirculation. This seems to be advantageous in terms ofMn2þ delivery to the brain because the transfer across theBBB is limited24 and because the approach avoids ‘first-pass’ hepatic losses as the bile is the main route for theelimination of Mn2þ from the body.27 At 6 h afteradministration (center column of Fig. 6), the choroidplexus, pineal gland and anterior pituitary gland show apronounced enhancement. On the other hand, brainregions such as the olfactory bulb, hippocampal forma-tion and cerebellar cortex reveal an enhancement inlater examinations (right column). At 48 h, the Mn2þ
enhancement improves the delineation of the layeredstructures within the cerebellum as the outer bright layercircumscribes an interior region without a substantialSNR increase. Most likely, the bright signal representsMn2þ uptake and accumulation within the cerebellar
cortex, while the interior non-enhancing areas refer towhite matter. The underlying differences in cell densityof the identified layers are in line with recent resultsobtained by magnetization transfer MRI of mouse cere-bellum.9
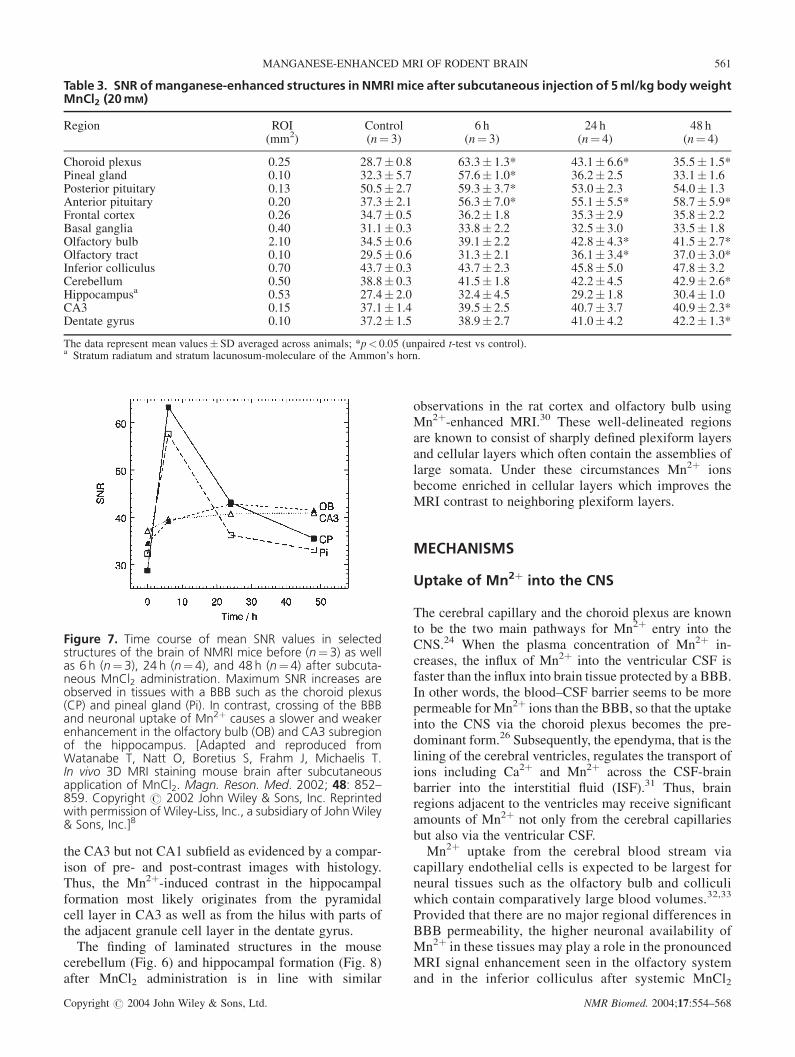
The kinetic behavior of Mn2þ-induced MRI signalenhancements after subcutaneous administration is sum-marized in Table 3 and visualized in Fig. 7. It is char-acterized by a pronounced and relatively fast MRI signalincrease in endocrine tissue without a BBB, and a weakerand delayed enhancement in brain tissues comprising thecerebellum, olfactory bulb and hippocampal CA3 region.The prolonged signal increase of the anterior pituitarygland indicates retention of Mn2þ in line with a specialuptake mechanism reported for its Ca2þ channels.28
At 48 h after subcutaneous MnCl2, Fig. 8 showsmarked Mn2þ-induced MRI signal enhancements of theolfactory bulb and the lateral olfactory tract, addingfurther evidence for the uptake of Mn2þ by secondaryolfactory neurons. The sagittal and coronal sections (topand middle rows of Fig. 8) highlight Mn2þ contrast in theinferior colliculus, the habenulae on both sides, and thehippocampal formation. Magnified views of a hippocam-pal ventral section (bottom) reveal a close correspon-dence of enhanced structures to the dentate gyrus and to
Figure 6. Manganese-induced MRI signal enhancement of the brain of an NMRImouse (left) before as well as (middle) 6 h and (right) 48 h after subcutaneousinjection of 5ml/kg body weight MnCl2 (20mM) in (top) horizontal and (bottom)midsagittal sections (T1-weighted 3D FLASH, TR/TE¼ 22/8.2ms, 30� flip angle,120�145� 145mm3 interpolated to 120mm isotropic resolution). In contrast to amarked though transient MRI signal enhancement in the choroid plexus (CP), pinealgland (Pi), and anterior pituitary gland (Pit), brain tissues with a BBB such as theolfactory bulb (OB), dentate gyrus and CA3 subregion of the hippocampal formation(HF), and cerebellum (Ce) exhibit a delayed and more persistent enhancement.[Adapted and reproduced from Watanabe T, Natt O, Boretius S, Frahm J, MichaelisT. In vivo 3DMRI staining mouse brain after subcutaneous application of MnCl2.Magn.Reson. Med. 2002; 48: 852–859. Copyright# 2002 John Wiley & Sons, Inc. Reprintedwith permission of Wiley-Liss, Inc., a subsidiary of John Wiley & Sons, Inc.]8
560 T. WATANABE ET AL.
Copyright # 2004 John Wiley & Sons, Ltd. NMR Biomed. 2004;17:554–568
the CA3 but not CA1 subfield as evidenced by a compar-ison of pre- and post-contrast images with histology.Thus, the Mn2þ-induced contrast in the hippocampalformation most likely originates from the pyramidalcell layer in CA3 as well as from the hilus with parts ofthe adjacent granule cell layer in the dentate gyrus.
The finding of laminated structures in the mousecerebellum (Fig. 6) and hippocampal formation (Fig. 8)after MnCl2 administration is in line with similar
observations in the rat cortex and olfactory bulb usingMn2þ-enhanced MRI.30 These well-delineated regionsare known to consist of sharply defined plexiform layersand cellular layers which often contain the assemblies oflarge somata. Under these circumstances Mn2þ ionsbecome enriched in cellular layers which improves theMRI contrast to neighboring plexiform layers.
MECHANISMS
Uptake of Mn2þ into the CNS
The cerebral capillary and the choroid plexus are knownto be the two main pathways for Mn2þ entry into theCNS.24 When the plasma concentration of Mn2þ in-creases, the influx of Mn2þ into the ventricular CSF isfaster than the influx into brain tissue protected by a BBB.In other words, the blood–CSF barrier seems to be morepermeable for Mn2þ ions than the BBB, so that the uptakeinto the CNS via the choroid plexus becomes the pre-dominant form.26 Subsequently, the ependyma, that is thelining of the cerebral ventricles, regulates the transport ofions including Ca2þ and Mn2þ across the CSF-brainbarrier into the interstitial fluid (ISF).31 Thus, brainregions adjacent to the ventricles may receive significantamounts of Mn2þ not only from the cerebral capillariesbut also via the ventricular CSF.
Mn2þ uptake from the cerebral blood stream viacapillary endothelial cells is expected to be largest forneural tissues such as the olfactory bulb and colliculiwhich contain comparatively large blood volumes.32,33
Provided that there are no major regional differences inBBB permeability, the higher neuronal availability ofMn2þ in these tissues may play a role in the pronouncedMRI signal enhancement seen in the olfactory systemand in the inferior colliculus after systemic MnCl2
Figure 7. Time course of mean SNR values in selectedstructures of the brain of NMRI mice before (n¼3) as wellas 6 h (n¼3), 24 h (n¼ 4), and 48 h (n¼4) after subcuta-neous MnCl2 administration. Maximum SNR increases areobserved in tissues with a BBB such as the choroid plexus(CP) and pineal gland (Pi). In contrast, crossing of the BBBand neuronal uptake of Mn2þ causes a slower and weakerenhancement in the olfactory bulb (OB) and CA3 subregionof the hippocampus. [Adapted and reproduced fromWatanabe T, Natt O, Boretius S, Frahm J, Michaelis T.In vivo 3D MRI staining mouse brain after subcutaneousapplication of MnCl2. Magn. Reson. Med. 2002; 48: 852–859. Copyright # 2002 John Wiley & Sons, Inc. Reprintedwith permission of Wiley-Liss, Inc., a subsidiary of JohnWiley& Sons, Inc.]8
Table 3. SNR ofmanganese-enhanced structures in NMRI mice after subcutaneous injection of 5ml/kg bodyweightMnCl2 (20mM)
Region ROI Control 6 h 24 h 48 h(mm2) (n¼ 3) (n¼ 3) (n¼ 4) (n¼ 4)
Choroid plexus 0.25 28.7� 0.8 63.3� 1.3* 43.1� 6.6* 35.5� 1.5*Pineal gland 0.10 32.3� 5.7 57.6� 1.0* 36.2� 2.5 33.1� 1.6Posterior pituitary 0.13 50.5� 2.7 59.3� 3.7* 53.0� 2.3 54.0� 1.3Anterior pituitary 0.20 37.3� 2.1 56.3� 7.0* 55.1� 5.5* 58.7� 5.9*Frontal cortex 0.26 34.7� 0.5 36.2� 1.8 35.3� 2.9 35.8� 2.2Basal ganglia 0.40 31.1� 0.3 33.8� 2.2 32.5� 3.0 33.5� 1.8Olfactory bulb 2.10 34.5� 0.6 39.1� 2.2 42.8� 4.3* 41.5� 2.7*Olfactory tract 0.10 29.5� 0.6 31.3� 2.1 36.1� 3.4* 37.0� 3.0*Inferior colliculus 0.70 43.7� 0.3 43.7� 2.3 45.8� 5.0 47.8� 3.2Cerebellum 0.50 38.8� 0.3 41.5� 1.8 42.2� 4.5 42.9� 2.6*Hippocampusa 0.53 27.4� 2.0 32.4� 4.5 29.2� 1.8 30.4� 1.0CA3 0.15 37.1� 1.4 39.5� 2.5 40.7� 3.7 40.9� 2.3*Dentate gyrus 0.10 37.2� 1.5 38.9� 2.7 41.0� 4.2 42.2� 1.3*
The data represent mean values� SD averaged across animals; *p< 0.05 (unpaired t-test vs control).a Stratum radiatum and stratum lacunosum-moleculare of the Ammon’s horn.
MANGANESE-ENHANCED MRI OF RODENT BRAIN 561
Copyright # 2004 John Wiley & Sons, Ltd. NMR Biomed. 2004;17:554–568

administration. However, because a strong inflow mayalso be accompanied by a similar outflow, a blood-pooleffect alone cannot account for the retained MRI signalenhancements observed 1–2 days after systemic admin-istration.
Neuronal uptake of Mn2þ
Extending in vitro studies at the cellular level,3–5 thepresent in vivo results confirm that extracellular Mn2þ
ions can enter into neurons via physiologic routes em-ployed for normal brain function. As far as intravitrealinjections are concerned, this is supported by the fact thatretinal ganglion cells express ion channels that are highlypermeable for divalent cations.34 In the hippocampusboth intrahippocampal and systemic administration ledto anatomically specific Mn2þ enhancements which arein agreement with results obtained by autoradiographic
studies.21 In the absence of major differences in neuroa-natomy-both CA1 and CA3 subfields possess the samefive-layered cytoarchitecture and contain pyramidal cellsas their main neurons-the observed differences in Mn2þ
enhancement most likely mirror differences in localexcitatory connectivity or function. In fact, CA3 andthe dentate area represent a prominent example of tworeciprocally connected networks35 in which the recurrentsynapses of CA3 have been found to play an essential rolein memory acquisition and recall.36 Moreover, extracel-lular recordings37 detected spontaneous action potentialsfrom CA3 but not CA1 pyramidal cell populations, whilesingle-channel recordings38 indicated that low-voltage-activated Ca2þ-channels are particularly abundant onpyramidal neurons in CA3 but not CA1. Thus, thespecific Mn2þ enhancement in the dentate–CA3 regionas opposed to the CA1–subiculum subfields seems toreflect the local functional activity in relation to intra-hippocampal processing.
Figure 8. Manganese-induced MRI signal enhancement of the brain of an NMRI mousebefore and 48 h after subcutaneous MnCl2 administration in (top) a parasagittal and (middle)a coronal section. Enhanced structures comprise the olfactory bulb (OB), lateral olfactorytract (arrowheads), dentate gyrus and CA3 subregion of the hippocampal formation (HF),inferior colliculus (IC), pituitary lobe (Pit) and habenulae (Hb). (Bottom) Magnified views of aventral hippocampal section perpendicular to the dorsoventral axis of the hippocampalformation in comparison with histology (courtesy of Jinno et al.29). The enhancement is mostpronounced in the stratum pyramidale (SP) in CA3, stratum lucidum (L), hilus (H), andgranule cell layer (GL). For other parameters see Fig. 6. [Adapted and reproduced fromWatanabe T, Natt O, Boretius S, Frahm J, Michaelis T. In vivo 3D MRI staining mouse brainafter subcutaneous application of MnCl2.Magn. Reson. Med. 2002; 48: 852–859. Copyright# 2002 John Wiley & Sons, Inc. Reprinted with permission of Wiley-Liss, Inc., a subsidiary ofJohn Wiley & Sons, Inc.]8
562 T. WATANABE ET AL.
Copyright # 2004 John Wiley & Sons, Ltd. NMR Biomed. 2004;17:554–568

The Mn2þ-induced MRI signal enhancements in theolfactory and auditory systems of mice after systemicadministration are in agreement with 2-deoxyglucoseautoradiograms of rat brain, indicating pronounced acti-vity in structures of the olfactory system39,40 as well as inthe inferior colliculus.41–43 Thus, the observation of aregional specific Mn2þ accumulation may be assumed toreflect, at least in part, integrated regional brain activityin relation to the fact that, in rodents, olfaction andaudition are known to dominate perception of the envir-onment under normal circumstances. This situationcertainly applies to the mice studied here, which wereawake and behaving normally for extended periods ofup to 2 days between Mn2þ administration and MRIexamination.
The affinity of the habenular nucleus to Mn2þ enhance-ment may be related to its unique physiologic properties.Again, 2-deoxyglucose autoradiography clearly demon-strated high levels of metabolic activity for the medialhabenular and the interpeduncular nuclei, even duringgeneral anesthesia.44,45 More recently, it has also beenobserved that the P2X receptor-mediated excitatory post-synaptic currents carried by Ca2þ are large within themedial habenula.46,47
In general, further uptake mechanisms have to beconsidered which may result in a slow transfer of Mn2þ
ions from the extracellular space to intraneuronal com-partments.48 Possible routes not mentioned so far may bedue to endocytosis or carrier-mediated transport. It isnoteworthy that, the later MRI measurements are per-formed after Mn2þ administration, the more such me-chanisms will contribute to the cerebral accumulation.
Axonal transport of Mn2þ
Representing a continuous flow of ions and proteinsalong nerve fibers,49,50axonal transport is another physio-logical process which supports the cerebral distributionof Mn2þ subsequent to neuronal uptake. Although thevelocity of about 2.8 mm h�1 estimated for the progres-sive Mn2þ enhancement from the retina to the superiorcolliculus includes both the uptake of Mn2þ by the retinalganglion cells and the subsequent flow along the opticnerve and tract, its value is within the range of neuroax-onal transport velocities of about 2 mm h�1 obtained foroptic nerve fibers in mice2 and 2.9 mm h�1 reported forprimary olfactory neurons in pikes.51
Mammalian axons exhibit two major anterogradetransport processes which possess a wide gap in speed.Slow axonal transport refers to velocities of 0.01–0.33 mm h�1, while the fast transport yields velocitiesin the range of 2–16 mm h�1.52 It may therefore beconcluded that the predominant contribution to the ax-onal transport of Mn2þ ions stems from the fast process.The responsible mechanism has previously been ascribedto the movement of membranous organelles along micro-
tubules as, for example, demonstrated in the axons of ratretinal ganglion cells.52 The MRI results obtained afterintrahippocampal injection of MnCl2 confirm this inter-pretation. The SNR increase observed at the site of theventral hippocampal commissure, which is 4.3 mm dis-tant from the injection site in the posterior hippocampalformation, also requires a transport velocity characteristicfor the fast process.
Extraneuronal distribution of Mn2þ
Despite the fact that neuronal uptake and subsequentaxonal transport of Mn2þ are likely to represent the majormechanisms responsible for the cerebral pattern of MRIenhancements, additional factors need to be discussed.This is because neurons are not isolated structures but aredependent on their environment for survival and function.In order to accomplish these goals there exists a well-orchestrated range of mechanisms which allow for amolecular exchange of, for example, ions, metabolitesand signalling proteins between extracellular and intra-cellular compartments. In a wider perspective this alsoincludes intercellular communication as well as exposureto CSF flow and cerebral blood flow. The putativesignificance of these mechanisms for the distribution ofMn2þ in the CNS will be discussed below.
Diffusion of Mn2þ within the ISF. Subsequent tofocal injections, Mn2þ ions may freely diffuse within theISF and lead to ‘secondary’ brain uptake. For example,after intracerebral injection, Mn2þ not only enters neu-rons in the immediate target region but also distributesinto neighboring areas. Accordingly, the temporal andspatial redistribution of the Mn2þ-induced MRI signalenhancement after intrahippocampal injection (Fig. 4, toprow) is characterized by a pronounced signal decrease inthe inner part of the hippocampal formation between 2and 6 h after injection. This is supposed to occur by Mn2þ
diffusion within the ISF. Moreover, enhancement of thehippocampal formation and habenulae was observed 2days after intravitreal injection (Fig. 3). Because a majorretinal projection into these regions has not been re-ported, the enhancement can be interpreted as evidencefor the release of Mn2þ ions from the retinal axons, thesubsequent diffusion within the ISF, and the neuronaluptake into functionally active brain systems.
Distribution of Mn2þ via CSF flow. Figure 9 demon-strates the uptake of Mn2þ into the CNS after a singleMnCl2 injection into the left lateral ventricle of a mouse.Apart from the signal increase of directly adjacent tissue,the resulting Mn2þ-induced MRI signal enhancementreflects both the directional CSF flow from the injectedlateral ventricle to the third and fourth ventricle and thefunctional relevance of the specific uptake into thehippocampal formation and beyond. While signal
MANGANESE-ENHANCED MRI OF RODENT BRAIN 563
Copyright # 2004 John Wiley & Sons, Ltd. NMR Biomed. 2004;17:554–568

increases in the hippocampus are more pronounced onthe injected side, the enhancement in the habenulaeoccurs bilaterally. Further on, from the habenulae,enhanced bundles can be traced more ventrally acrossthe thalamus to the interpeduncular nucleus. These ob-servations suggest that the earlier results reported forhippocampal and habenular enhancement after systemicand intravitreal application may be explained, at least inpart, by their good accessibility to Mn2þ released fromCSF-filled spaces. The data are also in line with theaforementioned diffusion of Mn2þ ions within the ISF.
Glial uptake of Mn2þ. Despite the fact that in braintissue the uptake and retention of ions occurs preferen-tially by neurons, this is not an entirely exclusive me-chanism as Mn2þ ions can also be found in glial cells.53
Although a significant glial uptake would certainly com-promise the use of Mn2þ-enhanced MRI for neuroaxonaltract tracing, the data obtained so far support the quanti-tative predominance of a neuronal rather than glial origin.In particular, this applies to the functionally dependentenhancement observed in specific layers of cell bodies,for example in the cerebellum and CA3. In fact, theenhancement of the efferent hippocampal projectionpathway provides unambiguous evidence for a neuraleffect because the underlying axonal transport requiresthe preceding uptake of Mn2þ by hippocampal neurons.Similarly, the concurrent enhancements in the olfactorybulb and lateral olfactory tract may be treated as anotherexample of the involvement of a cell body assemblytogether with its major projection pathway. Conversely, amajor unspecific uptake of Mn2þ in glia would be
expected to lead to an even distribution across braintissues and a homogeneous ‘background’ MRI enhance-ment beyond the values observed for control regions inTables 2 and 3.
Other aspects. When free Mn2þ ions enter the intra-cellular compartment, they bind to intracellular proteinsor organelles. This effect has been reported to greatlyenhance the intracellular proton relaxivity.54 In fact, therelaxation dispersion profiles of water protons in solu-tions containing a variety of Mn2þ protein complexesexhibit a maximum in the range of 10–100 MHz.55
Because of the binding of Mn2þ ions, putative contribu-tions to the MRI signal enhancement may also arise fromthe distribution of Mn2þ-dependent enzymes in the brainsuch as glutamine synthetase and superoxide dismu-tase.26 Glutamine synthetase is an astrocyte-specificprotein which contains eight Mn2þ ions and accountsfor approximately 80% of the total Mn2þ in brain.56 Inagreement with the present observation of a pronouncedMn2þ effect in the Ammon’s horn, CA3 pyramidal cellswere found to be strongly immunostained by manganesesuperoxide dismutase, whereas CA1 pyramidal cellswere only weakly reactive.57 However, it is less likelythat such effects play a prominent role in acute studieswith applications of high external doses. Finally, apartfrom direct effects on the detectability of MRI signalenhancements, the toxicity of chronic Mn2þ applicationsis expected to alter the functional responses of behavinganimals in the later stages of long-term studies.
FUTURE PERSPECTIVES
As demonstrated here and in other contributions to thisissue, the distribution of Mn2þ ions in the CNS dependson brain function, the route of administration, and severalother physiologic factors which are not always under thecontrol of the investigator. In general, these latter effectsmay pose limitations that are not specific for the use ofMn2þ for tissue staining, but also apply to other tracerscommonly in use. In order to confirm the neuroaxonalorigin and functional significance of Mn2þ as a contrastagent, the in vivo findings should be correlated withhistology and behavior. Moreover, pharmacologicallychallenged and genetically modified animals may helpto gain further insights into the Mn2þ-enhanced brain.
Functional tract tracing in vivo
In contrast to artifact-prone T2*-weighted sequencescommonly applied for functional MRI of the humanbrain, Mn2þ-induced contrast allows for high-resolutionT1-weighted 3D MRI acquisitions at superb quality. Suchdata reveal the true 3D architecture of the brain in a waythat cannot be appreciated from a series of conventional
Figure 9. Manganese-induced MRI signal enhancement ofthe brain of a C57BL/6J mouse 6 h after injection of 0.25 mlof MnCl2 (5mM) into the left lateral ventricle (T1-weighted3D FLASH, TR/TE¼ 17/7.6ms, 25� flip angle, 117�156�156mm3 interpolated to 117mm isotropic resolution). (Topleft) The injection site (white dots) is depicted in a para-sagittal section 0.8mm lateral to the midline and (top right)in a coronal section with arrows indicating the needle tract.(Bottom left) A parasagittal section 0.35mm lateral to themidline delineates the connection (arrowheads) betweenthe habenula (Hb) and the interpeduncular nucleus (IP).(Bottom right) An oblique section demonstrates the habe-nulo–interpeduncular tract (arrowheads) of both sides. Alsonote that brain tissue adjacent to CSF spaces is highlighted
564 T. WATANABE ET AL.
Copyright # 2004 John Wiley & Sons, Ltd. NMR Biomed. 2004;17:554–568

histologic slices. It should also be mentioned that recentadvances in morphologic tract tracing using diffusiontensor MRI face major SNR problems when attempting toachieve a sufficiently high resolution for murine brainin vivo.58
In comparison with invasive methods, a limitation offunctional tract tracing by Mn2þ-enhanced MRI is thelower sensitivity for small fiber tracts. For example,several retinal fiber tracts known to connect to the nucleiof the accessory optic system, as well as to the lateralgeniculate and olivary pretectal nuclei in the ipsilateralbrain, were not distinguishable after intravitreal injec-tions. This may be caused by a limited local concentra-tion of Mn2þ ions due to an insufficient accumulation inrespective neurons or by a low axonal fiber density alongthe target pathway or both. Previous work indicated thatMn2þ uptake into the olfactory epithelium and transfer tothe olfactory bulb along the primary olfactory neurons isa saturable process.59 If this applies to the uptake ofMn2þ by the retinal ganglion cells or the transport alongtheir axons, the locally achievable concentration might bethe limiting factor for the MRI enhancement.
In line with these considerations is the observation thatin spite of an excellent agreement of the in vivo findingswith previous non-MRI tracing studies of retinogeniculatepathways,12,13 intravitreal injection did not reveal a trans-synaptic connection. Delineation of the visual pathwaywas confined to regions known to directly project from theretina excluding the optic radiation and visual cortex. Thislack of MRI demarcation might be caused by a dilution ofMn2þ ions due to the fact that the optic radiation divergesand projects into a large visual cortical area.
Another complication may be caused by a release ofMn2þ ions from the retinal axons into the ISF as well asfrom the systemic circulation following absorption byretinal capillary vessels. In fact, the asymmetricallyenhanced hippocampus seen late after intravitreal injec-tion (Fig. 3) can be interpreted as evidence for a release ofMn2þ ions from the retinal axons.
In the case of focal intracerebral injections, the ap-proach again delineated only major projection fibers fromthe hippocampal formation. It must be assumed that largeamounts of Mn2þ ions may have been washed out fromthe injection site by diffusion within the extracellularspace. In this respect, it should be noted that the use ofvery high MnCl2 concentrations of up to 1000 mM failedto improve the situation by yielding only stronger butanatomically unspecific enhancements. So far, neitherhigh concentrations (> 200 mM MnCl2) nor long waitingperiods (> 24 h) were of advantage for a targeted deli-neation of white matter tracts.
A future perspective for intracerebral MnCl2 micro-injections could emerge from experimental indicationsthat Mn2þ accumulation in projection areas may serve asa measure of electrophysiologic, that is functional, activ-ity at the injection site.60 In the hippocampal system, theincoming projections from the entorhinal cortex to the
dentate gyrus are relayed to CA3 and subsequently toCA1 which then projects to the subiculum and back to theentorhinal cortex.61 Apart from forming a closed circuit,each of the hippocampal subfields, except for the dentategyrus, also gives rise to extrinsic projections. Theseconnections lend further support to the interpretationthat the observed Mn2þ-enhanced MRI signals in thefimbria and commissural projections (Fig. 5) can be usedas a measure for the activity of hippocampal neurons.Depending on the functional activity within this circuitry,the involvement and concurrent electric excitation of theentire hippocampal network is likely to aggravate theuptake of Mn2þ by neurons with extrinsic projections. Asa consequence, differences in Mn2þ accumulation rates ata terminal field (or intermediate projection site) wouldrepresent differences in Mn2þ influx as a measure ofneural activity at the injection site.
Neurofunctional significance ofMn2þ-enhanced MRI
Assuming the opening of neuronal Ca2þ channels to becoupled to physiological activity, Mn2þ-enhanced MRInot only relates to the local Mn2þ concentration but alsoreflects the degree of integrated functional activity overtime-apart from the abundance of respective divalentcation channels. This section adds further experimentalevidence in favor of the neurofunctional significance ofMn2þ-enhanced MRI from studies using pharmacologi-cally challenged animals.
Figure 10 shows the effect of kainic acid on theobservable Mn2þ distribution within the hippocampalformation. Peripheral injections of kainate are known toresult in a degeneration of hippocampal pyramidal cellsassociated with glial hypertrophy and proliferation.62 Adirect comparison of in vivo T1-weighted MRI withhistologic sections from the same animal [Fig. 10(A)]demonstrates that the excitotoxic neuronal cell deathcauses marked reductions of the normal T1 contrast inthe hippocampal formation yielding only mild to moder-ate signal intensities. Thus, the pronounced Mn2þ-in-duced signal enhancement in the dentate gyrus and CA3of controls after subcutaneous administration [Fig. 10(B),upper row] must be assigned to the uptake of Mn2þ intofunctioning hippocampal neurons. In the lesioned animal[Fig. 10(B), bottom row], the residual weak enhancementis more diffuse and slightly shifted across the border of theCA3 region. Under these circumstances one may spec-ulate whether Mn2þ is not only taken up by residual viablehippocampal neurons but also by activated glial cells.
Another way of demonstrating synaptic transmission tobe a prerequisite for Mn2þ-induced MRI signal enhance-ment is based on a pharmacologic disruption of normalcellular function by blocking the NMDA-type glutamatereceptors with the antagonist APV (DL-2-amino-5-phos-phonovaleric acid). The procedure hampers synaptic
MANGANESE-ENHANCED MRI OF RODENT BRAIN 565
Copyright # 2004 John Wiley & Sons, Ltd. NMR Biomed. 2004;17:554–568

transmission but in contrast to kainate lesioning leavesthe morphology of neurons intact. Figure 11 showspreliminary results of bilateral APV injections (3.2mgdissolved in 0.25 ml artificial CSF) into the posteriorhippocampal formation of a C57BL/6J mouse. The pro-
cedure followed earlier applications of intrahippocampalMnCl2 and is supposed to minimize mechanical damageto the hippocampal neurons.10 Immediately after APVadministration, the animal received a subcutaneous doseof MnCl2. In comparison with a control (Fig. 11, top and
Figure 10. Manganese-induced MRI signal enhancementand kainate-lesioning of the hippocampal formation of FVB/N mice in magnified views of horizontal sections coveringthe right hippocampus (T1-weighted 3D FLASH, TR/TE¼ 22/8.2ms, 30� flip angle, 100�100mm2 in-plane resolution,500mm section thickness). (A) Comparison of (left) MRI and(right) Nissl-stained histologic sections 4 days after adminis-tration of (top) placebo and (bottom) kainic acid. Thepyramidal cell loss in the lesioned animal corresponds tothe lack of T1-weighted MRI signal intensity. Modified fromNatt et al.9 (B) Manganese-induced MRI signal enhancement(left) before and (right) 48 h after subcutaneous injection of5ml/kg body weight MnCl2 (20mM) in animals 8 days afteradministration of (top) placebo and (bottom) kainic acid. Incontrast to controls, Mn2þ administration in lesioned ani-mals results in only minor to moderate MRI signal increasesin the dentate gyrus and outer layers of the Ammon’s horn
Figure 11. Manganese-inducedMRI signal enhancement ofthe brain of a C57BL/6J mouse (top) before and (middle)18 h after subcutaneous injection of 5ml/kg body weightMnCl2 (20mM) in an oblique section including the dorsalhippocampus and habenulae (T1-weighted 3D FLASH, TR/TE¼ 17/7.6ms, 25� flip angle, 117�156�156mm3 inter-polated to 117mm isotropic resolution). (Bottom) Similaracquisitions for a different animal 18 h after subcutaneousinjection of MnCl2 and simultaneous intrahippocampalinjection of DL-2-amino-5-phosphonovaleric acid (APV,3.2 mg). Intrahippocampal APV depressed the MRI signalenhancement in the dentate gyrus and CA3 subregion ofthe hippocampus (HF), but did not alter the enhancement inthe habenulae (Hb)
566 T. WATANABE ET AL.
Copyright # 2004 John Wiley & Sons, Ltd. NMR Biomed. 2004;17:554–568

middle) 3D MRI after 18 h revealed a depression of theotherwise pronounced enhancement in the dentate–CA3region of the dorsal hippocampus by APV. However,APV did not alter the enhancement in the habenulaewhich excludes an insufficient delivery of Mn2þ to thebrain tissue and thus a decreased Mn2þ availability forneuronal uptake as an explanation for the lack of en-hancement in the hippocampal formation. These findingsclearly indicate that other factors than the mere presenceof Mn2þ in the ISF are responsible for the hippocampalenhancement, namely normal physiologic functioningand neural processing of the cell assemblies in thedentate–CA3 region.
CONCLUDING REMARKS
Manganese may be used as a functional tracer for high-resolution MRI of the rodent brain in vivo. Regardless ofthe route of administration, the observed Mn2þ enhance-ment refers in part to the anatomical distribution ofexcitatory cells and/or their divalent cation channels,but mainly reflects the functional responses of specificbrain systems in terms of neural processing. This involvesthe intracellular uptake of Mn2þ into neurons and sub-sequent tracing of respective axonal projections. It isforeseeable that the unique insights of Mn2þ-enhancedMRI into the functioning brain will open new researchopportunities for studying transgenic animals, models ofhuman brain disorders, and novel therapeutic regimens.
Acknowledgments
The authors would like to thank Dr Jelena Radulovicfor stereotaxic intracerebral injections, StefanieGleisberg for the preparation of histologic sections andDr Shozo Jinno for providing confocal laser microscopicimages.
REFERENCES
1. Lin YJ, Koretsky AP. Manganese ion enhances T1-weighted MRIduring brain activation: an approach to direct imaging of brainfunction. Magn. Reson. Med. 1997; 38: 378–388.
2. Pautler RG, Silva AC, Koretsky AP. In vivo neuronal tract tracingusing manganese-enhanced magnetic resonance imaging. Magn.Reson. Med. 1998; 40: 740–748.
3. Drapeau P, Nachshen DA. Manganese fluxes and manganese-dependent neurotransmitter release in presynaptic nerve endingsisolated from rat brain. J. Physiol. 1984; 348: 493–510.
4. Narita K, Kawasaki F, Kita H. Mn and Mg influxes through Cachannels of motor nerve terminals are prevented by verapamil infrogs. Brain Res. 1990; 510: 289–295.
5. Simpson PB, Challiss RA, Nahorski SR. Divalent cation entry incultured rat cerebellar granule cells measured using Mn2þ quenchof fura 2 fluorescence. Eur. J. Neurosci. 1995; 7: 831–840.
6. Natt O, Watanabe T, Boretius S, Radulovic J, Frahm J, MichaelisT. High-resolution 3D MRI of mouse brain reveals small cerebralstructures in vivo. J. Neurosci. Meth. 2002; 120: 203–209.
7. Watanabe T, Michaelis T, Frahm J. Mapping of retinal projectionsin the living rat using high-resolution 3D gradient-echo MRI withMn2þ-induced contrast. Magn. Reson. Med. 2001; 46: 424–429.
8. Watanabe T, Natt O, Boretius S, Frahm J, Michaelis T. In vivo 3DMRI staining of mouse brain after subcutaneous application ofMnCl2. Magn. Reson. Med. 2002; 48: 852–859.
9. Natt O, Watanabe T, Boretius S, Frahm J, Michaelis T. Magne-tization transfer MRI of mouse brain reveals areas of high neuraldensity. Magn. Reson. Imaging 2003; 21: 1113–1120.
10. Watanabe T, Radulovic J, Spiess J, Natt O, Boretius S, Frahm J,Michaelis T. In vivo 3D MRI staining of the mouse hippocampalsystem using intracerebral injection of MnCl2. Neuroimage 2004;22: 860–867.
11. Voogd J. Visual system. In The Central Nervous System ofVertebrates, Nieuwenhuys R, Ten Donkelaar HJ, Nicholson C(eds). Springer: Heidelberg, 1998; 1791–1820.
12. Hayhow WR, Sefton A, Webb C. Primary optic centers of the ratin relation to the terminal distribution of the crossed and uncrossedoptic nerve fibers. J. Comp. Neurol. 1962; 118: 295–321.
13. Toga AW, Collins RC. Metabolic response of optic centers tovisual stimuli in the albino rat: anatomical and physiologicalconsiderations. J. Comp. Neurol. 1981; 199: 443–464.
14. Moore RY, Lenn NJ. A retinohypothalamic projection in the rat.J. Comp. Neurol. 1972; 146: 1–14.
15. Johnson RF, Morin LP, Moore RF. Retinohypothalamic projec-tions in the hamster and rat demonstrated using cholera toxin.Brain Res. 1988; 462: 301–312.
16. Rosene DL, Van Hoesen GW. The hippocampal formation of theprimate brain. In Cerebral Cortex, Vol. 6, Jones EG, Peters A(eds). Plenum Press: New York, 1987; 345–456.
17. Eichenbaum H. A cortical-hippocampal system for declarativememory. Nat. Rev. Neurosci. 2000; 1: 41–50.
18. Chronister RB, White LE. Fiber architecture of the hippocampalformation: anatomy, projections, and structural significance. InHippocampus, Isaacson RL, Pribram KH (eds). Plenum Press:New York, 1975; 9–31.
19. Rosen GD, Williams AG, Capra JA, Connoly MT, Cruz B, Lu L,Airey DC, Kulkarni K, Williams RW. The mouse brain library@ www.mbl.org. Int. Mouse Genome Conf. 2000; 14: 166.
20. Meibach RC, Siegel A. Efferent connections of the hippocampalformation in the rat. Brain Res. 1977; 124: 197–224.
21. Takeda A, Akiyama T, Sawashita J, Okada S. Brain uptake of tracemetals, zinc and manganese, in rats.Brain Res. 1994; 640: 341–344.
22. Takeda A, Ishiwatari S, Okada S. In vivo stimulation-inducedrelease of manganese in rat amygdala. Brain Res. 1998; 811: 147–151.
23. Gallez B, Baudelet C, Geurts M. Regional distribution of manga-nese found in the brain after injection of a single dose ofmanganese-based contrast agents. Magn. Reson. Imag. 1998; 16:1211–1215.
24. Murphy VA, Wadhwani KC, Smith QR, Rapoport SI. Saturabletransport of manganese(II) across the rat blood-brain barrier.J. Neurochem. 1991; 57: 948–954.
25. Rabin O, Hegedus L, Bourre JM, Smith QR. Rapid brain uptake ofmanganese(II) across the blood-brain barrier. J. Neurochem. 1993;61: 509–517.
26. Aschner M. Manganese homeostasis in the CNS. Environ. Res. A1999; 80: 105–109.
27. Bertinchamps AJ, Miller ST, Cotzias GC. Interdependence ofroutes excreting manganese. Am. J. Physiol. 1966; 211: 217–224.
28. Cui ZJ, Dannies PS. Thyrotropin-releasing hormone mediatedMn2þ entry in perfused rat anterior pituitary cells. Biochem.J. 1992; 283: 507–513.
29. Jinno S, Aika Y, Fukuda T, Kosaka K. Quantitative analysis ofGABAergic neurons in mouse hippocampus with optical disectorusing confocal laser scanning microscopy. Brain Res. 1998; 814:55–70.
30. Aoki I, Wu YJ, Silva AC, Koretsky AP. Cortical layers revealed bymanganese enhanced magnetic resonance imaging (MEMRI) inthe rat brain after systemic administration. Proc. Int. Soc. Magn.Reson. Med. 2002; 10: 715.
31. Bruni JE. Ependymal development, proliferation, and functions: areview. Microsc. Res. Tech. 1998; 41: 2–13.
32. Smith QR, Rapoport SI. Cerebrovascular permeability coeffcientsto sodium, potassium, and chloride. J. Neurochem. 1986; 46:1732–1742.
MANGANESE-ENHANCED MRI OF RODENT BRAIN 567
Copyright # 2004 John Wiley & Sons, Ltd. NMR Biomed. 2004;17:554–568

33. Tai C, Smith QR, Rapoport SI. Calcium influxes into brain andcerebrospinal fluid are linearly related to plasma ionized calciumconcentration. Brain Res. 1986; 385: 227–236.
34. Taschenberger H, Juttner R, Grantyn R. Ca2þ-permeable P2Xreceptor channels in cultured rat retinal ganglion cells. J.Neurosci. 1999; 19: 3353–3366.
35. Lisman JE. Relating hippocampal circuitry to function: recall ofmemory sequences by reciprocal dentate–CA3 interactions.Neuron 1999; 22: 233–242.
36. Tonegawa S, Nakazawa K, Wilson MA. Genetic neuroscience ofmammalian learning and memory. Phil. Trans. R. Soc. Lond. B2003; 358: 787–795.
37. Cohen I, Miles R. Contributions of intrinsic and synaptic activitiesto the generation of neuronal discharges in in vitro hippocampus.J. Physiol. (Lond.) 2000; 524: 485–502.
38. Fisher RE, Gray R, Johnston D. Properties and distribution ofsingle voltage-gated calcium channels in adult hippocampalneurons. J. Neurophysiol. 1990; 64: 91–104.
39. Schwartz WJ, Sharp FR. Autoradiographic maps of regional brainglucose consumption in resting, awake rats using [14C]2-deox-yglucose. J. Comp. Neurol. 1978; 177: 335–360.
40. Astic L, Saucier D. Metabolic mapping of functional activity inthe olfactory projections of the rat: ontogenetic study. Dev. BrainRes. 1982; 2: 141–156.
41. Sokoloff L, Reivich M, Kennedy C, Des Rosiers MH, Patlak CS,Pettigrew KD, Sakurada O, Shinohara M. The [14C]deoxyglucosemethod for the measurement of local cerebral glucose utilization:theory procedure, and anesthetized albino rat. J. Neurochem.1977; 28: 897–916.
42. Nelson SR, Howard RB, Cross RS, Samson F. Ketamine-inducedchanges in regional glucose utilization in the rat brain. Anesthe-siology 1980; 52: 330–334.
43. Duncan GE, Miyamoto S, Leipzig JN, Lieberman JA. Comparisonof brain metabolic activity patterns induced by ketamine, MK-801and amphetamine in rats: support for NMDA receptor involve-ment in responses to subanesthetic dose of ketamine. Brain Res.1999; 843: 171–183.
44. Herkenham M. Anesthetics and the habenulo-interpeduncularsystem: selective sparing of metabolic activity. Brain Res. 1981;210: 461–466.
45. McQueen JK, Martin MJ, Harmar AJ. Local changes in cerebral 2-deoxyglucose uptake during alphaxalone anaesthesia with specialreference to the habenulo-interpeduncular system. Brain Res.1984; 300: 19–26.
46. Edwards FA, Robertson SJ, Gibb AJ. Properties of ATP receptor-mediated synaptic transmission in the rat medial habenula.Neuropharmacology 1997; 36: 1253–1268.
47. Khakh BS. Molecular physiology of P2X receptors andATP signalling at synapses. Nat. Rev. Neurosci. 1997; 36: 1253–1268.
48. Takeda A. Manganese action in brain function. Brain Res. Rev.2003; 41: 79–87.
49. Taylor AC, Weiss P. Demonstration of axonal flow by the move-ment of tritium-labeled protein in mature optic nerve fibers. Proc.Natl Acad. Sci. USA 1965; 54: 1521–1527.
50. Goldstein LSB, Yang Z. Microtubule-based transport systems inneurons: the roles of kinesins and dyneins. A. Rev. Neurosci. 2000;23: 39–71.
51. Tjalve H, Mejare C, Borg-Neczak K. Uptake and transport ofmanganese in primary and secondary olfactory neurones in pike.Pharmac. Toxicol. 1995; 77: 23–31.
52. Elluru RG, Bloom GS, Brady ST. Fast axonal transport of kinesinin the rat visual system: functionality of kinesin heavy chainisoforms. Mol. Biol. Cell 1995; 6: 21–40.
53. Tiffany-Castiglioni E, Qian Y. Astroglia as metal depots: mole-cular mechanisms for metal accumulation, storage and release.Neurotoxicology 2001; 22: 577–592.
54. Nordhøy W, Anthonsen HW, Bruvold M, Jynge P, Krane J, BrurokH. Manganese ions as intracellular contrast agents: proton relaxa-tion and calcium interactions in rat myocardium. NMR Biomed.2003; 16: 82–95.
55. Koenig SH, Brown RD. Relaxation of solvent protons by para-magnetic ions and its dependence on magnetic field and chemicalenvironment: implications for NMR imaging. Magn. Reson. Med.1984; 1: 478–495.
56. Wedler FC, Denman RB. Glutamine synthetase: the major Mn (II) en-zyme in mammalian brain. Curr. Top. Cell. Regul. 1984; 24: 153–169.
57. Akai F, Maeda M, Suzuki K, Inagaki S, Takagi H, Taniguchi N.Immunocytochemical localization of manganese superoxide dis-mutase (Mn-SOD) in the hippocampus of the rat. Neurosci. Lett.1990; 115: 19–23.
58. Boretius S, Watanabe T, Natt O, Michaelis T, Finsterbusch J,Frahm J. Diffusion tensor mapping of living mouse brain usinghalf-Fourier single-shot STEAM MRI. Proc. Int. Soc. Magn.Reson. Med. 2002; 10: 1231.
59. Henriksson J, Tallkvist J, Tjalve H. Transport of manganese viathe olfactory pathway in rats: dosage dependency of the uptakeand subcellular distribution of the metal in the olfactory epithe-lium and the brain. Toxicol. Appl. Pharmac. 1999; 156: 119–128.
60. Tindemans I, Verhoye M, Balthazart J, Van der Linden A. In vivodynamic ME-MRI reveals differential functional responses ofRA- and area X-projecting neurons in the HVC of canariesexposed to conspecific song. Eur. J. Neurosci. 2003; 18: 3352–3360.
61. Nieuwenhuys R. Cerebral cortex. In The Central Nervous Systemof Vertebrates, Nieuwenhuys R, Ten Donkelaar HJ, Nicholson C(eds). Springer: Heidelberg, 1998; 1944–1952.
62. Che Y, Yu YM, Han PL, Lee JK. Delayed induction of p38MAPKs in reactive astrocytes in the brain of mice after KA-induced seizure. Mol. Brain Res. 2001; 94: 157–165.
568 T. WATANABE ET AL.
Copyright # 2004 John Wiley & Sons, Ltd. NMR Biomed. 2004;17:554–568