functionality of jerusalem artichoke derived inulin in ...functionality of jerusalem artichoke...
TRANSCRIPT
Functionality of Jerusalem Artichoke Derived Inulin in
Vietnamese Coffee and Developing a Novel Food Grade
Microemulsion System
by
Xuhao Zhao
A thesis submitted to the Faculty of Graduate and Postdoctoral
Affairs in partial fulfillment of the requirements for the degree of
Master of Science
in
Chemistry
Carleton University
Ottawa, Ontario
© 2017, Xuhao Zhao
ii
Abstract
Jerusalem artichoke (JA) is an important source of inulin, a dietary fiber with
many health benefits. To investigate the potential of JA on antioxidant activity of coffee,
JA coffee was made by adding roasted JA tuber to Vietnamese coffee at a ratio 1:1
(w/w). The TPC (total phenolic content) increased by 13.6% in JA-coffee effecting
higher antioxidant activity by 48.0% and 26.9% in ORAC and DPPH assays,
respectively. Additionally, JA improved such coffee characteristics as flavor and foam.
Mass spectrometric analysis showed that the majority of inulin contents were DP 3 and
DP 4. Furthermore, to utilize coffee waste, phenolic compounds were extracted from
spent coffee. A food-grade microemulsion system was composed of grape seed oil, soya
lecithin, ethanol, and water. The feasibility of this novel microemulsion system for the
delivery of phenolic acids was studied by applying it to spent coffee phenolic extracts.
Finally, the uniformity of microemulsions was improved by the LiposoFast which
confirmed by Cryo-SEM.
iii
Acknowledgements
My deepest gratitude is given to my supervisors Dr. Farah Hosseinian and Dr.
Edward Lai for their patiently and professional guidance and encouragement in the past 2
years. I would not successfully complete my project without their support. They always
share new ideas and their professional knowledge and abundant research experience.
I would also like to express my appreciation to all of our lab members. Thanks to
Dr. Rania Agil and Dr. Aynur Gunenc for their great advice and assistance. Thanks to
Melanie and Tatiana who taught me operations of equipment in our lab. Dorsa and
Natasha, I am so pleasant to be friends with you, and I wish you a bright future. Thanks
to Diba, Allison and Paloma for all their assistance and companion. I could not express
more thanks to our lovely group. A special thanks to Shari Levac who is so
knowledgeable and helped me a lot at laboratory instruments. I also appreciate Dr. JJ
Wang and Karl for their support for SEM and MS operations.
Additionally, I would like to appreciate Chantelle Gravelle for warmly encouraging
and helping me all the time. Thanks to Peter Mosher and Jim Logan who helped me a lot
with technical problems. Thanks to Sijing and Alex for all the happy and tough time we
had over two years. It is truly a pleasure for not being alone in science.
Last but not least, I would like to thank my parents for supporting me all the time
even we are far away from each other. Although they do not understand my work, they
always share their wisdom of life which inspires me all the time. I would not be here all
the way to the other side of the planet without the emotional and financial support from
them.
iv
Table of Contents
Abstract.......................................................................................................... ii
Acknowledgements ...................................................................................... iii
List of Tables ............................................................................................... vii
List of Figures ............................................................................................ viii
List of Abbreviations ..................................................................................... x
1 Chapter: Literature Review .................................................................................................... 1
1.1 Botanical fact, chemistry, and application of Jerusalem artichoke ....................... 1
1.2 Inulin and health benefits .......................................................................................... 3
1.3 Vietnamese coffee and health benefits ...................................................................... 5
1.4 Phenolic compounds as antioxidants ........................................................................ 6
1.4.1 Chemical structure of phenolic compounds ........................................................... 6
1.4.2 Phenolic compounds in coffee and biosynthesis ................................................... 8
1.5 Free radicals and antioxidant activity assays......................................................... 10
1.5.1 Oxygen radical absorbance capacity (ORAC) assay ........................................... 10
1.5.2 DPPH radical scavenging assay ........................................................................... 12
1.5.3 Relationship between total phenolic content (TPC) and antioxidant capacity .... 12
1.6 Microemulsions and applications ............................................................................ 13
1.6.1 Microemulsion systems, definition, characteristics and formations .................... 13
1.6.2 Applications of microemulsions .......................................................................... 15
2 Chapter: The potential of inulin in Jerusalem Artichoke to affect the bioactivity of
Vietnamese coffee ......................................................................................................................... 17
2.1 Abstract ..................................................................................................................... 17
v
2.2 Introduction .............................................................................................................. 17
2.3 Materials and methods ............................................................................................. 18
2.3.1 Sample preparation .............................................................................................. 18
2.3.2 Materials and instruments .................................................................................... 19
2.3.3 Extraction of phenolic compounds ...................................................................... 20
2.3.4 Characterization and determination of phenolic compounds ............................... 20
2.3.5 Oxygen radical antioxidant capacity (ORAC) assay ........................................... 22
2.3.6 DPPH (2-diphenyl-1-picryhydrazyl) radical scavenging assay ........................... 22
2.3.7 Total Phenolic Content ........................................................................................ 23
2.3.8 Inulin extraction ................................................................................................... 24
2.3.9 Mass Spectrometry (MS) sugar component analysis ........................................... 24
2.3.10 Statistical analysis ................................................................................................ 24
2.4 Results........................................................................................................................ 25
2.4.1 Determination and characterization of phenolic compounds in coffee and JA
samples ................................................................................................................ 25
2.4.2 Antioxidant activity analysis ............................................................................... 26
2.4.3 MS analysis .......................................................................................................... 30
2.5 Discussion .................................................................................................................. 33
2.6 Conclusions ............................................................................................................... 36
2.7 Connecting statement to Chapter 3 ........................................................................ 37
3 Chapter: Development of a novel food grade microemulsion system ............................... 38
3.1 Abstract ..................................................................................................................... 38
3.2 Introduction .............................................................................................................. 38
3.3 Materials and methods ............................................................................................. 40
3.3.1 Materials and instruments .................................................................................... 40
3.3.2 Optimization of surfactant: co-surfactant ratios .................................................. 40
vi
3.3.3 Formation of microemulsions and the pseudoternary phase diagram .................. 41
3.3.4 Preparation of spent coffee ground and phenolic compounds extraction ............ 42
3.3.5 Determination of phenolic compounds in extracts from spent coffee ground ..... 42
3.3.6 Application of the microemulsion system on phenolic compounds extracts ....... 43
3.3.7 Mini-extruder extrusion technique by the LiposoFast device .............................. 43
3.3.8 Cryo-SEM (cryogenic scanning electron microscope) ........................................ 44
3.4 Results........................................................................................................................ 44
3.4.1 Formations of microemulsions ............................................................................ 44
3.4.2 Determination of phenolic compounds in extracts from spent coffee ground ..... 46
3.4.3 Application of the microemulsion system on phenolic compounds extracts from
spent coffee ground .............................................................................................. 46
3.4.4 Mini-extruder extrusion technique and Cryo-SEM ............................................. 47
3.5 Discussion .................................................................................................................. 49
3.6 Conclusions ............................................................................................................... 51
4 Chapter: General conclusions and future directions .......................................................... 52
References .....................................................................................................54
vii
List of Tables
Table 1-1 Comparisons of physicochemical characteristics of chicory and artichoke inulin
..............................................................................................................................................2
Table 1-2 Nutrients of Jerusalem artichoke .........................................................................4
Table 1-3 Classes of phenolic compounds in plants ............................................................7
Table 1-4 Comparison between microemulsions and emulsions .......................................14
Table 2-1 Phenolic acid and flavonoid standards and retention times ...............................21
Table 2-2 Phenolic composition in samples, mg/g ............................................................26
Table 2-3 Summary of results from multiple antioxidant activity assays .........................27
Table 3-1 Ratios of L/E to grape seed oil in Group A .......................................................42
Table 3-2 Ratios of L/E to grape seed oil in Group B ......................................................44
Table 3-3 Compositions of microemulsions in Group A ...................................................46
viii
List of Figures
Figure 1-1 JA plant (A) and JA tuber (B) ...........................................................................2
Figure 1-2 Chemical structure of inulin, n=2~60 ................................................................4
Figure 1-3 Chemical tructure of phenolic acids ...................................................................6
Figure 1-4 Chemical structure of flavonoids ......................................................................7
Figure 1-5 Chemical structure of CGA ...............................................................................8
Figure 1-6 Biosynthesis pathway of hydroxycinnamic acids and quinic acid. ....................9
Figure 1-7 Fluorescence decay curve ................................................................................11
Figure 1-8 Reactions of DPPH radical and an antioxidant (AH) or radical species (R●) .12
Figure 1-9 Hypothetical phase regions of microemulsion systems ...................................15
Figure 2-1 Roasted JA tuber sample ..................................................................................18
Figure 2-2 Total phenolic compounds content in samples determined in HPLC analysis,
mg/g of sample ..................................................................................................25
Figure 2-3 Antioxidant activity of phenolic extracts from PC, INC, JAC, RST and FD ..28
Figure 2-4 The linear correlation of results of (A) ORAC vs. TPC, (B) DPPH vs.
TPC……………………………………………………………………………
…………29
Figure 2-5 MS spectra of JA coffee inulin extracts. ..........................................................30
Figure 2-6 MS spectrum of single sugar standards, negative mode, singly charged. Peak
a) D-glucose, D-fructose, peak b) sucrose. ......................................................31
Figure 2-7 MS spectra of plain coffee inulin extracts .......................................................32
ix
Figure 2-8 Antioxidant activity of 1g coffee, 1g coffee with 0.11g and 1g coffee with 1g
JA. .....................................................................................................................36
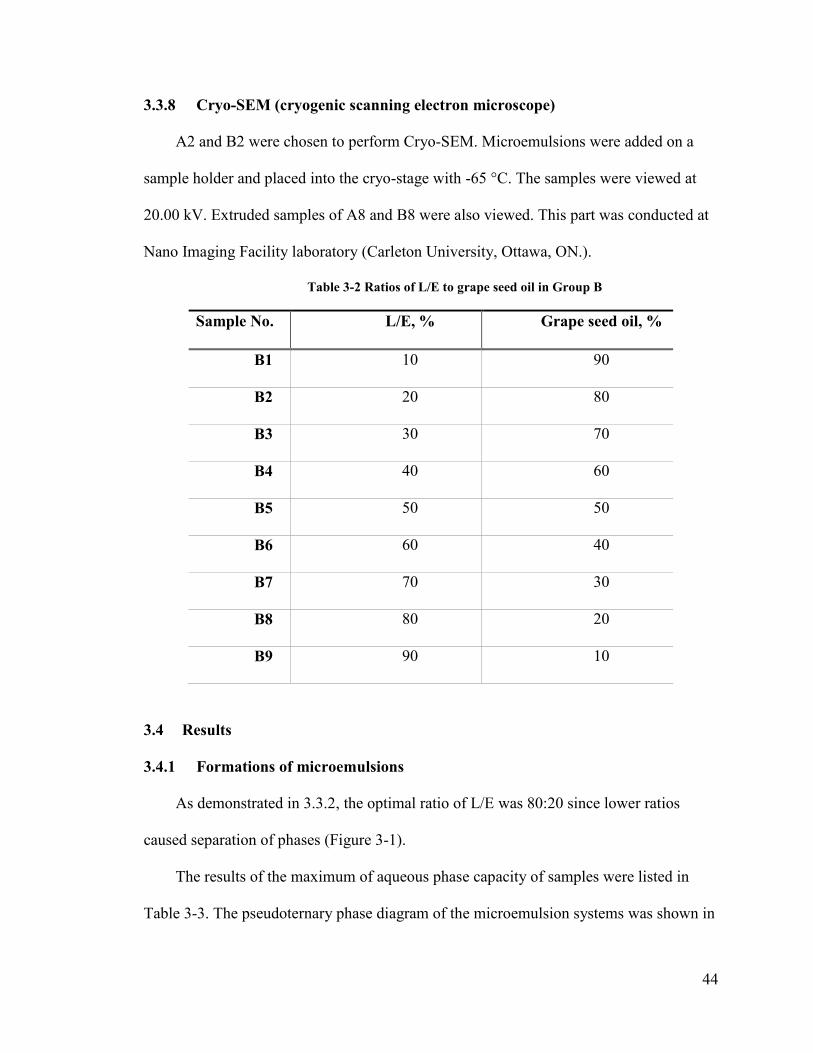
Figure 3-1 Comparison of L/E 75:25 (left) and L/E 80:20 (right) .....................................45
Figure 3-2 Pseudoternary phase diagram of lecithin: ethanol (80:20)/grape seed oil/water
microemulsions .................................................................................................45
Figure 3-3 Pseudoternary phase diagram of lecithin: ethanol (80:20)/grape seed oil/water
with phenolic extracts microemulsions .............................................................47
Figure 3-4 Structures of microemulsions under Cryo-SEM. ............................................48
x
List of Abbreviations
AAPH 2, 2’-azobis(2-methylpropionamidine) dihydrochloride
CGA Chlorogenic acid
DP Degree of polymerization
DPPH 2,2-diphenyl-1-picryhydrazyl
FD Freeze-dried fresh Jerusalem artichoke tuber
GAE Gallic acid equivalent
GSO Grape seed oil
HLB Hydrophile-lipophile balance
HPLC High performance liquid chromatography
IN Inulin
INC Inulin coffee
JA Jerusalem artichoke
JAC Jerusalem artichoke coffee
L/E Lecithin/ethanol ratio
MW Molecular weight
O/W Oil in water
ORAC Oxygen radical absorbance capacity
PC Plain coffee
RNS Reactive nitrogen species
ROS Reactive oxygen species
RST Roasted Jerusalem artichoke tuber
SEM Scanning electron microscopy
xi
TE Trolox equivalent
TOF-MS Time-of-flight mass spectrometer
TPC Total phenolic content
Trolox 6-hydroxy-2,5,7,8-tetramethylchroman-2-carboxylic acid
W/O Water in oil
1
1 Chapter: Literature Review
1.1 Botanical fact, chemistry, and application of Jerusalem artichoke
Jerusalem artichoke (JA) (Helianthus tuberosus L.) is native to North America, and
it is also known as topinambour and a species of sunflower1. It is found from eastern
Canada to North Dakota, and south to Florida and Texas. JA is cultivated widely since it
can be tolerant of arid saline soils, plant diseases, and pests. JA is considered as a healthy
vegetable since it is rich in fibers and minerals and contains minor amount of fat (0.01 g
total lipid/100 g) as shown in Table 1-1. JA has the potential to be an alternative
economic plant with a worldwide yield of 17,843 kg/ha which is higher than that of corn
(4,472 kg/ha) and potato (16,448 kg/ha) 2, but the disadvantage of JA is that it contains
less energy than that of traditional economic crops, for example, the energy per kg of
corn is 3490 kcal, potato (1000 kcal), and JA (760 kcal) 2. What is more, JA has the
capacity to remove Cd, Pd, Ni and Cu from heavy metal-contaminated soils which could
be applied in environment protection 3.
JA tuber is an important source of inulin, containing 15% to 20 % (wet weight) 4
and 63% to 75.5% (dry weight) 5. Besides, JA tubers have many other health benefits.
According to the United States Department of Agriculture (USDA) (Table 1-1), the
content of potassium in JA tubers is 429 mg/100 g which is significantly higher than that
of bananas (358 mg/100 g)6. As JA tubers contain low amounts of polyamines, they
added to diets of patients under chemotherapy and patients with diabetes 7.
JA tubers have potentials with ethanol production and reduction of flour
consumption 8. It is demonstrated that with the combination of Aspergillus niger SL-09
and Saccharomyces cerevisiae Z-06 in the fermentation of JA tubers, 98% of inulin in JA
2
tubers were utilized, and the efficiency of ethanol production was 90% of theoretical
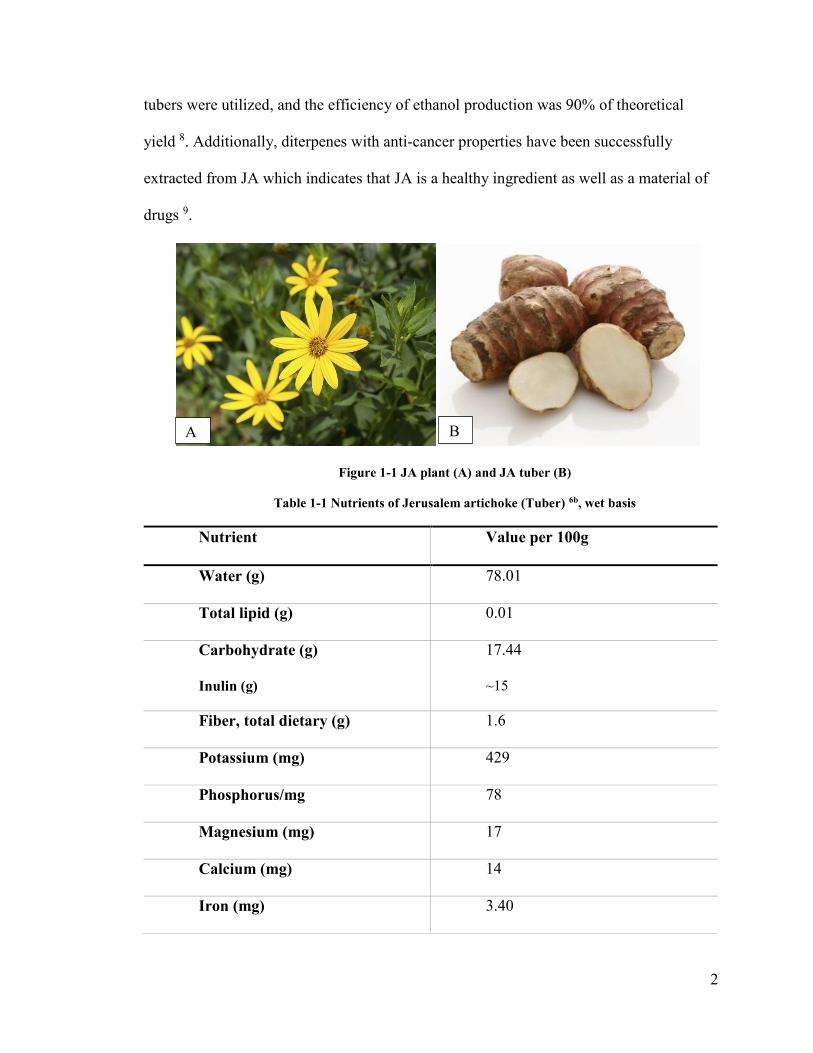
yield 8. Additionally, diterpenes with anti-cancer properties have been successfully
extracted from JA which indicates that JA is a healthy ingredient as well as a material of
drugs 9.
Figure 1-1 JA plant (A) and JA tuber (B)
Table 1-1 Nutrients of Jerusalem artichoke (Tuber) 6b, wet basis
Nutrient Value per 100g
Water (g) 78.01
Total lipid (g) 0.01
Carbohydrate (g)
Inulin (g)
17.44
~15
Fiber, total dietary (g) 1.6
Potassium (mg) 429
Phosphorus/mg 78
Magnesium (mg) 17
Calcium (mg) 14
Iron (mg) 3.40
A B
3
1.2 Inulin and health benefits
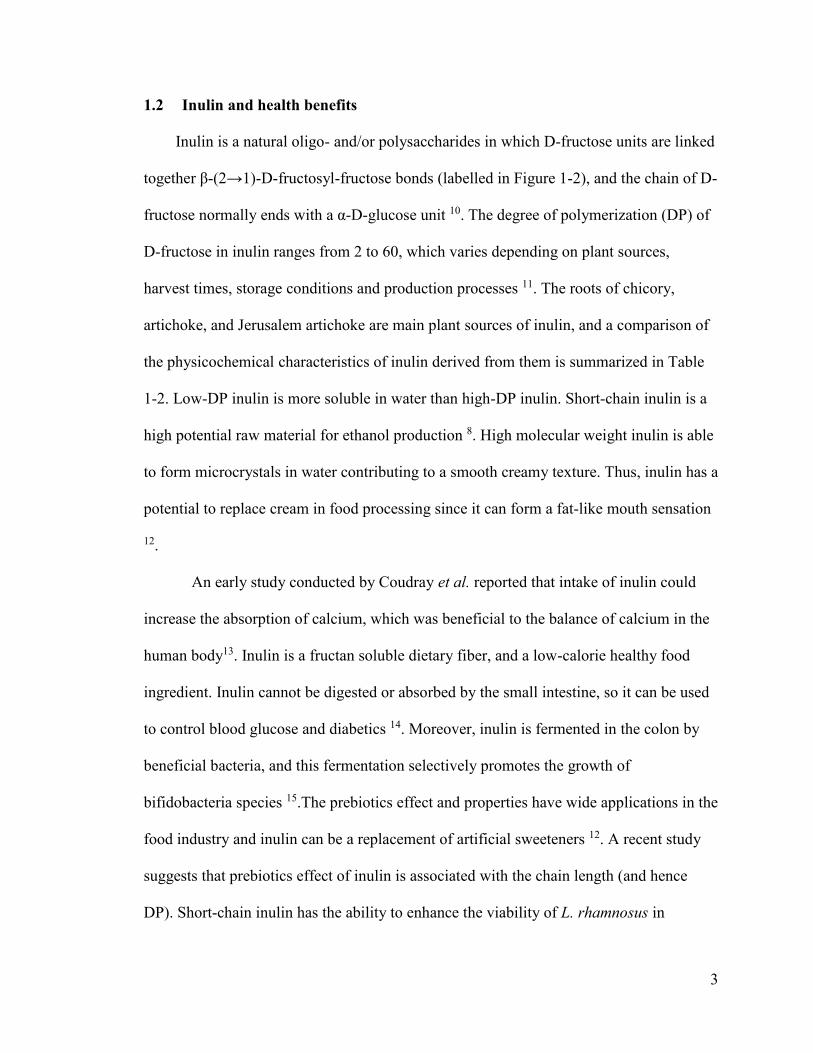
Inulin is a natural oligo- and/or polysaccharides in which D-fructose units are linked
together β-(2→1)-D-fructosyl-fructose bonds (labelled in Figure 1-2), and the chain of D-
fructose normally ends with a α-D-glucose unit 10. The degree of polymerization (DP) of
D-fructose in inulin ranges from 2 to 60, which varies depending on plant sources,
harvest times, storage conditions and production processes 11. The roots of chicory,
artichoke, and Jerusalem artichoke are main plant sources of inulin, and a comparison of
the physicochemical characteristics of inulin derived from them is summarized in Table
1-2. Low-DP inulin is more soluble in water than high-DP inulin. Short-chain inulin is a
high potential raw material for ethanol production 8. High molecular weight inulin is able
to form microcrystals in water contributing to a smooth creamy texture. Thus, inulin has a
potential to replace cream in food processing since it can form a fat-like mouth sensation
12.
An early study conducted by Coudray et al. reported that intake of inulin could
increase the absorption of calcium, which was beneficial to the balance of calcium in the
human body13. Inulin is a fructan soluble dietary fiber, and a low-calorie healthy food
ingredient. Inulin cannot be digested or absorbed by the small intestine, so it can be used
to control blood glucose and diabetics 14. Moreover, inulin is fermented in the colon by
beneficial bacteria, and this fermentation selectively promotes the growth of
bifidobacteria species 15.The prebiotics effect and properties have wide applications in the
food industry and inulin can be a replacement of artificial sweeteners 12. A recent study
suggests that prebiotics effect of inulin is associated with the chain length (and hence
DP). Short-chain inulin has the ability to enhance the viability of L. rhamnosus in
4
prebiotics yogurt, and it has better performance in the taste and odor than long-chain
inulin 16.
Figure 1-2 Chemical structure of inulin, by ChemBioDraw Office.
Table 1-2 Comparisons of physicochemical characteristics of chicory, artichoke and
Jerisalem artichoke inulin 12
Characteristics Standard Chicory
Inulin
Artichoke Inulin Jerusalem
Artichoke
Inulin
Average degree of
polymerization
12 46 <40
Inulin/oligofructose
content (% fresh.)
16.2 (mean) 2~7 15~20
pH 5~7 5~7 5~7
Sulphated ash (% on
dry matter basis)
<0.02 <0.02 NA
Heavy metals <0.02 <0.02 NA
Appearance White powder White powder White powder
Taste Neutral Neutral Neutral
5
1.3 Vietnamese coffee and health benefits
Coffee is a brewed drink prepared from roasted coffee beans, which are the seeds of
berries from the Coffea plant. It is one of the most popular beverages all over the world
with an annual production of 6.7 million tons in the years 1998 to 2000 17. Based on
statistical data from FAOSTAT (Food and Agriculture Organization of the United
Nations, Statistics Division), Vietnam is the second major coffee manufacturing country
with an average annual production of 0.8 million tons which is only after Brazil (2.1
million tons)18. It is noted that the gap between Vietnam and Brazil in coffee production
is narrowing 18.
Coffee has numerous health benefits as a widely consumed pharmacologically active
beverage. It is reported that coffee drinking reduces the risk of cardiovascular diseases
with the caffeine (80-175 mg) contained in a cup of coffee, enhancing the microvascular
functions in healthy individuals 19. Epidemiological studies have demonstrated that coffee
consumption has an association with the reduction of risk in bladder, breast, buccal,
pharyngeal and colorectal cancers 20. Coffee brew contains 0.47 to 0.75 g/100 mL soluble
dietary fiber, which is a significantly higher level than other common beverages, and the
predominant components are galactomannans and arabinogalactans. It is suggested that
coffee consumption may contribute to the prevention of chronic diseases such as type 2
diabetes mellitus, arteriosclerosis, and neurodegenerative diseases 21. Additionally, a
moderate coffee intake has a protective effect against nonalcoholic fatty liver disease due
to the antioxidant effect of coffee 22.
Coffee as a main source of antioxidants in diets contains a large amount of phenolic
compounds which contribute to the majority of antioxidant activity 23.
6
1.4 Phenolic compounds as antioxidants
Phenolic compounds are ubiquitously generated as secondary metabolites in plants
during adaptation to environmental stress conditions 23. Phenolic compounds not only
provide protection against pathogens and predators in plant growth, but also contribute to
the appearance (mostly color) and the sensory characteristics 24.
1.4.1 Chemical structure of phenolic compounds
The chemical structure of phenolic compounds in plants is typically composed of an
aromatic ring and hydroxyl or methoxyl substituents, as classified in Table 1-3 25.
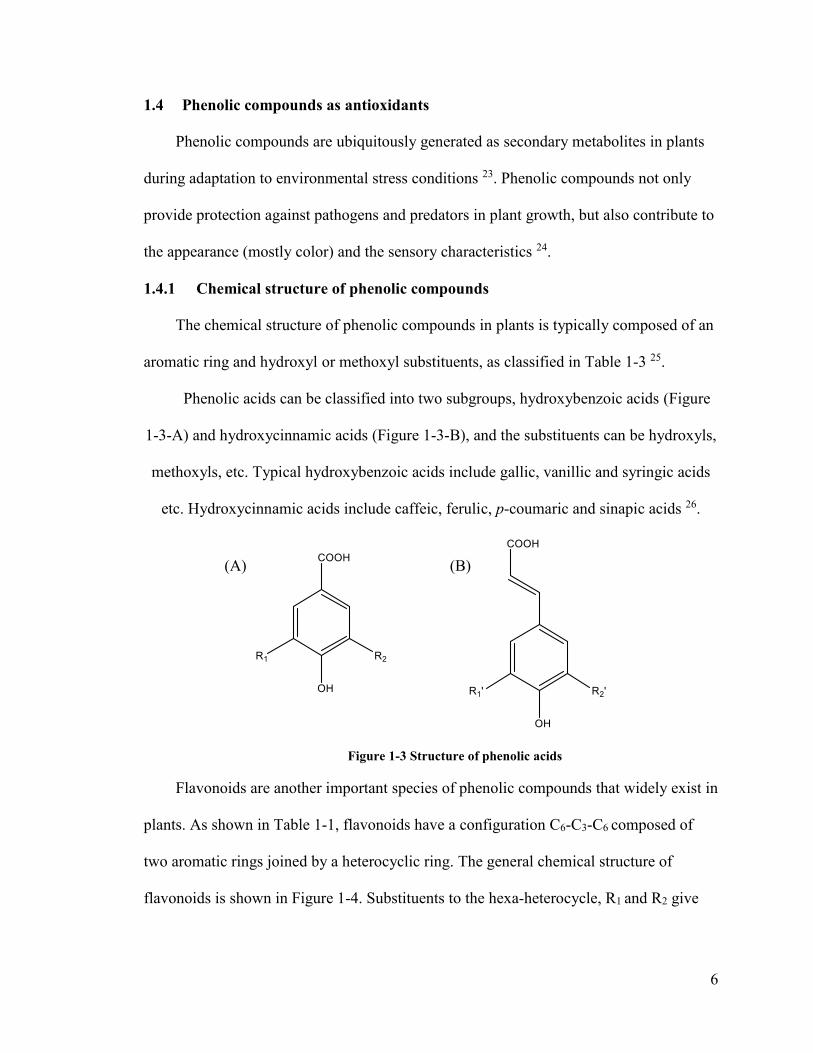
Phenolic acids can be classified into two subgroups, hydroxybenzoic acids (Figure
1-3-A) and hydroxycinnamic acids (Figure 1-3-B), and the substituents can be hydroxyls,
methoxyls, etc. Typical hydroxybenzoic acids include gallic, vanillic and syringic acids
etc. Hydroxycinnamic acids include caffeic, ferulic, p-coumaric and sinapic acids 26.
Figure 1-3 Structure of phenolic acids
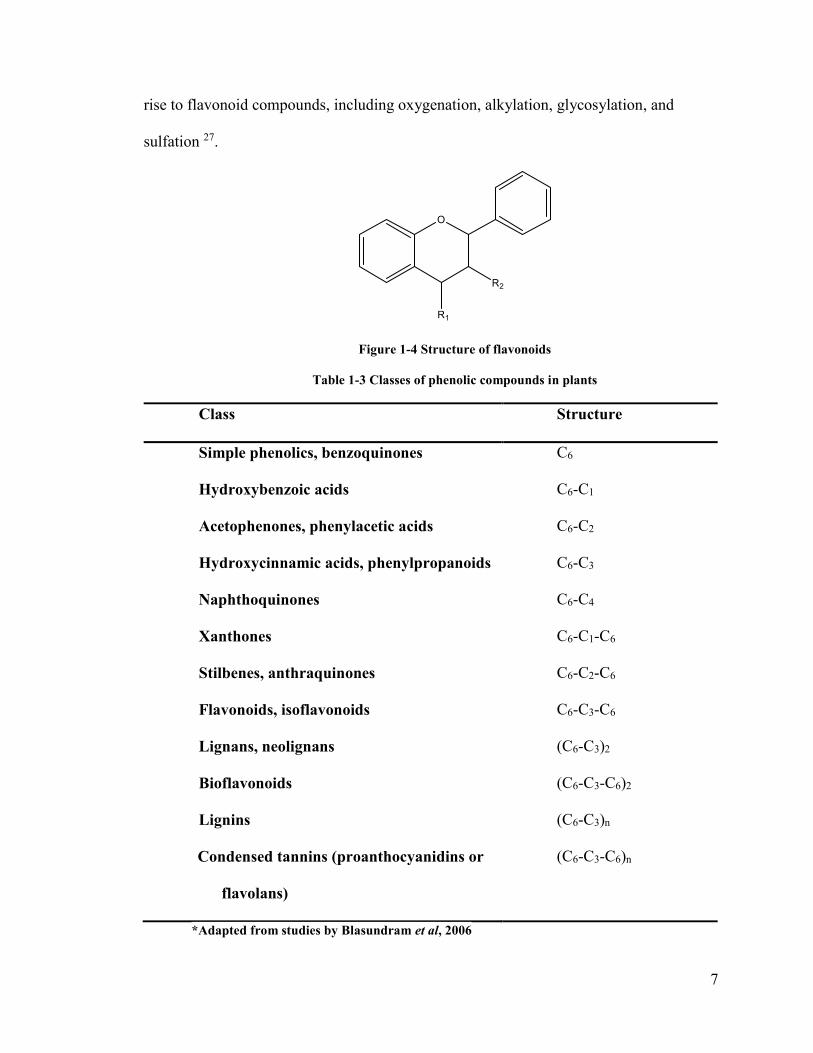
Flavonoids are another important species of phenolic compounds that widely exist in
plants. As shown in Table 1-1, flavonoids have a configuration C6-C3-C6 composed of
two aromatic rings joined by a heterocyclic ring. The general chemical structure of
flavonoids is shown in Figure 1-4. Substituents to the hexa-heterocycle, R1 and R2 give
(A) (B)
7
rise to flavonoid compounds, including oxygenation, alkylation, glycosylation, and
sulfation 27.
Figure 1-4 Structure of flavonoids
Table 1-3 Classes of phenolic compounds in plants
Class Structure
Simple phenolics, benzoquinones C6
Hydroxybenzoic acids C6-C1
Acetophenones, phenylacetic acids C6-C2
Hydroxycinnamic acids, phenylpropanoids C6-C3
Naphthoquinones C6-C4
Xanthones C6-C1-C6
Stilbenes, anthraquinones C6-C2-C6
Flavonoids, isoflavonoids C6-C3-C6
Lignans, neolignans (C6-C3)2
Bioflavonoids (C6-C3-C6)2
Lignins (C6-C3)n
Condensed tannins (proanthocyanidins or
flavolans)
(C6-C3-C6)n
*Adapted from studies by Blasundram et al, 2006
8
1.4.2 Phenolic compounds in coffee and biosynthesis
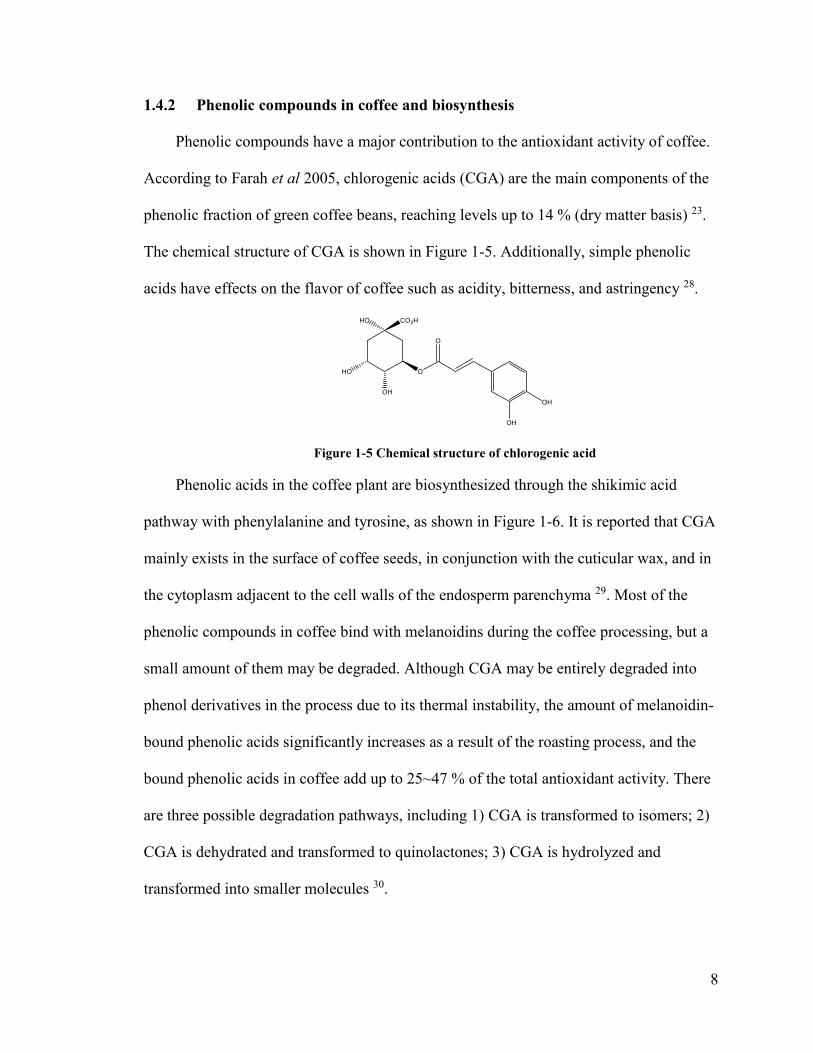
Phenolic compounds have a major contribution to the antioxidant activity of coffee.
According to Farah et al 2005, chlorogenic acids (CGA) are the main components of the
phenolic fraction of green coffee beans, reaching levels up to 14 % (dry matter basis) 23.
The chemical structure of CGA is shown in Figure 1-5. Additionally, simple phenolic
acids have effects on the flavor of coffee such as acidity, bitterness, and astringency 28.
Figure 1-5 Chemical structure of chlorogenic acid
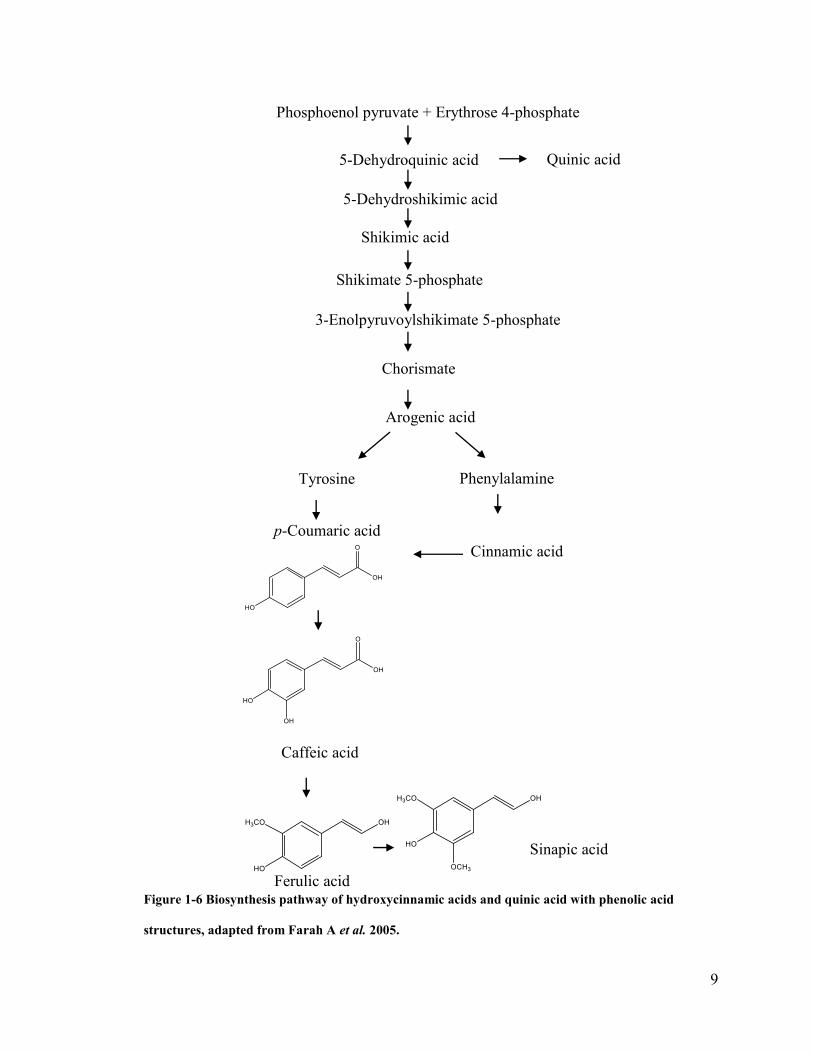
Phenolic acids in the coffee plant are biosynthesized through the shikimic acid
pathway with phenylalanine and tyrosine, as shown in Figure 1-6. It is reported that CGA
mainly exists in the surface of coffee seeds, in conjunction with the cuticular wax, and in
the cytoplasm adjacent to the cell walls of the endosperm parenchyma 29. Most of the
phenolic compounds in coffee bind with melanoidins during the coffee processing, but a
small amount of them may be degraded. Although CGA may be entirely degraded into
phenol derivatives in the process due to its thermal instability, the amount of melanoidin-
bound phenolic acids significantly increases as a result of the roasting process, and the
bound phenolic acids in coffee add up to 25~47 % of the total antioxidant activity. There
are three possible degradation pathways, including 1) CGA is transformed to isomers; 2)
CGA is dehydrated and transformed to quinolactones; 3) CGA is hydrolyzed and
transformed into smaller molecules 30.
9
Figure 1-6 Biosynthesis pathway of hydroxycinnamic acids and quinic acid with phenolic acid
structures, adapted from Farah A et al. 2005.
5-Dehydroquinic acid Quinic acid
5-Dehydroshikimic acid
Shikimic acid
Shikimate 5-phosphate
3-Enolpyruvoylshikimate 5-phosphate
Chorismate
Arogenic acid
Phenylalamine Tyrosine
p-Coumaric acid
Cinnamic acid
Phosphoenol pyruvate + Erythrose 4-phosphate
Caffeic acid
Ferulic acid
Sinapic acid
10
1.5 Free radicals and antioxidant activity assays
Reactive oxygen species (ROS) are free radicals that contain unpaired electrons
which make them extremely unstable, even though they are byproducts of normal aerobic
metabolism 31. ROS include superoxide anion, perhydroxyl radical, hydrogen peroxide
and hydroxyl radical. Another type of free radical is reactive nitrogen species (RNS)
derived from nitrogen, such as nitric oxide, nitrogen dioxide, and peroxynitrite radicals 32.
The imbalance between ROS effects and the detoxification capacity of a biological
system is the predominant factor of oxidative stress 33. Oxidative stress is involved in
many human diseases such as Asperger syndrome, Alzheimer’s disease, aging, and age-
related diseases. Moreover, it is confirmed that oxidative stress plays a crucial role in the
pathology of cancer, neurodegenerative diseases, and inflammatory diseases 34. Thus,
ROS, oxidative stress and antioxidants are of great interest to many chemists and
biochemists. Numerous assays have been developed for the measurement of antioxidant
activity.
1.5.1 Oxygen radical absorbance capacity (ORAC) assay
The oxygen radical absorbance capacity (ORAC) of phenolic extracts was first
reported by Cao et al. 1993 35. The ORAC assay is a widely used assay to determine the
in vitro antioxidant activity of many compounds in the field of scientific research and
nutraceutical industries. Huang et al. modified the ORAC assay by the development of a
high-throughput instrument composed of a robotic eight-channel liquid handling system
and a microplate fluorescence reader. This modification significantly increases the
efficiency of ORAC assay 36.
11
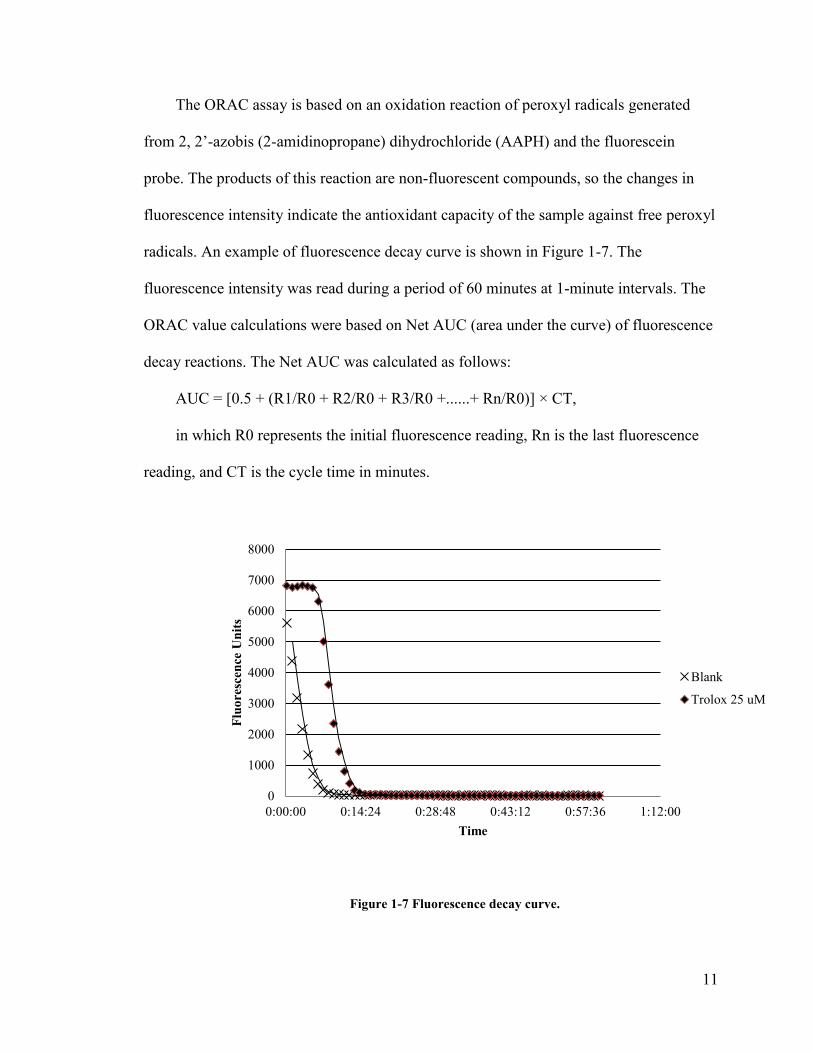
The ORAC assay is based on an oxidation reaction of peroxyl radicals generated
from 2, 2’-azobis (2-amidinopropane) dihydrochloride (AAPH) and the fluorescein
probe. The products of this reaction are non-fluorescent compounds, so the changes in
fluorescence intensity indicate the antioxidant capacity of the sample against free peroxyl
radicals. An example of fluorescence decay curve is shown in Figure 1-7. The
fluorescence intensity was read during a period of 60 minutes at 1-minute intervals. The
ORAC value calculations were based on Net AUC (area under the curve) of fluorescence
decay reactions. The Net AUC was calculated as follows:
AUC = [0.5 + (R1/R0 + R2/R0 + R3/R0 +......+ Rn/R0)] × CT,
in which R0 represents the initial fluorescence reading, Rn is the last fluorescence
reading, and CT is the cycle time in minutes.
Figure 1-7 Fluorescence decay curve.
0
1000
2000
3000
4000
5000
6000
7000
8000
0:00:00 0:14:24 0:28:48 0:43:12 0:57:36 1:12:00
Flu
ore
scen
ce U
nit
s
Time
Blank
Trolox 25 uM
12
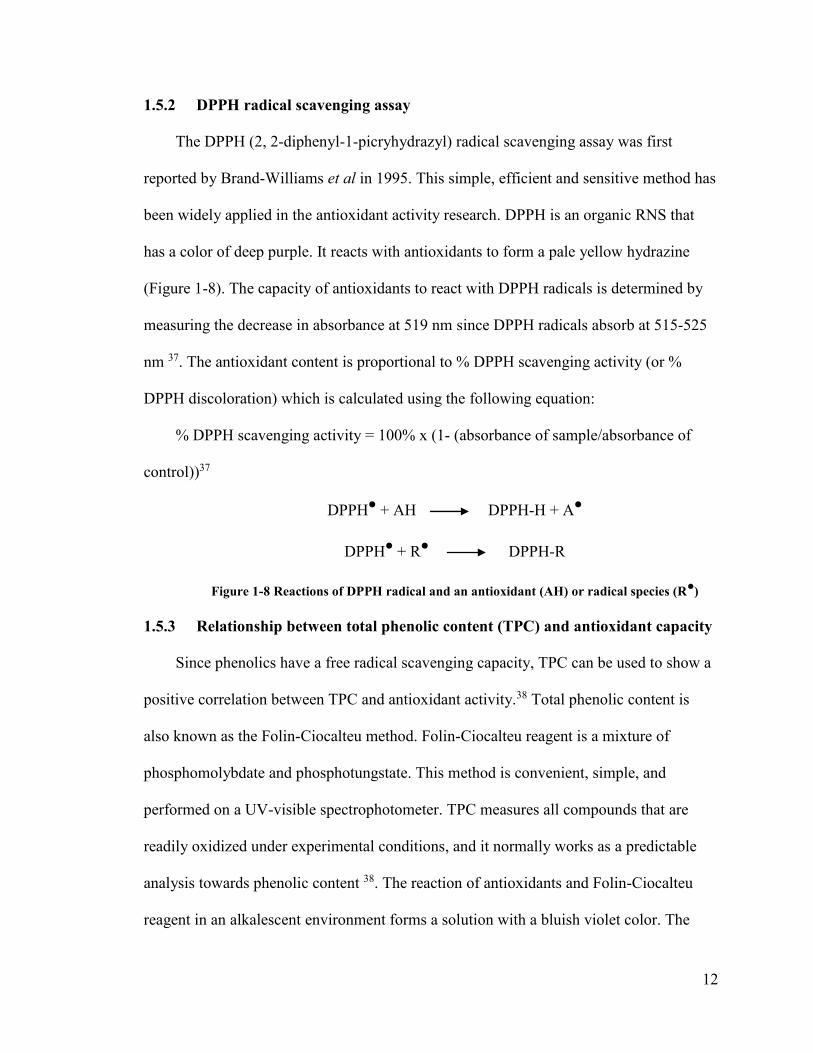
1.5.2 DPPH radical scavenging assay
The DPPH (2, 2-diphenyl-1-picryhydrazyl) radical scavenging assay was first
reported by Brand-Williams et al in 1995. This simple, efficient and sensitive method has
been widely applied in the antioxidant activity research. DPPH is an organic RNS that
has a color of deep purple. It reacts with antioxidants to form a pale yellow hydrazine
(Figure 1-8). The capacity of antioxidants to react with DPPH radicals is determined by
measuring the decrease in absorbance at 519 nm since DPPH radicals absorb at 515-525
nm 37. The antioxidant content is proportional to % DPPH scavenging activity (or %
DPPH discoloration) which is calculated using the following equation:
% DPPH scavenging activity = 100% x (1- (absorbance of sample/absorbance of
control))37
DPPH● + AH DPPH-H + A
●
DPPH● + R
● DPPH-R
Figure 1-8 Reactions of DPPH radical and an antioxidant (AH) or radical species (R●
)
1.5.3 Relationship between total phenolic content (TPC) and antioxidant capacity
Since phenolics have a free radical scavenging capacity, TPC can be used to show a
positive correlation between TPC and antioxidant activity.38 Total phenolic content is
also known as the Folin-Ciocalteu method. Folin-Ciocalteu reagent is a mixture of
phosphomolybdate and phosphotungstate. This method is convenient, simple, and
performed on a UV-visible spectrophotometer. TPC measures all compounds that are
readily oxidized under experimental conditions, and it normally works as a predictable
analysis towards phenolic content 38. The reaction of antioxidants and Folin-Ciocalteu
reagent in an alkalescent environment forms a solution with a bluish violet color. The
13
total phenolic content is positively correlated to the darkness of the solution measured as
the absorbance at 725 nm.
1.6 Microemulsions and applications
1.6.1 Microemulsion systems, definition, characteristics and formations
The concept of microemulsions was first introduced by Hoar and Schulman in 1943.
Oil-alkali-metal soap-water systems were studied, and transparent oil-continuous systems
were successfully generated with high soap/water ratios 39. With the advance in studies of
microemulsions, a widely accepted definition of a microemulsion was put forward by
Danielsson and Lindman in 198140 “a microemulsion is a system of water, oil and an
amphiphile which is a single optically isotropic and thermodynamically stable liquid
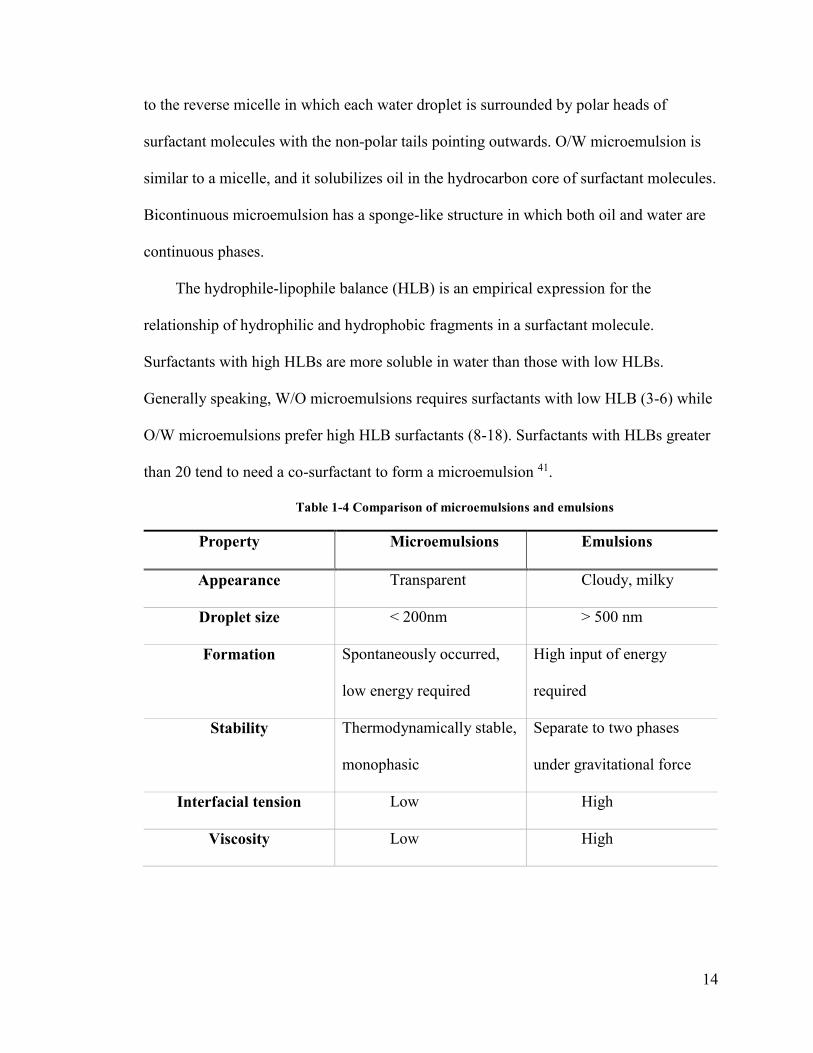
solution”. Compared with normal emulsions, microemulsions have many advantages in
physicochemical properties, such as thermodynamic stability, transparent appearance,
low viscosity, and small droplet size. The differences between normal emulsions and
microemulsions are summarized in Table 1-4.
The formation of a microemulsion can be explained by the following equation,
∆G𝑓 = γ∆A − T∆S, where ∆G𝑓 is the free energy of the formation, γ is the surface
tension of the interface between two phases, ∆A is the change of interfacial area, ∆S is
the change of entropy of the system, and T is the temperature. The presence of surfactants
(amphiphiles) lowers the surface tension between two phases, and the γ∆A term would be
relatively small when the reduction of surface tension is large enough. When a negative
free energy of the formation is achieved, spontaneous microemulsification will occur 41.
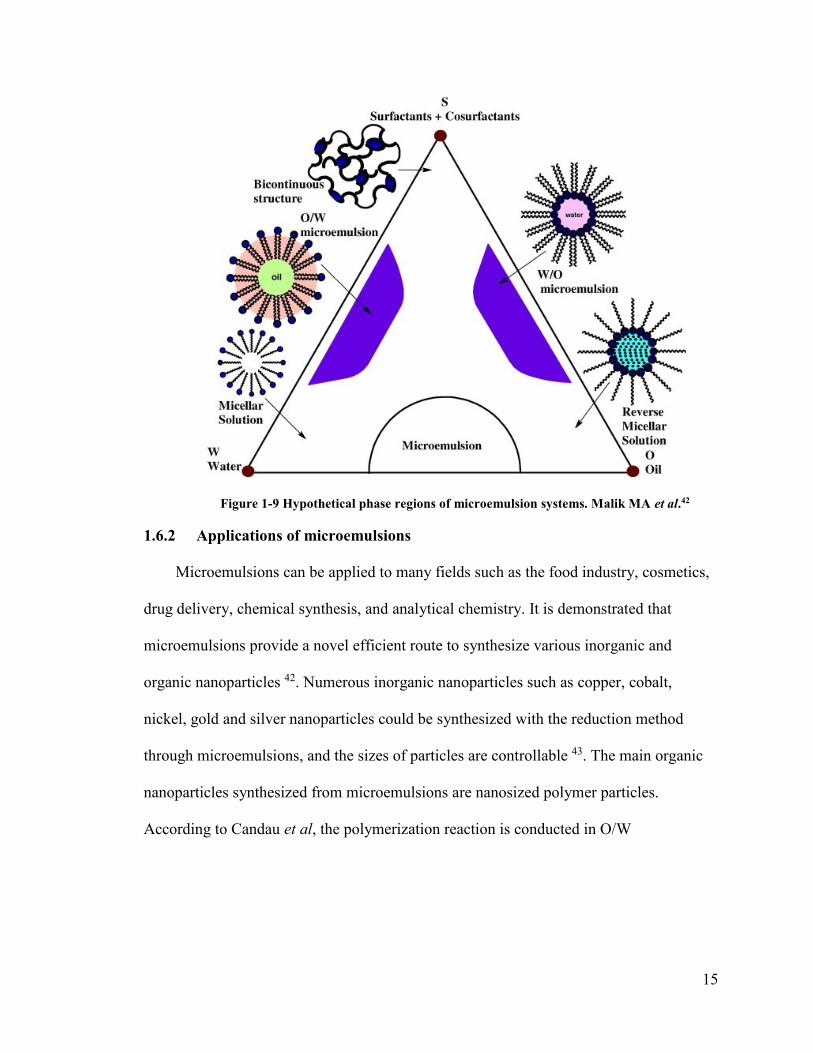
There are three different types of microemulsions: water-in-oil (W/O), oil-in-water
(O/W), and bicontinuous (Figure 1-9)42. The structure of W/O microemulsion is similar
14
to the reverse micelle in which each water droplet is surrounded by polar heads of
surfactant molecules with the non-polar tails pointing outwards. O/W microemulsion is
similar to a micelle, and it solubilizes oil in the hydrocarbon core of surfactant molecules.
Bicontinuous microemulsion has a sponge-like structure in which both oil and water are
continuous phases.
The hydrophile-lipophile balance (HLB) is an empirical expression for the
relationship of hydrophilic and hydrophobic fragments in a surfactant molecule.
Surfactants with high HLBs are more soluble in water than those with low HLBs.
Generally speaking, W/O microemulsions requires surfactants with low HLB (3-6) while
O/W microemulsions prefer high HLB surfactants (8-18). Surfactants with HLBs greater
than 20 tend to need a co-surfactant to form a microemulsion 41.
Table 1-4 Comparison of microemulsions and emulsions
Property Microemulsions Emulsions
Appearance Transparent Cloudy, milky
Droplet size < 200nm > 500 nm
Formation Spontaneously occurred,
low energy required
High input of energy
required
Stability Thermodynamically stable,
monophasic
Separate to two phases
under gravitational force
Interfacial tension Low High
Viscosity Low High
15
Figure 1-9 Hypothetical phase regions of microemulsion systems. Malik MA et al.42
1.6.2 Applications of microemulsions
Microemulsions can be applied to many fields such as the food industry, cosmetics,
drug delivery, chemical synthesis, and analytical chemistry. It is demonstrated that
microemulsions provide a novel efficient route to synthesize various inorganic and
organic nanoparticles 42. Numerous inorganic nanoparticles such as copper, cobalt,
nickel, gold and silver nanoparticles could be synthesized with the reduction method
through microemulsions, and the sizes of particles are controllable 43. The main organic
nanoparticles synthesized from microemulsions are nanosized polymer particles.
According to Candau et al, the polymerization reaction is conducted in O/W
16
microemulsions, and the resultant hydrophobic nanoparticles are dispersed in the water
phase 42.
Microemulsions can be used as a solubilization capacity enhancer for drugs with
poor solubility. In this area, not only the enhancement of solubilization but also the
different physicochemical characteristics of drugs in microemulsions and free systems
should be investigated 44. Microemulsions contain both oil and water in a single phase.
They have the ability to dissolve materials with different polarities at the same time. Thus
they are playing important roles in drug delivery. The applications of microemulsions in
drug delivery depend on the type of microemulsions. Lipophilic drugs can be dispersed in
the oil phase or hydrophobic surfactant tails of an O/W microemulsion system, while
hydrophilic materials tend to disperse in the water phase of a W/O microemulsion system
41 45. As the polar heads of surfactants coat the surface of an O/W microemulsion
droplets, they tend to be retained upon dilution in biological aqueous phases in oral or
parenteral drug delivery 41. In contrast, W/O microemulsions are good for the delivery of
labile hydrophilic drugs such as peptides and oligonucleotides that can be degraded by
enzymes 46. W/O microemulsions can provide protection for those drugs from the
proteolysis in the gastrointestinal system 47.
17
2 Chapter: The potential of inulin in Jerusalem Artichoke to affect the
bioactivity of Vietnamese coffee
2.1 Abstract
A novel coffee composed of Vietnamese coffee and roasted JA was created in this
study. Phenolic compounds were extracted from coffee samples and determined by
HPLC, and the HPLC results showed that chlorogenic acid was the predominant
composition in coffee. The contribution of JA derived inulin on antioxidant activity of
coffee was investigated through multiple assays, and the TPC increased by 13.6% in JA-
coffee affecting higher antioxidant activity by 48.0% and 26.9% in ORAC and DPPH
assays, respectively. Analysis of components of oligosaccharides in JA coffee was
conducted on MS. Results showed that the main sugar components observed were D-
fructose, sucrose, and inulin with degree of polymerization 3 and 4.
2.2 Introduction
Coffee has the highest in vitro antioxidant activity among common beverages.
Antioxidants such as chlorogenic acids (CGA) and melanoidins in coffee, have been a
research topic of great interest for decades. Melanoidins are macromolecular nitrogenous
materials with a brown color formed in Maillard reactions 48. Coffee infusion
melanoidins are composed of polysaccharides, proteins, and phenolic compounds.
Phenolic acids can bind with melanoidins non-covalently 49, and melanoidin-bound
phenolic compounds contribute to the antioxidant activity of coffee along with free
phenolic acids 30. It indicates a possibility that inulin may have potentials on the
production of melanoidin-bound phenolic compounds.
18
As demonstrated previously, inulin is a dietary fiber that has numerous health
benefits, but inulin is not a common nutrient in common diet, while coffee is one of the
most common diets. As a result, the combination of inulin and coffee is of interest, as
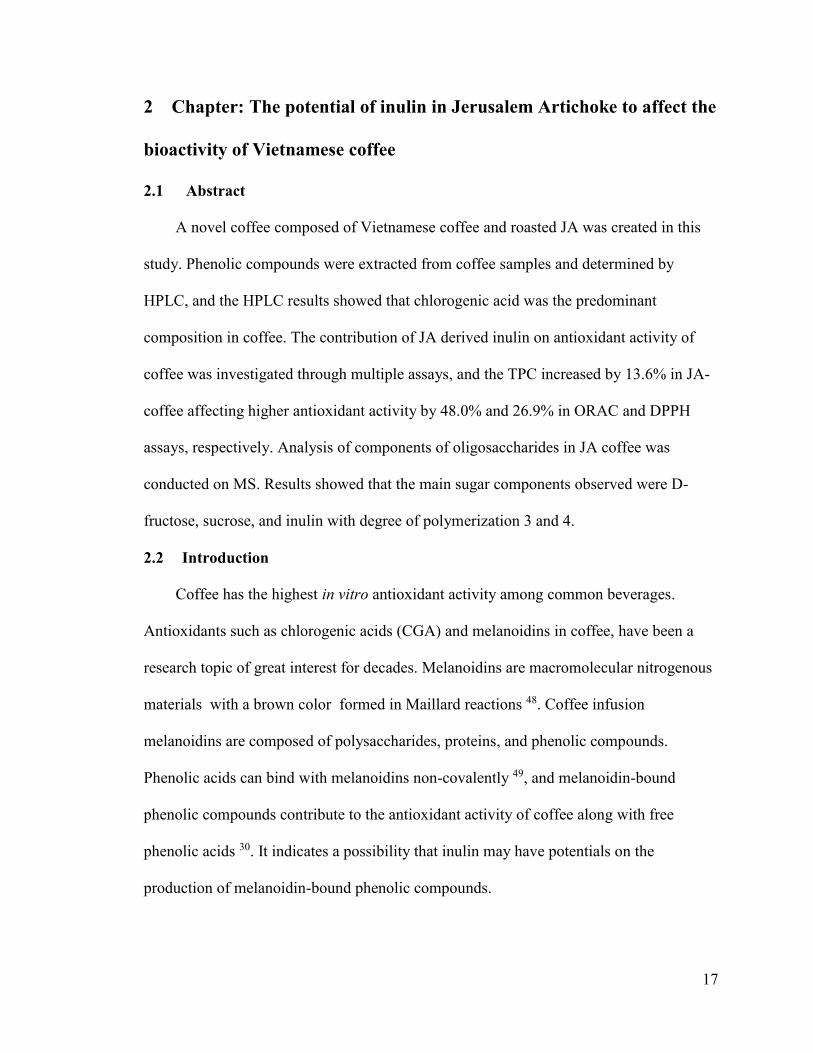
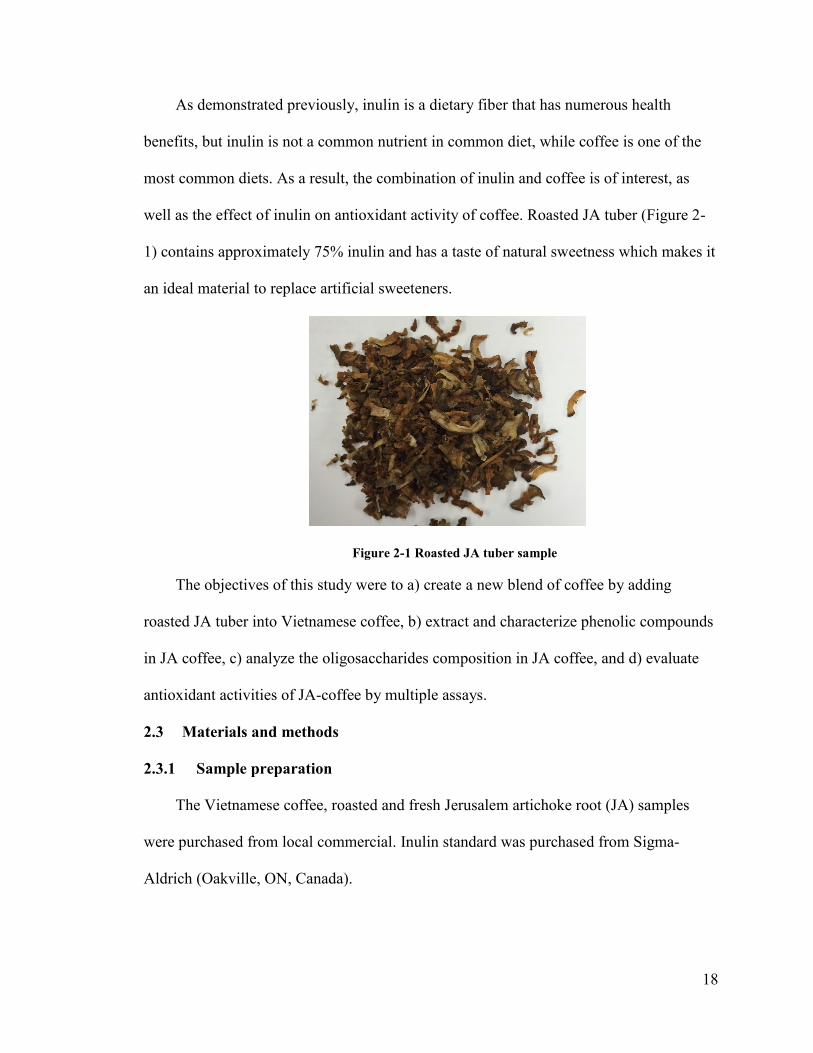
well as the effect of inulin on antioxidant activity of coffee. Roasted JA tuber (Figure 2-
1) contains approximately 75% inulin and has a taste of natural sweetness which makes it
an ideal material to replace artificial sweeteners.
Figure 2-1 Roasted JA tuber sample
The objectives of this study were to a) create a new blend of coffee by adding
roasted JA tuber into Vietnamese coffee, b) extract and characterize phenolic compounds
in JA coffee, c) analyze the oligosaccharides composition in JA coffee, and d) evaluate
antioxidant activities of JA-coffee by multiple assays.
2.3 Materials and methods
2.3.1 Sample preparation
The Vietnamese coffee, roasted and fresh Jerusalem artichoke root (JA) samples
were purchased from local commercial. Inulin standard was purchased from Sigma-
Aldrich (Oakville, ON, Canada).
19
Fresh JA was sliced and freeze-dried. All samples were gound into powder by a
grinder and mixed in different ratios. There were five samples, plain coffee (100%
Vietnamese coffee powder), inulin coffee (10% inulin standard with 90% Vietnamese
coffee powder), JA coffee (50% ground roasted JA and 50% Vietnamese coffee powder),
roasted JA (100% ground roasted JA), freeze-dried JA (100% ground freeze-dried JA)
2.3.2 Materials and instruments
HPLC grade Methanol and analytical grade acetic acid were purchased from
Caledon Laboratories LTC (Georgetown, ON, Canada). HPLC grade formic acid and
acetonitrile were purchased from Sigma-Aldrich Canada (Oakville ON, Canada). Sodium
carbonate was obtained from Church and Dwight Canada Corp (Mississauga, ON,
Canada). The phenolic acid standards, gallic, protocatechuic, p-hydroxybenzoic,
chlorogenic, caffeic, vanillic, syringic, p-coumaric, sinapic, ferulic, o-coumaric;
flavonoid standards, pyrogallol, catechin, epicatechin, rutin, quercetin-3-beta- glucoside,
epicatechin gallate, myricetin, quercetin, apigenin and kaempferol, were analytical grade
and purchased from Sigma-Aldrich (St. Louis, Missouri, USA). Fluorescein, Trolox (6-
hydroxy-2, 5, 7, 8-tetramethylchroman-2-carboxylic acid), 2, 2’-azobis (2-
methylpropionamidine) dihydrochloride (AAPH), rutin, Folin-Ciocalteu reagent, and 2,
2-diphenyl-1-picryhydrazyl radical (DPPH), were analytical grade and obtained from
Sigma-Aldrich (Oakville, ON, Canada). Water was purified by Milli-Q Integral Water
Purification System (EMD Millipore Corp.).
The high performance liquid chromatography (Waters e2695 HPLC system) was
equipped with a 2998 photodiode array (PDA) detector and Empower workstation on
computer (Waters, Milford, MA, USA). FLx800TM Multi-Detection Microplate Reader
20
with Gen5TM software (BioTek Instruments, Ottawa, Canada). Pierce Reacti-Therm I
#18821 Heating/Stirring Module (Thermo Scientific, MA, USA), Proxeon
Nanoelectrospray Emitter (Thermo Scientific, Odense, Denmark), QStar XL hybrid
quadrupole time-of-flight mass spectrometer (TOF-MS) with a nanoelectrospray
ionization source (AB Sciex, Framingham, MA, USA).
2.3.3 Extraction of phenolic compounds
Each sample was weighed 1 g and then mixed with 20 mL of acidified (1% acetic
acid) methanol solution (80%). The mixture was stirred for 3 hours at room temperature
(23 °C) and centrifuged at 4000 RPM for 15 minutes at 23 °C. The supernatant was
collected and stored at -20 °C in the freezer. Each sample extraction was done triplicated.
2.3.4 Characterization and determination of phenolic compounds
Phenolic compounds extracts were diluted with methanol and filtered on a 45 μm
membrane filter. Phenolic acid and flavonoid standards were prepared and diluted in
methanol. Phenolic compounds were separated by a Synergi-Max-RP (reversed phase)
column (250 x 4.6 mm, 5 μm) with column temperature 35 °C. The mobile phases were
solvent A (0.01% formic acid) and solvent B (100% acetonitrile). The gradient program
was as follows: 0-35 minutes, 90% solvent A; 35-40 minutes, 50% solvent A; 40-50
minutes, 90% solvent A. The injection volume was 10 μL, and the flow rate was 1
mL/min with a total run time of 50 minutes. The wavelength for identification of
phenolic acids was 280 nm, and for flavonoids were both 280 nm and 320nm. Spectra of
all samples and standards at a range of 200-700 nm were recorded. For the preparation of
standard curve, the mixture of all phenolic acids and flavonoids standards were prepared
in five different concentrations, and the standard curve was plotted based on the peak
21
areas of each concentration. The concentrations of phenolic compounds in samples were
calculated based on the standard curve equations.
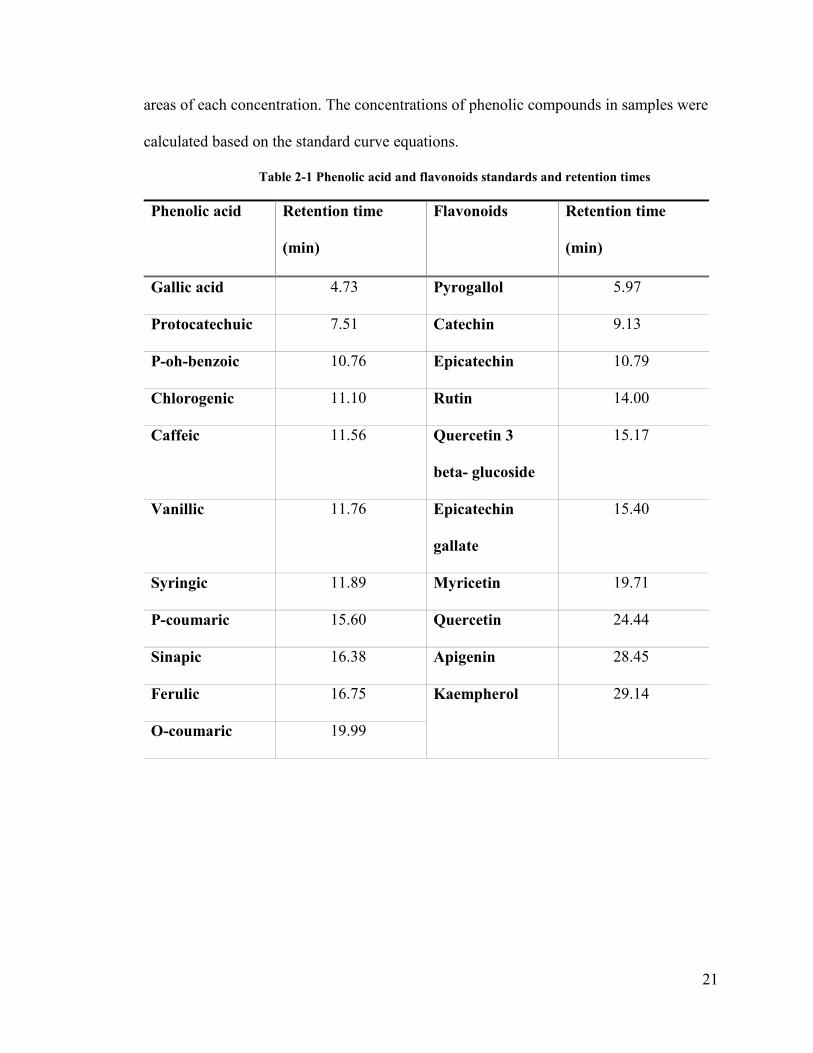
Table 2-1 Phenolic acid and flavonoids standards and retention times
Phenolic acid Retention time
(min)
Flavonoids Retention time
(min)
Gallic acid 4.73 Pyrogallol 5.97
Protocatechuic 7.51 Catechin 9.13
P-oh-benzoic 10.76 Epicatechin 10.79
Chlorogenic 11.10 Rutin 14.00
Caffeic 11.56 Quercetin 3
beta- glucoside
15.17
Vanillic 11.76 Epicatechin
gallate
15.40
Syringic 11.89 Myricetin 19.71
P-coumaric 15.60 Quercetin 24.44
Sinapic 16.38 Apigenin 28.45
Ferulic 16.75 Kaempherol 29.14
O-coumaric 19.99
22
2.3.5 Oxygen radical antioxidant capacity (ORAC) assay
The ORAC method was modified by Gunenc et al 50. In ORAC assay, all reagents
were prepared with ORAC working buffer (potassium phosphate buffer pH 7.4),
including different concentrations of Trolox standard solutions (100, 50, 25, 12.5 and
6.25 mΜ), fluorescein working solution (0.068 μM), a solution of rutin control (10 μM),
and 153 mM AAPH. 5 mL phenolic extracts were dried, dissolved and diluted by ORAC
working buffer. Trolox standards 20 μL, rutin control, 120 μL of fluorescein working
solution and sample dilutions were added into wells of a 96 micro-well plate respectively,
and the plate was inserted into the fluorescence reader. After a 20 minutes’ incubation at
37 °C, 60 μL of 153 mM AAPH was added to each well, and the total volume of each
well was 200 μL. ORAC working buffer 200 μL was used as blank. The experimental
results of samples were recorded as x μM TE (Trolox equivalent)/g of a sample, since
they were calculated from the standard curve of Trolox standards.
2.3.6 DPPH (2-diphenyl-1-picryhydrazyl) radical scavenging assay
Gallic acid was used as standards in DPPH radical scavenging assay, and 7 different
concentrations of standards ranging from 1, 10, 20, 30, 40, 50, 60 µg/mL were prepared
in 80% methanol. The phenolic extracts of samples were dried and then dissolved in 80%
methanol. Gallic acid standard solutions 20 μL or sample dilutions 20 μL was added to
wells of a 96-well microplate respectively, then 180 μL 50 μM DPPH solution was
loaded to each well and gently mixed, which made the total volume of each well was 200
μL. The 50 μM DPPH solution was used as the control. The microplate was sealed and
placed in dark and incubated for 60 minutes. After incubation, the absorbance under 519
nm was read and recorded by the Multi-Detection Microplate Reader.
23
The % DPPH discolorations of samples and standards were calculated by the
equation as followed:
DPPH scavenging activity (%) = (1 − (sample absorbance
𝑐𝑜𝑛𝑡𝑟𝑜𝑙 𝑎𝑏𝑠𝑜𝑟𝑏𝑎𝑛𝑐𝑒)) × 100
The gallic acid standard curve was obtained from % discolorations vs.
concentrations, and the same as sample DPPH discoloration curve. Five different
dilutions of sample were used to measure IC50 which was known as the concentration of
antioxidant to cause a 50% decrease in the initial amount of DPPH. IC50s represented for
the antioxidant activity of samples, and they were expressed into mg GAE/g of a sample
based on the standard curves.
2.3.7 Total Phenolic Content
In TPC assay, gallic acid was used as the standard, and 5 concentrations (0.5, 0.25,
0.125, 0.0625, and 0.0312 mg/mL) were prepared with Milli-Q water. The 10-fold diluted
Folin-Ciocalteu solution and 60 g/L sodium carbonate solution were prepared with Milli-
Q water for further uses. Phenolic extracts were dried by nitrogen flow and re-dissolved
by Milli-Q water under a 5-minute ultrasound treatment.
Gallic acid standard solution or sample phenolic extract dilutions was measured of
50 μL, and 475 μL of 10-fold Folin-Ciocalteu solution were added to an opaque
Eppendorf tube and mixed well. 475 μL of 60 g/L sodium carbonate solution was added
to the mixture and gently mixed after 5 minutes, so the total volume was 1 mL. Milli-Q
water 50 μL with 475 μL of Folin-Ciocalteu solution and sodium carbonate were used as
blank. Each mixture was measured 200 μL and added to a 96-well microplate
respectively, then the microplate was sealed and incubated in darkness for 2 hours. After
incubation, the absorbance at 725 nm was read and recorded by the Multi-Detection
24
Microplate Reader. The standard curve was plotted by absorbance vs. concentration of
gallic acid, and the TPC (total phenolic content) values of samples were calculated based
on the regression equation of the standard curve, so they were demonstrated as mg GAE
(gallic acid equivalent)/ 100 g.
2.3.8 Inulin extraction
Milli-Q water was heated to 85 °C, and 20 mL of it with 1 g of sample were added
to a 50 mL beaker and covered with aluminum foil in order to prevent evaporation, then
the mixture was stirred by a magnetic stirrer at 85 °C for 3 hours. After cooling down to
room temperature, the mixture was centrifuged at a speed of 12,000 rpm at 23 °C for 15
minutes. The surfactant was filtered by a 45 μm filter for further uses.
2.3.9 Mass Spectrometry (MS) sugar component analysis
The MS analysis of inulin extracts of samples was conducted in Carleton Mass
Spectrometry Center. A mixture of glucose, fructose, sucrose and maltose with a
concentration of 0.5 mg/ml was used as standards. Inulin extracts of samples were placed
into the Proxeon nanoelectrospray emitter and detected by a hybrid quadrupole TOF MS.
The spectra of samples were recorded with the voltage of ESI (electrospray ionization),
and the data was analyzed by ChemStation software.
2.3.10 Statistical analysis
Phenolic compounds extractions were performed three times individually. HPLC,
TPC, ORAC and DPPH results were obtained from three individual experiments.
Experimental results are expressed in a form of mean value ± SEM (standard error of the
mean). One-way analysis of variance (ANOVA) and correlations were performed by Excel
software to determine the statistical significance and relationships of data. α= 0.05 was used in
ANOVA, so values were considered significantly different if p value is less than 0.05.
25
2.4 Results
2.4.1 Determination and characterization of phenolic compounds in coffee and JA
samples
Phenolic compounds in samples (plain coffee, inulin coffee, JA coffee, roasted JA,
freeze-dried JA) were extracted by 80% acidified methanol and detected by HPLC-UV.
Phenolic acid standards and flavonoids standards were prepared in 5 concentrations to
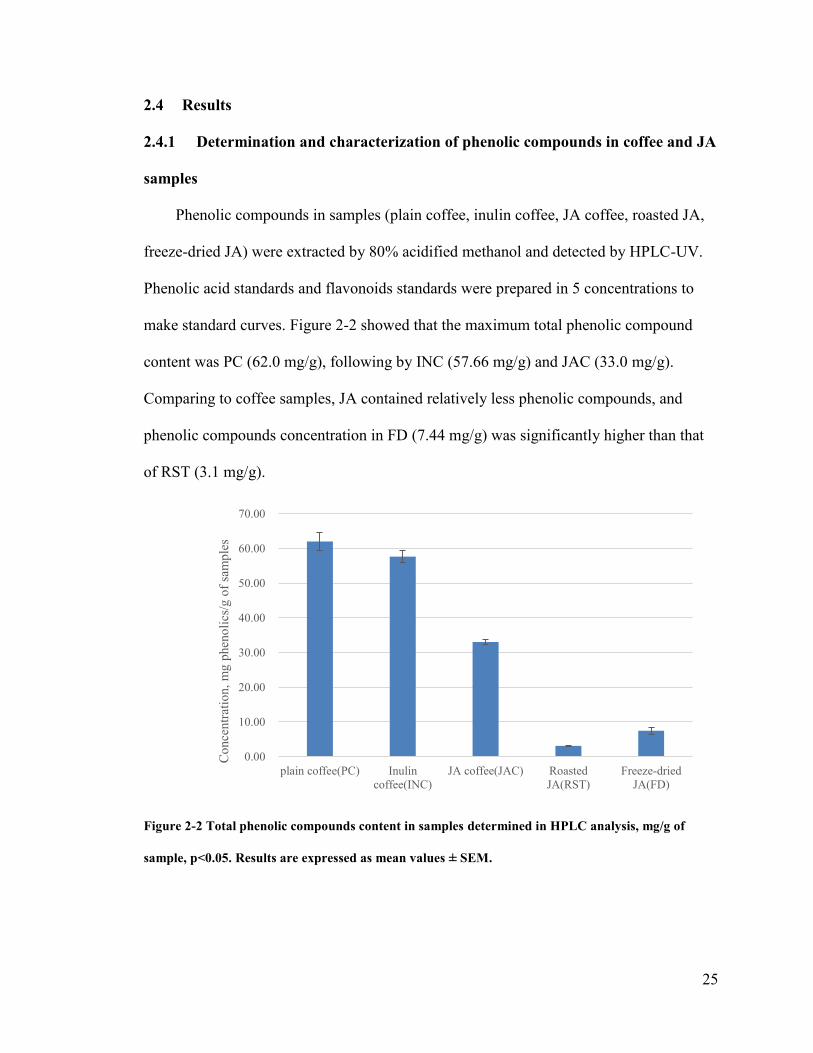
make standard curves. Figure 2-2 showed that the maximum total phenolic compound
content was PC (62.0 mg/g), following by INC (57.66 mg/g) and JAC (33.0 mg/g).
Comparing to coffee samples, JA contained relatively less phenolic compounds, and
phenolic compounds concentration in FD (7.44 mg/g) was significantly higher than that
of RST (3.1 mg/g).
Figure 2-2 Total phenolic compounds content in samples determined in HPLC analysis, mg/g of
sample, p<0.05. Results are expressed as mean values ± SEM.
0.00
10.00
20.00
30.00
40.00
50.00
60.00
70.00
plain coffee(PC) Inulin
coffee(INC)
JA coffee(JAC) Roasted
JA(RST)
Freeze-dried
JA(FD)
Co
nce
ntr
atio
n,
mg p
hen
oli
cs/g
of
sam
ple
s
26
Table 2-2 Phenolic composition in samples, mg/g
Compound Plain
coffee
(PC)
Inulin
coffee
(INC)
JA coffee
(JAC)
Roasted
JA
(RST)
Freeze-
dried
JA (FD)
Gallic acid nd nd 0.40 0.23 nd
p-oh-benzoic 5.68 4.80 2.55 0.10 0.12
Caffeic 1.44 1.34 0.74 0.06 0.06
Syringic nd nd nd nd nd
p-coumaric 3.07 2.81 1.53 nd nd
Ferulic nd nd nd nd nd
Pyrogallol 2.63 2.47 2.62 2.61 7.26
Chlorogenic acid 44.55 41.92 23.22 nd nd
Rutin 4.63 4.33 1.98 0.09 nd
Total 62.00 * 57.66 * 33.04 3.10 ** 7.44 **
*nd: not detected. *, ** p<0.05.
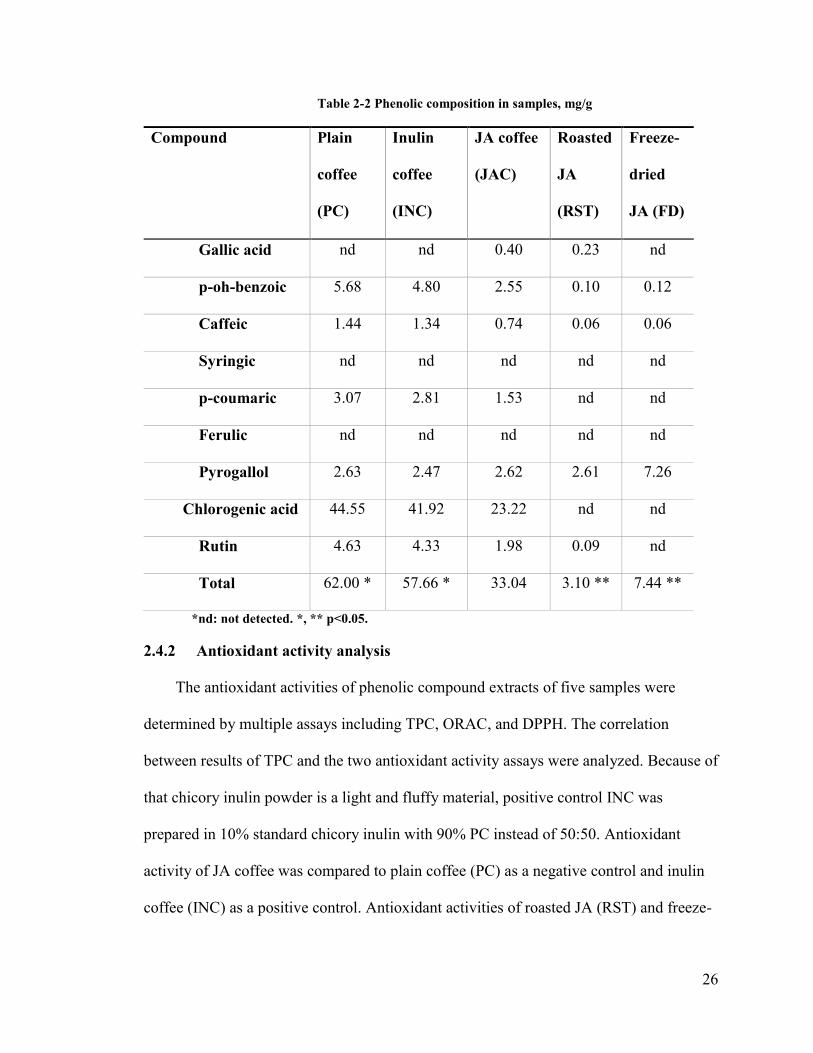
2.4.2 Antioxidant activity analysis
The antioxidant activities of phenolic compound extracts of five samples were
determined by multiple assays including TPC, ORAC, and DPPH. The correlation
between results of TPC and the two antioxidant activity assays were analyzed. Because of
that chicory inulin powder is a light and fluffy material, positive control INC was
prepared in 10% standard chicory inulin with 90% PC instead of 50:50. Antioxidant
activity of JA coffee was compared to plain coffee (PC) as a negative control and inulin
coffee (INC) as a positive control. Antioxidant activities of roasted JA (RST) and freeze-
27
dried JA were compared to each other to investigate the effect of roasting, and they were
blanks to JA coffee.
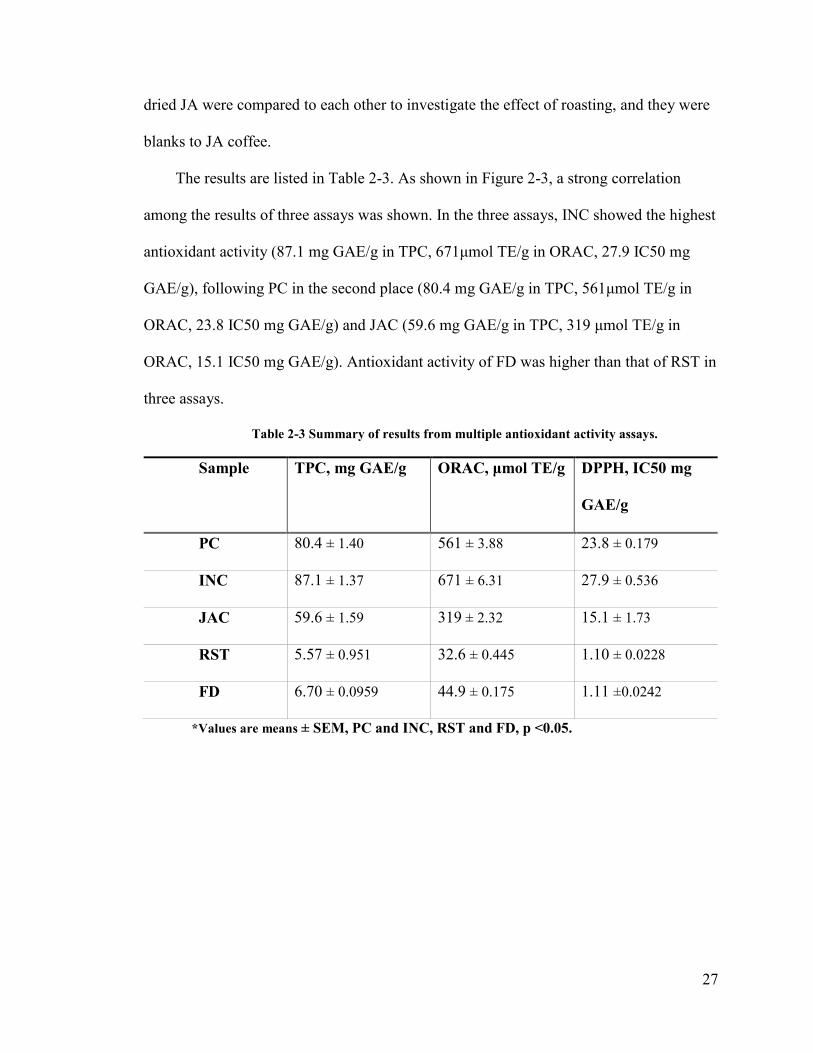
The results are listed in Table 2-3. As shown in Figure 2-3, a strong correlation
among the results of three assays was shown. In the three assays, INC showed the highest
antioxidant activity (87.1 mg GAE/g in TPC, 671μmol TE/g in ORAC, 27.9 IC50 mg
GAE/g), following PC in the second place (80.4 mg GAE/g in TPC, 561μmol TE/g in
ORAC, 23.8 IC50 mg GAE/g) and JAC (59.6 mg GAE/g in TPC, 319 μmol TE/g in
ORAC, 15.1 IC50 mg GAE/g). Antioxidant activity of FD was higher than that of RST in
three assays.
Table 2-3 Summary of results from multiple antioxidant activity assays.
Sample TPC, mg GAE/g ORAC, μmol TE/g DPPH, IC50 mg
GAE/g
PC 80.4 ± 1.40 561 ± 3.88 23.8 ± 0.179
INC 87.1 ± 1.37 671 ± 6.31 27.9 ± 0.536
JAC 59.6 ± 1.59 319 ± 2.32 15.1 ± 1.73
RST 5.57 ± 0.951 32.6 ± 0.445 1.10 ± 0.0228
FD 6.70 ± 0.0959 44.9 ± 0.175 1.11 ±0.0242
*Values are means ± SEM, PC and INC, RST and FD, p <0.05.
28
Figure 2-3 Antioxidant activity of phenolic extracts from PC, INC, JAC, RST and FD
determined by A) TPC, mg GAE/g of sample, B) ORAC, μmol TE/g of sample, and C) DPPH, IC50
mg GAE/g. p<0.05. Values are means ± SE
0
10
20
30
40
50
60
70
80
90
100
Plain coffee
(PC)
Inulin coffee
(INC)
JA coffee
(JAC)
Roasted JA
(RST)
Freeze-dried
JA (FD)
mg G
AE
/g o
f sa
mp
les
A
0.000
100.000
200.000
300.000
400.000
500.000
600.000
700.000
800.000
plain coffee
(PC)
Inulin coffee
(INC)
JA coffee
(JAC)
Roasted JA
(RST)
Freeze-dried
JA (FD)
μm
ol
TE
/g o
f sa
mp
les
B
0.00
5.00
10.00
15.00
20.00
25.00
30.00
plain coffee
(PC)
Inulin coffee
(INC)
JA coffee
(JAC)
Roasted JA
(RST)
Freeze-dried
JA (FD)
IC 5
0 m
g G
AE
/g
C
29
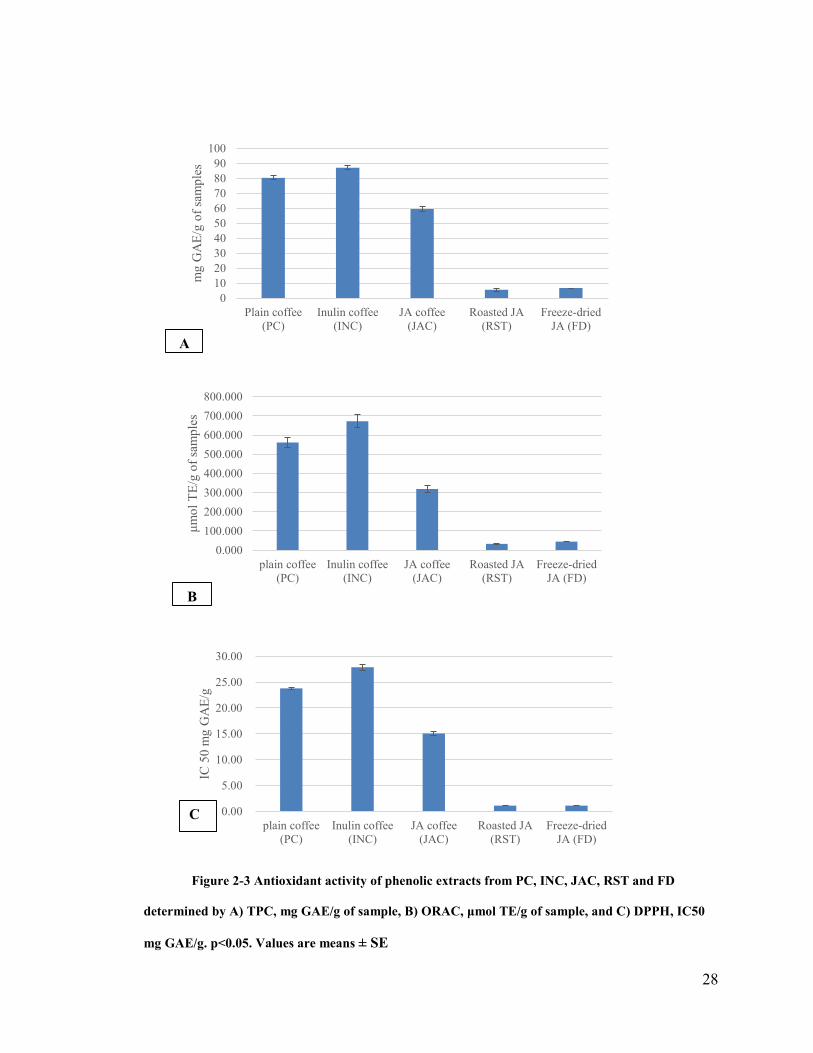
Figure 2-4 The linear correlation of results of (A) ORAC vs. TPC, (B) DPPH vs. TPC.
R2>0.9.
y = 7.72x + 13.906
R² = 0.9212
0.000
100.000
200.000
300.000
400.000
500.000
600.000
700.000
800.000
0 10 20 30 40 50 60 70 80 90
μm
ol
TE
/g o
f sa
mp
les
mg GAE/g A
y = 310.87x - 1169.4
R² = 0.9764
0
5000
10000
15000
20000
25000
30000
0 10 20 30 40 50 60 70 80 90
IC 5
0 m
g G
AE
/g
mg GAE/g B
30
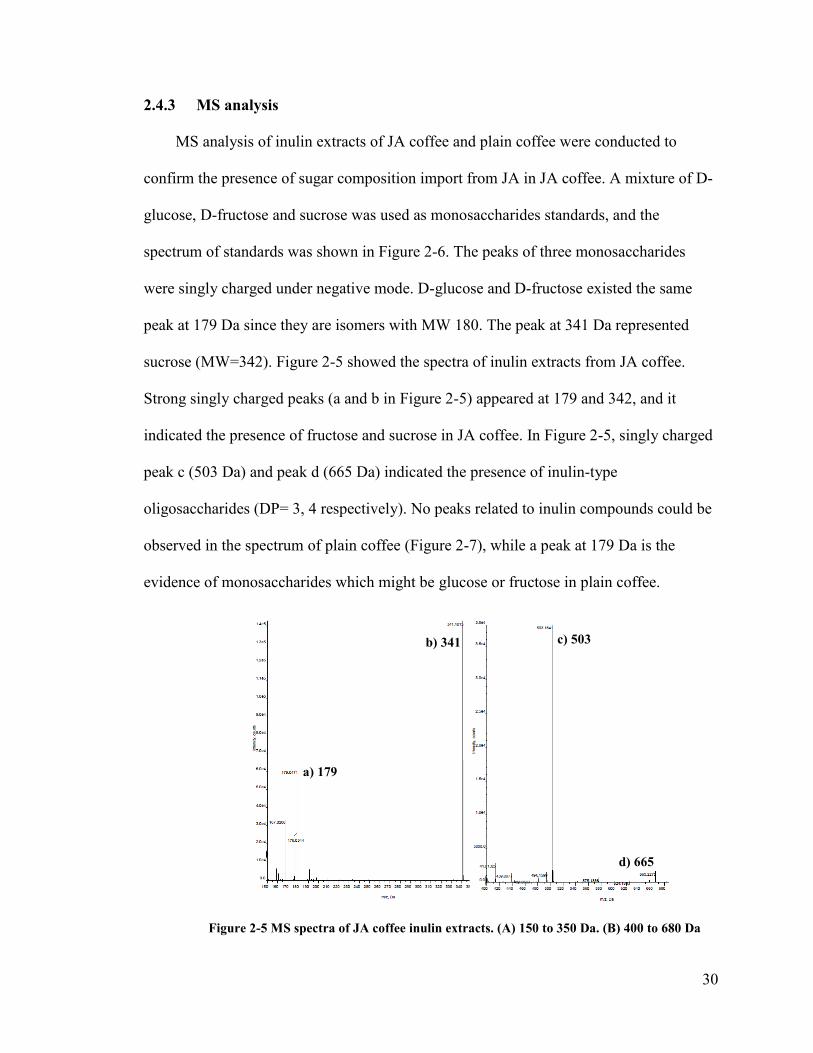
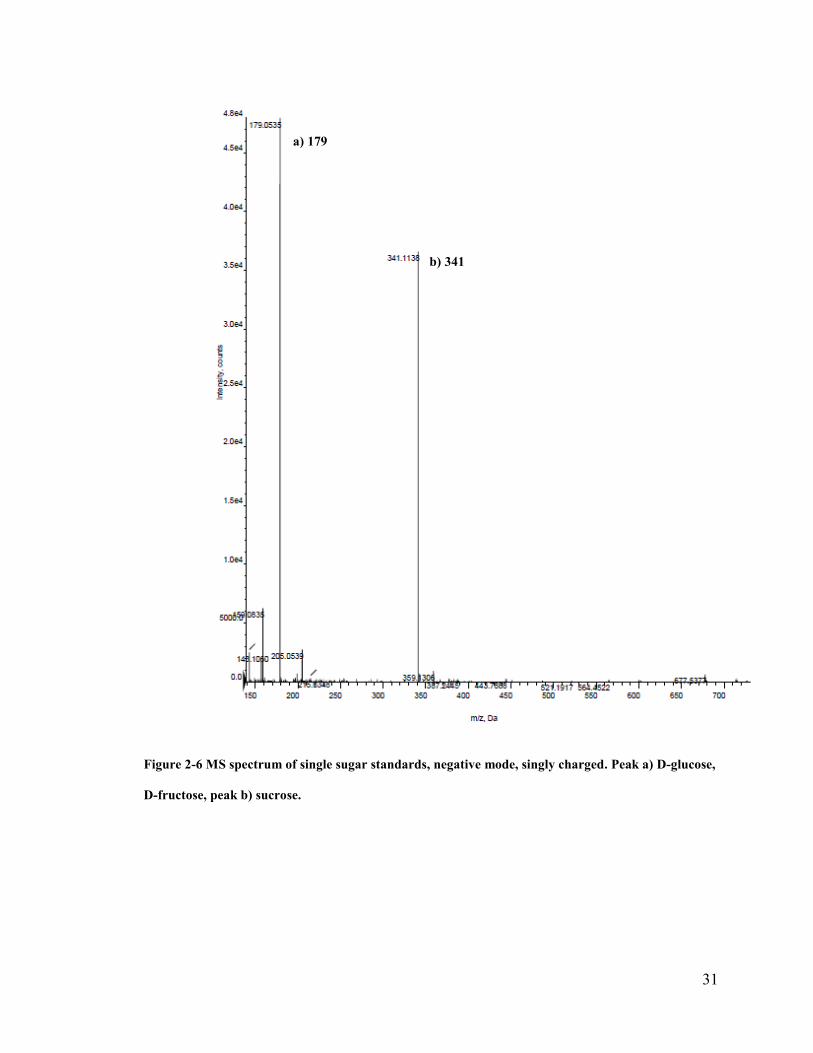
2.4.3 MS analysis
MS analysis of inulin extracts of JA coffee and plain coffee were conducted to
confirm the presence of sugar composition import from JA in JA coffee. A mixture of D-
glucose, D-fructose and sucrose was used as monosaccharides standards, and the
spectrum of standards was shown in Figure 2-6. The peaks of three monosaccharides
were singly charged under negative mode. D-glucose and D-fructose existed the same
peak at 179 Da since they are isomers with MW 180. The peak at 341 Da represented
sucrose (MW=342). Figure 2-5 showed the spectra of inulin extracts from JA coffee.
Strong singly charged peaks (a and b in Figure 2-5) appeared at 179 and 342, and it
indicated the presence of fructose and sucrose in JA coffee. In Figure 2-5, singly charged
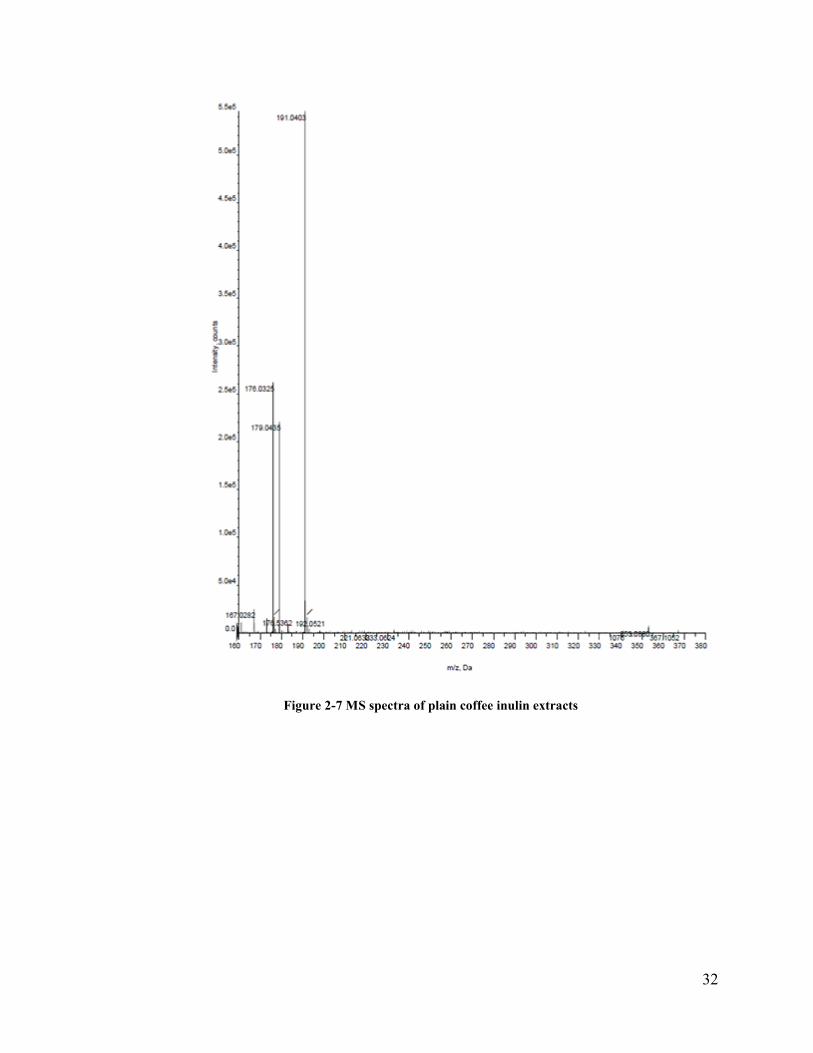
peak c (503 Da) and peak d (665 Da) indicated the presence of inulin-type
oligosaccharides (DP= 3, 4 respectively). No peaks related to inulin compounds could be
observed in the spectrum of plain coffee (Figure 2-7), while a peak at 179 Da is the
evidence of monosaccharides which might be glucose or fructose in plain coffee.
Figure 2-5 MS spectra of JA coffee inulin extracts. (A) 150 to 350 Da. (B) 400 to 680 Da
b) 341 c) 503
d) 665
a) 179
31
Figure 2-6 MS spectrum of single sugar standards, negative mode, singly charged. Peak a) D-glucose,
D-fructose, peak b) sucrose.
b) 341
a
) 179
a) 179
32
Figure 2-7 MS spectra of plain coffee inulin extracts
33
2.5 Discussion
A novel JA coffee was created by blending roasted JA tuber and Vietnamese coffee
beans with a ratio of 1:1. In results of HPLC analysis, phenolic content in plain coffee
was the highest, 62.0 mg/g. According to Table 2-2, chlorogenic acid was the
predominant composition of phenolic extracts of plain coffee (44.55 mg/g), inulin coffee
(41.92 mg/g) and JA coffee (23.22 mg/g). Quantitative results in this study showed
correlation with literature values. As reported by Farah et al 2005, chlorogenic acid is the
main phenolic acid in coffee, and the concentration of chlorogenic acid in commercial
roasted coffee has a wide range from 8.1 to 52.8 mg/g 23.
The total phenolic content (TPC) and antioxidant activity values of samples were
shown in Figure 2-3, and the relationship between TPC and antioxidant activity results
were analyzed by correlation equations which were shown in Figure 2-4. The R2 value of
the correlation between ORAC and TPC was 0.9212, and that of the correlation between
DPPH and TPC was 0.9764. The R2 values were near to 1 which indicated that TPC had
a strong correlation between the antioxidant activities.
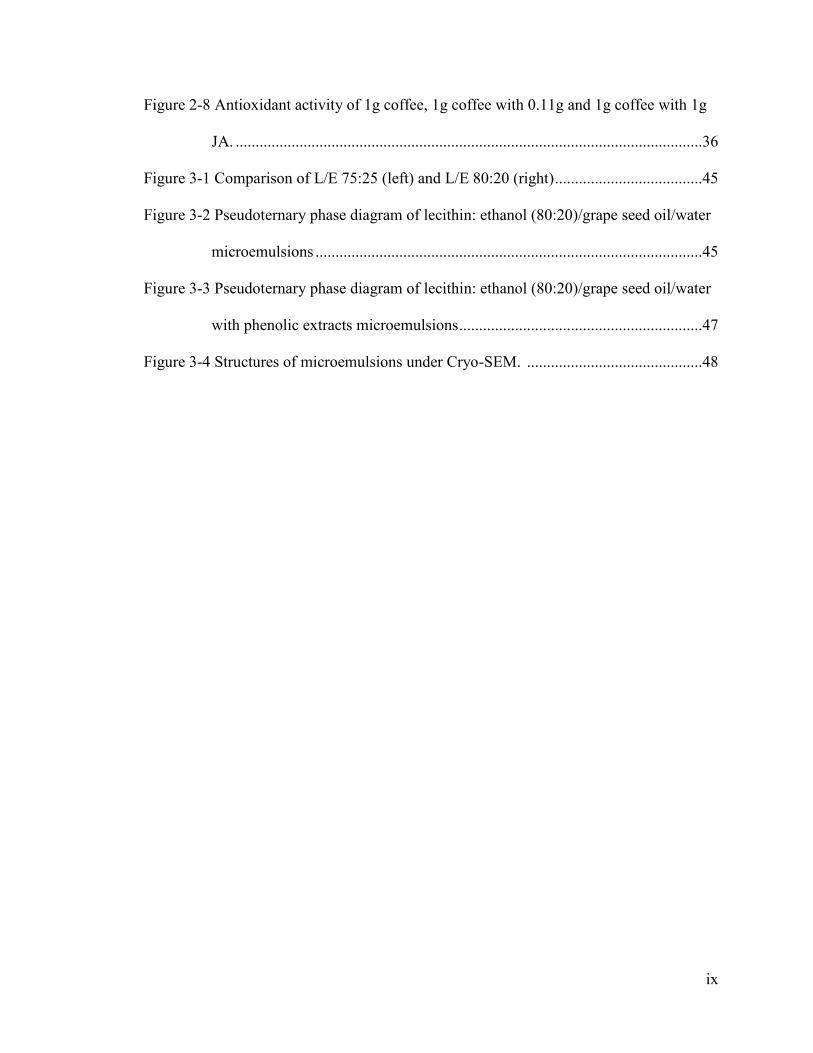
In order to make the antioxidant activity of plain coffee, inulin coffee and JA coffee
more comparable, the experimental results of inulin coffee and JA coffee were converted
to the form Antioxidant Activity/ 1 g coffee with additives as shown in Figure 2-8.
Overall, the antioxidant activities of coffee with additives were significantly higher than
that of coffee only, and it indicated that the addition of inulin significantly increased the
antioxidant activity of coffee. As shown in Figure 2-8-A, JA additive coffee had a
significantly higher TPC value (119.11 mg GAE in 1g coffee with 1g JA) than inulin
control (96.83 mg GAE in 1g coffee with 0.11g inulin). However, it showed an opposite
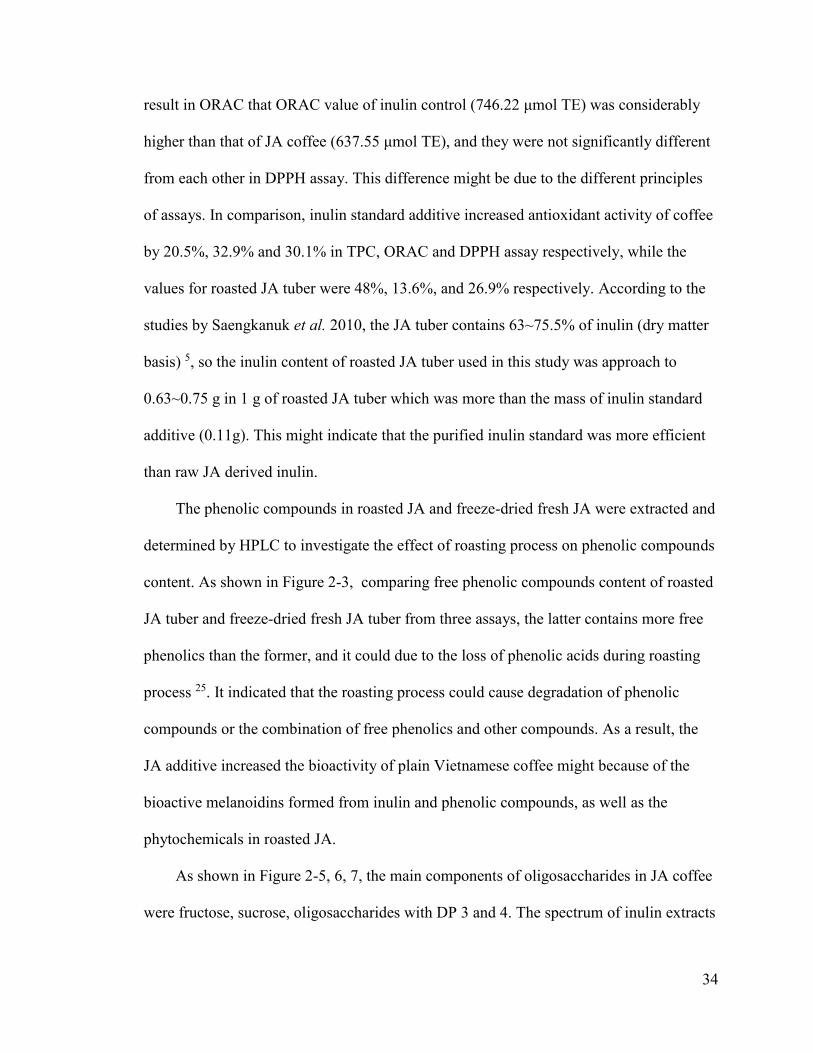
34
result in ORAC that ORAC value of inulin control (746.22 μmol TE) was considerably
higher than that of JA coffee (637.55 μmol TE), and they were not significantly different
from each other in DPPH assay. This difference might be due to the different principles
of assays. In comparison, inulin standard additive increased antioxidant activity of coffee
by 20.5%, 32.9% and 30.1% in TPC, ORAC and DPPH assay respectively, while the
values for roasted JA tuber were 48%, 13.6%, and 26.9% respectively. According to the
studies by Saengkanuk et al. 2010, the JA tuber contains 63~75.5% of inulin (dry matter
basis) 5, so the inulin content of roasted JA tuber used in this study was approach to
0.63~0.75 g in 1 g of roasted JA tuber which was more than the mass of inulin standard
additive (0.11g). This might indicate that the purified inulin standard was more efficient
than raw JA derived inulin.
The phenolic compounds in roasted JA and freeze-dried fresh JA were extracted and
determined by HPLC to investigate the effect of roasting process on phenolic compounds
content. As shown in Figure 2-3, comparing free phenolic compounds content of roasted
JA tuber and freeze-dried fresh JA tuber from three assays, the latter contains more free
phenolics than the former, and it could due to the loss of phenolic acids during roasting
process 25. It indicated that the roasting process could cause degradation of phenolic
compounds or the combination of free phenolics and other compounds. As a result, the
JA additive increased the bioactivity of plain Vietnamese coffee might because of the
bioactive melanoidins formed from inulin and phenolic compounds, as well as the
phytochemicals in roasted JA.
As shown in Figure 2-5, 6, 7, the main components of oligosaccharides in JA coffee
were fructose, sucrose, oligosaccharides with DP 3 and 4. The spectrum of inulin extracts
35
in sample showed a correlation to the literature for strong peaks at 503 and 665 Da 51.
The MS analysis of JA coffee confirmed the existence of inulin in it, and the DPs of JA
derived inulin were relatively lower comparing to Artichoke inulin (DP=46), chicory
inulin (DP=12) 12. The addition of roasted JA in coffee may enhance the flavor while
provide many health benefits. Besides prebiotics functions as demonstrated before,
inulin-type fructans were proved to be beneficial to calcium absorption in adults
especially older women since they cannot be hydrolyzed by mammalian enzymes and the
production of short-chain acids in the fermentation process of inulin in the human
intestinal tract which can enhance the solubility of calcium 52. Additionally, the
fermentation of carbohydrates in colon can stimulate its motility, thus ameliorate
constipation problems which especially bother elders 53. It was reported that the addition
of oligofructose in the diet of rats decreased the triacylglycerols in very-low-density
lipoproteins, and inulin has the ability to modify lipid metabolism in rats 54. As a result,
the introduction of inulin to daily diets is of interest. JA tubers had been successfully
prepared in dried chips and they were suggested to be widely utilized in food processing
as a functional modifier 55.
In this study, roasted JA tuber powder was used as additive in coffee to modify the
characteristics. Overall, the results of this study showed the remarkable functionality of
roasted JA tuber in Vietnamese coffee with increases of antioxidant activity by 48.0%,
13.6%, 26.9% in TPC, ORAC and DPPH assays respectively, and it also showed
potential to improve characteristics of coffee such as smoothness, color, taste and flavor.
Thus, roasted JA tuber was a possible replacement of artificial sweetener in coffee as
36
well as a functional additive, and JA coffee had the potential to be introduced to common
human diets for its characteristic flavor and health benefits.
Figure 2-7 Antioxidant activity of the control (1g coffee), positive control (1g coffee with 0.11g inulin
standard) and JA coffee (1g coffee with 1g JA). A) TPC, mg GAE, B) ORAC, μmol TE C) DPPH,
IC50 mg GAE. Values with different letters are significantly different (p<0.05). Values are means ±
SEM
2.6 Conclusions
The phenolic compounds from plants are important antioxidants that can be more
commonly used in daily diets. In the present study, the functionality of JA derived inulin
on Vietnamese coffee was investigated. The antioxidant activity of JA coffee was
significantly higher than that of Vietnamese coffee. The reason behind this could be the
interaction of inulin with phenolic compounds in coffee. The success of JA in increasing
0.00
20.00
40.00
60.00
80.00
100.00
120.00
140.00
Control Positive
control
JA coffee
TP
C, m
g G
AE
A
ab
c
0.00
200.00
400.00
600.00
800.00
1000.00
Control Positive
control
JA coffeeOR
AC
val
ue,
μm
ol
TE
B
a
bc
0.00
5.00
10.00
15.00
20.00
25.00
30.00
35.00
Control Positive
control
JA coffee
IC5
0, m
g G
AE
C
a
b*
b*
37
antioxidant activity of coffee makes JA coffee a fine source of natural antioxidants as
well as a possible diet for people with diabetes or cardiovascular diseases.
Future studies should aim to investigate the mechanisms behind the functionality of
inulin on increasing the antioxidant activity of Vietnamese and other brands of coffee.
Furthermore, evaluation of the in vivo antioxidant activity of phenolic extracts from
coffee will be of great interest.
2.7 Connecting statement to Chapter 3
In Chapter 2, the phenolic content in coffee was analyzed by HPLC, and the
addition of inulin and JA was proved to have the ability to increase the antioxidant
activity of Vietnamese coffee. The results in Chapter 2 indicates that the JA coffee
product not only contains the healthy ingredient JA, but also provides an enhanced
antioxidant activity. Coffee brews are common diets in daily life, and there is a large
amount of coffee waste produced which can be a resource and should not be ignored.
In Chapter 3, the phenolic compounds in coffee waste were extracted and
determined by HPLC. To utilize the phenolics in coffee waste, a lecithin-based food
grade microemulsion system was developed. The study aims to apply phenolic extracts
from coffee waste to the food grade microemulsion system, and the stabilization area was
expressed in pseudoternary phase diagram.
38
3 Chapter: Development of a novel food grade microemulsion system
3.1 Abstract
In this study, a novel food grade microemulsion system composed of grape seed
oil, lecithin, ethanol, and water was developed and applied on phenolic compounds
extracts of spent coffee ground. Nine different formulations were prepared among which
A2 (19.61% Lecithin/Ethanol, 78.43% Grapeseed oil, 2.00% water) and B2 (19.51%
Lecithin/Ethanol, 78.05% Grapeseed acid, 2.44% phenolic solution) were considered to
be worth studying due to their low levels of surfactants, high solubilization of grape seed
oil, and relatively lower viscosity. The phenolic compounds in spent coffee ground were
extracted and determined by HPLC, and the concentration was 0.39 mg/mL. Phenolic
compositions in microemulsions were in a range from 5.85 to 58.5 µg/g. Effects of the
extrusion technique, LiposoFast device on microemulsions were investigated through
Cryo-SEM observation. Results indicated that the extrusion technique was able to make
microemulsions more uniform in structure.
3.2 Introduction
As illustrated previously, microemulsions have been investigated in a wide range of
fields including food, pharmaceutical and cosmetic products, nanoparticles synthesis
routes, chromatography, and extraction techniques. Nevertheless, the large amount of
surfactants required in microemulsions for sufficient formulation stability is one of the
significant disadvantages of microemulsions. It is reported that high surfactant contents in
consumer products may cause unwanted residues, and high surfactant levels in synthesis
processes may cause undesired byproducts or contaminants 56. Another drawback of
microemulsion systems is that many of them have a poor oil solubilization capacity. In
39
this case, mixed surfactants and co-surfactants have been studied to reduce the interfacial
tension which improves the stability of microemulsions formulations 57.
Lecithin as a biological amphiphile is reported to be an available surfactant in the
preparation of non-toxic microemulsion systems. It is noteworthy that lecithin-based
microemulsions need the presence of a short-chain alcohol working as a co-surfactant to
balance the hydrophilic and hydrophobic effects 58. Lecithin-based microemulsions have
been reported numerous applications in drug delivery. According to Dreher et al, a
soybean lecithin microemulsion gel composed of soybean phosphatidylcholine, isopropyl
palmitate and water could successfully work as a penetration enhancer of anti-
inflammatory drugs for transdermal drug delivery without significant skin irritation 59.
Curcumin microemulsions with soybean oil/lecithin were introduced by Lin et al, and
they showed exclusively prominent cytotoxic effects on human hepatoma HepG2 cell
line 60. In this study, food grade soy lecithin was used as the surfactant with ethanol as the
co-surfactant.
Grape seed oil is a byproduct of winemaking and grape juice processing. It contains
about 90% of fatty acids in which 70% of linoleic acid 61. It has a wide range of
applications in food, pharmaceutical, and cosmetics products. It is reported that grape
seed oil can be a composition of microemulsions as the oil phase. Davidov-Pardo et al
successfully developed a method of resveratrol encapsulation with grape seed oil
microemulsions which contained 10% oil phase (grape seed oil: orange oil 1:1, w/w),
10% Tween 80 as surfactants, and 80% water phase 62. Grape seed oil was used as oil
continuous phase in microemulsions in this study.
40
In the daily coffee beverage consumption, a massive amount of spent coffee ground
is generated. Recently, possible applications of the coffee waste are of interests for
resource saving and environmental protection purposes. It is demonstrated that
byproducts in coffee processing is a source of important ingredients such as fibers and
antioxidants, and spent coffee grounds have a total phenolic content of 20 mg GAE/g
approximately 63. The feasibility of applying phenolic compounds extracts on the
lecithin-based microemulsions was studied in the present research.
In this study, the third phase titration method was used to prepare microemulsions.
The objectives of this study were to: a) develop a novel food grade microemulsion system
with lecithin, ethanol, grapeseed oil, and water, b) apply the microemulsion system on
phenolic compound extracts from spent coffee ground.
3.3 Materials and methods
3.3.1 Materials and instruments
Soya lecithin was obtained from a local nutrition store. HPLC grade methanol,
anhydrous ethanol, and acetic acid were purchased from VWR (Mississauga, ON,
Canada). Grape seed oil was purchased from Mother Earth (Ottawa, ON, Canada). The
coffee sample was obtained from CAFÉ CIMO inc. (Montreal, QC, Canada).
Instruments included the HPLC-UV-PDA (e2695, Waters, Milford, MA, USA), a
Vega-Ⅱ XMU SEM with a cryo-stage (TESCAN, Brno, Czech Republic), LiposoFast-
Basic device and 100 nm polycarbonate membranes (AVESTIN Inc, Germany).
3.3.2 Optimization of surfactant: co-surfactant ratios
Lecithin was used as the surfactant, and anhydrous ethanol was the co-surfactant.
Four ratios were tested for seeking an optimized ratio, and they were lecithin: ethanol
41
(L/E) 90:10, 80:20, 75:25, and 70:30 (w/w). Certain ratios of lecithin and ethanol were
mixed well for further study.
L/E 90:10 had a significantly higher viscosity than other ratios. L/E 80:20 performed
a fine, homogeneous and transparent mixture, and it stayed stable after 24 hours standing.
However, the L/E 75:25 and 70:30 were opaque mixture at the moment prepared, and
they were separated into two phases after 24 hours standing. Generally speaking, L/E
80:20 was considered to be the optimized ratio of surfactant: co-surfactant, and it was
prepared freshly before experiments.
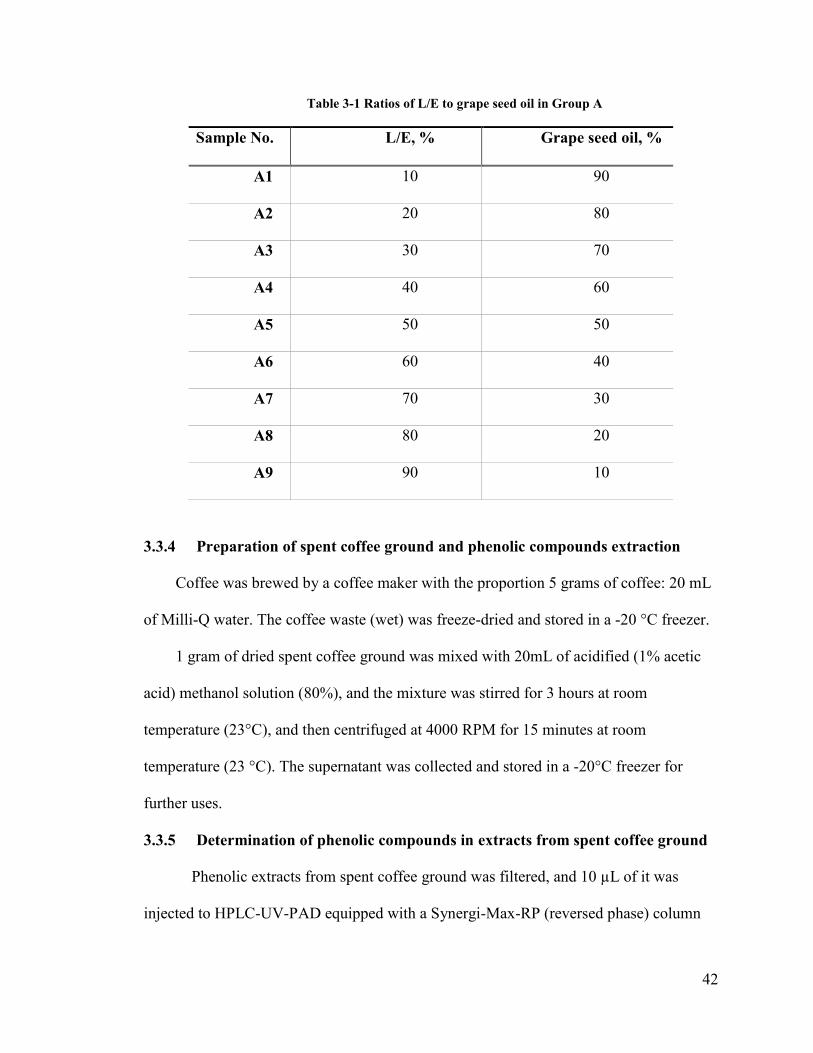
3.3.3 Formation of microemulsions and the pseudoternary phase diagram
The L/E (80:20) was mixed with the second phase, grape seed oil (GSO), in 9
different ratios (10:90, 20:80, 30:70, 40:60, 50:50, 60:40, 70:30, 80:20, 90:10) in screw-
capped glass tubes. The third phase, Milli-Q water, was titrated into each ratio with 5 μL
per time as the mixture was stirred by a magnetic stirrer at 1000rpm. The titration ended
until the system was non-transparent, so the borders of the one-phase microemulsion
region could be calculated based on the percentage of the three phases in the system.
Each sample was prepared in triplicates. The temperature was kept at room temperature,
23 ± 0.2 °C. Samples in which water was the third phase belonged to Group A, and the
compositions of samples in Group A were listed in Table 3-1.
Based on the percentage of each phase, pseudoternary phase diagram of Group A
was conducted by software SigmaPlot (version 10.0).
42
Table 3-1 Ratios of L/E to grape seed oil in Group A
Sample No. L/E, % Grape seed oil, %
A1 10 90
A2 20 80
A3 30 70
A4 40 60
A5 50 50
A6 60 40
A7 70 30
A8 80 20
A9 90 10
3.3.4 Preparation of spent coffee ground and phenolic compounds extraction
Coffee was brewed by a coffee maker with the proportion 5 grams of coffee: 20 mL
of Milli-Q water. The coffee waste (wet) was freeze-dried and stored in a -20 °C freezer.
1 gram of dried spent coffee ground was mixed with 20mL of acidified (1% acetic
acid) methanol solution (80%), and the mixture was stirred for 3 hours at room
temperature (23°C), and then centrifuged at 4000 RPM for 15 minutes at room
temperature (23 °C). The supernatant was collected and stored in a -20°C freezer for
further uses.
3.3.5 Determination of phenolic compounds in extracts from spent coffee ground
Phenolic extracts from spent coffee ground was filtered, and 10 µL of it was
injected to HPLC-UV-PAD equipped with a Synergi-Max-RP (reversed phase) column
43
(250 x 4.6 mm, 5 μm) with column temperature 35 °C. The mobile phases were solvent A
(0.01% formic acid) and solvent B (100% acetonitrile). The gradient program was as
follows: 0-35 minutes, 90% solvent A; 35-40 minutes, 50% solvent A; 40-50 minutes,
90% solvent A. The flow rate was 1 mL/min. The phenolic standards were the same as in
Chapter 2. The concentrations of phenolic compounds in the extracts were calculated
according to standard curves.
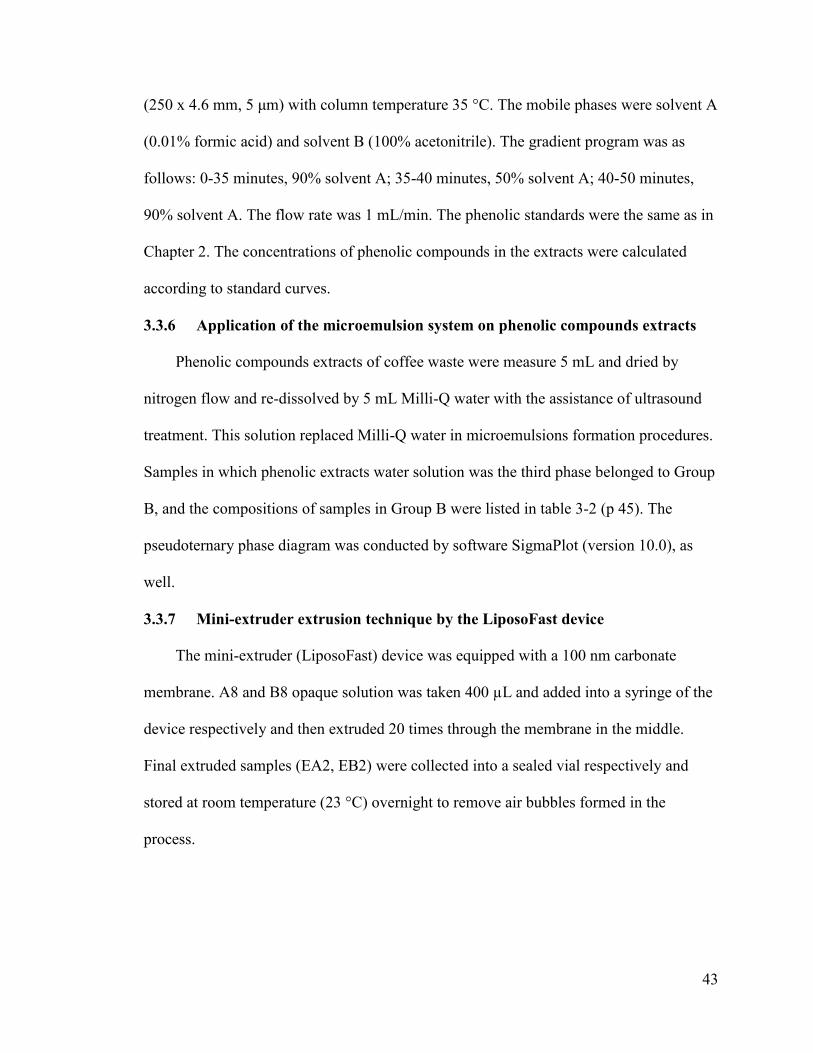
3.3.6 Application of the microemulsion system on phenolic compounds extracts
Phenolic compounds extracts of coffee waste were measure 5 mL and dried by
nitrogen flow and re-dissolved by 5 mL Milli-Q water with the assistance of ultrasound
treatment. This solution replaced Milli-Q water in microemulsions formation procedures.
Samples in which phenolic extracts water solution was the third phase belonged to Group
B, and the compositions of samples in Group B were listed in table 3-2 (p 45). The
pseudoternary phase diagram was conducted by software SigmaPlot (version 10.0), as
well.
3.3.7 Mini-extruder extrusion technique by the LiposoFast device
The mini-extruder (LiposoFast) device was equipped with a 100 nm carbonate
membrane. A8 and B8 opaque solution was taken 400 µL and added into a syringe of the
device respectively and then extruded 20 times through the membrane in the middle.
Final extruded samples (EA2, EB2) were collected into a sealed vial respectively and
stored at room temperature (23 °C) overnight to remove air bubbles formed in the
process.
44
3.3.8 Cryo-SEM (cryogenic scanning electron microscope)
A2 and B2 were chosen to perform Cryo-SEM. Microemulsions were added on a
sample holder and placed into the cryo-stage with -65 °C. The samples were viewed at
20.00 kV. Extruded samples of A8 and B8 were also viewed. This part was conducted at
Nano Imaging Facility laboratory (Carleton University, Ottawa, ON.).
Table 3-2 Ratios of L/E to grape seed oil in Group B
Sample No. L/E, % Grape seed oil, %
B1 10 90
B2 20 80
B3 30 70
B4 40 60
B5 50 50
B6 60 40
B7 70 30
B8 80 20
B9 90 10
3.4 Results
3.4.1 Formations of microemulsions
As demonstrated in 3.3.2, the optimal ratio of L/E was 80:20 since lower ratios
caused separation of phases (Figure 3-1).
The results of the maximum of aqueous phase capacity of samples were listed in
Table 3-3. The pseudoternary phase diagram of the microemulsion systems was shown in
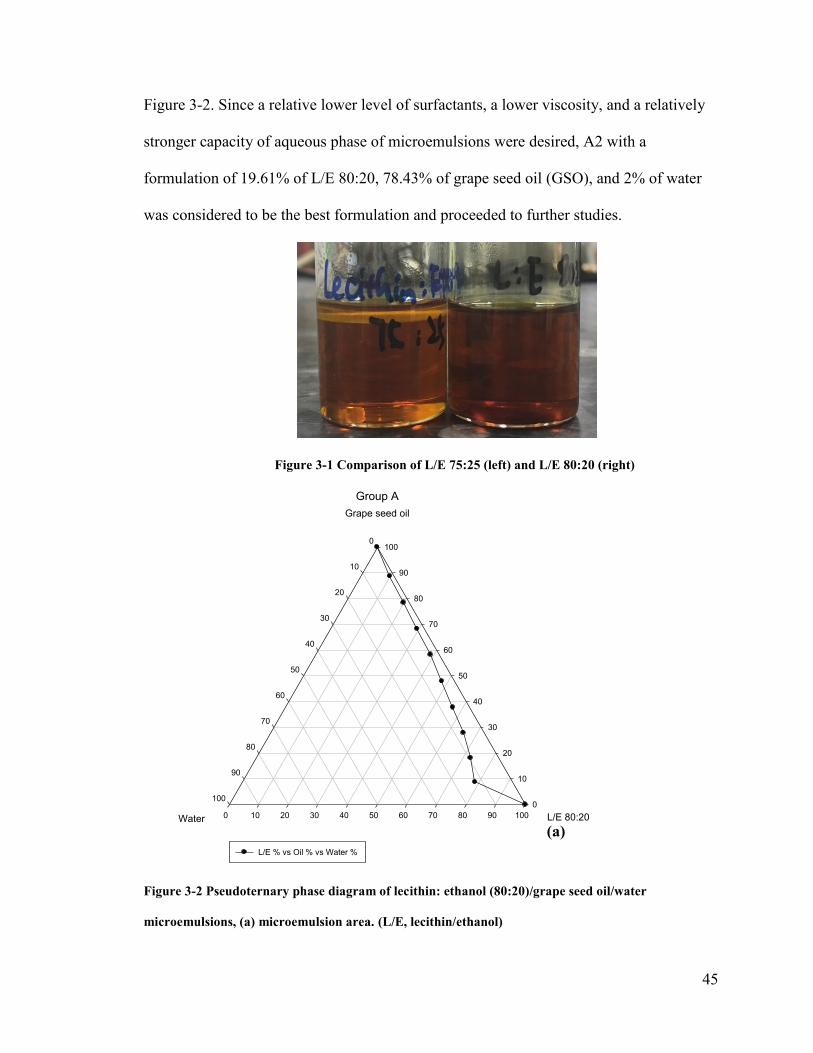
45
Figure 3-2. Since a relative lower level of surfactants, a lower viscosity, and a relatively
stronger capacity of aqueous phase of microemulsions were desired, A2 with a
formulation of 19.61% of L/E 80:20, 78.43% of grape seed oil (GSO), and 2% of water
was considered to be the best formulation and proceeded to further studies.
Figure 3-1 Comparison of L/E 75:25 (left) and L/E 80:20 (right)
Group A
L/E 80:200 10 20 30 40 50 60 70 80 90 100
Grape seed oil
0
10
20
30
40
50
60
70
80
90
100
Water
0
10
20
30
40
50
60
70
80
90
100
L/E % vs Oil % vs Water %
Figure 3-2 Pseudoternary phase diagram of lecithin: ethanol (80:20)/grape seed oil/water
microemulsions, (a) microemulsion area. (L/E, lecithin/ethanol)
(a)
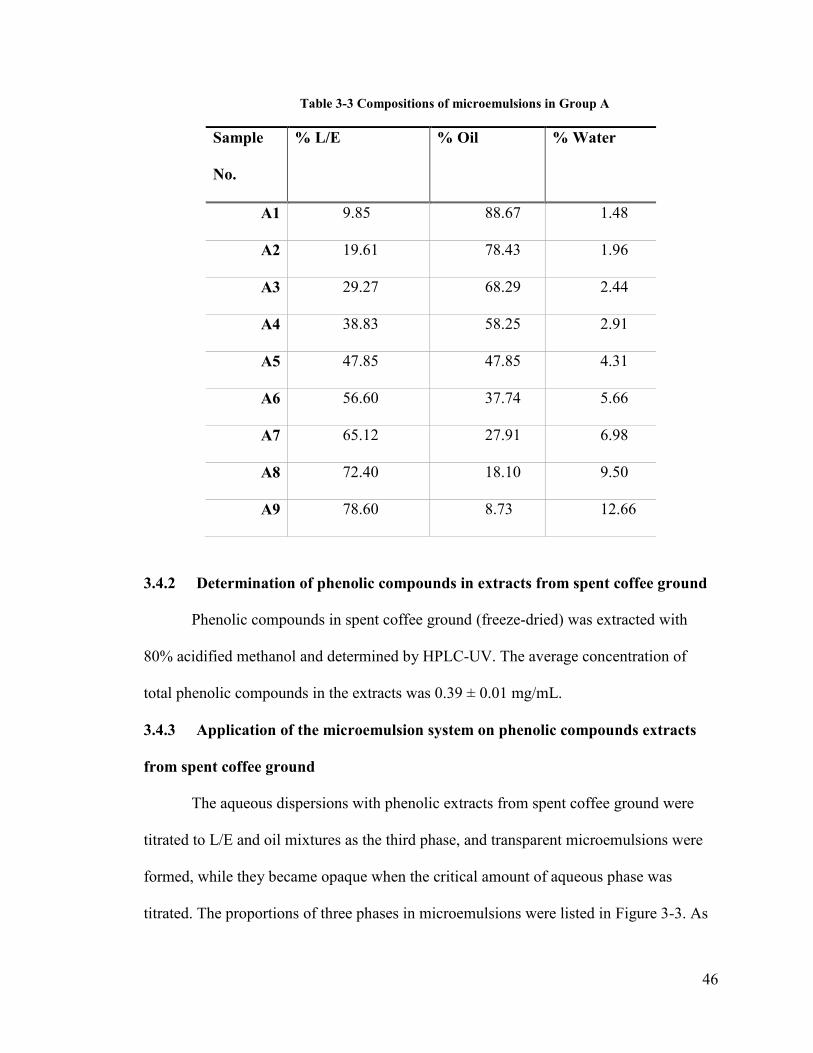
46
Table 3-3 Compositions of microemulsions in Group A
Sample
No.
% L/E % Oil % Water
A1 9.85 88.67 1.48
A2 19.61 78.43 1.96
A3 29.27 68.29 2.44
A4 38.83 58.25 2.91
A5 47.85 47.85 4.31
A6 56.60 37.74 5.66
A7 65.12 27.91 6.98
A8 72.40 18.10 9.50
A9 78.60 8.73 12.66
3.4.2 Determination of phenolic compounds in extracts from spent coffee ground
Phenolic compounds in spent coffee ground (freeze-dried) was extracted with
80% acidified methanol and determined by HPLC-UV. The average concentration of
total phenolic compounds in the extracts was 0.39 ± 0.01 mg/mL.
3.4.3 Application of the microemulsion system on phenolic compounds extracts
from spent coffee ground
The aqueous dispersions with phenolic extracts from spent coffee ground were
titrated to L/E and oil mixtures as the third phase, and transparent microemulsions were
formed, while they became opaque when the critical amount of aqueous phase was
titrated. The proportions of three phases in microemulsions were listed in Figure 3-3. As
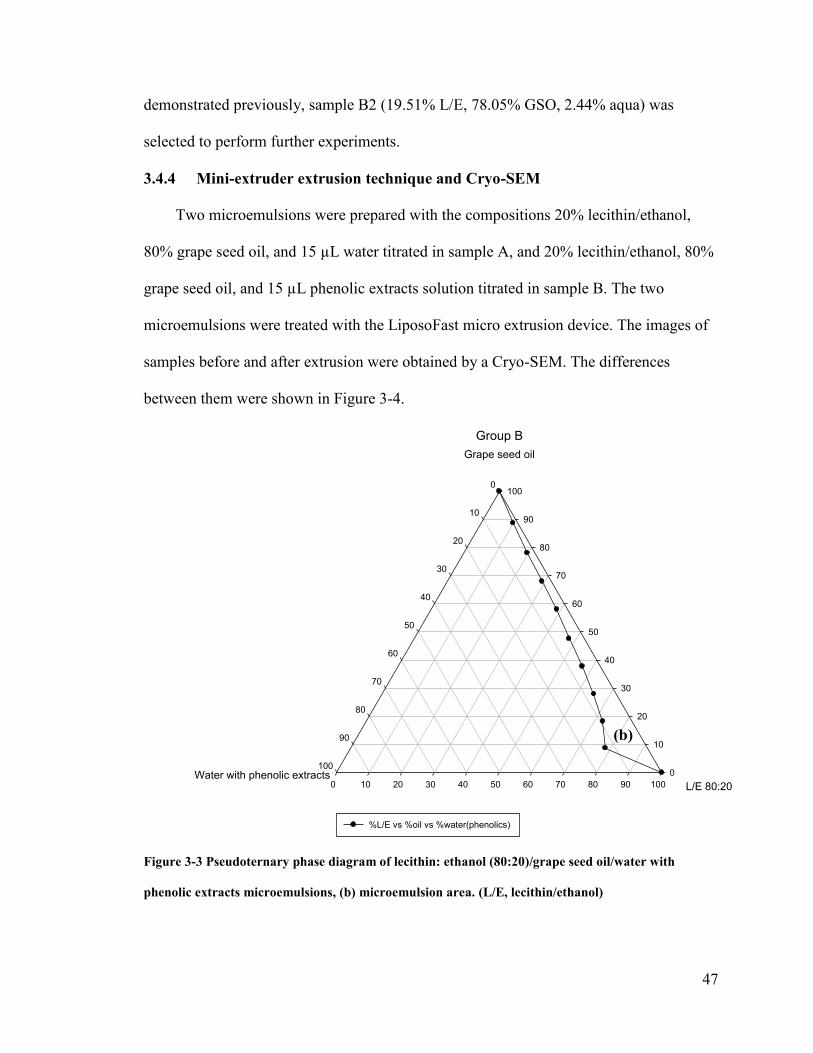
47
demonstrated previously, sample B2 (19.51% L/E, 78.05% GSO, 2.44% aqua) was
selected to perform further experiments.
3.4.4 Mini-extruder extrusion technique and Cryo-SEM
Two microemulsions were prepared with the compositions 20% lecithin/ethanol,
80% grape seed oil, and 15 µL water titrated in sample A, and 20% lecithin/ethanol, 80%
grape seed oil, and 15 µL phenolic extracts solution titrated in sample B. The two
microemulsions were treated with the LiposoFast micro extrusion device. The images of
samples before and after extrusion were obtained by a Cryo-SEM. The differences
between them were shown in Figure 3-4.
Group B
L/E 80:200 10 20 30 40 50 60 70 80 90 100
Grape seed oil
0
10
20
30
40
50
60
70
80
90
100
Water with phenolic extracts
0
10
20
30
40
50
60
70
80
90
100
%L/E vs %oil vs %water(phenolics)
Figure 3-3 Pseudoternary phase diagram of lecithin: ethanol (80:20)/grape seed oil/water with
phenolic extracts microemulsions, (b) microemulsion area. (L/E, lecithin/ethanol)
(b)
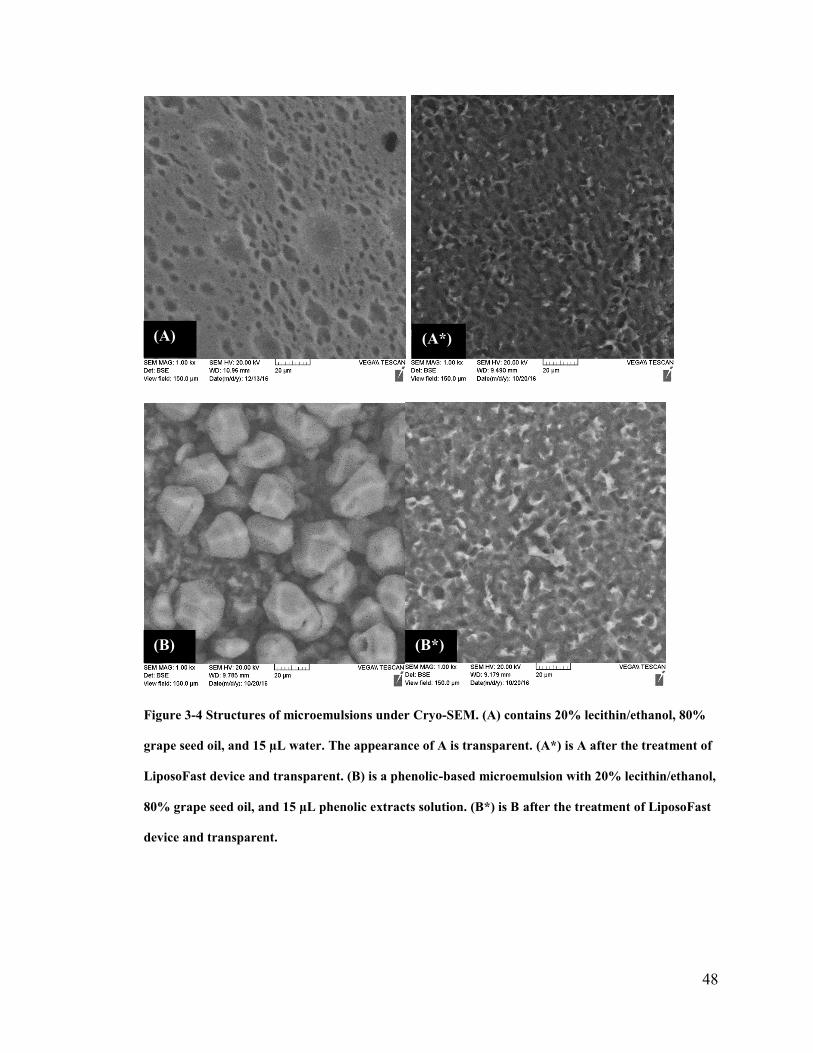
48
Figure 3-4 Structures of microemulsions under Cryo-SEM. (A) contains 20% lecithin/ethanol, 80%
grape seed oil, and 15 µL water. The appearance of A is transparent. (A*) is A after the treatment of
LiposoFast device and transparent. (B) is a phenolic-based microemulsion with 20% lecithin/ethanol,
80% grape seed oil, and 15 µL phenolic extracts solution. (B*) is B after the treatment of LiposoFast
device and transparent.
(A) (A*)
(B) (B*)
49
3.5 Discussion
In the present study, formulations of food grade microemulsion systems composed
of grape seed oil, lecithin: ethanol (80:20), and water were investigated. Based on the
pseudoternary phase diagram (Figure 3-2), the phase behavior of each formulation could
be read. The one-phase microemulsion area (area (a) and (b) in Figure 3-2, 3-3) was the
area enclosed by the phase-behavior line and the grape seed oil axis. Abbasi et al
introduced lecithin-based microemulsion systems with n-propanol as the co-surfactant. 64
It is reported that lecithin-based microemulsions are stable with a wide range of ionic
strength (0~6M) and pH (1~10.5), and the microemulsion areas increase as the
temperature rises which may indicate a higher solubilization capacity of triglycerides. 64
Comparing with n-propanol, ethanol could not be soluble with lecithin at any proportion,
but ethanol as a co-surfactant was able to lead to microemulsions with a microscale of
water added (Table 3-3).
The phenolic compounds extracts from spent coffee ground were introduced to
microemulsion systems, and the total phenolic content of each formulation was listed in
Table 3-4. Sample B9 showed the highest concentration of phenolic compounds 58.5
µg/g, and B2 had a concentration 9.75 µg/g. According to the pseudoternary phase
diagram of phenolic-additive microemulsion systems, the phase behavior of phenolic-
additive microemulsions was similar to that of original lecithin-based microemulsions,
and it indicated that the lecithin-based microemulsion systems were stable with addition
of phytochemicals such as phenolic acids. Based on Edris et al, five different
microemulsion systems were used to investigate the solubilization behavior of essential
oils including clove buds, thyme, and oregano essential oils, and results showed that
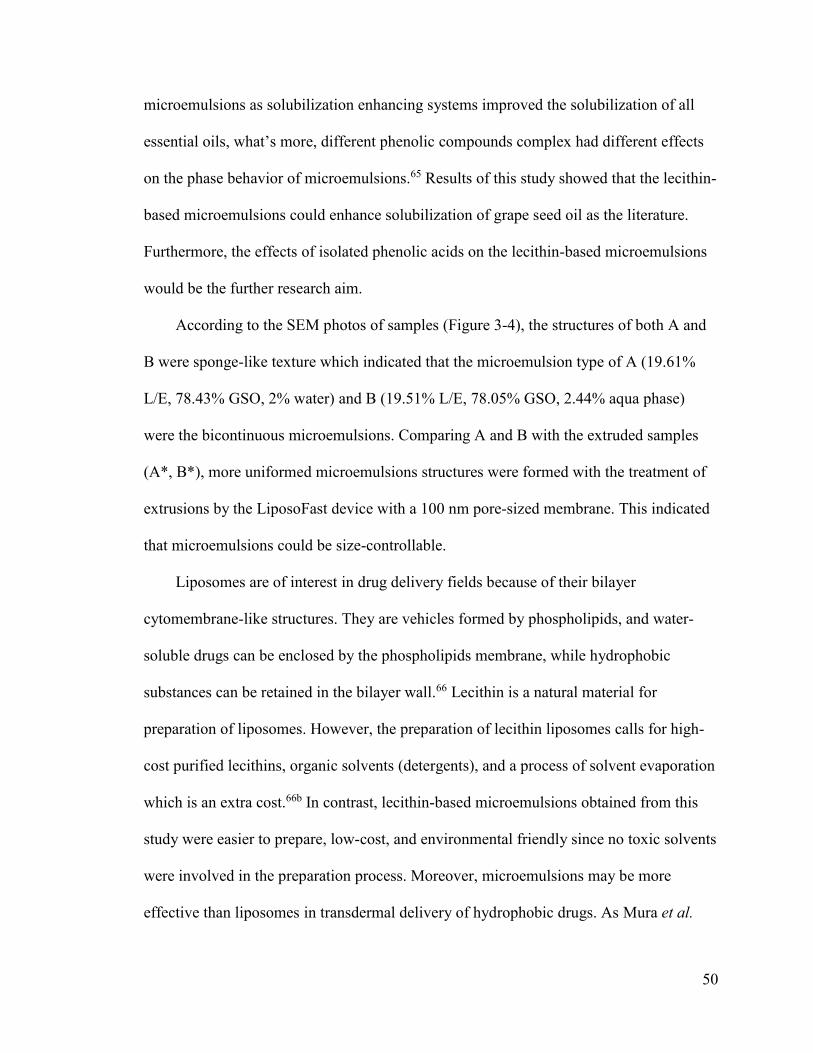
50
microemulsions as solubilization enhancing systems improved the solubilization of all
essential oils, what’s more, different phenolic compounds complex had different effects
on the phase behavior of microemulsions.65 Results of this study showed that the lecithin-
based microemulsions could enhance solubilization of grape seed oil as the literature.
Furthermore, the effects of isolated phenolic acids on the lecithin-based microemulsions
would be the further research aim.
According to the SEM photos of samples (Figure 3-4), the structures of both A and
B were sponge-like texture which indicated that the microemulsion type of A (19.61%
L/E, 78.43% GSO, 2% water) and B (19.51% L/E, 78.05% GSO, 2.44% aqua phase)
were the bicontinuous microemulsions. Comparing A and B with the extruded samples
(A*, B*), more uniformed microemulsions structures were formed with the treatment of
extrusions by the LiposoFast device with a 100 nm pore-sized membrane. This indicated
that microemulsions could be size-controllable.
Liposomes are of interest in drug delivery fields because of their bilayer
cytomembrane-like structures. They are vehicles formed by phospholipids, and water-
soluble drugs can be enclosed by the phospholipids membrane, while hydrophobic
substances can be retained in the bilayer wall.66 Lecithin is a natural material for
preparation of liposomes. However, the preparation of lecithin liposomes calls for high-
cost purified lecithins, organic solvents (detergents), and a process of solvent evaporation
which is an extra cost.66b In contrast, lecithin-based microemulsions obtained from this
study were easier to prepare, low-cost, and environmental friendly since no toxic solvents
were involved in the preparation process. Moreover, microemulsions may be more
effective than liposomes in transdermal delivery of hydrophobic drugs. As Mura et al.
51
reported, the transdermal delivery of clonazepam, a poorly water-soluble benzodiazepine,
through liposomes and microemulsions was investigated. Drug permeability studies
showed that microemulsion gels were considerably more effective than liposomal
formulations.67
Overall, the grape seed oil/lecithin: ethanol (80:20)/water microemulsion systems
were established, and they were stable with the presence of phenolic acids. Extrusion
technique was proved to be capable to uniform the microemulsions.
3.6 Conclusions
Soya lecithin, a food grade surfactant, was proved to have the ability to form
microemulsions with grape seed oil and ethanol as the co-surfactant. The optimal
surfactant: co-surfactant ratio was 80:20. Microemulsions in the novel system were stable
with the addition of phenolic compounds extracted from spent coffee ground, and the
amount of phenolic compounds in microemulsions had a range from 5.85 to 58.5 µg/g of
microemulsion. Cryo-SEM showed that the extrusion technique improved the appearance
and homogenization of the lecithin-based microemulsions. This food grade
microemulsion system could be used in many areas such as drug delivery, dietary
supplements, and cosmetics.
52
4 Chapter: General conclusions and future directions
In the present study, the JA derived inulin significantly increased the antioxidant
activity of coffee as indicated by TPC, ORAC, and DPPH assays. Phenolic compounds in
coffee were extracted with acidified methanol for quantitative and qualitative analysis by
HPLC. Results showed that the predominant antioxidant component in coffee was
chlorogenic acid, and in Jerusalem artichoke tuber was pyrogallol. MS analysis
confirmed that the inulin in the JA coffee were from the roasted JA tuber additive. As a
result, the JA coffee could be introduced to healthy diets for its high antioxidant activity
and inulin compositions. Meanwhile, the contribution of inulin to in vivo antioxidant
activity of coffee and the biochemical mechanism of that to in vitro antioxidant activity
of coffee would be of interest in future studies.
In this study, novel food grade microemulsions were successfully prepared by the
combination of grape seed oil, lecithin, ethanol, and water, among which lecithin was the
surfactant and ethanol was the co-surfactant. The lecithin-based microemulsions showed
oil solubilization enhancing effects. The lecithin-based microemulsions were stable with
the addition of phenolic compounds from spent coffee ground. The mini-extrusion
technique (LiposoFast) was proved to be an effective improvement for the preparation of
microemulsions of uniform size. Additionally, grape seed oil is rich in unsaturated fatty
acids and antioxidants, and it has many potential health benefits such as cardio-
protective, neuroprotective, anti-inflammatory, anti-carcinogenic and anti-obesity
effects62. Thus, the microemulsion system has potential applications not only in the food
industry, but also for pharmaceutics and cosmetics. Future directions would be focused

53
on the stability of the microemulsion system, such as the effects of temperature, pH, ionic
strength, and different antioxidants.
54
References
1. Kosaric, N.; Cosentino, G. P.; Wieczorek, A.; Duvnjak, Z., The Jerusalem
artichoke as an agricultural crop. Biomass 1984, 5 (1), 1-36.
2. Kays, S. J.; Nottingham, S. F., Biology and chemistry of Jerusalem artichoke:
Helianthus tuberosus L. CRC press: 2007.
3. Antonkiewicz, J.; Jasiewicz, C., The use of plants accumulating heavy metals for
detoxication of chemically polluted soils. Electron J Pol Agric Univ 2002, 5.
4. Kaur, G., Applications of inulin and oligofructose in health and nutrition. Journal
of Biosciences 2002, 27 (7), 703-714.
5. Saengkanuk, A.; Nuchadomrong, S.; Jogloy, S.; Patanothai, A.; Srijaranai, S., A
simplified spectrophotometric method for the determination of inulin in Jerusalem
artichoke (Helianthus tuberosus L.) tubers. European Food Research and
Technology 2011, 233 (4), 609-616.
6. (a) USDA, 09040, Bananas, raw; (b) USDA, 11226, Jerusalem-artichokes, raw.
7. Righetti, L.; Tassoni, A.; Bagni, N., Polyamines content in plant derived food: A
comparison between soybean and Jerusalem artichoke. Food Chemistry 2008, 111
(4), 852-856.
8. Ge, X.; Zhang, W., A shortcut to the production of high ethanol concentration
from Jerusalem artichoke tubers. Food Technology and Biotechnology 2005, 43
(3), 241.
9. Pan, L.; Sinden, M. R.; Kennedy, A. H.; Chai, H.; Watson, L. E.; Graham, T. L.;
Kinghorn, A. D., Bioactive constituents of Helianthus tuberosus (Jerusalem
artichoke). Phytochemistry Letters 2009, 2 (1), 15-18.
55
10. Roberfroid, M. B., Introducing inulin-type fructans. British Journal of Nutrition
2005, 93 (S1), S13-S25.
11. (a) Srinameb, B.-o.; Nuchadomrong, S.; Jogloy, S.; Patanothai, A.; Srijaranai, S.,
Preparation of Inulin Powder from Jerusalem Artichoke (Helianthus tuberosus L.)
Tuber. Plant Foods for Human Nutrition 2015, 70 (2), 221-226; (b)
Saengthongpinit, W.; Sajjaanantakul, T., Influence of harvest time and storage
temperature on characteristics of inulin from Jerusalem artichoke (Helianthus
tuberosus L.) tubers. Postharvest biology and technology 2005, 37 (1), 93-100.
12. López-Molina, D.; Navarro-Martínez, M. D.; Rojas-Melgarejo, F.; Hiner, A. N.
P.; Chazarra, S.; Rodríguez-López, J. N., Molecular properties and prebiotic
effect of inulin obtained from artichoke (Cynara scolymus L.). Phytochemistry
2005, 66 (12), 1476-1484.
13. Coudray, C.; Bellanger, J.; Castiglia-Delavaud, C.; Remesy, C.; Vermorel, M.;
Rayssignuier, Y., Effect of soluble or partly soluble dietary fibres
supplementation on absorption and balance of calcium, magnesium, iron and zinc
in healthy young men. Eur J Clin Nutr 1997, 51 (6), 375-80.
14. Panchev, I.; Delchev, N.; Kovacheva, D.; Slavov, A., Physicochemical
characteristics of inulins obtained from Jerusalem artichoke (Helianthus tuberosus
L.). European Food Research and Technology 2011, 233 (5), 889.
15. (a) Flamm, G.; Glinsmann, W.; Kritchevsky, D.; Prosky, L.; Roberfroid, M.,
Inulin and Oligofructose as Dietary Fiber: A Review of the Evidence. Critical
Reviews in Food Science and Nutrition 2001, 41 (5), 353-362; (b) Modler, H. W.,
56
Bifidogenic factors—sources, metabolism and applications. International Dairy
Journal 1994, 4 (5), 383-407.
16. Canbulat, Z.; Ozcan, T., Effects of Short-Chain and Long-Chain Inulin on the
Quality of Probiotic Yogurt Containing Lactobacillus rhamnosus. Journal of Food
Processing and Preservation 2015, 39 (6), 1251-1260.
17. Repository, F. C. D. Coffee.
http://www.fao.org/docrep/006/y5143e/y5143e0v.htm (accessed December 8th).
18. FAOSTAT.
19. Noguchi, K.; Matsuzaki, T.; Sakanashi, M.; Hamadate, N.; Uchida, T.; Kina-
Tanada, M.; Kubota, H.; Nakasone, J.; Sakanashi, M.; Ueda, S.; Masuzaki, H.;
Ishiuchi, S.; Ohya, Y.; Tsutsui, M., Effect of caffeine contained in a cup of coffee
on microvascular function in healthy subjects. Journal of Pharmacological
Sciences 2015, 127 (2), 217-222.
20. Yu, X.; Bao, Z.; Zou, J.; Dong, J., Coffee consumption and risk of cancers: a
meta-analysis of cohort studies. BMC Cancer 2011, 11 (1), 96.
21. Díaz-Rubio, M. E.; Saura-Calixto, F., Dietary fiber in brewed coffee. Journal of
agricultural and food chemistry 2007, 55 (5), 1999-2003.
22. Gutiérrez-Grobe, Y.; Chávez-Tapia, N.; Sánchez-Valle, V.; Gavilanes-Espinar, J.
G.; Ponciano-Rodríguez, G.; Uribe, M.; Méndez-Sánchez, N., High coffee intake
is associated with lower grade nonalcoholic fatty liver disease: the role of
peripheral antioxidant activity. Ann Hepatol 2012, 11 (3), 350-5.
23. Farah, A.; Donangelo, C. M., Phenolic compounds in coffee. Brazilian Journal of
Plant Physiology 2006, 18, 23-36.
57
24. Alasalvar, C.; Grigor, J. M.; Zhang, D.; Quantick, P. C.; Shahidi, F., Comparison
of volatiles, phenolics, sugars, antioxidant vitamins, and sensory quality of
different colored carrot varieties. Journal of agricultural and food chemistry
2001, 49 (3), 1410-1416.
25. Balasundram, N.; Sundram, K.; Samman, S., Phenolic compounds in plants and
agri-industrial by-products: Antioxidant activity, occurrence, and potential uses.
Food Chemistry 2006, 99 (1), 191-203.
26. Bravo, L., Polyphenols: chemistry, dietary sources, metabolism, and nutritional
significance. Nutrition reviews 1998, 56 (11), 317-333.
27. Pietta, P.-G., Flavonoids as Antioxidants. Journal of Natural Products 2000, 63
(7), 1035-1042.
28. Dieu Phan, T. T.; Bittová, M.; Mikulášek, K.; Kráčmar, S.; Kubáň, V.; Valášek,
P.; Svobodová, B., Content of 4 (5)-methylimidazole, caffeine and chlorogenic
acid in commercial coffee brands. Potravinarstvo 2015, 9 (1), 31-38.
29. Clifford, M., Chemical and physical aspects of green coffee and coffee products.
In Coffee, Springer: 1985; pp 305-374.
30. Perrone, D.; Farah, A.; Donangelo, C. M., Influence of coffee roasting on the
incorporation of phenolic compounds into melanoidins and their relationship with
antioxidant activity of the brew. Journal of agricultural and food chemistry 2012,
60 (17), 4265-4275.
31. Devasagayam, T.; Tilak, J.; Boloor, K.; Sane, K. S.; Ghaskadbi, S. S.; Lele, R.,
Free radicals and antioxidants in human health: current status and future
prospects. Japi 2004, 52 (794804), 4.
58
32. Sies, H., Oxidative stress. Elsevier: 2013.
33. Winterbourn, C. C., Reconciling the chemistry and biology of reactive oxygen
species. Nat Chem Biol 2008, 4 (5), 278-286.
34. Halliwell, B., Free radicals and antioxidants: updating a personal view. Nutrition
reviews 2012, 70 (5), 257-265.
35. Cao, G.; Alessio, H. M.; Cutler, R. G., Oxygen-radical absorbance capacity assay
for antioxidants. Free radical biology and medicine 1993, 14 (3), 303-311.
36. Huang, D.; Ou, B.; Hampsch-Woodill, M.; Flanagan, J. A.; Prior, R. L., High-
throughput assay of oxygen radical absorbance capacity (ORAC) using a
multichannel liquid handling system coupled with a microplate fluorescence
reader in 96-well format. Journal of agricultural and food chemistry 2002, 50
(16), 4437-4444.
37. Brand-Williams, W.; Cuvelier, M.-E.; Berset, C., Use of a free radical method to
evaluate antioxidant activity. LWT-Food science and Technology 1995, 28 (1),
25-30.
38. Singleton, V. L.; Orthofer, R.; Lamuela-Raventos, R. M., [14] Analysis of total
phenols and other oxidation substrates and antioxidants by means of folin-
ciocalteu reagent. Methods in enzymology 1999, 299, 152-178.
39. Hoar, T.; Schulman, J., Transparent water-in-oil dispersions: the oleopathic
hydro-micelle. Nature 1943, 152, 102-103.
40. Danielsson, I.; Lindman, B., The definition of microemulsion. Colloids and
Surfaces 1981, 3 (4), 391-392.
59
41. Lawrence, M. J.; Rees, G. D., Microemulsion-based media as novel drug delivery
systems. Advanced Drug Delivery Reviews 2012, 64, Supplement, 175-193.
42. Malik, M. A.; Wani, M. Y.; Hashim, M. A., Microemulsion method: A novel
route to synthesize organic and inorganic nanomaterials: 1st Nano Update.
Arabian Journal of Chemistry 2012, 5 (4), 397-417.
43. (a) Pileni, M. P.; Lisiecki, I., Nanometer metallic copper particle synthesis in
reverse micelles. Colloids and Surfaces A: Physicochemical and Engineering
Aspects 1993, 80 (1), 63-68; (b) Pillai, V.; Shah, D. O., Synthesis of high-
coercivity cobalt ferrite particles using water-in-oil microemulsions. Journal of
Magnetism and Magnetic Materials 1996, 163 (1-2), 243-248; (c) Chen, M.; Wu,
Y.; Zhou, S.; Wu, L., Shape-controllable synthesis of crystalline Ni complex
particles via AOT-based microemulsions. The Journal of Physical Chemistry B
2008, 112 (21), 6536-6541; (d) Chen, D.-H.; Chen, C.-J., Formation and
characterization of Au–Ag bimetallic nanoparticles in water-in-oil
microemulsions. Journal of Materials Chemistry 2002, 12 (5), 1557-1562.
44. Fanun, M., Microemulsions as delivery systems. Current Opinion in Colloid &
Interface Science 2012, 17 (5), 306-313.
45. Lawrence, M. J., Surfactant systems: their use in drug delivery. Chemical Society
Reviews 1994, 23 (6), 417-424.
46. Lee, V., Enzymatic barriers to peptide and protein absorption. Critical reviews in
therapeutic drug carrier systems 1987, 5 (2), 69-97.
60
47. Sarciaux, J.; Acar, L.; Sado, P., Using microemulsion formulations for oral drug
delivery of therapeutic peptides. International journal of pharmaceutics 1995,
120 (2), 127-136.
48. Gniechwitz, D.; Reichardt, N.; Ralph, J.; Blaut, M.; Steinhart, H.; Bunzel, M.,
Isolation and characterisation of a coffee melanoidin fraction. Journal of the
Science of Food and Agriculture 2008, 88 (12), 2153-2160.
49. Nunes, F. M.; Coimbra, M. A., Melanoidins from coffee infusions. Fractionation,
chemical characterization, and effect of the degree of roast. Journal of
agricultural and food chemistry 2007, 55 (10), 3967-3977.
50. Gunenc, A.; HadiNezhad, M.; Farah, I.; Hashem, A.; Hosseinian, F., Impact of
supercritical CO2 and traditional solvent extraction systems on the extractability
of alkylresorcinols, phenolic profile and their antioxidant activity in wheat bran.
Journal of Functional Foods 2015, 12, 109-119.
51. Yang, Z.; Hu, J.; Zhao, M., Isolation and quantitative determination of inulin-type
oligosaccharides in roots of Morinda officinalis. Carbohydrate polymers 2011, 83
(4), 1997-2004.
52. Coxam, V., Current data with inulin-type fructans and calcium, targeting bone
health in adults. The Journal of nutrition 2007, 137 (11), 2527S-2533S.
53. Kaur, N.; Gupta, A. K., Applications of inulin and oligofructose in health and
nutrition. Journal of Biosciences 2002, 27 (7), 703-714.
54. Delzenne, N. M.; Kok, N., Effect of non-digestible fermentable carbohydrates on
hepatic fatty-acid metabolism. Biochemical Society Transactions 1998, 26 (2),
228-230.
61
55. Takeuchi, J.; Nagashima, T., Preparation of dried chips from Jerusalem artichoke
(Helianthus tuberosus) tubers and analysis of their functional properties. Food
Chemistry 2011, 126 (3), 922-926.
56. Klier, J.; Tucker, C. J.; Kalantar, T. H.; Green, D. P., Properties and Applications
of Microemulsions. Advanced Materials 2000, 12 (23), 1751-1757.
57. Zhong, F.; Yu, M.; Luo, C.; Shoemaker, C. F.; Li, Y.; Xia, S.; Ma, J., Formation
and characterisation of mint oil/S and CS/water microemulsions. Food Chemistry
2009, 115 (2), 539-544.
58. Kahlweit, M.; Busse, G.; Faulhaber, B., Preparing microemulsions with lecithins.
Langmuir 1995, 11 (5), 1576-1583.
59. Dreher, F.; Walde, P.; Walther, P.; Wehrli, E., Interaction of a lecithin
microemulsion gel with human stratum corneum and its effect on transdermal
transport. Journal of Controlled Release 1997, 45 (2), 131-140.
60. Lin, C.-C.; Lin, H.-Y.; Chi, M.-H.; Shen, C.-M.; Chen, H.-W.; Yang, W.-J.; Lee,
M.-H., Preparation of curcumin microemulsions with food-grade soybean
oil/lecithin and their cytotoxicity on the HepG2 cell line. Food Chemistry 2014,
154, 282-290.
61. Matthäus, B., Virgin grape seed oil: Is it really a nutritional highlight? European
Journal of Lipid Science and Technology 2008, 110 (7), 645-650.
62. Davidov-Pardo, G.; McClements, D. J., Nutraceutical delivery systems:
Resveratrol encapsulation in grape seed oil nanoemulsions formed by
spontaneous emulsification. Food Chemistry 2015, 167, 205-212.
62
63. (a) Esquivel, P.; Jiménez, V. M., Functional properties of coffee and coffee by-
products. Food Research International 2012, 46 (2), 488-495; (b) Zuorro, A.;
Lavecchia, R., Spent coffee grounds as a valuable source of phenolic compounds
and bioenergy. Journal of Cleaner Production 2012, 34, 49-56.
64. Abbasi, S.; Radi, M., Food grade microemulsion systems: Canola oil/lecithin:n-
propanol/water. Food Chemistry 2016, 194, 972-979.
65. Edris, A.; Malone, C., Preferential solubilization behaviours and stability of some
phenolic‐bearing essential oils formulated in different microemulsion systems.
International journal of cosmetic science 2012, 34 (5), 441-450.
66. (a) Xi, J.; Guo, R., Interactions between flavonoids and hemoglobin in lecithin
liposomes. International Journal of Biological Macromolecules 2007, 40 (4),
305-311; (b) Takahashi, M.; Inafuku, K.-i.; Miyagi, T.; Oku, H.; Wada, K.; Imura,
T.; Kitamoto, D., Efficient Preparation of Liposomes Encapsulating Food
Materials Using Lecithins by a Mechanochemical Method. Journal of Oleo
Science 2007, 56 (1), 35-42.
67. Mura, P.; Bragagni, M.; Mennini, N.; Cirri, M.; Maestrelli, F., Development of
liposomal and microemulsion formulations for transdermal delivery of
clonazepam: effect of randomly methylated β-cyclodextrin. International journal
of pharmaceutics 2014, 475 (1), 306-314.