fund assure - tata aia lifetataaia.com/pdf/customer-service/fund-assure-june15.pdfequity fund debt...
TRANSCRIPT
Equity Fund Debt Fund Hybrid Fund
Fund Details Portfolio
Investment Report | Market Outlook | Equity | Debt | Hybrid | Contact Us
Fund Assure Investment Report, June 2015
Equity Fund Debt Fund Hybrid Fund
Fund Details Portfolio
Fund Assure, Investment Report, June 2015
IN THIS POLICY, THE INVESTMENT RISK IN INVESTMENT PORTFOLIO IS BORNE BY THE POLICYHOLDER.
Dear Friends,
The month of June 2015 saw the benchmark index BSE Sensex and CNX Nifty shed 0.2% and 0.8% respectively. The Mid-cap index, CNX Mid-cap shed 1.3% during the same period.On the global front, US GDP growth for the first quarter was revised to a negative 0.2% contraction versus growth of 2.2% in the prior quarter. While consumption was the main engine of growth, exports and investment suffered due to a strong dollar. In an unprecedented move, Greece imposed capital controls and declared bank holidays in advance of a referendum following stalemated negotiations with the ECB, EU and IMF, in an effort to avert a bank run. In the referendum, the Greek voters rejected the terms of the Euro zone’s bailout package with a convincing margin, thereby taking further negotiations into unchartered territory. While these developments have increased global risk aversion, the chances of an outright financial crisis are dim as ECB’s commitment to do “whatever it takes” has ring-fenced rest of Europe and the private sector’s exposure to Greece is far lower than 3 years ago, implying substantial de-risking. HSBC’s India manufacturing PMI fell to 51.3 in June as against 52.6 in the prior month as output and new orders weakened. The positive surprise was a down tick in inflation indicators as seen from lower input and output prices. Indian Meteorological Department (IMD) indicated that cumulative rainfall in the month of June was 16% above normal. Further comfort on the agriculture front was from robust reservoir levels which until the week-ending June 25th had been 45% above the last 10 years’ average levels and 11% over last-year levels. Kharif (summer crop) sowing as of June 26th was 23.4% higher than that registered in the same period prior year. The government increased Minimum Support Price (MSP) of summer crops by a modest 1-4% with the exception of pulses where the increase was to the tune of around 5.5-6.5% including ̀ 200/quintal bonus. The muted increase in MSPs have reiterated the intent of the government to contain food inflation, which has an overwhelming weight in the CPI inflation basket.The government, in an effort to remove persistent bottlenecks in Indian agriculture and de-risk Indian farming from the vagaries of monsoon, approved a `500 bn irrigation package and took the first step to create a national market for agricultural produce. Plans will be prepared at district and state level that will promote conservation and efficient management of water resources with a particular emphasis on precision irrigation technologies and introduce sustainable water conservation practices.The government unveiled its marquee project to give a major impetus to “Digital India”, a program whose key components are e-governance, electronics manufacturing, cyber security and financial inclusion. The ambitious program is expected to attract an investment of `4.5 tn by corporate India besides creating 18 lakh jobs. The long term objective of this program is to make India self-sufficient in electronic goods, a leader in cyber security and a hub of innovation. The current account deficit (CAD) narrowed significantly to 0.3% of the GDP (USD1.5 bn) in the fourth quarter FY 15 as compared to 1.6% of the GDP (USD 8.4 bn) in the prior quarter. The CAD shrank to 1.4% of the GDP (USD 27.9 bn) in FY2015 from 1.7% of the GDP (USD 32.4 bn) in FY2014. The capital account balance was at USD 90 bn in FY2015, the highest since FY2009, led by a surge in net foreign investments as the combined FDI and FPI flows in FY2015 reached a record high.The Consumer Price Index (CPI) inflation for May 2015 came in at 5.01%, broadly in line with the market expectation but higher than the 4.87% registered in the month of April. Wholesale Price Index (WPI) inflation in May 2015 was at a negative 2.36% compared to a negative 2.65% registered in April, the seventh straight month of negative print.CPI inflation remains the preferred inflation indicator for the RBI in shaping its monetary policy. The market watchers believe that the satisfactory progress of the south west monsoon and the policy response of the government such as the modest minimum support prices of crops as well as management of buffer stocks of cereals would help contain the trajectory of CPI inflation.We believe that the equity markets continue to offer the comfort of reasonable valuations for a long-term investor with a 3-5 year view.
Team Investment
Equity Fund Debt Fund Hybrid Fund
Fund Details Portfolio
Market Outlook - DebtFund Assure, Investment Report, June 2015
Debt market in the month of June 2015 saw the new benchmark 10 year Government security (G-sec) close the month at 7.86% levels, hardening by 22 bps. On the corporate bond side, the 10 year AAA corporate bonds closed the month at around 8.57% levels, hardening by 18bps over the month.
The foreign portfolio investors (FPIs) have been buyers in the Indian debt to the tune of USD 0.18 bn in the month of June 2015. The FPIs have bought Indian debt to the tune of USD 6.3 bn in the first six months of the calendar year 2015.
In the month of June, the Indian debt markets continued to face headwinds of a global risk off sentiment even as it was tracking the satisfactory onset as well as the progress of the monsoon. The last auction scheduled for the month of June saw a partial rejection of bids to the tune of `9,000 cr reflecting the determination of the government to borrow only at reasonable yields.
The domestic liquidity situation improved further as the three month commercial paper eased to 8% levels. The banks continue to announce marginal cuts in deposit and lending rates, thereby helping the transmission of the monetary policy into the real economy.
The minutes of the consultation with the Technical Advisory Committee of the RBI indicated that of the seven external members, four members sought a reduction of 25 bps, two members suggested a
reduction of 50 bps and one member advocated a reduction of 75 bps. The members were of the view that more monetary accommodation would support the growth process as they opined that the domestic economic activity was weak even as corporate earnings remained subdued. They noted that the growth in industrial production was muted and the investment indicators had not signaled a rebound as yet. They expressed concern that the credit growth had not shown an up- tick, manufacturing growth was muted even as exports declined.
So far, the Indian bond markets have been largely immune to the heightened global risk due to the unprecedented and chaotic developments in Greece. The INR has been particularly resilient as the RBI has built up record forex reserves which could cover imports to the tune of ten months. Improved Indian macro indicators such as benign twin deficits as well as contained inflation have provided additional comfort to the bond market investors.
The bond markets expect the front loaded rate cut in RBI’s second Bi-monthly policy to be followed by an extended pause as the RBI had limited space at this juncture to nudge the interest rates lower. There was some reason to believe that the satisfactory onset and progress of the monsoon, muted rise in MSPs of Kharif (summer) crops and the benign trajectory of the international crude oil prices would open up some space for the RBI in future.
Equity Fund Debt Fund Hybrid Fund
Fund Details Portfolio
Market Outlook - Equity Fund Assure, Investment Report, June 2015
The month of June 2015 saw the benchmark index BSE Sensex and CNX Nifty shed 0.2% and 0.8% respectively. The Mid-cap index, CNX Mid-cap shed 1.3% during the same period.
The FIIs were net sellers with outflows of around USD 0.97 bn in the month of June 2015 and the DIIs were net buyers to the tune of USD 1.8 bn with insurance companies net buyers to the tune of USD 0.3 bn and domestic mutual funds, net buyers to the tune of USD 1.5 bn. FIIs have bought Indian equities to the tune of USD 6 bn in the first six months of the calendar year even as the DIIs have been net buyers of around USD 4.2 bn in the same period, with insurance companies selling around USD 0.6 bn even as domestic mutual funds bought around USD 4.8 bn. While FII selling has reduced their over-weight in the India portfolio from 430bps to 300bps as against the MSCI benchmark EM weight over the last four months, the DII flows have remained robust during this time and have supported the equity market.
The Indian equity markets faced headwinds of a sub-par monsoon forecast, RBI’s commentary in the monetary policy indicating an extended pause in interest rates as well as global uncertainties at the start of June 2015. However, during the month, the equity markets recovered on positive cues on the monsoon front as the cumulative rainfall in the month of June has been around 16% above the long period average. Policy announcements on urbanization as well as the government’s muted increase in minimum support prices of summer crops have been additional positives.
The economic indicators at the micro level have continued to remain mixed with the high frequency indicators largely indicating weak demand albeit with some pockets of relative strength. Aggregate credit growth has been muted near its two-decade lows as banks remain risk averse. Broad consumption growth indicators remain weak despite some recent uptick in the demand for passenger cars and commercial vehicles. The capital goods segment has shown a pick up as signaled by the recent IIP data.
The Union Government launched its Smart Cities Mission for 100 cities and Atal Mission for Rejuvenation and Urban Transformation
(AMRUT) for 500 cities with outlays of `480bn and `500bn, respectively. These initiatives focus on the holistic development of core infrastructure services, efficient urban mobility & public transportation, health & education in a backdrop of a sustainable urban environment.
RBI’s Financial Stability Report highlighted its concern regarding the corporate sector’s ability to service existing high levels of debt and its impact on monetary policy transmission. The report noted that the total stressed assets in the banking system inched up in FY15 to reach 11.1% with the stress mainly residing in the books of PSU banks, where an overall 13.5% of total advances are classified as stressed assets as compared to a modest 4.6% for private sector banks.
In a significant move to address the asset quality issues, the RBI approved the Strategic Debt Restructuring (SDR) scheme, which empowers banks to initiate recovery, take management control and change promoters if they so desire. The SDR is expected to tilt the balance in favour of the banks as they can now be more aggressive while tackling chronic NPL cases and enable relatively faster resolution.
The Finance Minister initiated the formation of a committee to facilitate GST implementation which would monitor progress of IT preparedness of tax authorities and drafting of laws and rules for GST. There was another committee constituted to recommend possible tax rates under GST under various scenarios of economic growth & compliance levels.
Indian parliament’s monsoon session will commence on 21st July and conclude on 13th August. This session is crucial for market sentiment as it is hoping for passage of the GST bill. In addition, the market would like to see a concrete plan from the government to adequately capitalize the state owned banks to ensure sufficient funds for the productive sectors of the economy. However, we believe that the equity markets continue to offer comfort of reasonable valuations for a long-term investor with a 3-5 year view
Equity Fund Debt Fund Hybrid Fund
Fund Details Portfolio
Fund Assure, Investment Report, June 2015
PensionIncome FundEquity Fund Large Cap Equity Fund
Infrastructure Fund
Super Select Equity Fund
Super Select Equity Pension Fund
Select Equity Fund
Future Select Equity Fund Top 50 Fund Top 200 Fund
Future Equity Pension Fund
Whole Life Mid Cap Equity Fund

Equity Fund Debt Fund Hybrid Fund
Fund Details Portfolio
Instrument Industry/Rating % Of NAVEquity 98.63
Infosys Technologies Ltd. IT - Software 8.23
HDFC Bank Ltd. Banks 7.62
Larsen and Toubro Ltd. Capital Goods-Non Electrical 6.49
Tata Consultancy Services Ltd. IT - Software 6.26
ICICI Bank Ltd. Banks 5.63
Reliance Industries Ltd. Refineries 5.62
ITC Ltd. Tobacco Products 5.22
Axis Bank Ltd. Banks 5.13
Tata Motors Ltd. Automobile 4.71
Sun Pharmaceuticals Industries Ltd. Pharmaceuticals 4.49
Maruti Suzuki India Ltd. Automobile 3.05
State Bank of India Banks 2.94
Oil and Natural Gas Corpn Ltd. Crude Oil & Natural Gas 2.69
Mahindra and Mahindra Ltd. Automobile 2.53
Coal India Ltd Mining & Mineral Products 2.52
Other Equity 25.50
Unit Funds 0.80
ICICI Prudential Liquid - Direct Plan - Growth 0.62
Birla Sun Life Cash Plus - Growth - Direct Plan 0.18
Cash Bank & Others 0.57
Total 100.00
Fund Performance Sector Allocation Asset Allocation
0.57%
0.80%
11.28%
2.85%
3.06%
3.13%
5.22%
6.38%
6.99%
7.88%
13.30%
15.48%
23.06%
0.00% 6.00% 12.00% 18.00% 24.00% 30.00%
Cash Bank & Others
Unit Funds
Others
Telecomm-Service
Mining & Mineral Products
Crude Oil & Natural Gas
Tobacco Products
Refineries
Capital Goods-Non Electrical
Pharmaceuticals
Automobile
IT - Software
Banks
98.63%
0.80%0.57%
Equity
Unit Funds
Cash Bank & Others
Note : The investment income and prices may go down as well as up.“Since Inception” and returns above “1 Year” are calculated as per CAGR.
Last 3 Months 31-Mar-15 49.9858 27957.49 -0.91% -0.63%
Last 6 Months 31-Dec-14 48.3973 27499.42 2.34% 1.02%
Last 1 Year 30-Jun-14 44.8646 25413.78 10.40% 9.31%
Last 2 Years 28-Jun-13 33.9572 19395.81 20.77% 19.68%
Last 3 Years 29-Jun-12 30.2869 17429.98 17.82% 16.81%
Last 4 Years 30-Jun-11 33.3737 18845.87 10.37% 10.19%
Last 5 Years 30-Jun-10 31.3934 17700.90 9.55% 9.43%
Since Inception 02-Mar-04 10.0000 5823.17 15.16% 14.78%
PERIOD DATE NAV S&P BSE Sensex
NAVChange
INDEXChange
Investment Objective : The primary investment objective of the Fund is to generate long term capital appreciation from a portfolio that is invested predominantly in equity and equity linked securities
NAV as on 30 June, 15 : `49.5319
Benchmark : S&P BSE Sensex - 100%
Corpus as on 30 June, 15 : `1,751.65 Crs.
Investment Style
Investment Style
Value Blend Growth SizeLarge
Mid
Small
Equity FundULIF 001 04/02/04 TEL 110Fund Assure, Investment Report, June 2015
Equity Fund Debt Fund Hybrid Fund
Fund Details Portfolio
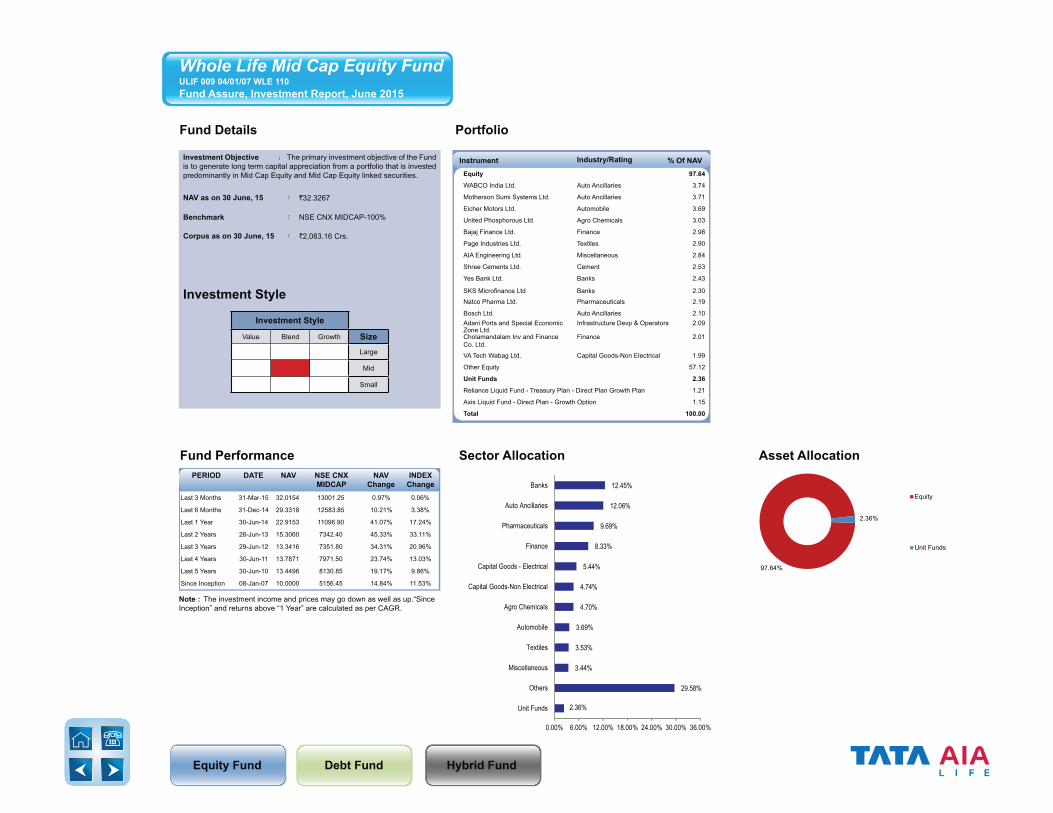
Instrument Industry/Rating % Of NAVInvestment Objective : The primary investment objective of the Fund is to generate long term capital appreciation from a portfolio that is invested predominantly in Mid Cap Equity and Mid Cap Equity linked securities.
NAV as on 30 June, 15 : `32.3267
Benchmark : NSE CNX MIDCAP-100%
Corpus as on 30 June, 15 : `2,083.16 Crs.
Investment Style
Investment Style
Value Blend Growth SizeLarge
Mid
Small
Fund Performance Sector Allocation Asset Allocation
2.36%
29.58%
3.44%
3.53%
3.69%
4.70%
4.74%
5.44%
8.33%
9.69%
12.06%
12.45%
0.00% 6.00% 12.00% 18.00% 24.00% 30.00% 36.00%
Unit Funds
Others
Miscellaneous
Textiles
Automobile
Agro Chemicals
Capital Goods-Non Electrical
Capital Goods - Electrical
Finance
Pharmaceuticals
Auto Ancillaries
Banks
97.64%
2.36%
Equity
Unit Funds
Note : The investment income and prices may go down as well as up.“Since Inception” and returns above “1 Year” are calculated as per CAGR.
Last 3 Months 31-Mar-15 32.0154 13001.25 0.97% 0.06%
Last 6 Months 31-Dec-14 29.3318 12583.85 10.21% 3.38%
Last 1 Year 30-Jun-14 22.9153 11096.90 41.07% 17.24%
Last 2 Years 28-Jun-13 15.3060 7342.40 45.33% 33.11%
Last 3 Years 29-Jun-12 13.3416 7351.80 34.31% 20.96%
Last 4 Years 30-Jun-11 13.7871 7971.50 23.74% 13.03%
Last 5 Years 30-Jun-10 13.4496 8130.85 19.17% 9.86%
Since Inception 08-Jan-07 10.0000 5156.45 14.84% 11.53%
PERIOD DATE NAV NSE CNX MIDCAP
NAVChange
INDEXChange
Whole Life Mid Cap Equity FundULIF 009 04/01/07 WLE 110Fund Assure, Investment Report, June 2015
Equity 97.64
WABCO India Ltd. Auto Ancillaries 3.74
Motherson Sumi Systems Ltd. Auto Ancillaries 3.71
Eicher Motors Ltd. Automobile 3.69
United Phosphorous Ltd. Agro Chemicals 3.03
Bajaj Finance Ltd. Finance 2.98
Page Industries Ltd. Textiles 2.90
AIA Engineering Ltd. Miscellaneous 2.84
Shree Cements Ltd. Cement 2.53
Yes Bank Ltd. Banks 2.43
SKS Microfinance Ltd Banks 2.30
Natco Pharma Ltd. Pharmaceuticals 2.19
Bosch Ltd. Auto Ancillaries 2.10Adani Ports and Special Economic Zone Ltd.
Infrastructure Devp & Operators 2.09
Cholamandalam Inv and Finance Co. Ltd.
Finance 2.01
VA Tech Wabag Ltd. Capital Goods-Non Electrical 1.99
Other Equity 57.12
Unit Funds 2.36
Reliance Liquid Fund - Treasury Plan - Direct Plan Growth Plan 1.21
Axis Liquid Fund - Direct Plan - Growth Option 1.15
Total 100.00
Equity Fund Debt Fund Hybrid Fund
Fund Details Portfolio
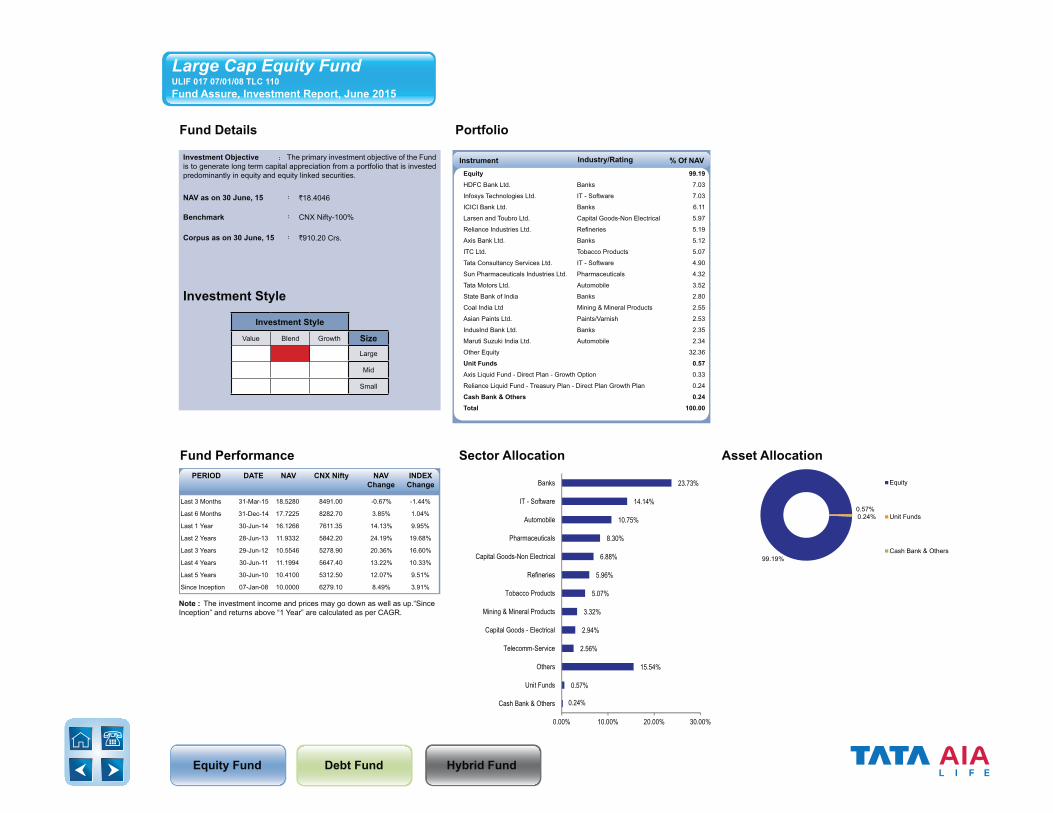
0.24%
0.57%
15.54%
2.56%
2.94%
3.32%
5.07%
5.96%
6.88%
8.30%
10.75%
14.14%
23.73%
0.00% 10.00% 20.00% 30.00%
Cash Bank & Others
Unit Funds
Others
Telecomm-Service
Capital Goods - Electrical
Mining & Mineral Products
Tobacco Products
Refineries
Capital Goods-Non Electrical
Pharmaceuticals
Automobile
IT - Software
Banks
99.19%
0.57%0.24%
Equity
Unit Funds
Cash Bank & Others
Instrument Industry/Rating % Of NAVInvestment Objective : The primary investment objective of the Fund is to generate long term capital appreciation from a portfolio that is invested predominantly in equity and equity linked securities.
NAV as on 30 June, 15 : `18.4046
Benchmark : CNX Nifty-100%
Corpus as on 30 June, 15 : `910.20 Crs.
Investment Style
Investment Style
Value Blend Growth SizeLarge
Mid
Small
Fund Performance Sector Allocation Asset Allocation
Note : The investment income and prices may go down as well as up.“Since Inception” and returns above “1 Year” are calculated as per CAGR.
Last 3 Months 31-Mar-15 18.5280 8491.00 -0.67% -1.44%
Last 6 Months 31-Dec-14 17.7225 8282.70 3.85% 1.04%
Last 1 Year 30-Jun-14 16.1266 7611.35 14.13% 9.95%
Last 2 Years 28-Jun-13 11.9332 5842.20 24.19% 19.68%
Last 3 Years 29-Jun-12 10.5546 5278.90 20.36% 16.60%
Last 4 Years 30-Jun-11 11.1994 5647.40 13.22% 10.33%
Last 5 Years 30-Jun-10 10.4100 5312.50 12.07% 9.51%
Since Inception 07-Jan-08 10.0000 6279.10 8.49% 3.91%
PERIOD DATE NAV CNX Nifty NAVChange
INDEXChange
Large Cap Equity FundULIF 017 07/01/08 TLC 110Fund Assure, Investment Report, June 2015
Equity 99.19HDFC Bank Ltd. Banks 7.03
Infosys Technologies Ltd. IT - Software 7.03
ICICI Bank Ltd. Banks 6.11
Larsen and Toubro Ltd. Capital Goods-Non Electrical 5.97
Reliance Industries Ltd. Refineries 5.19
Axis Bank Ltd. Banks 5.12
ITC Ltd. Tobacco Products 5.07
Tata Consultancy Services Ltd. IT - Software 4.90
Sun Pharmaceuticals Industries Ltd. Pharmaceuticals 4.32
Tata Motors Ltd. Automobile 3.52
State Bank of India Banks 2.80
Coal India Ltd Mining & Mineral Products 2.55
Asian Paints Ltd. Paints/Varnish 2.53
IndusInd Bank Ltd. Banks 2.35
Maruti Suzuki India Ltd. Automobile 2.34
Other Equity 32.36
Unit Funds 0.57Axis Liquid Fund - Direct Plan - Growth Option 0.33
Reliance Liquid Fund - Treasury Plan - Direct Plan Growth Plan 0.24
Cash Bank & Others 0.24Total 100.00
Equity Fund Debt Fund Hybrid Fund
Fund Details Portfolio
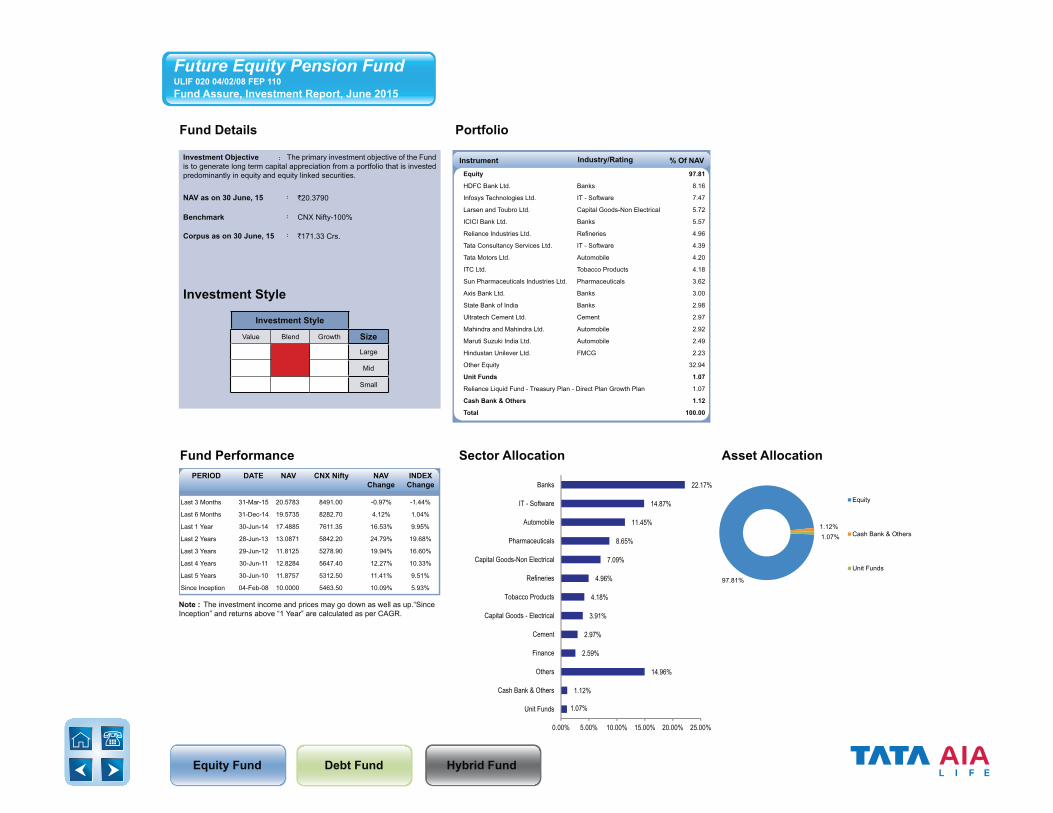
Instrument Industry/Rating % Of NAVInvestment Objective : The primary investment objective of the Fund is to generate long term capital appreciation from a portfolio that is invested predominantly in equity and equity linked securities.
NAV as on 30 June, 15 : `20.3790
Benchmark : CNX Nifty-100%
Corpus as on 30 June, 15 : `171.33 Crs.
Investment Style
Investment Style
Value Blend Growth SizeLarge
Mid
Small
Fund Performance Sector Allocation Asset Allocation
Note : The investment income and prices may go down as well as up.“Since Inception” and returns above “1 Year” are calculated as per CAGR.
Last 3 Months 31-Mar-15 20.5783 8491.00 -0.97% -1.44%
Last 6 Months 31-Dec-14 19.5735 8282.70 4.12% 1.04%
Last 1 Year 30-Jun-14 17.4885 7611.35 16.53% 9.95%
Last 2 Years 28-Jun-13 13.0871 5842.20 24.79% 19.68%
Last 3 Years 29-Jun-12 11.8125 5278.90 19.94% 16.60%
Last 4 Years 30-Jun-11 12.8284 5647.40 12.27% 10.33%
Last 5 Years 30-Jun-10 11.8757 5312.50 11.41% 9.51%
Since Inception 04-Feb-08 10.0000 5463.50 10.09% 5.93%
PERIOD DATE NAV CNX Nifty NAVChange
INDEXChange
Future Equity Pension FundULIF 020 04/02/08 FEP 110Fund Assure, Investment Report, June 2015
1.07%
1.12%
14.96%
2.59%
2.97%
3.91%
4.18%
4.96%
7.09%
8.65%
11.45%
14.87%
22.17%
0.00% 5.00% 10.00% 15.00% 20.00% 25.00%
Unit Funds
Cash Bank & Others
Others
Finance
Cement
Capital Goods - Electrical
Tobacco Products
Refineries
Capital Goods-Non Electrical
Pharmaceuticals
Automobile
IT - Software
Banks
97.81%
1.12%1.07%
Equity
Cash Bank & Others
Unit Funds
Equity 97.81
HDFC Bank Ltd. Banks 8.16
Infosys Technologies Ltd. IT - Software 7.47
Larsen and Toubro Ltd. Capital Goods-Non Electrical 5.72
ICICI Bank Ltd. Banks 5.57
Reliance Industries Ltd. Refineries 4.96
Tata Consultancy Services Ltd. IT - Software 4.39
Tata Motors Ltd. Automobile 4.20
ITC Ltd. Tobacco Products 4.18
Sun Pharmaceuticals Industries Ltd. Pharmaceuticals 3.62
Axis Bank Ltd. Banks 3.00
State Bank of India Banks 2.98
Ultratech Cement Ltd. Cement 2.97
Mahindra and Mahindra Ltd. Automobile 2.92
Maruti Suzuki India Ltd. Automobile 2.49
Hindustan Unilever Ltd. FMCG 2.23
Other Equity 32.94
Unit Funds 1.07
Reliance Liquid Fund - Treasury Plan - Direct Plan Growth Plan 1.07
Cash Bank & Others 1.12
Total 100.00
Equity Fund Debt Fund Hybrid Fund
Fund Details Portfolio
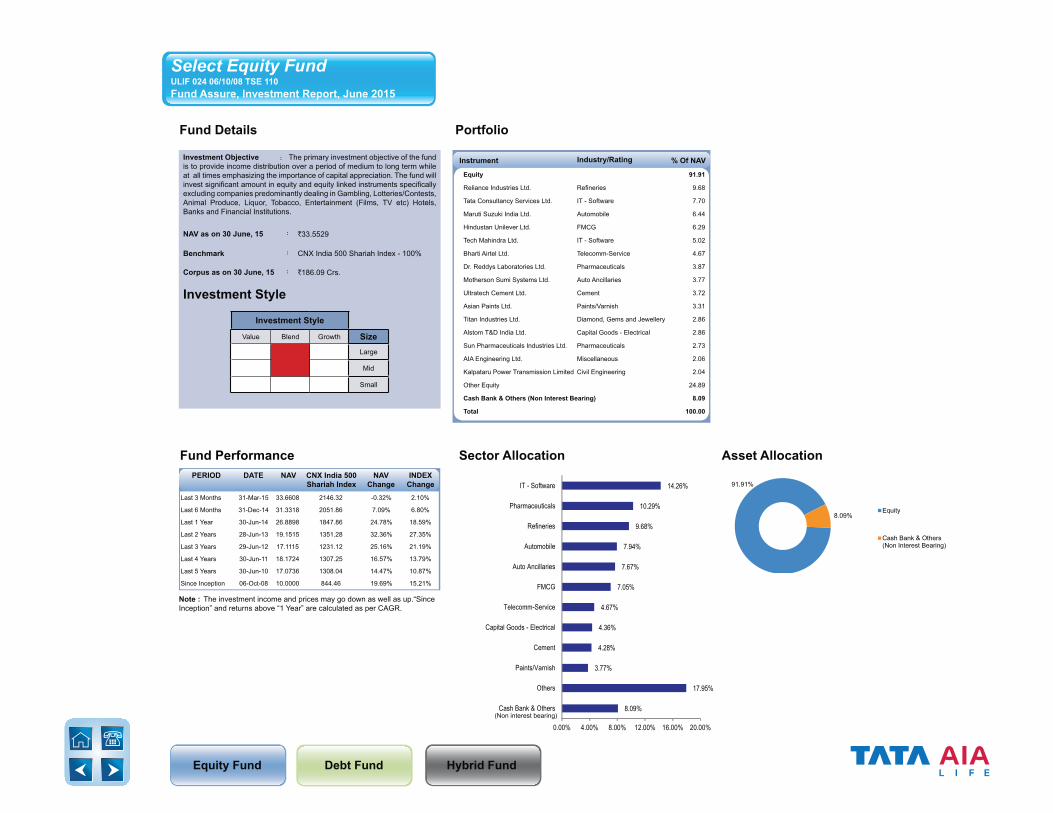
Fund Performance Sector Allocation Asset Allocation
8.09%
17.95%
3.77%
4.28%
4.36%
4.67%
7.05%
7.67%
7.94%
9.68%
10.29%
14.26%
0.00% 4.00% 8.00% 12.00% 16.00% 20.00%
Cash Bank & Others
Others
Paints/Varnish
Cement
Capital Goods - Electrical
Telecomm-Service
FMCG
Auto Ancillaries
Automobile
Refineries
Pharmaceuticals
IT - Software 91.91%
8.09%Equity
Cash Bank & Others(Non Interest Bearing)
Note : The investment income and prices may go down as well as up.“Since Inception” and returns above “1 Year” are calculated as per CAGR.
Last 3 Months 31-Mar-15 33.6608 2146.32 -0.32% 2.10%
Last 6 Months 31-Dec-14 31.3318 2051.86 7.09% 6.80%
Last 1 Year 30-Jun-14 26.8898 1847.86 24.78% 18.59%
Last 2 Years 28-Jun-13 19.1515 1351.28 32.36% 27.35%
Last 3 Years 29-Jun-12 17.1115 1231.12 25.16% 21.19%
Last 4 Years 30-Jun-11 18.1724 1307.25 16.57% 13.79%
Last 5 Years 30-Jun-10 17.0736 1308.04 14.47% 10.87%
Since Inception 06-Oct-08 10.0000 844.46 19.69% 15.21%
PERIOD DATE NAV CNX India 500 Shariah Index
NAVChange
INDEXChange
Instrument Industry/Rating % Of NAVInvestment Objective : The primary investment objective of the fund is to provide income distribution over a period of medium to long term while at all times emphasizing the importance of capital appreciation. The fund will invest significant amount in equity and equity linked instruments specifically excluding companies predominantly dealing in Gambling, Lotteries/Contests, Animal Produce, Liquor, Tobacco, Entertainment (Films, TV etc) Hotels, Banks and Financial Institutions.
NAV as on 30 June, 15 : `33.5529
Benchmark : CNX India 500 Shariah Index - 100%
Corpus as on 30 June, 15 : `186.09 Crs.
Investment Style
Investment Style
Value Blend Growth SizeLarge
Mid
Small
Select Equity FundULIF 024 06/10/08 TSE 110Fund Assure, Investment Report, June 2015
Equity 91.91
Reliance Industries Ltd. Refineries 9.68
Tata Consultancy Services Ltd. IT - Software 7.70
Maruti Suzuki India Ltd. Automobile 6.44
Hindustan Unilever Ltd. FMCG 6.29
Tech Mahindra Ltd. IT - Software 5.02
Bharti Airtel Ltd. Telecomm-Service 4.67
Dr. Reddys Laboratories Ltd. Pharmaceuticals 3.87
Motherson Sumi Systems Ltd. Auto Ancillaries 3.77
Ultratech Cement Ltd. Cement 3.72
Asian Paints Ltd. Paints/Varnish 3.31
Titan Industries Ltd. Diamond, Gems and Jewellery 2.86
Alstom T&D India Ltd. Capital Goods - Electrical 2.86
Sun Pharmaceuticals Industries Ltd. Pharmaceuticals 2.73
AIA Engineering Ltd. Miscellaneous 2.06
Kalpataru Power Transmission Limited Civil Engineering 2.04
Other Equity 24.89
Cash Bank & Others (Non Interest Bearing) 8.09
Total 100.00
(Non interest bearing)
Equity Fund Debt Fund Hybrid Fund
Fund Details Portfolio
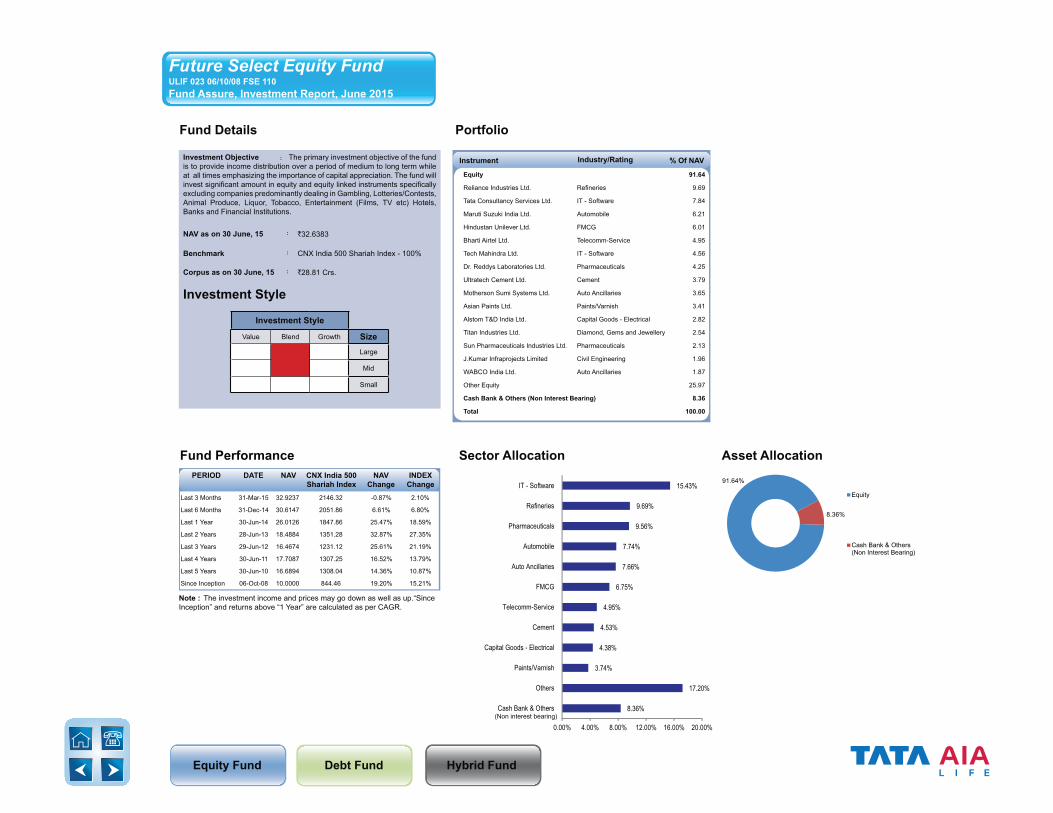
Instrument Industry/Rating % Of NAVInvestment Objective : The primary investment objective of the fund is to provide income distribution over a period of medium to long term while at all times emphasizing the importance of capital appreciation. The fund will invest significant amount in equity and equity linked instruments specifically excluding companies predominantly dealing in Gambling, Lotteries/Contests, Animal Produce, Liquor, Tobacco, Entertainment (Films, TV etc) Hotels, Banks and Financial Institutions.
NAV as on 30 June, 15 : `32.6383
Benchmark : CNX India 500 Shariah Index - 100%
Corpus as on 30 June, 15 : `28.81 Crs.
Investment Style
Investment Style
Value Blend Growth SizeLarge
Mid
Small
Fund Performance Sector Allocation Asset Allocation
8.36%
17.20%
3.74%
4.38%
4.53%
4.95%
6.75%
7.66%
7.74%
9.56%
9.69%
15.43%
0.00% 4.00% 8.00% 12.00% 16.00% 20.00%
Cash Bank & Others
Others
Paints/Varnish
Capital Goods - Electrical
Cement
Telecomm-Service
FMCG
Auto Ancillaries
Automobile
Pharmaceuticals
Refineries
IT - Software 91.64%
8.36%
Equity
Cash Bank & Others(Non Interest Bearing)
Note : The investment income and prices may go down as well as up.“Since Inception” and returns above “1 Year” are calculated as per CAGR.
Last 3 Months 31-Mar-15 32.9237 2146.32 -0.87% 2.10%
Last 6 Months 31-Dec-14 30.6147 2051.86 6.61% 6.80%
Last 1 Year 30-Jun-14 26.0126 1847.86 25.47% 18.59%
Last 2 Years 28-Jun-13 18.4884 1351.28 32.87% 27.35%
Last 3 Years 29-Jun-12 16.4674 1231.12 25.61% 21.19%
Last 4 Years 30-Jun-11 17.7087 1307.25 16.52% 13.79%
Last 5 Years 30-Jun-10 16.6894 1308.04 14.36% 10.87%
Since Inception 06-Oct-08 10.0000 844.46 19.20% 15.21%
PERIOD DATE NAV CNX India 500 Shariah Index
NAVChange
INDEXChange
Future Select Equity FundULIF 023 06/10/08 FSE 110Fund Assure, Investment Report, June 2015
(Non interest bearing)
Equity 91.64
Reliance Industries Ltd. Refineries 9.69
Tata Consultancy Services Ltd. IT - Software 7.84
Maruti Suzuki India Ltd. Automobile 6.21
Hindustan Unilever Ltd. FMCG 6.01
Bharti Airtel Ltd. Telecomm-Service 4.95
Tech Mahindra Ltd. IT - Software 4.56
Dr. Reddys Laboratories Ltd. Pharmaceuticals 4.25
Ultratech Cement Ltd. Cement 3.79
Motherson Sumi Systems Ltd. Auto Ancillaries 3.65
Asian Paints Ltd. Paints/Varnish 3.41
Alstom T&D India Ltd. Capital Goods - Electrical 2.82
Titan Industries Ltd. Diamond, Gems and Jewellery 2.54
Sun Pharmaceuticals Industries Ltd. Pharmaceuticals 2.13
J.Kumar Infraprojects Limited Civil Engineering 1.96
WABCO India Ltd. Auto Ancillaries 1.87
Other Equity 25.97
Cash Bank & Others (Non Interest Bearing) 8.36
Total 100.00
Equity Fund Debt Fund Hybrid Fund
Fund Details Portfolio
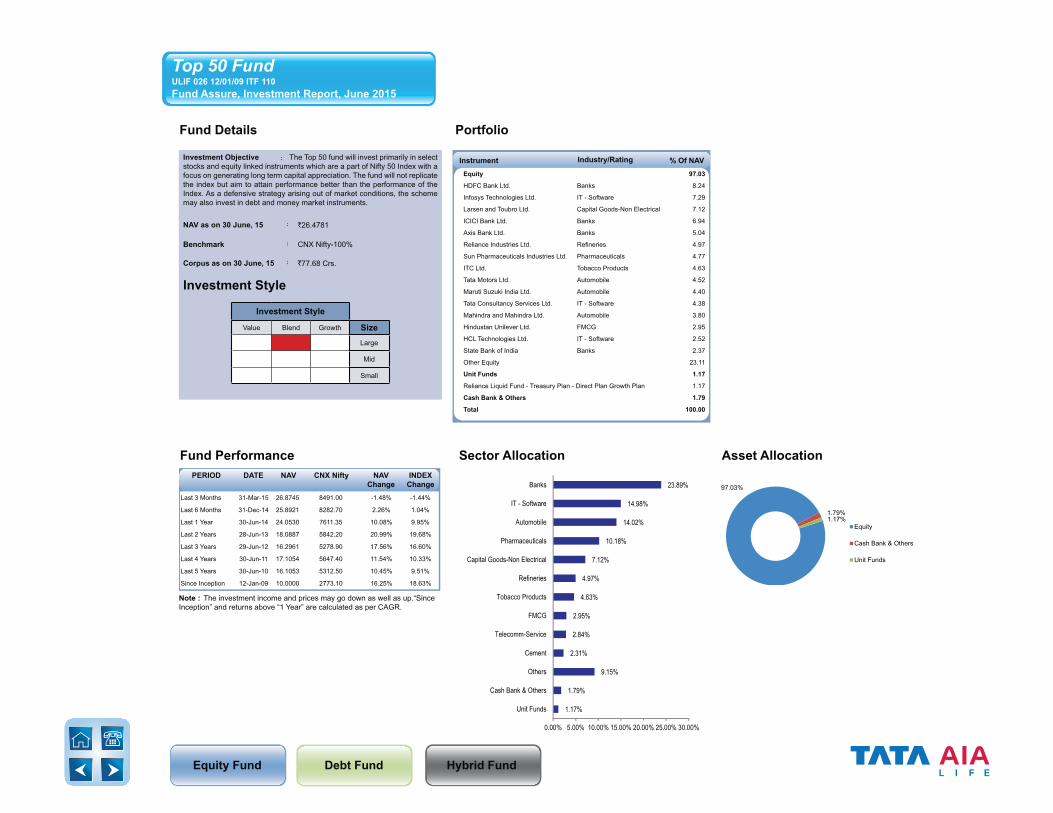
Instrument Industry/Rating % Of NAVInvestment Objective : The Top 50 fund will invest primarily in select stocks and equity linked instruments which are a part of Nifty 50 Index with a focus on generating long term capital appreciation. The fund will not replicate the index but aim to attain performance better than the performance of the Index. As a defensive strategy arising out of market conditions, the scheme may also invest in debt and money market instruments.
NAV as on 30 June, 15 : `26.4781
Benchmark : CNX Nifty-100%
Corpus as on 30 June, 15 : `77.68 Crs.
Investment Style
Investment Style
Value Blend Growth SizeLarge
Mid
Small
Fund Performance Sector Allocation Asset Allocation
1.17%
1.79%
9.15%
2.31%
2.84%
2.95%
4.63%
4.97%
7.12%
10.18%
14.02%
14.98%
23.89%
0.00% 5.00% 10.00% 15.00% 20.00% 25.00% 30.00%
Unit Funds
Cash Bank & Others
Others
Cement
Telecomm-Service
FMCG
Tobacco Products
Refineries
Capital Goods-Non Electrical
Pharmaceuticals
Automobile
IT - Software
Banks 97.03%
1.79%1.17%
Equity
Cash Bank & Others
Unit Funds
Note : The investment income and prices may go down as well as up.“Since Inception” and returns above “1 Year” are calculated as per CAGR.
Last 3 Months 31-Mar-15 26.8745 8491.00 -1.48% -1.44%
Last 6 Months 31-Dec-14 25.8921 8282.70 2.26% 1.04%
Last 1 Year 30-Jun-14 24.0530 7611.35 10.08% 9.95%
Last 2 Years 28-Jun-13 18.0887 5842.20 20.99% 19.68%
Last 3 Years 29-Jun-12 16.2961 5278.90 17.56% 16.60%
Last 4 Years 30-Jun-11 17.1054 5647.40 11.54% 10.33%
Last 5 Years 30-Jun-10 16.1053 5312.50 10.45% 9.51%
Since Inception 12-Jan-09 10.0000 2773.10 16.25% 18.63%
PERIOD DATE NAV CNX Nifty NAVChange
INDEXChange
Top 50 FundULIF 026 12/01/09 ITF 110Fund Assure, Investment Report, June 2015
Equity 97.03
HDFC Bank Ltd. Banks 8.24
Infosys Technologies Ltd. IT - Software 7.29
Larsen and Toubro Ltd. Capital Goods-Non Electrical 7.12
ICICI Bank Ltd. Banks 6.94
Axis Bank Ltd. Banks 5.04
Reliance Industries Ltd. Refineries 4.97
Sun Pharmaceuticals Industries Ltd. Pharmaceuticals 4.77
ITC Ltd. Tobacco Products 4.63
Tata Motors Ltd. Automobile 4.52
Maruti Suzuki India Ltd. Automobile 4.40
Tata Consultancy Services Ltd. IT - Software 4.38
Mahindra and Mahindra Ltd. Automobile 3.80
Hindustan Unilever Ltd. FMCG 2.95
HCL Technologies Ltd. IT - Software 2.52
State Bank of India Banks 2.37
Other Equity 23.11
Unit Funds 1.17
Reliance Liquid Fund - Treasury Plan - Direct Plan Growth Plan 1.17
Cash Bank & Others 1.79
Total 100.00
Equity Fund Debt Fund Hybrid Fund
Fund Details Portfolio
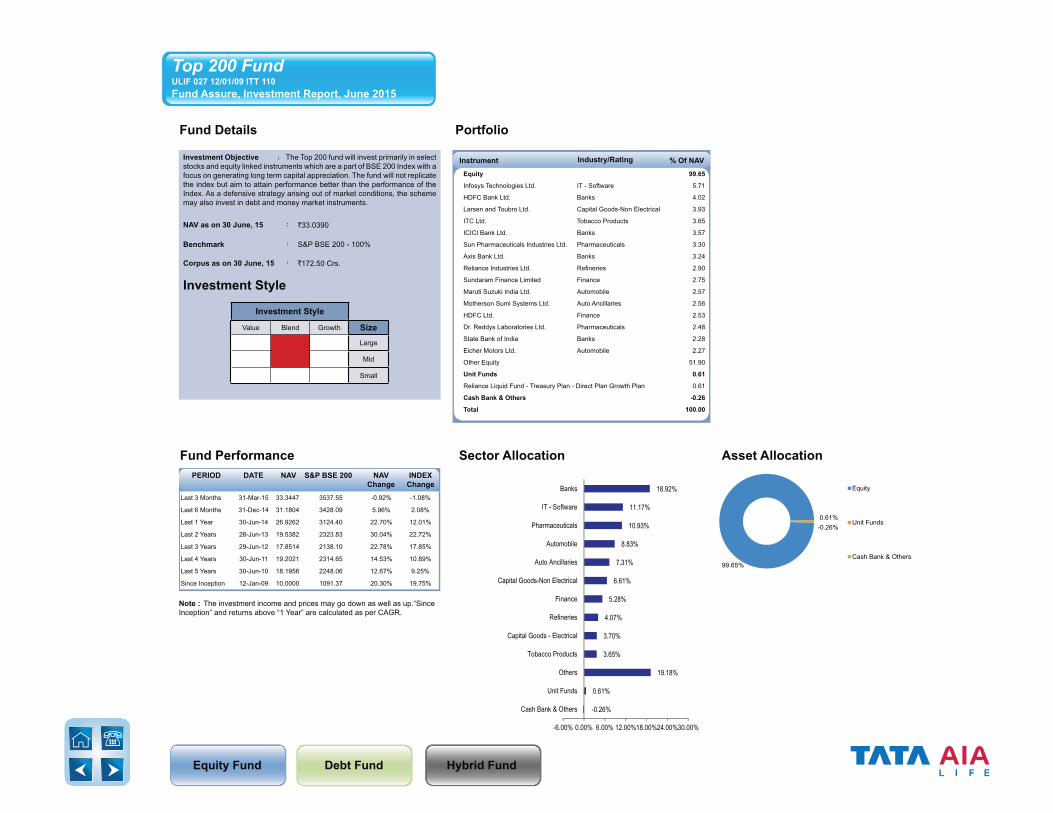
Instrument Industry/Rating % Of NAVInvestment Objective : The Top 200 fund will invest primarily in select stocks and equity linked instruments which are a part of BSE 200 Index with a focus on generating long term capital appreciation. The fund will not replicate the index but aim to attain performance better than the performance of the Index. As a defensive strategy arising out of market conditions, the scheme may also invest in debt and money market instruments.
NAV as on 30 June, 15 : `33.0390
Benchmark : S&P BSE 200 - 100%
Corpus as on 30 June, 15 : `172.50 Crs.
Investment Style
Investment Style
Value Blend Growth SizeLarge
Mid
Small
Fund Performance Sector Allocation Asset Allocation
-0.26%
0.61%
19.18%
3.65%
3.70%
4.07%
5.28%
6.61%
7.31%
8.83%
10.93%
11.17%
18.92%
-6.00% 0.00% 6.00% 12.00%18.00%24.00%30.00%
Cash Bank & Others
Unit Funds
Others
Tobacco Products
Capital Goods - Electrical
Refineries
Finance
Capital Goods-Non Electrical
Auto Ancillaries
Automobile
Pharmaceuticals
IT - Software
Banks
99.65%
0.61%-0.26%
Equity
Unit Funds
Cash Bank & Others
Note : The investment income and prices may go down as well as up.“Since Inception” and returns above “1 Year” are calculated as per CAGR.
Last 3 Months 31-Mar-15 33.3447 3537.55 -0.92% -1.08%
Last 6 Months 31-Dec-14 31.1804 3428.09 5.96% 2.08%
Last 1 Year 30-Jun-14 26.9262 3124.40 22.70% 12.01%
Last 2 Years 28-Jun-13 19.5382 2323.83 30.04% 22.72%
Last 3 Years 29-Jun-12 17.8514 2138.10 22.78% 17.85%
Last 4 Years 30-Jun-11 19.2021 2314.65 14.53% 10.89%
Last 5 Years 30-Jun-10 18.1956 2248.06 12.67% 9.25%
Since Inception 12-Jan-09 10.0000 1091.37 20.30% 19.75%
PERIOD DATE NAV S&P BSE 200 NAVChange
INDEXChange
Top 200 FundULIF 027 12/01/09 ITT 110Fund Assure, Investment Report, June 2015
Equity 99.65
Infosys Technologies Ltd. IT - Software 5.71
HDFC Bank Ltd. Banks 4.02
Larsen and Toubro Ltd. Capital Goods-Non Electrical 3.93
ITC Ltd. Tobacco Products 3.65
ICICI Bank Ltd. Banks 3.57
Sun Pharmaceuticals Industries Ltd. Pharmaceuticals 3.30
Axis Bank Ltd. Banks 3.24
Reliance Industries Ltd. Refineries 2.90
Sundaram Finance Limited Finance 2.75
Maruti Suzuki India Ltd. Automobile 2.57
Motherson Sumi Systems Ltd. Auto Ancillaries 2.56
HDFC Ltd. Finance 2.53
Dr. Reddys Laboratories Ltd. Pharmaceuticals 2.48
State Bank of India Banks 2.28
Eicher Motors Ltd. Automobile 2.27
Other Equity 51.90
Unit Funds 0.61
Reliance Liquid Fund - Treasury Plan - Direct Plan Growth Plan 0.61
Cash Bank & Others -0.26
Total 100.00
Equity Fund Debt Fund Hybrid Fund
Fund Details Portfolio
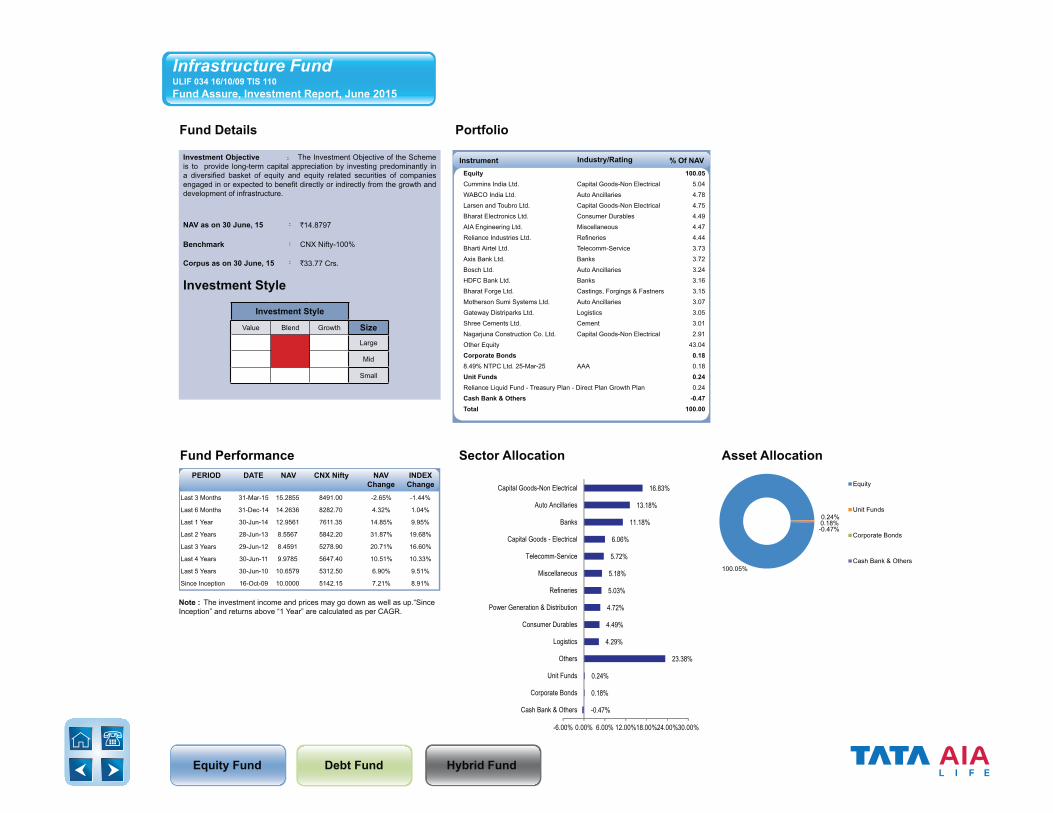
Instrument Industry/Rating % Of NAVInvestment Objective : The Investment Objective of the Scheme is to provide long-term capital appreciation by investing predominantly in a diversified basket of equity and equity related securities of companies engaged in or expected to benefit directly or indirectly from the growth and development of infrastructure.
NAV as on 30 June, 15 : `14.8797
Benchmark : CNX Nifty-100%
Corpus as on 30 June, 15 : `33.77 Crs.
Investment Style
Investment Style
Value Blend Growth SizeLarge
Mid
Small
Fund Performance Sector Allocation Asset Allocation
-0.47%
0.18%
0.24%
23.38%
4.29%
4.49%
4.72%
5.03%
5.18%
5.72%
6.06%
11.18%
13.18%
16.83%
-6.00% 0.00% 6.00% 12.00%18.00%24.00%30.00%
Cash Bank & Others
Corporate Bonds
Unit Funds
Others
Logistics
Consumer Durables
Power Generation & Distribution
Refineries
Miscellaneous
Telecomm-Service
Capital Goods - Electrical
Banks
Auto Ancillaries
Capital Goods-Non Electrical
100.05%
0.24%0.18%-0.47%
Equity
Unit Funds
Corporate Bonds
Cash Bank & Others
Note : The investment income and prices may go down as well as up.“Since Inception” and returns above “1 Year” are calculated as per CAGR.
Last 3 Months 31-Mar-15 15.2855 8491.00 -2.65% -1.44%
Last 6 Months 31-Dec-14 14.2636 8282.70 4.32% 1.04%
Last 1 Year 30-Jun-14 12.9561 7611.35 14.85% 9.95%
Last 2 Years 28-Jun-13 8.5567 5842.20 31.87% 19.68%
Last 3 Years 29-Jun-12 8.4591 5278.90 20.71% 16.60%
Last 4 Years 30-Jun-11 9.9785 5647.40 10.51% 10.33%
Last 5 Years 30-Jun-10 10.6579 5312.50 6.90% 9.51%
Since Inception 16-Oct-09 10.0000 5142.15 7.21% 8.91%
PERIOD DATE NAV CNX Nifty NAVChange
INDEXChange
Infrastructure FundULIF 034 16/10/09 TIS 110Fund Assure, Investment Report, June 2015
Equity 100.05Cummins India Ltd. Capital Goods-Non Electrical 5.04WABCO India Ltd. Auto Ancillaries 4.78Larsen and Toubro Ltd. Capital Goods-Non Electrical 4.75Bharat Electronics Ltd. Consumer Durables 4.49AIA Engineering Ltd. Miscellaneous 4.47Reliance Industries Ltd. Refineries 4.44Bharti Airtel Ltd. Telecomm-Service 3.73Axis Bank Ltd. Banks 3.72Bosch Ltd. Auto Ancillaries 3.24HDFC Bank Ltd. Banks 3.16Bharat Forge Ltd. Castings, Forgings & Fastners 3.15Motherson Sumi Systems Ltd. Auto Ancillaries 3.07Gateway Distriparks Ltd. Logistics 3.05Shree Cements Ltd. Cement 3.01Nagarjuna Construction Co. Ltd. Capital Goods-Non Electrical 2.91Other Equity 43.04Corporate Bonds 0.188.49% NTPC Ltd. 25-Mar-25 AAA 0.18Unit Funds 0.24Reliance Liquid Fund - Treasury Plan - Direct Plan Growth Plan 0.24Cash Bank & Others -0.47Total 100.00
Equity Fund Debt Fund Hybrid Fund
Fund Details Portfolio
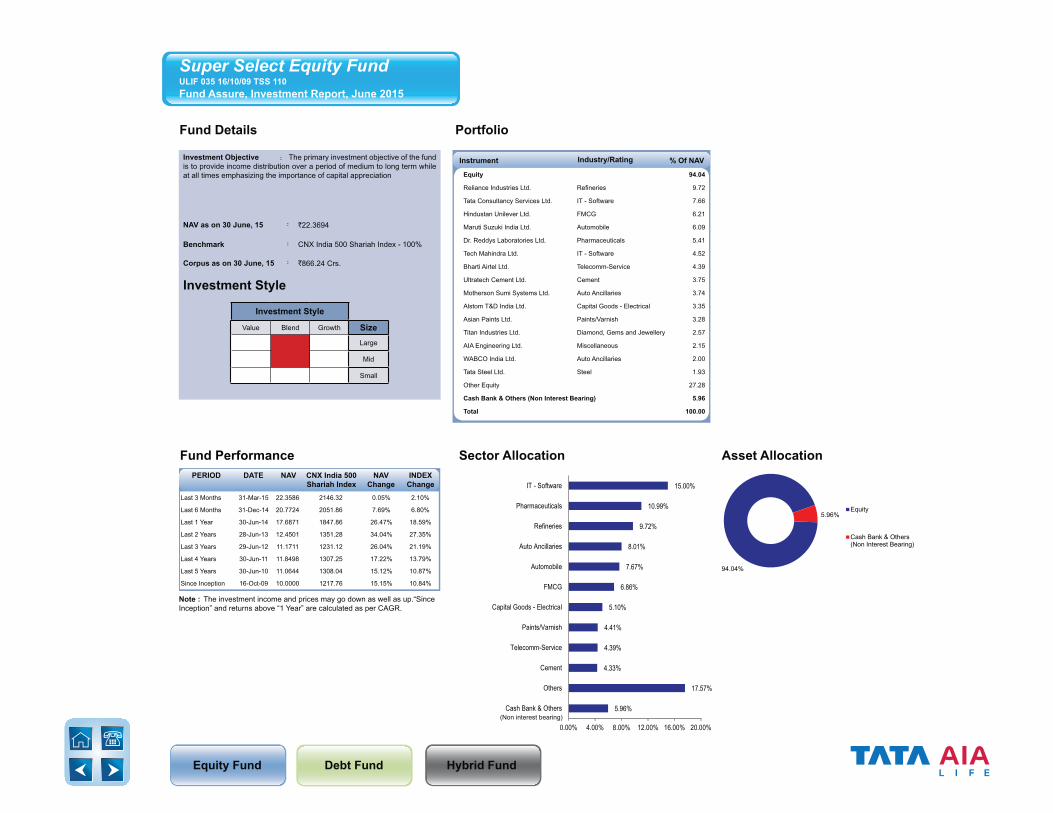
Instrument Industry/Rating % Of NAVInvestment Objective : The primary investment objective of the fund is to provide income distribution over a period of medium to long term while at all times emphasizing the importance of capital appreciation
NAV as on 30 June, 15 : `22.3694
Benchmark : CNX India 500 Shariah Index - 100%
Corpus as on 30 June, 15 : `866.24 Crs.
Investment Style
Investment Style
Value Blend Growth SizeLarge
Mid
Small
Fund Performance Sector Allocation Asset Allocation
5.96%
17.57%
4.33%
4.39%
4.41%
5.10%
6.86%
7.67%
8.01%
9.72%
10.99%
15.00%
0.00% 4.00% 8.00% 12.00% 16.00% 20.00%
Cash Bank & Others
Others
Cement
Telecomm-Service
Paints/Varnish
Capital Goods - Electrical
FMCG
Automobile
Auto Ancillaries
Refineries
Pharmaceuticals
IT - Software
94.04%
5.96%Equity
Cash Bank & Others(Non Interest Bearing)
Note : The investment income and prices may go down as well as up.“Since Inception” and returns above “1 Year” are calculated as per CAGR.
Last 3 Months 31-Mar-15 22.3586 2146.32 0.05% 2.10%
Last 6 Months 31-Dec-14 20.7724 2051.86 7.69% 6.80%
Last 1 Year 30-Jun-14 17.6871 1847.86 26.47% 18.59%
Last 2 Years 28-Jun-13 12.4501 1351.28 34.04% 27.35%
Last 3 Years 29-Jun-12 11.1711 1231.12 26.04% 21.19%
Last 4 Years 30-Jun-11 11.8498 1307.25 17.22% 13.79%
Last 5 Years 30-Jun-10 11.0644 1308.04 15.12% 10.87%
Since Inception 16-Oct-09 10.0000 1217.76 15.15% 10.84%
PERIOD DATE NAV CNX India 500 Shariah Index
NAVChange
INDEXChange
Super Select Equity FundULIF 035 16/10/09 TSS 110Fund Assure, Investment Report, June 2015
(Non interest bearing)
Equity 94.04
Reliance Industries Ltd. Refineries 9.72
Tata Consultancy Services Ltd. IT - Software 7.66
Hindustan Unilever Ltd. FMCG 6.21
Maruti Suzuki India Ltd. Automobile 6.09
Dr. Reddys Laboratories Ltd. Pharmaceuticals 5.41
Tech Mahindra Ltd. IT - Software 4.52
Bharti Airtel Ltd. Telecomm-Service 4.39
Ultratech Cement Ltd. Cement 3.75
Motherson Sumi Systems Ltd. Auto Ancillaries 3.74
Alstom T&D India Ltd. Capital Goods - Electrical 3.35
Asian Paints Ltd. Paints/Varnish 3.28
Titan Industries Ltd. Diamond, Gems and Jewellery 2.57
AIA Engineering Ltd. Miscellaneous 2.15
WABCO India Ltd. Auto Ancillaries 2.00
Tata Steel Ltd. Steel 1.93
Other Equity 27.28
Cash Bank & Others (Non Interest Bearing) 5.96
Total 100.00
Equity Fund Debt Fund Hybrid Fund
Fund Details Portfolio
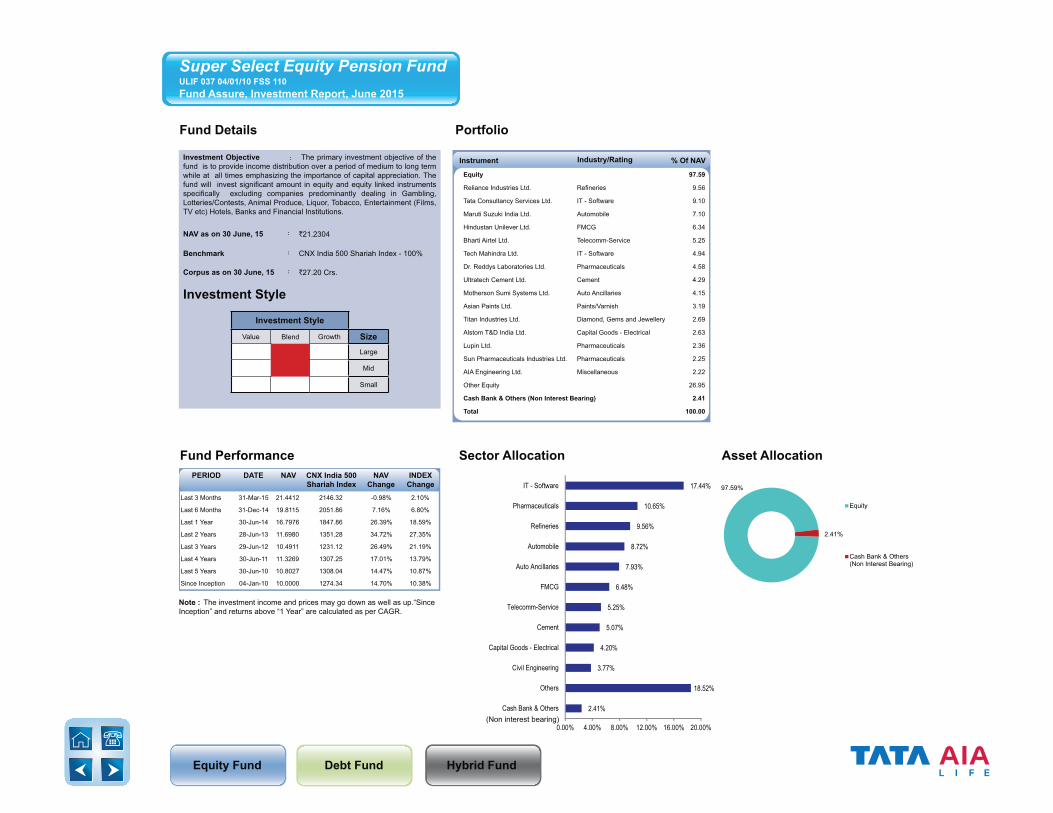
Instrument Industry/Rating % Of NAVInvestment Objective : The primary investment objective of the fund is to provide income distribution over a period of medium to long term while at all times emphasizing the importance of capital appreciation. The fund will invest significant amount in equity and equity linked instruments specifically excluding companies predominantly dealing in Gambling, Lotteries/Contests, Animal Produce, Liquor, Tobacco, Entertainment (Films, TV etc) Hotels, Banks and Financial Institutions.
NAV as on 30 June, 15 : `21.2304
Benchmark : CNX India 500 Shariah Index - 100%
Corpus as on 30 June, 15 : `27.20 Crs.
Investment Style
Investment Style
Value Blend Growth SizeLarge
Mid
Small
Fund Performance Sector Allocation Asset Allocation
2.41%
18.52%
3.77%
4.20%
5.07%
5.25%
6.48%
7.93%
8.72%
9.56%
10.65%
17.44%
0.00% 4.00% 8.00% 12.00% 16.00% 20.00%
Cash Bank & Others
Others
Civil Engineering
Capital Goods - Electrical
Cement
Telecomm-Service
FMCG
Auto Ancillaries
Automobile
Refineries
Pharmaceuticals
IT - Software 97.59%
2.41%
Equity
Cash Bank & Others(Non Interest Bearing)
Note : The investment income and prices may go down as well as up.“Since Inception” and returns above “1 Year” are calculated as per CAGR.
Last 3 Months 31-Mar-15 21.4412 2146.32 -0.98% 2.10%
Last 6 Months 31-Dec-14 19.8115 2051.86 7.16% 6.80%
Last 1 Year 30-Jun-14 16.7976 1847.86 26.39% 18.59%
Last 2 Years 28-Jun-13 11.6980 1351.28 34.72% 27.35%
Last 3 Years 29-Jun-12 10.4911 1231.12 26.49% 21.19%
Last 4 Years 30-Jun-11 11.3269 1307.25 17.01% 13.79%
Last 5 Years 30-Jun-10 10.8027 1308.04 14.47% 10.87%
Since Inception 04-Jan-10 10.0000 1274.34 14.70% 10.38%
PERIOD DATE NAV CNX India 500 Shariah Index
NAVChange
INDEXChange
Super Select Equity Pension FundULIF 037 04/01/10 FSS 110Fund Assure, Investment Report, June 2015
(Non interest bearing)
Equity 97.59
Reliance Industries Ltd. Refineries 9.56
Tata Consultancy Services Ltd. IT - Software 9.10
Maruti Suzuki India Ltd. Automobile 7.10
Hindustan Unilever Ltd. FMCG 6.34
Bharti Airtel Ltd. Telecomm-Service 5.25
Tech Mahindra Ltd. IT - Software 4.94
Dr. Reddys Laboratories Ltd. Pharmaceuticals 4.58
Ultratech Cement Ltd. Cement 4.29
Motherson Sumi Systems Ltd. Auto Ancillaries 4.15
Asian Paints Ltd. Paints/Varnish 3.19
Titan Industries Ltd. Diamond, Gems and Jewellery 2.69
Alstom T&D India Ltd. Capital Goods - Electrical 2.63
Lupin Ltd. Pharmaceuticals 2.36
Sun Pharmaceuticals Industries Ltd. Pharmaceuticals 2.25
AIA Engineering Ltd. Miscellaneous 2.22
Other Equity 26.95
Cash Bank & Others (Non Interest Bearing) 2.41
Total 100.00

Equity Fund Debt Fund Hybrid Fund
Fund Details Portfolio
Fund Assure, Investment Report, June 2015
Liquid Fund Income Fund Short Term Fixed Income Fund
Whole Life Short Term Fixed Income Fund
Future Income Pension Fund
Whole Life Income Fund Bond Fund
Apex Plus Investment Fund
Apex Pension 15 Investment Fund
Apex Pension 20 Investment Fund
Discontinued Policy Fund
Apex Supreme Investment Fund
Apex Supreme Investment Fund II
Apex Supreme Investment Fund III
Equity Fund Debt Fund Hybrid Fund
Fund Details Portfolio
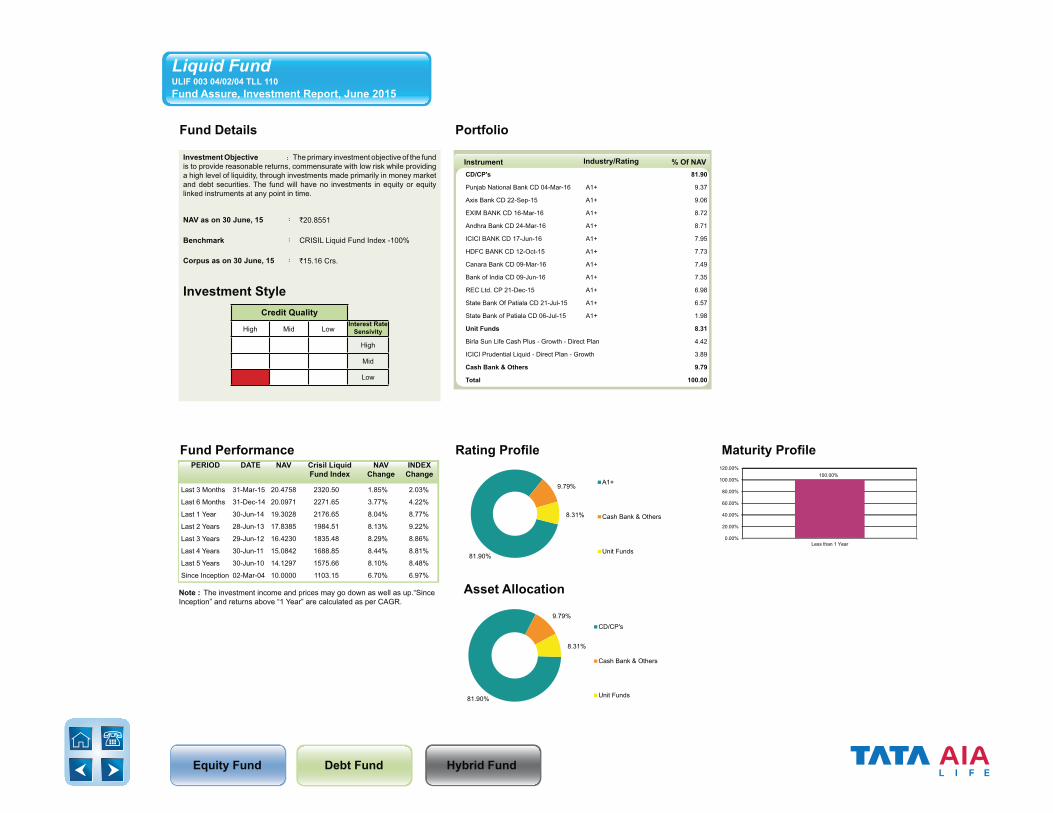
Investment Objective : The primary investment objective of the fund is to provide reasonable returns, commensurate with low risk while providing a high level of liquidity, through investments made primarily in money market and debt securities. The fund will have no investments in equity or equity linked instruments at any point in time.
NAV as on 30 June, 15 : `20.8551
Benchmark : CRISIL Liquid Fund Index -100%
Corpus as on 30 June, 15 : `15.16 Crs.
Investment StyleCredit Quality
High Mid LowInterest Rate Sensivity
High
Mid
Low
Fund Performance Rating Profile Maturity Profile
81.90%
9.79%
8.31%
A1+
Cash Bank & Others
Unit Funds
100.00%
0.00%
20.00%
40.00%
60.00%
80.00%
100.00%
120.00%
Less than 1 Year
Asset Allocation
81.90%
9.79%
8.31%
CD/CP's
Cash Bank & Others
Unit Funds
Note : The investment income and prices may go down as well as up.“Since Inception” and returns above “1 Year” are calculated as per CAGR.
Instrument Industry/Rating % Of NAV
Last 3 Months 31-Mar-15 20.4758 2320.50 1.85% 2.03%
Last 6 Months 31-Dec-14 20.0971 2271.65 3.77% 4.22%
Last 1 Year 30-Jun-14 19.3028 2176.65 8.04% 8.77%
Last 2 Years 28-Jun-13 17.8385 1984.51 8.13% 9.22%
Last 3 Years 29-Jun-12 16.4230 1835.48 8.29% 8.86%
Last 4 Years 30-Jun-11 15.0842 1688.85 8.44% 8.81%
Last 5 Years 30-Jun-10 14.1297 1575.66 8.10% 8.48%
Since Inception 02-Mar-04 10.0000 1103.15 6.70% 6.97%
PERIOD DATE NAV Crisil LiquidFund Index
NAVChange
INDEXChange
Liquid FundULIF 003 04/02/04 TLL 110Fund Assure, Investment Report, June 2015
CD/CP's 81.90
Punjab National Bank CD 04-Mar-16 A1+ 9.37
Axis Bank CD 22-Sep-15 A1+ 9.06
EXIM BANK CD 16-Mar-16 A1+ 8.72
Andhra Bank CD 24-Mar-16 A1+ 8.71
ICICI BANK CD 17-Jun-16 A1+ 7.95
HDFC BANK CD 12-Oct-15 A1+ 7.73
Canara Bank CD 09-Mar-16 A1+ 7.49
Bank of India CD 09-Jun-16 A1+ 7.35
REC Ltd. CP 21-Dec-15 A1+ 6.98
State Bank Of Patiala CD 21-Jul-15 A1+ 6.57
State Bank of Patiala CD 06-Jul-15 A1+ 1.98
Unit Funds 8.31
Birla Sun Life Cash Plus - Growth - Direct Plan 4.42
ICICI Prudential Liquid - Direct Plan - Growth 3.89
Cash Bank & Others 9.79
Total 100.00
Equity Fund Debt Fund Hybrid Fund
Fund Details Portfolio
Fund Performance Rating Profile Maturity Profile
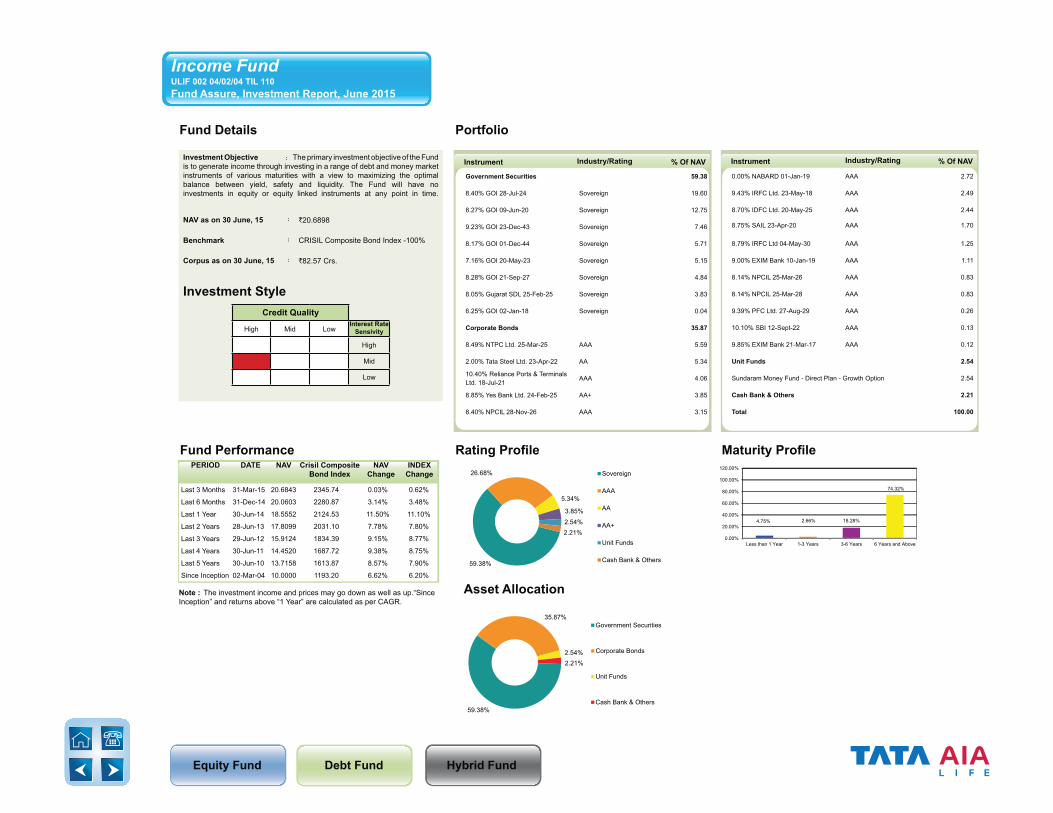
59.38%
26.68%
5.34%
3.85%
2.54%2.21%
Sovereign
AAA
AA
AA+
Unit Funds
Cash Bank & Others
4.75% 2.66% 18.28%
74.32%
0.00%
20.00%
40.00%
60.00%
80.00%
100.00%
120.00%
Less than 1 Year 1-3 Years 3-6 Years 6 Years and Above
Asset Allocation
59.38%
35.87%
2.54%2.21%
Government Securities
Corporate Bonds
Unit Funds
Cash Bank & Others
Note : The investment income and prices may go down as well as up.“Since Inception” and returns above “1 Year” are calculated as per CAGR.
Last 3 Months 31-Mar-15 20.6843 2345.74 0.03% 0.62%
Last 6 Months 31-Dec-14 20.0603 2280.87 3.14% 3.48%
Last 1 Year 30-Jun-14 18.5552 2124.53 11.50% 11.10%
Last 2 Years 28-Jun-13 17.8099 2031.10 7.78% 7.80%
Last 3 Years 29-Jun-12 15.9124 1834.39 9.15% 8.77%
Last 4 Years 30-Jun-11 14.4520 1687.72 9.38% 8.75%
Last 5 Years 30-Jun-10 13.7158 1613.87 8.57% 7.90%
Since Inception 02-Mar-04 10.0000 1193.20 6.62% 6.20%
PERIOD DATE NAV Crisil CompositeBond Index
NAVChange
INDEXChange
Investment Objective : The primary investment objective of the Fund is to generate income through investing in a range of debt and money market instruments of various maturities with a view to maximizing the optimal balance between yield, safety and liquidity. The Fund will have no investments in equity or equity linked instruments at any point in time.
NAV as on 30 June, 15 : `20.6898
Benchmark : CRISIL Composite Bond Index -100%
Corpus as on 30 June, 15 : `82.57 Crs.
Investment StyleCredit Quality
High Mid LowInterest Rate Sensivity
High
Mid
Low
Income FundULIF 002 04/02/04 TIL 110Fund Assure, Investment Report, June 2015
Instrument Industry/Rating % Of NAV Instrument Industry/Rating % Of NAV
Government Securities 59.38
8.40% GOI 28-Jul-24 Sovereign 19.60
8.27% GOI 09-Jun-20 Sovereign 12.75
9.23% GOI 23-Dec-43 Sovereign 7.46
8.17% GOI 01-Dec-44 Sovereign 5.71
7.16% GOI 20-May-23 Sovereign 5.15
8.28% GOI 21-Sep-27 Sovereign 4.84
8.05% Gujarat SDL 25-Feb-25 Sovereign 3.83
6.25% GOI 02-Jan-18 Sovereign 0.04
Corporate Bonds 35.87
8.49% NTPC Ltd. 25-Mar-25 AAA 5.59
2.00% Tata Steel Ltd. 23-Apr-22 AA 5.34
10.40% Reliance Ports & Terminals Ltd. 18-Jul-21
AAA 4.06
8.85% Yes Bank Ltd. 24-Feb-25 AA+ 3.85
8.40% NPCIL 28-Nov-26 AAA 3.15
0.00% NABARD 01-Jan-19 AAA 2.72
9.43% IRFC Ltd. 23-May-18 AAA 2.49
8.70% IDFC Ltd. 20-May-25 AAA 2.44
8.75% SAIL 23-Apr-20 AAA 1.70
8.79% IRFC Ltd 04-May-30 AAA 1.25
9.00% EXIM Bank 10-Jan-19 AAA 1.11
8.14% NPCIL 25-Mar-26 AAA 0.83
8.14% NPCIL 25-Mar-28 AAA 0.83
9.39% PFC Ltd. 27-Aug-29 AAA 0.26
10.10% SBI 12-Sept-22 AAA 0.13
9.85% EXIM Bank 21-Mar-17 AAA 0.12
Unit Funds 2.54
Sundaram Money Fund - Direct Plan - Growth Option 2.54
Cash Bank & Others 2.21
Total 100.00
Equity Fund Debt Fund Hybrid Fund
Fund Details Portfolio
Fund Performance Rating Profile Maturity Profile
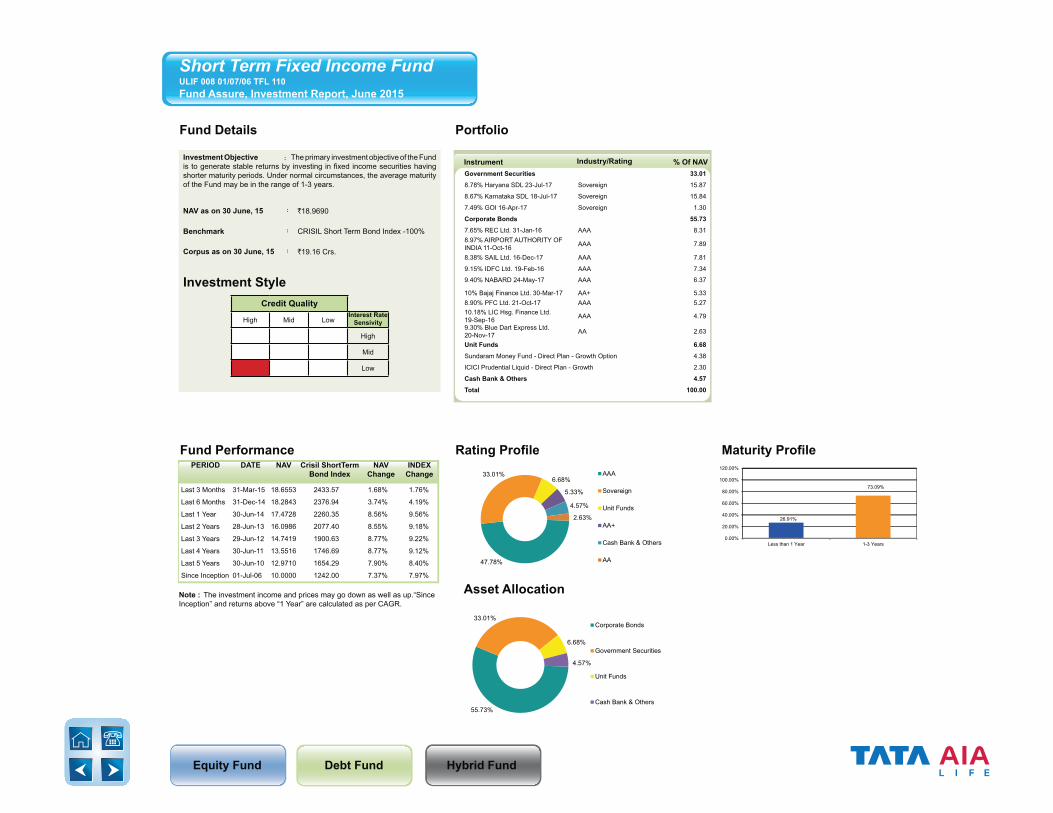
47.78%
33.01%6.68%
5.33%
4.57%
2.63%
AAA
Sovereign
Unit Funds
AA+
Cash Bank & Others
AA
26.91%
73.09%
0.00%
20.00%
40.00%
60.00%
80.00%
100.00%
120.00%
Less than 1 Year 1-3 Years
Asset Allocation
55.73%
33.01%
6.68%
4.57%
Corporate Bonds
Government Securities
Unit Funds
Cash Bank & Others
Note : The investment income and prices may go down as well as up.“Since Inception” and returns above “1 Year” are calculated as per CAGR.
Last 3 Months 31-Mar-15 18.6553 2433.57 1.68% 1.76%
Last 6 Months 31-Dec-14 18.2843 2376.94 3.74% 4.19%
Last 1 Year 30-Jun-14 17.4728 2260.35 8.56% 9.56%
Last 2 Years 28-Jun-13 16.0986 2077.40 8.55% 9.18%
Last 3 Years 29-Jun-12 14.7419 1900.63 8.77% 9.22%
Last 4 Years 30-Jun-11 13.5516 1746.69 8.77% 9.12%
Last 5 Years 30-Jun-10 12.9710 1654.29 7.90% 8.40%
Since Inception 01-Jul-06 10.0000 1242.00 7.37% 7.97%
PERIOD DATE NAV Crisil ShortTermBond Index
NAVChange
INDEXChange
Investment Objective : The primary investment objective of the Fund is to generate stable returns by investing in fixed income securities having shorter maturity periods. Under normal circumstances, the average maturity of the Fund may be in the range of 1-3 years.
NAV as on 30 June, 15 : `18.9690
Benchmark : CRISIL Short Term Bond Index -100%
Corpus as on 30 June, 15 : `19.16 Crs.
Investment StyleCredit Quality
High Mid LowInterest Rate Sensivity
High
Mid
Low
Short Term Fixed Income Fund ULIF 008 01/07/06 TFL 110 Fund Assure, Investment Report, June 2015
Instrument Industry/Rating % Of NAVGovernment Securities 33.01
8.78% Haryana SDL 23-Jul-17 Sovereign 15.87
8.67% Karnataka SDL 18-Jul-17 Sovereign 15.84
7.49% GOI 16-Apr-17 Sovereign 1.30
Corporate Bonds 55.73
7.65% REC Ltd. 31-Jan-16 AAA 8.318.97% AIRPORT AUTHORITY OF INDIA 11-Oct-16 AAA 7.89
8.38% SAIL Ltd. 16-Dec-17 AAA 7.81
9.15% IDFC Ltd. 19-Feb-16 AAA 7.34
9.40% NABARD 24-May-17 AAA 6.37
10% Bajaj Finance Ltd. 30-Mar-17 AA+ 5.338.90% PFC Ltd. 21-Oct-17 AAA 5.2710.18% LIC Hsg. Finance Ltd. 19-Sep-16 AAA 4.79
9.30% Blue Dart Express Ltd. 20-Nov-17 AA 2.63
Unit Funds 6.68
Sundaram Money Fund - Direct Plan - Growth Option 4.38
ICICI Prudential Liquid - Direct Plan - Growth 2.30
Cash Bank & Others 4.57
Total 100.00
Equity Fund Debt Fund Hybrid Fund
Fund Details Portfolio
Fund Performance Rating Profile Maturity Profile
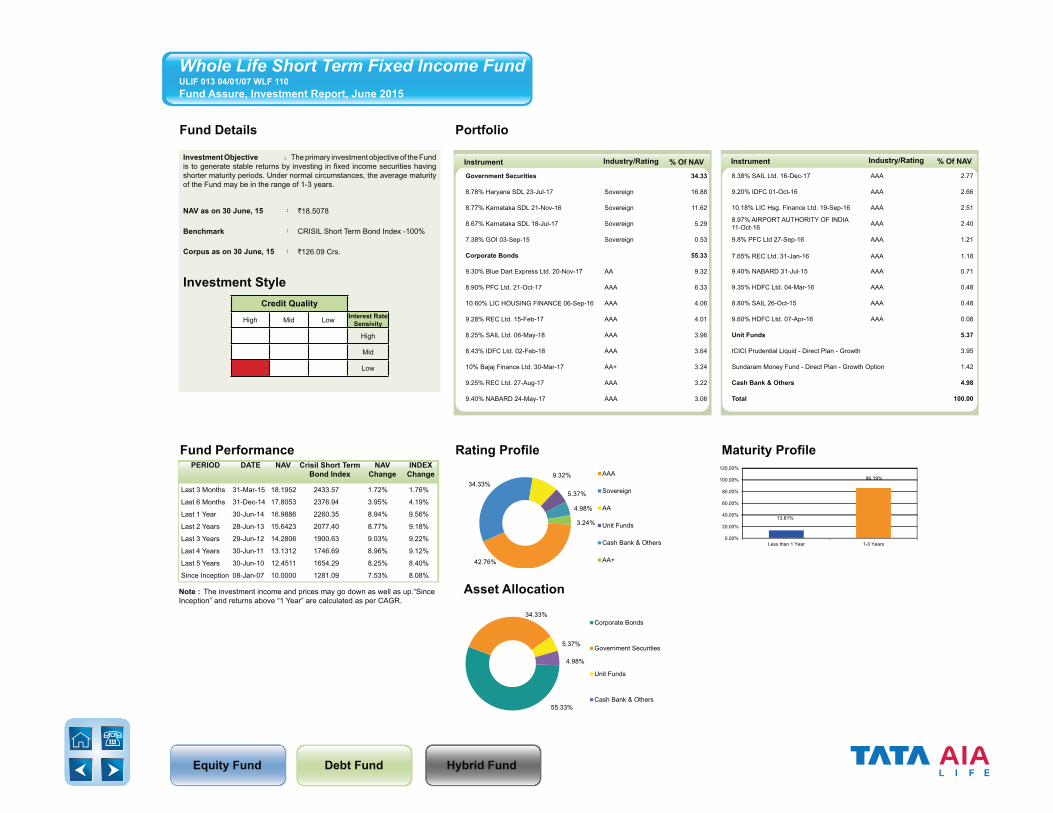
42.76%
34.33%9.32%
5.37%
4.98%
3.24%
AAA
Sovereign
AA
Unit Funds
Cash Bank & Others
AA+
13.81%
86.19%
0.00%
20.00%
40.00%
60.00%
80.00%
100.00%
120.00%
Less than 1 Year 1-3 Years
Asset Allocation
55.33%
34.33%
5.37%
4.98%
Corporate Bonds
Government Securities
Unit Funds
Cash Bank & Others
Note : The investment income and prices may go down as well as up.“Since Inception” and returns above “1 Year” are calculated as per CAGR.
Last 3 Months 31-Mar-15 18.1952 2433.57 1.72% 1.76%
Last 6 Months 31-Dec-14 17.8053 2376.94 3.95% 4.19%
Last 1 Year 30-Jun-14 16.9886 2260.35 8.94% 9.56%
Last 2 Years 28-Jun-13 15.6423 2077.40 8.77% 9.18%
Last 3 Years 29-Jun-12 14.2806 1900.63 9.03% 9.22%
Last 4 Years 30-Jun-11 13.1312 1746.69 8.96% 9.12%
Last 5 Years 30-Jun-10 12.4511 1654.29 8.25% 8.40%
Since Inception 08-Jan-07 10.0000 1281.09 7.53% 8.08%
PERIOD DATE NAV Crisil Short TermBond Index
NAVChange
INDEXChange
Investment Objective : The primary investment objective of the Fund is to generate stable returns by investing in fixed income securities having shorter maturity periods. Under normal circumstances, the average maturity of the Fund may be in the range of 1-3 years.
NAV as on 30 June, 15 : `18.5078
Benchmark : CRISIL Short Term Bond Index -100%
Corpus as on 30 June, 15 : `126.09 Crs.
Investment StyleCredit Quality
High Mid Low Interest Rate Sensivity
High
Mid
Low
Whole Life Short Term Fixed Income Fund ULIF 013 04/01/07 WLF 110Fund Assure, Investment Report, June 2015
Instrument Industry/Rating % Of NAV Instrument Industry/Rating % Of NAV
Government Securities 34.33
8.78% Haryana SDL 23-Jul-17 Sovereign 16.88
8.77% Karnataka SDL 21-Nov-16 Sovereign 11.62
8.67% Karnataka SDL 18-Jul-17 Sovereign 5.29
7.38% GOI 03-Sep-15 Sovereign 0.53
Corporate Bonds 55.33
9.30% Blue Dart Express Ltd. 20-Nov-17 AA 9.32
8.90% PFC Ltd. 21-Oct-17 AAA 6.33
10.60% LIC HOUSING FINANCE 06-Sep-16 AAA 4.06
9.28% REC Ltd. 15-Feb-17 AAA 4.01
8.25% SAIL Ltd. 06-May-18 AAA 3.96
8.43% IDFC Ltd. 02-Feb-18 AAA 3.64
10% Bajaj Finance Ltd. 30-Mar-17 AA+ 3.24
9.25% REC Ltd. 27-Aug-17 AAA 3.22
9.40% NABARD 24-May-17 AAA 3.06
8.38% SAIL Ltd. 16-Dec-17 AAA 2.77
9.20% IDFC 01-Oct-16 AAA 2.66
10.18% LIC Hsg. Finance Ltd. 19-Sep-16 AAA 2.51
8.97% AIRPORT AUTHORITY OF INDIA 11-Oct-16 AAA 2.40
9.8% PFC Ltd 27-Sep-16 AAA 1.21
7.65% REC Ltd. 31-Jan-16 AAA 1.18
9.40% NABARD 31-Jul-15 AAA 0.71
9.35% HDFC Ltd. 04-Mar-16 AAA 0.48
8.80% SAIL 26-Oct-15 AAA 0.48
9.60% HDFC Ltd. 07-Apr-16 AAA 0.08
Unit Funds 5.37
ICICI Prudential Liquid - Direct Plan - Growth 3.95
Sundaram Money Fund - Direct Plan - Growth Option 1.42
Cash Bank & Others 4.98
Total 100.00

Equity Fund Debt Fund Hybrid Fund
Fund Details Portfolio
Fund Performance Rating Profile Maturity Profile
58.38%
26.28%
5.06%
4.57%
3.71%
2.00%
Sovereign
AAA
Unit Funds
AA
AA+
Cash Bank & Others
7.05%
2.04%
20.52%
70.39%
0.00%
20.00%
40.00%
60.00%
80.00%
100.00%
120.00%
Less than 1 Year 1-3 Years 3-6 Years 6 Years and Above
Asset Allocation
58.38%
34.57%
5.06%
2.00%
Government Securities
Corporate Bonds
Unit Funds
Cash Bank & Others
Note : The investment income and prices may go down as well as up.“Since Inception” and returns above “1 Year” are calculated as per CAGR.
Last 3 Months 31-Mar-15 18.8427 2345.74 0.12% 0.62%
Last 6 Months 31-Dec-14 18.2539 2280.87 3.35% 3.48%
Last 1 Year 30-Jun-14 16.8476 2124.53 11.98% 11.10%
Last 2 Years 28-Jun-13 16.1289 2031.10 8.15% 7.80%
Last 3 Years 29-Jun-12 14.3351 1834.39 9.59% 8.77%
Last 4 Years 30-Jun-11 13.0452 1687.72 9.66% 8.75%
Last 5 Years 30-Jun-10 12.3954 1613.87 8.76% 7.90%
Since Inception 08-Jan-07 10.0000 1298.79 7.77% 7.30%
PERIOD DATE NAV Crisil CompositeBond Index
NAVChange
INDEXChange
Investment Objective : The primary investment objective of the Fund is to generate income through investing in a range of debt and money market instruments of various maturities with a view to maximizing the optimal balance between yield, safety and liquidity. The Fund will have no investments in equity or equity linked instruments at any point in time.
NAV as on 30 June, 15 : `18.8661
Benchmark : CRISIL Composite Bond Index -100%
Corpus as on 30 June, 15 : `241.09 Crs.
Investment StyleCredit Quality
High Mid LowInterest Rate Sensivity
High
Mid
Low
Whole Life Income FundULIF 012 04/01/07 WLI 110Fund Assure, Investment Report, June 2015
Instrument Industry/Rating % Of NAV Instrument Industry/Rating % Of NAV
Government Securities 58.38
8.27% GOI 09-Jun-20 Sovereign 14.21
8.40% GOI 28-Jul-24 Sovereign 11.69
9.23% GOI 23-Dec-43 Sovereign 10.25
7.16% GOI 20-May-23 Sovereign 5.98
8.17% GOI 01-Dec-44 Sovereign 4.29
8.33% GOI 09-Jul-26 Sovereign 4.15
8.28% GOI 21-Sep-27 Sovereign 4.11
8.05% Gujarat SDL 25-Feb-25 Sovereign 3.69
Corporate Bonds 34.57
8.49% NTPC Ltd. 25-Mar-25 AAA 5.84
2.00% Tata Steel Ltd. 23-Apr-22 AA 4.57
8.85% Yes Bank Ltd. 24-Feb-25 AA+ 3.71
10.40% Reliance Ports & Terminals Ltd. 18-Jul-21 AAA 3.36
8.40% NPCIL 28-Nov-26 AAA 2.90
8.70% IDFC Ltd. 20-May-25 AAA 2.38
9.39% PFC Ltd. 27-Aug-29 AAA 1.90
0.00% NABARD 01-Jan-19 AAA 1.86
9.43% IRFC Ltd. 23-May-18 AAA 1.71
8.90% PGC Ltd. 25-Feb-19 AAA 1.26
9.30% PGC Ltd. 28-Jun-21 AAA 0.85
9.30% SAIL 25-May-19 AAA 0.85
8.14% NPCIL 25-Mar-28 AAA 0.81
9.30% PGC LTD. 28-Jun-20 AAA 0.80
8.14% NPCIL 25-Mar-26 AAA 0.73
8.75% SAIL 23-Apr-20 AAA 0.42
8.90% PFC Ltd. 21-Oct-17 AAA 0.34
9.18% PFC Ltd 15-Apr-21 AAA 0.259.75% SBI Series 3 Lower Tier II 16-Mar-21 AAA 0.02
Unit Funds 5.06
Sundaram Money Fund - Direct Plan - Growth Option 4.48
ICICI Prudential Liquid - Direct Plan - Growth 0.57
Cash Bank & Others 2.00
Total 100.00
Equity Fund Debt Fund Hybrid Fund
Fund Details Portfolio
Fund Performance Rating Profile Maturity Profile
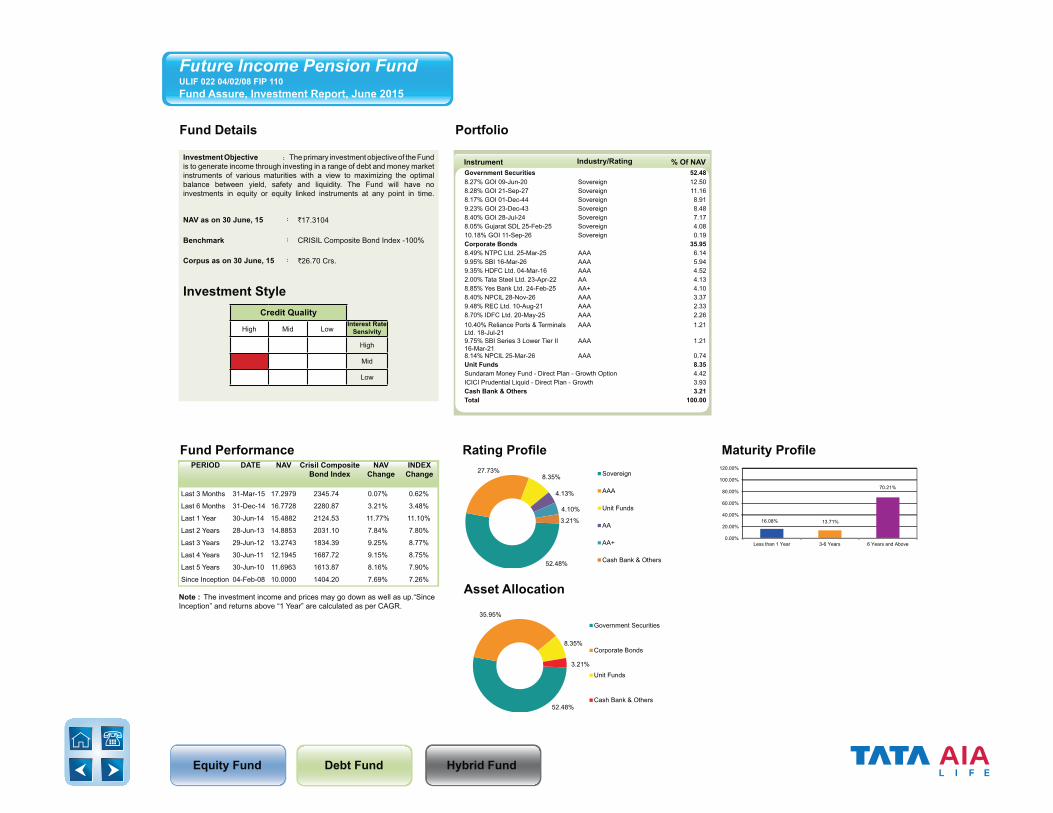
52.48%
27.73%8.35%
4.13%
4.10%
3.21%
Sovereign
AAA
Unit Funds
AA
AA+
Cash Bank & Others
16.08% 13.71%
70.21%
0.00%
20.00%
40.00%
60.00%
80.00%
100.00%
120.00%
Less than 1 Year 3-6 Years 6 Years and Above
Asset Allocation
52.48%
35.95%
8.35%
3.21%
Government Securities
Corporate Bonds
Unit Funds
Cash Bank & Others
Note : The investment income and prices may go down as well as up.“Since Inception” and returns above “1 Year” are calculated as per CAGR.
Last 3 Months 31-Mar-15 17.2979 2345.74 0.07% 0.62%
Last 6 Months 31-Dec-14 16.7728 2280.87 3.21% 3.48%
Last 1 Year 30-Jun-14 15.4882 2124.53 11.77% 11.10%
Last 2 Years 28-Jun-13 14.8853 2031.10 7.84% 7.80%
Last 3 Years 29-Jun-12 13.2743 1834.39 9.25% 8.77%
Last 4 Years 30-Jun-11 12.1945 1687.72 9.15% 8.75%
Last 5 Years 30-Jun-10 11.6963 1613.87 8.16% 7.90%
Since Inception 04-Feb-08 10.0000 1404.20 7.69% 7.26%
PERIOD DATE NAV Crisil CompositeBond Index
NAVChange
INDEXChange
Investment Objective : The primary investment objective of the Fund is to generate income through investing in a range of debt and money market instruments of various maturities with a view to maximizing the optimal balance between yield, safety and liquidity. The Fund will have no investments in equity or equity linked instruments at any point in time.
NAV as on 30 June, 15 : `17.3104
Benchmark : CRISIL Composite Bond Index -100%
Corpus as on 30 June, 15 : `26.70 Crs.
Investment StyleCredit Quality
High Mid LowInterest Rate Sensivity
High
Mid
Low
Future Income Pension FundULIF 022 04/02/08 FIP 110Fund Assure, Investment Report, June 2015
Instrument Industry/Rating % Of NAVGovernment Securities 52.488.27% GOI 09-Jun-20 Sovereign 12.508.28% GOI 21-Sep-27 Sovereign 11.168.17% GOI 01-Dec-44 Sovereign 8.919.23% GOI 23-Dec-43 Sovereign 8.488.40% GOI 28-Jul-24 Sovereign 7.178.05% Gujarat SDL 25-Feb-25 Sovereign 4.0810.18% GOI 11-Sep-26 Sovereign 0.19Corporate Bonds 35.958.49% NTPC Ltd. 25-Mar-25 AAA 6.149.95% SBI 16-Mar-26 AAA 5.949.35% HDFC Ltd. 04-Mar-16 AAA 4.522.00% Tata Steel Ltd. 23-Apr-22 AA 4.138.85% Yes Bank Ltd. 24-Feb-25 AA+ 4.108.40% NPCIL 28-Nov-26 AAA 3.379.48% REC Ltd. 10-Aug-21 AAA 2.338.70% IDFC Ltd. 20-May-25 AAA 2.2610.40% Reliance Ports & Terminals Ltd. 18-Jul-21
AAA 1.21
9.75% SBI Series 3 Lower Tier II 16-Mar-21
AAA 1.21
8.14% NPCIL 25-Mar-26 AAA 0.74Unit Funds 8.35Sundaram Money Fund - Direct Plan - Growth Option 4.42ICICI Prudential Liquid - Direct Plan - Growth 3.93Cash Bank & Others 3.21Total 100.00
Equity Fund Debt Fund Hybrid Fund
Fund Details Portfolio
Note : The investment income and prices may go down as well as up.“Since Inception” and returns above “1 Year” are calculated as per CAGR.
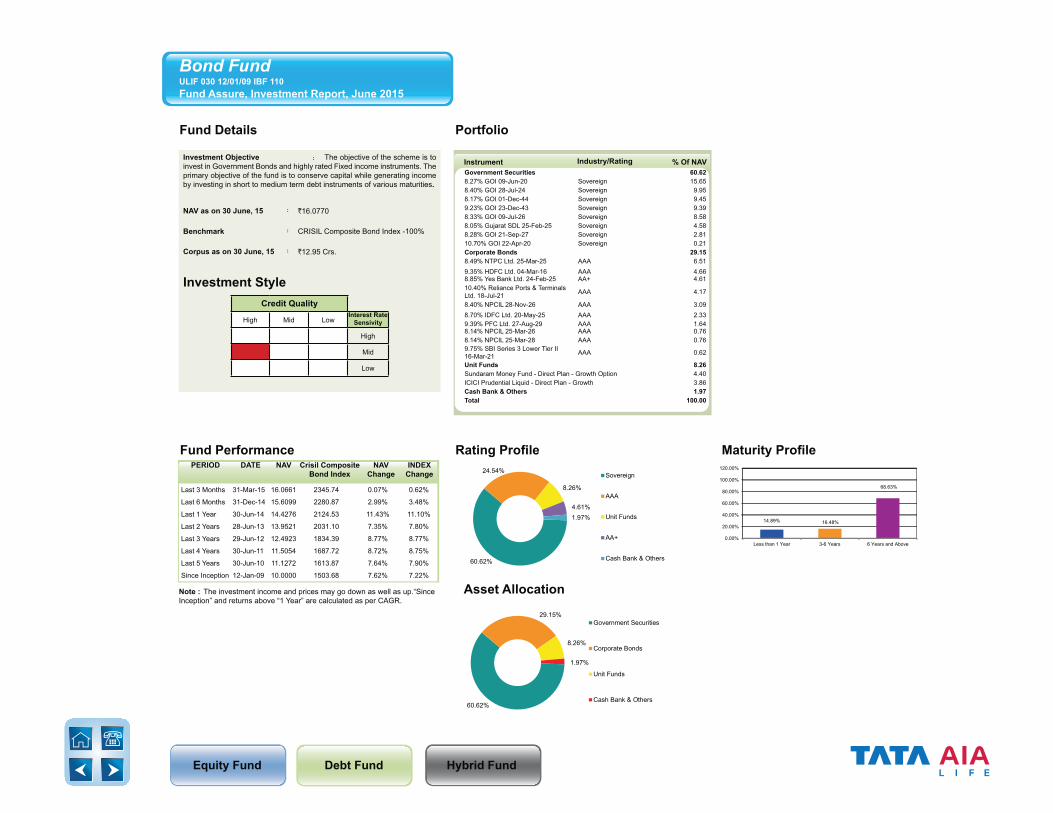
Last 3 Months 31-Mar-15 16.0661 2345.74 0.07% 0.62%
Last 6 Months 31-Dec-14 15.6099 2280.87 2.99% 3.48%
Last 1 Year 30-Jun-14 14.4276 2124.53 11.43% 11.10%
Last 2 Years 28-Jun-13 13.9521 2031.10 7.35% 7.80%
Last 3 Years 29-Jun-12 12.4923 1834.39 8.77% 8.77%
Last 4 Years 30-Jun-11 11.5054 1687.72 8.72% 8.75%
Last 5 Years 30-Jun-10 11.1272 1613.87 7.64% 7.90%
Since Inception 12-Jan-09 10.0000 1503.68 7.62% 7.22%
PERIOD DATE NAV Crisil CompositeBond Index
NAVChange
INDEXChange
Fund Performance Rating Profile Maturity Profile
60.62%
24.54%
8.26%
4.61%1.97%
Sovereign
AAA
Unit Funds
AA+
Cash Bank & Others
14.89% 16.48%
68.63%
0.00%
20.00%
40.00%
60.00%
80.00%
100.00%
120.00%
Less than 1 Year 3-6 Years 6 Years and Above
Asset Allocation
60.62%
29.15%
8.26%
1.97%
Government Securities
Corporate Bonds
Unit Funds
Cash Bank & Others
Investment Objective : The objective of the scheme is to invest in Government Bonds and highly rated Fixed income instruments. The primary objective of the fund is to conserve capital while generating income by investing in short to medium term debt instruments of various maturities.
NAV as on 30 June, 15 : `16.0770
Benchmark : CRISIL Composite Bond Index -100%
Corpus as on 30 June, 15 : `12.95 Crs.
Investment StyleCredit Quality
High Mid LowInterest Rate Sensivity
High
Mid
Low
Bond FundULIF 030 12/01/09 IBF 110Fund Assure, Investment Report, June 2015
Instrument Industry/Rating % Of NAVGovernment Securities 60.628.27% GOI 09-Jun-20 Sovereign 15.658.40% GOI 28-Jul-24 Sovereign 9.958.17% GOI 01-Dec-44 Sovereign 9.459.23% GOI 23-Dec-43 Sovereign 9.398.33% GOI 09-Jul-26 Sovereign 8.588.05% Gujarat SDL 25-Feb-25 Sovereign 4.588.28% GOI 21-Sep-27 Sovereign 2.8110.70% GOI 22-Apr-20 Sovereign 0.21Corporate Bonds 29.158.49% NTPC Ltd. 25-Mar-25 AAA 6.519.35% HDFC Ltd. 04-Mar-16 AAA 4.668.85% Yes Bank Ltd. 24-Feb-25 AA+ 4.6110.40% Reliance Ports & Terminals Ltd. 18-Jul-21 AAA 4.17
8.40% NPCIL 28-Nov-26 AAA 3.098.70% IDFC Ltd. 20-May-25 AAA 2.339.39% PFC Ltd. 27-Aug-29 AAA 1.648.14% NPCIL 25-Mar-26 AAA 0.768.14% NPCIL 25-Mar-28 AAA 0.769.75% SBI Series 3 Lower Tier II 16-Mar-21 AAA 0.62
Unit Funds 8.26Sundaram Money Fund - Direct Plan - Growth Option 4.40ICICI Prudential Liquid - Direct Plan - Growth 3.86Cash Bank & Others 1.97Total 100.00
Equity Fund Debt Fund Hybrid Fund
Fund Details Portfolio
Fund Performance Rating Profile Maturity Profile
100.00%
Cash Bank & Others
100.00%
0.00%
20.00%
40.00%
60.00%
80.00%
100.00%
120.00%
Less than 1 Year
Asset Allocation
100.00%
Cash Bank & Others
Note : The investment income and prices may go down as well as up.“Since Inception” and returns above “1 Year” are calculated as per CAGR.
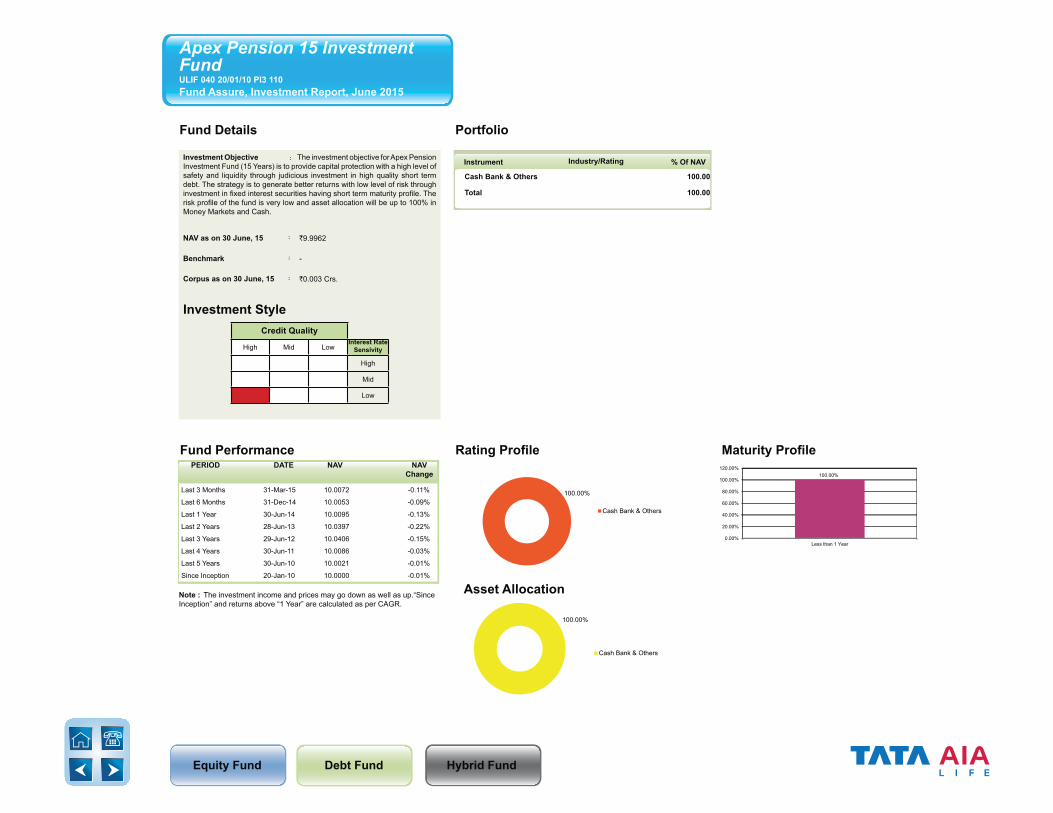
Last 3 Months 31-Mar-15 10.0072 -0.11%
Last 6 Months 31-Dec-14 10.0053 -0.09%
Last 1 Year 30-Jun-14 10.0095 -0.13%
Last 2 Years 28-Jun-13 10.0397 -0.22%
Last 3 Years 29-Jun-12 10.0406 -0.15%
Last 4 Years 30-Jun-11 10.0086 -0.03%
Last 5 Years 30-Jun-10 10.0021 -0.01%
Since Inception 20-Jan-10 10.0000 -0.01%
PERIOD DATE NAV NAVChange
Investment Objective : The investment objective for Apex Pension Investment Fund (15 Years) is to provide capital protection with a high level of safety and liquidity through judicious investment in high quality short term debt. The strategy is to generate better returns with low level of risk through investment in fixed interest securities having short term maturity profile. The risk profile of the fund is very low and asset allocation will be up to 100% in Money Markets and Cash.
NAV as on 30 June, 15 : `9.9962
Benchmark : -
Corpus as on 30 June, 15 : `0.003 Crs.
Investment StyleCredit Quality
High Mid LowInterest Rate Sensivity
High
Mid
Low
Cash Bank & Others 100.00
Total 100.00
Apex Pension 15 Investment FundULIF 040 20/01/10 PI3 110Fund Assure, Investment Report, June 2015
Instrument Industry/Rating % Of NAV

Equity Fund Debt Fund Hybrid Fund
Fund Details Portfolio
Fund Performance Rating Profile Maturity Profile
100.00%
Cash Bank & Others
100.00%
0.00%
20.00%
40.00%
60.00%
80.00%
100.00%
120.00%
Less than 1 Year
Asset Allocation
100.00%
Cash Bank & Others
Investment Objective : The investment objective for Apex Pension Investment Fund (20 Years) is to provide capital protection with a high level of safety and liquidity through judicious investment in high quality short term debt. The strategy is to generate better returns with low level of risk through investment in fixed interest securities having short term maturity profile. The risk profile of the fund is very low and asset allocation will be up to 100% in Money Markets and Cash.
NAV as on 30 June, 15 : `9.9950
Benchmark : -
Corpus as on 30 June, 15 : `0.02 Crs.
Investment StyleCredit Quality
High Mid LowInterest Rate Sensivity
High
Mid
Low
Cash Bank & Others 100.00
Total 100.00
Apex Pension 20 Investment FundULIF 041 20/01/10 PI4 110Fund Assure, Investment Report, June 2015
Instrument Industry/Rating % Of NAV
Note : The investment income and prices may go down as well as up.“Since Inception” and returns above “1 Year” are calculated as per CAGR.
Last 3 Months 31-Mar-15 10.0032 -0.08%
Last 6 Months 31-Dec-14 9.9949 0.00%
Last 1 Year 30-Jun-14 9.9950 0.00%
Last 2 Years 28-Jun-13 9.9943 0.00%
Last 3 Years 29-Jun-12 10.0145 -0.06%
Last 4 Years 30-Jun-11 10.0002 -0.01%
Last 5 Years 30-Jun-10 10.0019 -0.01%
Since Inception 20-Jan-10 10.0000 -0.01%
PERIOD DATE NAV NAVChange
Equity Fund Debt Fund Hybrid Fund
Fund Details Portfolio
Fund Performance Rating Profile Maturity Profile
100.00%
Cash Bank & Others
100.00%
0.00%
20.00%
40.00%
60.00%
80.00%
100.00%
120.00%
Less than 1 Year
Asset Allocation
100.00%
Cash Bank & Others
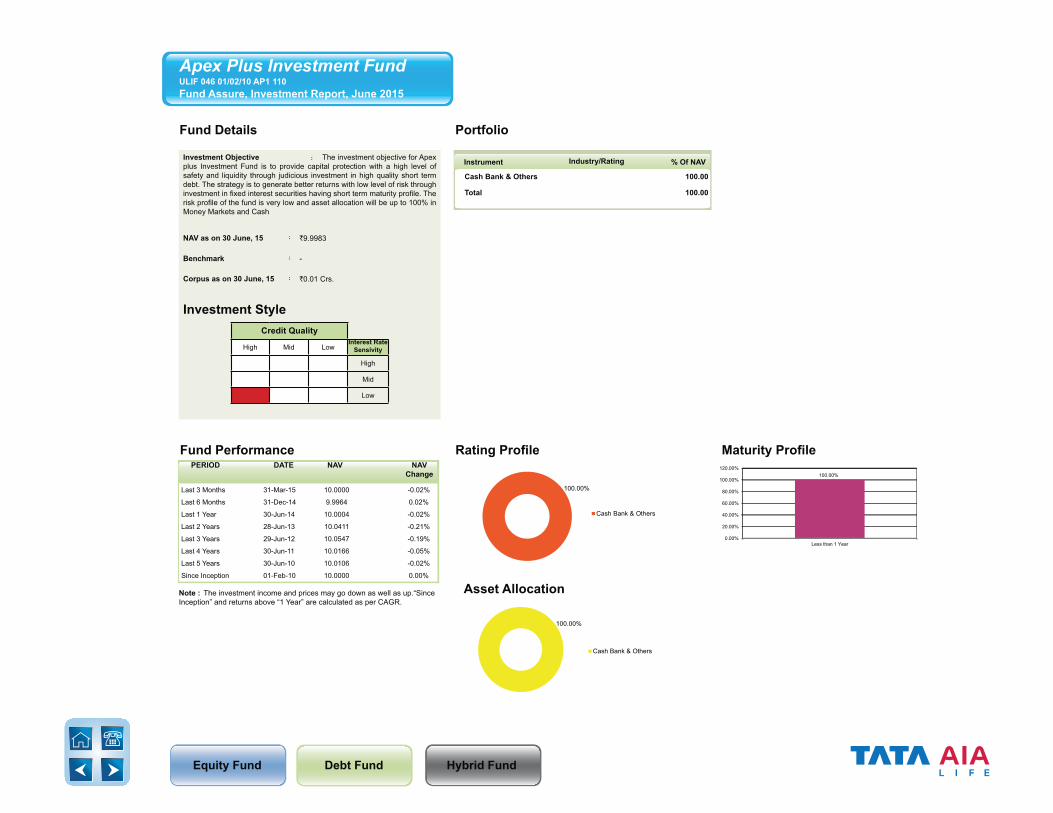
Investment Objective : The investment objective for Apex plus Investment Fund is to provide capital protection with a high level of safety and liquidity through judicious investment in high quality short term debt. The strategy is to generate better returns with low level of risk through investment in fixed interest securities having short term maturity profile. The risk profile of the fund is very low and asset allocation will be up to 100% in Money Markets and Cash
NAV as on 30 June, 15 : `9.9983
Benchmark : -
Corpus as on 30 June, 15 : `0.01 Crs.
Investment StyleCredit Quality
High Mid LowInterest Rate Sensivity
High
Mid
Low
Cash Bank & Others 100.00
Total 100.00
Instrument Industry/Rating % Of NAV
Note : The investment income and prices may go down as well as up.“Since Inception” and returns above “1 Year” are calculated as per CAGR.
Last 3 Months 31-Mar-15 10.0000 -0.02%
Last 6 Months 31-Dec-14 9.9964 0.02%
Last 1 Year 30-Jun-14 10.0004 -0.02%
Last 2 Years 28-Jun-13 10.0411 -0.21%
Last 3 Years 29-Jun-12 10.0547 -0.19%
Last 4 Years 30-Jun-11 10.0166 -0.05%
Last 5 Years 30-Jun-10 10.0106 -0.02%
Since Inception 01-Feb-10 10.0000 0.00%
PERIOD DATE NAV NAVChange
Apex Plus Investment FundULIF 046 01/02/10 AP1 110Fund Assure, Investment Report, June 2015
Equity Fund Debt Fund Hybrid Fund
Fund Details Portfolio
Fund Performance Rating Profile Maturity Profile
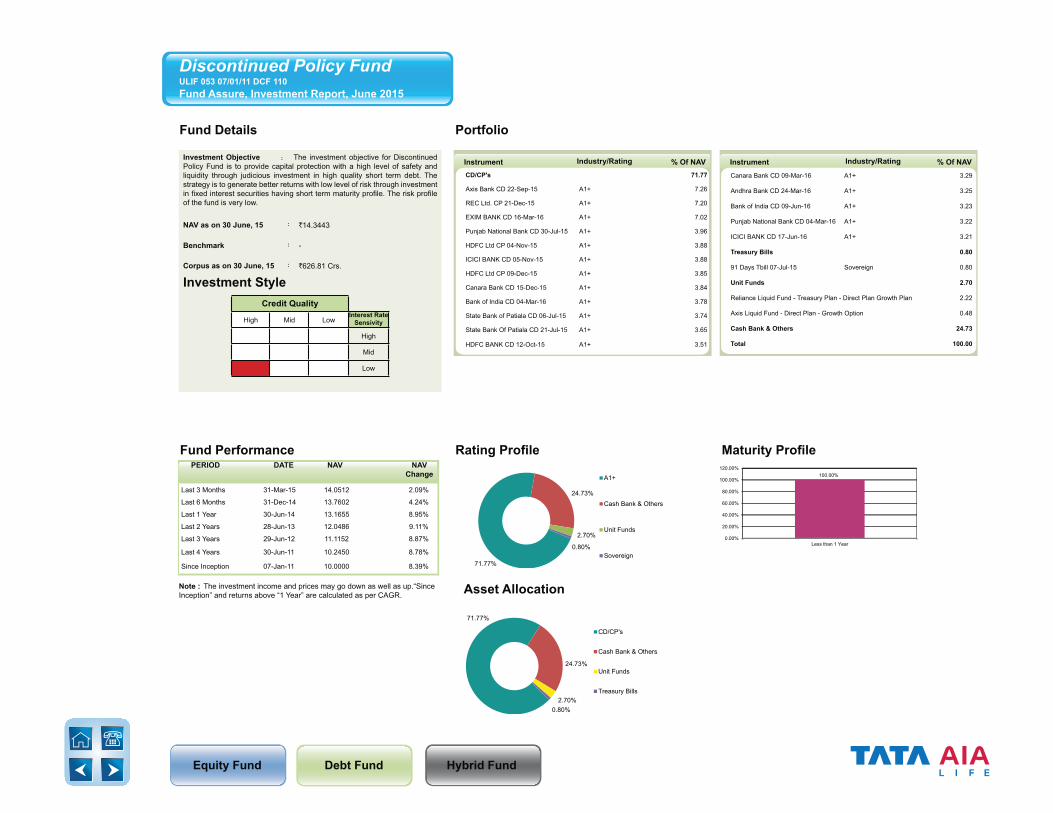
71.77%
24.73%
2.70%
0.80%
A1+
Cash Bank & Others
Unit Funds
Sovereign
100.00%
0.00%
20.00%
40.00%
60.00%
80.00%
100.00%
120.00%
Less than 1 Year
Asset Allocation
71.77%
24.73%
2.70%0.80%
CD/CP's
Cash Bank & Others
Unit Funds
Treasury Bills
Investment Objective : The investment objective for Discontinued Policy Fund is to provide capital protection with a high level of safety and liquidity through judicious investment in high quality short term debt. The strategy is to generate better returns with low level of risk through investment in fixed interest securities having short term maturity profile. The risk profile of the fund is very low.
NAV as on 30 June, 15 : `14.3443
Benchmark : -
Corpus as on 30 June, 15 : `626.81 Crs.
Investment StyleCredit Quality
High Mid LowInterest Rate Sensivity
High
Mid
Low
Discontinued Policy FundULIF 053 07/01/11 DCF 110Fund Assure, Investment Report, June 2015
Instrument Industry/Rating % Of NAV Instrument Industry/Rating % Of NAVCD/CP's 71.77
Axis Bank CD 22-Sep-15 A1+ 7.26
REC Ltd. CP 21-Dec-15 A1+ 7.20
EXIM BANK CD 16-Mar-16 A1+ 7.02
Punjab National Bank CD 30-Jul-15 A1+ 3.96
HDFC Ltd CP 04-Nov-15 A1+ 3.88
ICICI BANK CD 05-Nov-15 A1+ 3.88
HDFC Ltd CP 09-Dec-15 A1+ 3.85
Canara Bank CD 15-Dec-15 A1+ 3.84
Bank of India CD 04-Mar-16 A1+ 3.78
State Bank of Patiala CD 06-Jul-15 A1+ 3.74
State Bank Of Patiala CD 21-Jul-15 A1+ 3.65
HDFC BANK CD 12-Oct-15 A1+ 3.51
Canara Bank CD 09-Mar-16 A1+ 3.29
Andhra Bank CD 24-Mar-16 A1+ 3.25
Bank of India CD 09-Jun-16 A1+ 3.23
Punjab National Bank CD 04-Mar-16 A1+ 3.22
ICICI BANK CD 17-Jun-16 A1+ 3.21
Treasury Bills 0.80
91 Days Tbill 07-Jul-15 Sovereign 0.80
Unit Funds 2.70
Reliance Liquid Fund - Treasury Plan - Direct Plan Growth Plan 2.22
Axis Liquid Fund - Direct Plan - Growth Option 0.48
Cash Bank & Others 24.73
Total 100.00
Last 3 Months 31-Mar-15 14.0512 2.09%
Last 6 Months 31-Dec-14 13.7602 4.24%
Last 1 Year 30-Jun-14 13.1655 8.95%
Last 2 Years 28-Jun-13 12.0486 9.11%
Last 3 Years 29-Jun-12 11.1152 8.87%
Last 4 Years 30-Jun-11 10.2450 8.78%
Since Inception 07-Jan-11 10.0000 8.39%
PERIOD DATE NAV NAVChange
Note : The investment income and prices may go down as well as up.“Since Inception” and returns above “1 Year” are calculated as per CAGR.
Equity Fund Debt Fund Hybrid Fund
Fund Details Portfolio
Fund Performance Rating Profile Maturity Profile
100.00%
Cash Bank & Others
100.00%
0.00%
20.00%
40.00%
60.00%
80.00%
100.00%
120.00%
Less than 1 Year
Asset Allocation100.00%
Cash Bank & Others
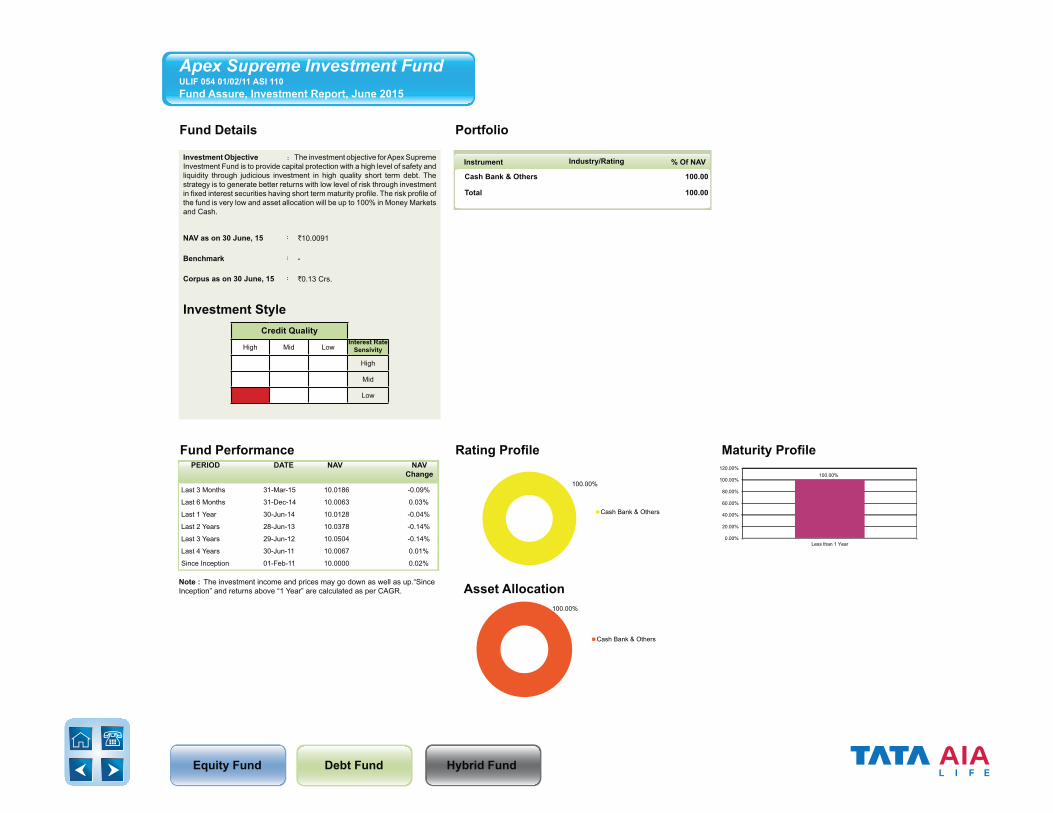
Investment Objective : The investment objective for Apex Supreme Investment Fund is to provide capital protection with a high level of safety and liquidity through judicious investment in high quality short term debt. The strategy is to generate better returns with low level of risk through investment in fixed interest securities having short term maturity profile. The risk profile of the fund is very low and asset allocation will be up to 100% in Money Markets and Cash.
NAV as on 30 June, 15 : `10.0091
Benchmark : -
Corpus as on 30 June, 15 : `0.13 Crs.
Investment StyleCredit Quality
High Mid LowInterest Rate Sensivity
High
Mid
Low
Cash Bank & Others 100.00
Total 100.00
Apex Supreme Investment FundULIF 054 01/02/11 ASI 110Fund Assure, Investment Report, June 2015
Instrument Industry/Rating % Of NAV
Last 3 Months 31-Mar-15 10.0186 -0.09%
Last 6 Months 31-Dec-14 10.0063 0.03%
Last 1 Year 30-Jun-14 10.0128 -0.04%
Last 2 Years 28-Jun-13 10.0378 -0.14%
Last 3 Years 29-Jun-12 10.0504 -0.14%
Last 4 Years 30-Jun-11 10.0067 0.01%
Since Inception 01-Feb-11 10.0000 0.02%
PERIOD DATE NAV NAVChange
Note : The investment income and prices may go down as well as up.“Since Inception” and returns above “1 Year” are calculated as per CAGR.
Equity Fund Debt Fund Hybrid Fund
Fund Details Portfolio
100.00%
Cash Bank & Others
100.00%
0.00%
20.00%
40.00%
60.00%
80.00%
100.00%
120.00%
Less than 1 Year
Asset Allocation100.00%
Cash Bank & Others
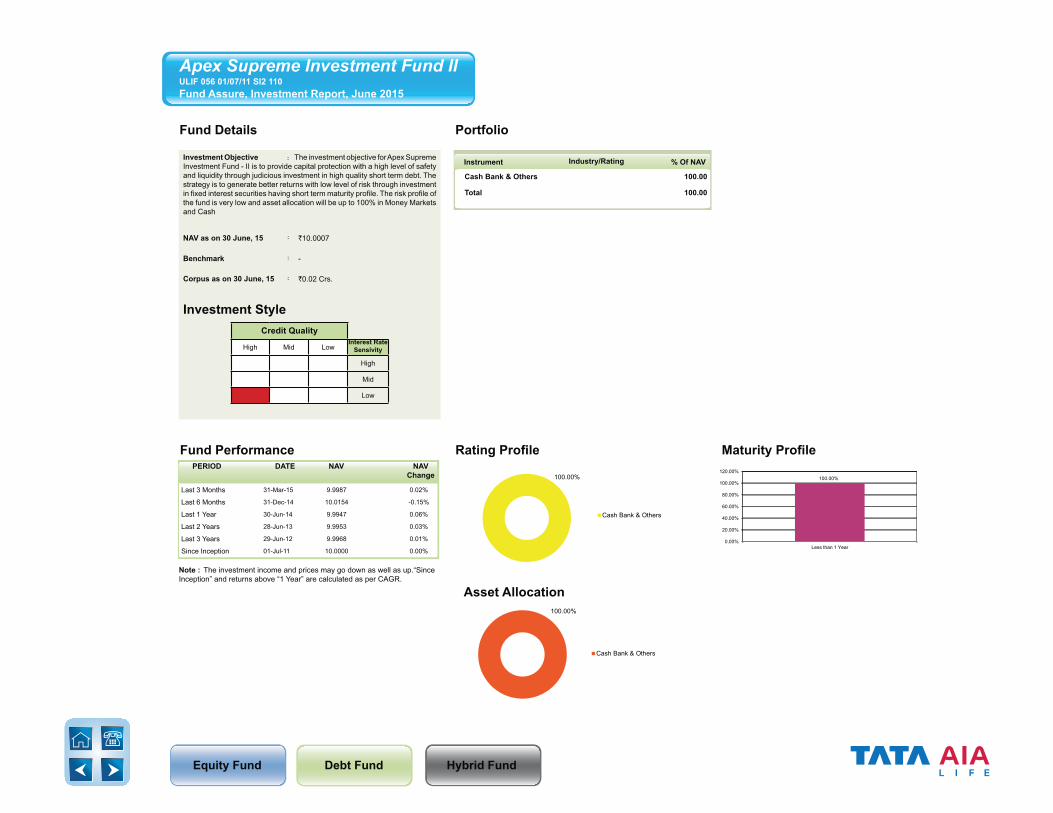
Investment Objective : The investment objective for Apex Supreme Investment Fund - II is to provide capital protection with a high level of safety and liquidity through judicious investment in high quality short term debt. The strategy is to generate better returns with low level of risk through investment in fixed interest securities having short term maturity profile. The risk profile of the fund is very low and asset allocation will be up to 100% in Money Markets and Cash
NAV as on 30 June, 15 : `10.0007
Benchmark : -
Corpus as on 30 June, 15 : `0.02 Crs.
Investment StyleCredit Quality
High Mid LowInterest Rate Sensivity
High
Mid
Low
Cash Bank & Others 100.00
Total 100.00
Apex Supreme Investment Fund IIULIF 056 01/07/11 SI2 110Fund Assure, Investment Report, June 2015
Instrument Industry/Rating % Of NAV
Last 3 Months 31-Mar-15 9.9987 0.02%
Last 6 Months 31-Dec-14 10.0154 -0.15%
Last 1 Year 30-Jun-14 9.9947 0.06%
Last 2 Years 28-Jun-13 9.9953 0.03%
Last 3 Years 29-Jun-12 9.9968 0.01%
Since Inception 01-Jul-11 10.0000 0.00%
PERIOD DATE NAV NAVChange
Note : The investment income and prices may go down as well as up.“Since Inception” and returns above “1 Year” are calculated as per CAGR.
Fund Performance Rating Profile Maturity Profile

Equity Fund Debt Fund Hybrid Fund
Fund Details Portfolio
100.00%
Cash Bank & Others
100.00%
0.00%
20.00%
40.00%
60.00%
80.00%
100.00%
120.00%
Less than 1 Year
Asset Allocation100.00%
Cash Bank & Others
Investment Objective : The investment objective for Apex Supreme Investment Fund - III is to provide capital protection with a high level of safety and liquidity through judicious investment in high quality short-term debt. The strategy is to generate better returns with low level of risk through investment in fixed interest securities having short term maturity profile. The risk profile of the fund is very low and asset allocation will be up to 100% in Money Markets and Cash.
Apex Supreme Investment Fund IIIULIF 058 01/11/11 SI3 110Fund Assure, Investment Report, June 2015
Cash Bank & Others 100.00
Total 100.00
Instrument Industry/Rating % Of NAV
Last 3 Months 31-Mar-15 10.0141 -0.14%
Last 6 Months 31-Dec-14 10.0183 -0.18%
Last 1 Year 30-Jun-14 10.0061 -0.06%
Last 2 Years 28-Jun-13 10.1026 -0.51%
Last 3 Years 29-Jun-12 9.9863 0.05%
Since Inception 1-Nov-11 10.0000 0.00%
PERIOD DATE NAV NAVChange
Note : The investment income and prices may go down as well as up.“Since Inception” and returns above “1 Year” are calculated as per CAGR.
Rating Profile Maturity ProfileFund Performance
NAV as on 30 June, 15 : `10.0003
Benchmark : -
Corpus as on 30 June, 15 : `0.17 Crs.
Investment StyleCredit Quality
High Mid LowInterest Rate Sensivity
High
Mid
Low
Equity Fund Debt Fund Hybrid Fund
Fund Details Portfolio
Fund Assure, Investment Report, June 2015
Future Growth Pension FundGrowth Enabler Fund
Future Capital Guarantee
Pension Fund
Capital Guarantee Fund
Future Balanced Pension Fund
Apex Return Lock-in-Fund II
Apex Return Lock-in-Fund
110% Capital Guarantee Fund
Aggressive Flexi Fund
Stable Flexi Fund
Growth Maximiser Fund
Whole Life Stable Growth Fund
Apex Plus Return Lock-in-Fund
Super 110% Capital Guarantee Fund
Apex Pension Return Lock-in Fund
Apex Pension 10 Return Lock-in Fund
Apex Pension 15 Return Lock-in Fund
Apex Pension 20 Return Lock-in Fund
Apex Plus Return Lock-in-Fund II
Apex Pension Return Lock-in-Fund II
Apex Pension 10 Return Lock-in Fund II
Apex Pension 15 Return Lock-in Fund II
Apex Pension 20 Return Lock-in Fund II
Apex Supreme Return Lock-in Fund
Apex Supreme Return Lock-in Fund II
Apex Supreme Return Lock-in Fund III Growth Fund
Balanced Fund
Stable Growth Fund
Aggressive Growth Fund
Whole Life Aggressive Growth Fund
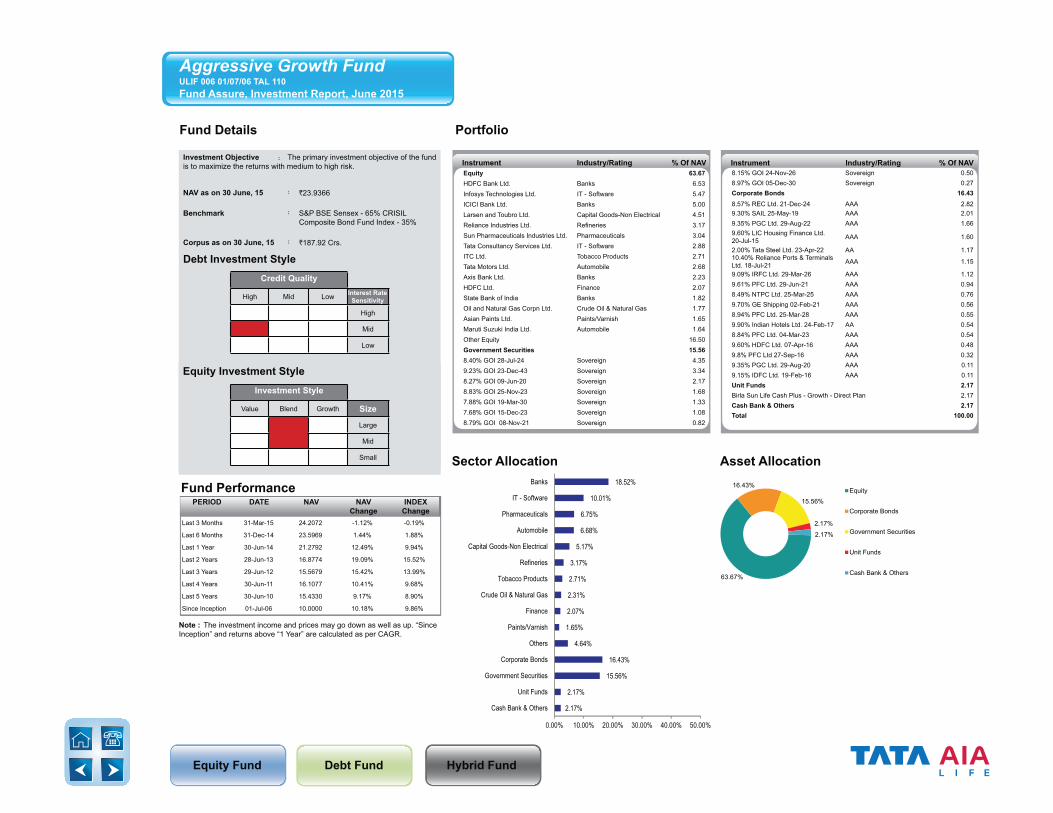
Equity Fund Debt Fund Hybrid Fund
Fund Details Portfolio
Instrument Industry/Rating % Of NAV
2.17%
2.17%
15.56%
16.43%
4.64%
1.65%
2.07%
2.31%
2.71%
3.17%
5.17%
6.68%
6.75%
10.01%
18.52%
0.00% 10.00% 20.00% 30.00% 40.00% 50.00%
Cash Bank & Others
Unit Funds
Government Securities
Corporate Bonds
Others
Paints/Varnish
Finance
Crude Oil & Natural Gas
Tobacco Products
Refineries
Capital Goods-Non Electrical
Automobile
Pharmaceuticals
IT - Software
Banks
63.67%
16.43%
15.56%
2.17%
2.17%
Equity
Corporate Bonds
Government Securities
Unit Funds
Cash Bank & Others
Sector Allocation Asset Allocation
Note : The investment income and prices may go down as well as up. “SinceInception” and returns above “1 Year” are calculated as per CAGR.
Fund Performance
Last 3 Months 31-Mar-15 24.2072 -1.12% -0.19%
Last 6 Months 31-Dec-14 23.5969 1.44% 1.88%
Last 1 Year 30-Jun-14 21.2792 12.49% 9.94%
Last 2 Years 28-Jun-13 16.8774 19.09% 15.52%
Last 3 Years 29-Jun-12 15.5679 15.42% 13.99%
Last 4 Years 30-Jun-11 16.1077 10.41% 9.68%
Last 5 Years 30-Jun-10 15.4330 9.17% 8.90%
Since Inception 01-Jul-06 10.0000 10.18% 9.86%
PERIOD DATE NAV NAVChange
INDEXChange
Instrument Industry/Rating % Of NAVInvestment Objective : The primary investment objective of the fund is to maximize the returns with medium to high risk.
NAV as on 30 June, 15 : `23.9366
Benchmark : S&P BSE Sensex - 65% CRISIL Composite Bond Fund Index - 35%
Corpus as on 30 June, 15 : `187.92 Crs.
Debt Investment StyleCredit Quality
High Mid Low Interest Rate Sensitivity
High
Mid
Low
Equity Investment StyleInvestment Style
Value Blend Growth Size
Large
Mid
Small
Aggressive Growth FundULIF 006 01/07/06 TAL 110Fund Assure, Investment Report, June 2015
Equity 63.67HDFC Bank Ltd. Banks 6.53Infosys Technologies Ltd. IT - Software 5.47ICICI Bank Ltd. Banks 5.00Larsen and Toubro Ltd. Capital Goods-Non Electrical 4.51Reliance Industries Ltd. Refineries 3.17Sun Pharmaceuticals Industries Ltd. Pharmaceuticals 3.04Tata Consultancy Services Ltd. IT - Software 2.88ITC Ltd. Tobacco Products 2.71Tata Motors Ltd. Automobile 2.68Axis Bank Ltd. Banks 2.23HDFC Ltd. Finance 2.07State Bank of India Banks 1.82Oil and Natural Gas Corpn Ltd. Crude Oil & Natural Gas 1.77Asian Paints Ltd. Paints/Varnish 1.65Maruti Suzuki India Ltd. Automobile 1.64Other Equity 16.50Government Securities 15.568.40% GOI 28-Jul-24 Sovereign 4.359.23% GOI 23-Dec-43 Sovereign 3.348.27% GOI 09-Jun-20 Sovereign 2.178.83% GOI 25-Nov-23 Sovereign 1.687.88% GOI 19-Mar-30 Sovereign 1.337.68% GOI 15-Dec-23 Sovereign 1.088.79% GOI 08-Nov-21 Sovereign 0.82
8.15% GOI 24-Nov-26 Sovereign 0.508.97% GOI 05-Dec-30 Sovereign 0.27Corporate Bonds 16.438.57% REC Ltd. 21-Dec-24 AAA 2.829.30% SAIL 25-May-19 AAA 2.019.35% PGC Ltd. 29-Aug-22 AAA 1.669.60% LIC Housing Finance Ltd. 20-Jul-15 AAA 1.60
2.00% Tata Steel Ltd. 23-Apr-22 AA 1.1710.40% Reliance Ports & Terminals Ltd. 18-Jul-21 AAA 1.15
9.09% IRFC Ltd. 29-Mar-26 AAA 1.129.61% PFC Ltd. 29-Jun-21 AAA 0.948.49% NTPC Ltd. 25-Mar-25 AAA 0.769.70% GE Shipping 02-Feb-21 AAA 0.568.94% PFC Ltd. 25-Mar-28 AAA 0.559.90% Indian Hotels Ltd. 24-Feb-17 AA 0.548.84% PFC Ltd. 04-Mar-23 AAA 0.549.60% HDFC Ltd. 07-Apr-16 AAA 0.489.8% PFC Ltd 27-Sep-16 AAA 0.329.35% PGC Ltd. 29-Aug-20 AAA 0.119.15% IDFC Ltd. 19-Feb-16 AAA 0.11Unit Funds 2.17Birla Sun Life Cash Plus - Growth - Direct Plan 2.17Cash Bank & Others 2.17Total 100.00
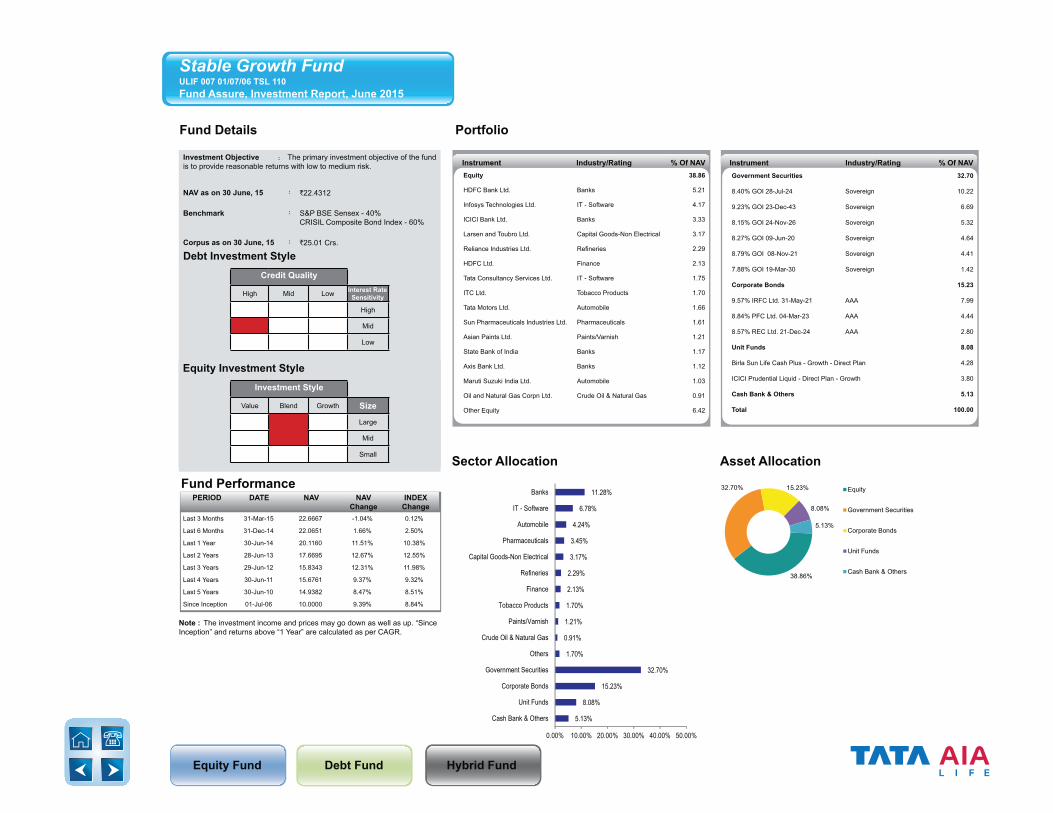
Equity Fund Debt Fund Hybrid Fund
Fund Details Portfolio
Instrument Industry/Rating % Of NAV Instrument Industry/Rating % Of NAV
Note : The investment income and prices may go down as well as up. “SinceInception” and returns above “1 Year” are calculated as per CAGR.
Fund Performance
Last 3 Months 31-Mar-15 22.6667 -1.04% 0.12%
Last 6 Months 31-Dec-14 22.0651 1.66% 2.50%
Last 1 Year 30-Jun-14 20.1160 11.51% 10.38%
Last 2 Years 28-Jun-13 17.6695 12.67% 12.55%
Last 3 Years 29-Jun-12 15.8343 12.31% 11.98%
Last 4 Years 30-Jun-11 15.6761 9.37% 9.32%
Last 5 Years 30-Jun-10 14.9382 8.47% 8.51%
Since Inception 01-Jul-06 10.0000 9.39% 8.84%
PERIOD DATE NAV NAVChange
INDEXChange
5.13%
8.08%
15.23%
32.70%
1.70%
0.91%
1.21%
1.70%
2.13%
2.29%
3.17%
3.45%
4.24%
6.78%
11.28%
0.00% 10.00% 20.00% 30.00% 40.00% 50.00%
Cash Bank & Others
Unit Funds
Corporate Bonds
Government Securities
Others
Crude Oil & Natural Gas
Paints/Varnish
Tobacco Products
Finance
Refineries
Capital Goods-Non Electrical
Pharmaceuticals
Automobile
IT - Software
Banks
38.86%
32.70% 15.23%
8.08%
5.13%
Equity
Government Securities
Corporate Bonds
Unit Funds
Cash Bank & Others
Sector Allocation Asset Allocation
Investment Objective : The primary investment objective of the fund is to provide reasonable returns with low to medium risk.
NAV as on 30 June, 15 : `22.4312
Benchmark : S&P BSE Sensex - 40%CRISIL Composite Bond Index - 60%
Corpus as on 30 June, 15 : `25.01 Crs.
Debt Investment StyleCredit Quality
High Mid Low Interest Rate Sensitivity
High
Mid
Low
Equity Investment StyleInvestment Style
Value Blend Growth Size
Large
Mid
Small
Stable Growth FundULIF 007 01/07/06 TSL 110Fund Assure, Investment Report, June 2015
Equity 38.86
HDFC Bank Ltd. Banks 5.21
Infosys Technologies Ltd. IT - Software 4.17
ICICI Bank Ltd. Banks 3.33
Larsen and Toubro Ltd. Capital Goods-Non Electrical 3.17
Reliance Industries Ltd. Refineries 2.29
HDFC Ltd. Finance 2.13
Tata Consultancy Services Ltd. IT - Software 1.75
ITC Ltd. Tobacco Products 1.70
Tata Motors Ltd. Automobile 1.66
Sun Pharmaceuticals Industries Ltd. Pharmaceuticals 1.61
Asian Paints Ltd. Paints/Varnish 1.21
State Bank of India Banks 1.17
Axis Bank Ltd. Banks 1.12
Maruti Suzuki India Ltd. Automobile 1.03
Oil and Natural Gas Corpn Ltd. Crude Oil & Natural Gas 0.91
Other Equity 6.42
Government Securities 32.70
8.40% GOI 28-Jul-24 Sovereign 10.22
9.23% GOI 23-Dec-43 Sovereign 6.69
8.15% GOI 24-Nov-26 Sovereign 5.32
8.27% GOI 09-Jun-20 Sovereign 4.64
8.79% GOI 08-Nov-21 Sovereign 4.41
7.88% GOI 19-Mar-30 Sovereign 1.42
Corporate Bonds 15.23
9.57% IRFC Ltd. 31-May-21 AAA 7.99
8.84% PFC Ltd. 04-Mar-23 AAA 4.44
8.57% REC Ltd. 21-Dec-24 AAA 2.80
Unit Funds 8.08
Birla Sun Life Cash Plus - Growth - Direct Plan 4.28
ICICI Prudential Liquid - Direct Plan - Growth 3.80
Cash Bank & Others 5.13
Total 100.00
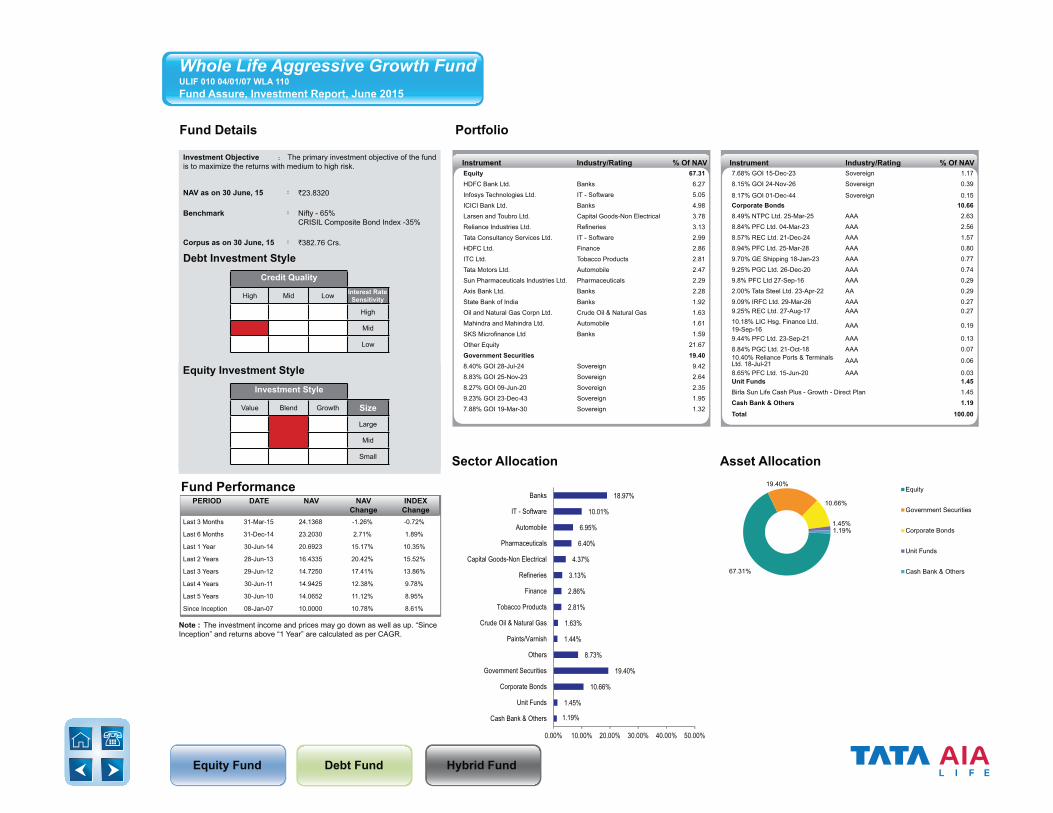
Equity Fund Debt Fund Hybrid Fund
Fund Details Portfolio
Instrument Industry/Rating % Of NAV Instrument Industry/Rating % Of NAV
Note : The investment income and prices may go down as well as up. “SinceInception” and returns above “1 Year” are calculated as per CAGR.
Fund Performance
Last 3 Months 31-Mar-15 24.1368 -1.26% -0.72%
Last 6 Months 31-Dec-14 23.2030 2.71% 1.89%
Last 1 Year 30-Jun-14 20.6923 15.17% 10.35%
Last 2 Years 28-Jun-13 16.4335 20.42% 15.52%
Last 3 Years 29-Jun-12 14.7250 17.41% 13.86%
Last 4 Years 30-Jun-11 14.9425 12.38% 9.78%
Last 5 Years 30-Jun-10 14.0652 11.12% 8.95%
Since Inception 08-Jan-07 10.0000 10.78% 8.61%
PERIOD DATE NAV NAVChange
INDEXChange
Sector Allocation Asset Allocation
Investment Objective : The primary investment objective of the fund is to maximize the returns with medium to high risk.
NAV as on 30 June, 15 : `23.8320
Benchmark : Nifty - 65%CRISIL Composite Bond Index -35%
Corpus as on 30 June, 15 : `382.76 Crs.
Debt Investment StyleCredit Quality
High Mid Low Interest Rate Sensitivity
High
Mid
Low
Equity Investment StyleInvestment Style
Value Blend Growth Size
Large
Mid
Small
Whole Life Aggressive Growth FundULIF 010 04/01/07 WLA 110 Fund Assure, Investment Report, June 2015
Equity 64.99Infosys Technologies Ltd. IT - Software 5.67Reliance Industries Ltd. Refineries 5.56ITC Ltd. Tobacco Products 5.54HDFC Bank Ltd. Banks 4.10ICICI Bank Ltd. Banks 3.70Tata Consultancy Services Ltd. IT - Software 3.38Sun Pharmaceuticals Industries Ltd. Pharmaceuticals 2.99HDFC Ltd. Finance 2.48Larsen and Toubro Ltd. Capital Goods-Non Electrical 1.62Tata Motors Ltd. Automobile 1.61Mahindra and Mahindra Ltd. Automobile 1.56State Bank of India Banks 1.53HCL Technologies Ltd. IT - Software 1.49Bharti Airtel Ltd. Telecomm-Service 1.38Dr. Reddys Laboratories Ltd. Pharmaceuticals 1.32Coal India Ltd Mining & Mineral Products 1.26Oil and Natural Gas Corpn Ltd. Crude Oil & Natural Gas 1.26Glaxosmithkline Consumer Healthcare Ltd. FMCG 1.17
Other Equity below 1% corpus 17.35Government Securities 8.588.20% GOI 24-Sep-25 Sovereign 4.368.79% GOI 08-Nov-21 Sovereign 2.139.15% GOI 14-Nov-24 Sovereign 0.998.83% GOI 12-Dec-41 Sovereign 0.697.83% GOI 11-04-2018 Sovereign 0.22
8.33% GOI 09-Jul-26 Sovereign 0.148.28% GOI 15-Feb-32 Sovereign 0.06Corporate Bonds 19.368.94% PFC Ltd. 25-Mar-28 AAA 2.9610.65% Indiabulls Fin Ser Ltd. 16-Jul-15 AA 1.57
2.00% Tata Steel Ltd. 23-Apr-22 AA 1.532.00% Indian Hotels Ltd. 09-Dec-14 AA 1.479.44% PFC Ltd. 23-Sep-21 AAA 1.407.60% HDFC Ltd. 21-Dec-17 AAA 1.338.70% PFC Ltd. 14-May-15 AAA 1.1210.70% Sundaram Finance Ltd. 06-Jun-14 AA+ 1.03
8.30% HDFC Ltd. 23-Jun-15 AAA 1.009.70% GE Shipping 18-Jan-23 AAA 0.949.57% IRFC Ltd. 31-May-21 AAA 0.928.40% HDFC Ltd. 08-Dec-14 AAA 0.707.95% PFC Ltd. 24-Feb-16 AAA 0.688.50% PFC Ltd. 15-Dec-14 AAA 0.569.95% SBI 16-Mar-26 AAA 0.548.19% IRFC Ltd. 27-Apr-19 AAA 0.549.70% HDFC Ltd. 07-Jun-17 AAA 0.489.09% IRFC Ltd. 29-Mar-26 AAA 0.289.18% Tata Sons Ltd. 23-Nov-20 AAA 0.228.28% LIC Housing Finance Ltd. 29-Jun-15 AAA 0.11
Unit Funds 5.95Kotak Liquid-Plan A -(Growth) - Direct 4.46Birla Sun Life Cash Plus - Growth - Direct Plan 1.49Cash Bank & Others 1.13Total 100.00
Equity 67.31HDFC Bank Ltd. Banks 6.27Infosys Technologies Ltd. IT - Software 5.05ICICI Bank Ltd. Banks 4.98Larsen and Toubro Ltd. Capital Goods-Non Electrical 3.78Reliance Industries Ltd. Refineries 3.13Tata Consultancy Services Ltd. IT - Software 2.99HDFC Ltd. Finance 2.86ITC Ltd. Tobacco Products 2.81Tata Motors Ltd. Automobile 2.47Sun Pharmaceuticals Industries Ltd. Pharmaceuticals 2.29Axis Bank Ltd. Banks 2.28State Bank of India Banks 1.92Oil and Natural Gas Corpn Ltd. Crude Oil & Natural Gas 1.63Mahindra and Mahindra Ltd. Automobile 1.61SKS Microfinance Ltd Banks 1.59Other Equity 21.67Government Securities 19.408.40% GOI 28-Jul-24 Sovereign 9.428.83% GOI 25-Nov-23 Sovereign 2.648.27% GOI 09-Jun-20 Sovereign 2.359.23% GOI 23-Dec-43 Sovereign 1.957.88% GOI 19-Mar-30 Sovereign 1.32
7.68% GOI 15-Dec-23 Sovereign 1.178.15% GOI 24-Nov-26 Sovereign 0.39
8.17% GOI 01-Dec-44 Sovereign 0.15Corporate Bonds 10.668.49% NTPC Ltd. 25-Mar-25 AAA 2.638.84% PFC Ltd. 04-Mar-23 AAA 2.568.57% REC Ltd. 21-Dec-24 AAA 1.578.94% PFC Ltd. 25-Mar-28 AAA 0.809.70% GE Shipping 18-Jan-23 AAA 0.779.25% PGC Ltd. 26-Dec-20 AAA 0.749.8% PFC Ltd 27-Sep-16 AAA 0.292.00% Tata Steel Ltd. 23-Apr-22 AA 0.299.09% IRFC Ltd. 29-Mar-26 AAA 0.279.25% REC Ltd. 27-Aug-17 AAA 0.2710.18% LIC Hsg. Finance Ltd. 19-Sep-16 AAA 0.19
9.44% PFC Ltd. 23-Sep-21 AAA 0.138.84% PGC Ltd. 21-Oct-18 AAA 0.0710.40% Reliance Ports & Terminals Ltd. 18-Jul-21 AAA 0.06
8.65% PFC Ltd. 15-Jun-20 AAA 0.03Unit Funds 1.45Birla Sun Life Cash Plus - Growth - Direct Plan 1.45Cash Bank & Others 1.19
Total 100.00
1.19%
1.45%
10.66%
19.40%
8.73%
1.44%
1.63%
2.81%
2.86%
3.13%
4.37%
6.40%
6.95%
10.01%
18.97%
0.00% 10.00% 20.00% 30.00% 40.00% 50.00%
Cash Bank & Others
Unit Funds
Corporate Bonds
Government Securities
Others
Paints/Varnish
Crude Oil & Natural Gas
Tobacco Products
Finance
Refineries
Capital Goods-Non Electrical
Pharmaceuticals
Automobile
IT - Software
Banks
67.31%
19.40%
10.66%
1.45%1.19%
Equity
Government Securities
Corporate Bonds
Unit Funds
Cash Bank & Others

Equity Fund Debt Fund Hybrid Fund
Fund Details Portfolio
Instrument Industry/Rating % Of NAV Instrument Industry/Rating % Of NAV
Note : The investment income and prices may go down as well as up. “SinceInception” and returns above “1 Year” are calculated as per CAGR.
Fund Performance
Last 3 Months 31-Mar-15 20.4494 -0.73% -0.21%
Last 6 Months 31-Dec-14 19.7812 2.62% 2.50%
Last 1 Year 30-Jun-14 17.8804 13.53% 10.64%
Last 2 Years 28-Jun-13 15.3306 15.07% 12.55%
Last 3 Years 29-Jun-12 13.7174 13.96% 11.90%
Last 4 Years 30-Jun-11 13.4587 10.82% 9.38%
Last 5 Years 30-Jun-10 12.6982 9.84% 8.55%
Since Inception 08-Jan-07 10.0000 8.71% 8.10%
PERIOD DATE NAV NAVChange
INDEXChange
1.48%
3.98%
20.11%
31.65%
4.54%
1.11%
1.31%
1.69%
1.76%
2.48%
2.55%
4.30%
4.51%
6.73%
11.80%
0.00% 10.00% 20.00% 30.00% 40.00%
Cash Bank & Others
Unit Funds
Corporate Bonds
Government Securities
Others
Miscellaneous
Auto Ancillaries
Tobacco Products
Finance
Refineries
Capital Goods-Non Electrical
Automobile
Pharmaceuticals
IT - Software
Banks
42.79%
31.65% 20.11%
3.98%1.48%
Equity
Government Securities
Corporate Bonds
Unit Funds
Cash Bank & Others
Sector Allocation Asset Allocation
Investment Objective : The primary investment objective of the fund is to provide reasonable returns with low to medium risk.
NAV as on 30 June, 15 : `20.2996
Benchmark : Nifty - 40%CRISIL Composite Bond Index - 60%
Corpus as on 30 June, 15 : `82.52 Crs.
Debt Investment StyleCredit Quality
High Mid Low Interest Rate Sensitivity
High
Mid
Low
Equity Investment StyleInvestment Style
Value Blend Growth Size
Large
Mid
Small
Whole Life Stable Growth FundULIF 011 04/01/07 WLS 110Fund Assure, Investment Report, June 2015
Equity 42.79
HDFC Bank Ltd. Banks 4.27
ICICI Bank Ltd. Banks 3.36
Infosys Technologies Ltd. IT - Software 3.04
Larsen and Toubro Ltd. Capital Goods-Non Electrical 2.55
Reliance Industries Ltd. Refineries 2.48
Tata Consultancy Services Ltd. IT - Software 2.25
Sun Pharmaceuticals Industries Ltd. Pharmaceuticals 1.93
ITC Ltd. Tobacco Products 1.69
Tata Motors Ltd. Automobile 1.67
State Bank of India Banks 1.24
Axis Bank Ltd. Banks 1.22
AIA Engineering Ltd. Miscellaneous 1.11
HDFC Ltd. Finance 1.07
Ultratech Cement Ltd. Cement 0.98
Voltas Ltd. Diversified 0.96
Other Equity 12.97
Government Securities 31.65
8.40% GOI 28-Jul-24 Sovereign 13.46
9.23% GOI 23-Dec-43 Sovereign 4.34
8.27% GOI 09-Jun-20 Sovereign 3.27
8.83% GOI 25-Nov-23 Sovereign 2.94
7.68% GOI 15-Dec-23 Sovereign 2.74
7.88% GOI 19-Mar-30 Sovereign 2.11
8.15% GOI 24-Nov-26 Sovereign 1.46
8.79% GOI 08-Nov-21 Sovereign 0.83
8.17% GOI 01-Dec-44 Sovereign 0.50
Corporate Bonds 20.11
8.84% PFC Ltd. 04-Mar-23 AAA 3.43
8.57% REC Ltd. 21-Dec-24 AAA 3.27
8.19% IRFC Ltd. 27-Apr-19 AAA 3.00
9.35% PGC Ltd. 29-Aug-22 AAA 2.51
9.97% IL&FS 28-Sep-16 AAA 2.47
8.49% NTPC Ltd. 25-Mar-25 AAA 1.80
9.30% PGC Ltd. 28-Jun-21 AAA 1.56
9.70% GE Shipping 18-Jan-23 AAA 1.2810.40% Reliance Ports & Terminals Ltd. 18-Jul-21 AAA 0.79
Unit Funds 3.98
Birla Sun Life Cash Plus - Growth - Direct Plan 3.98
Cash Bank & Others 1.48
Total 100.00
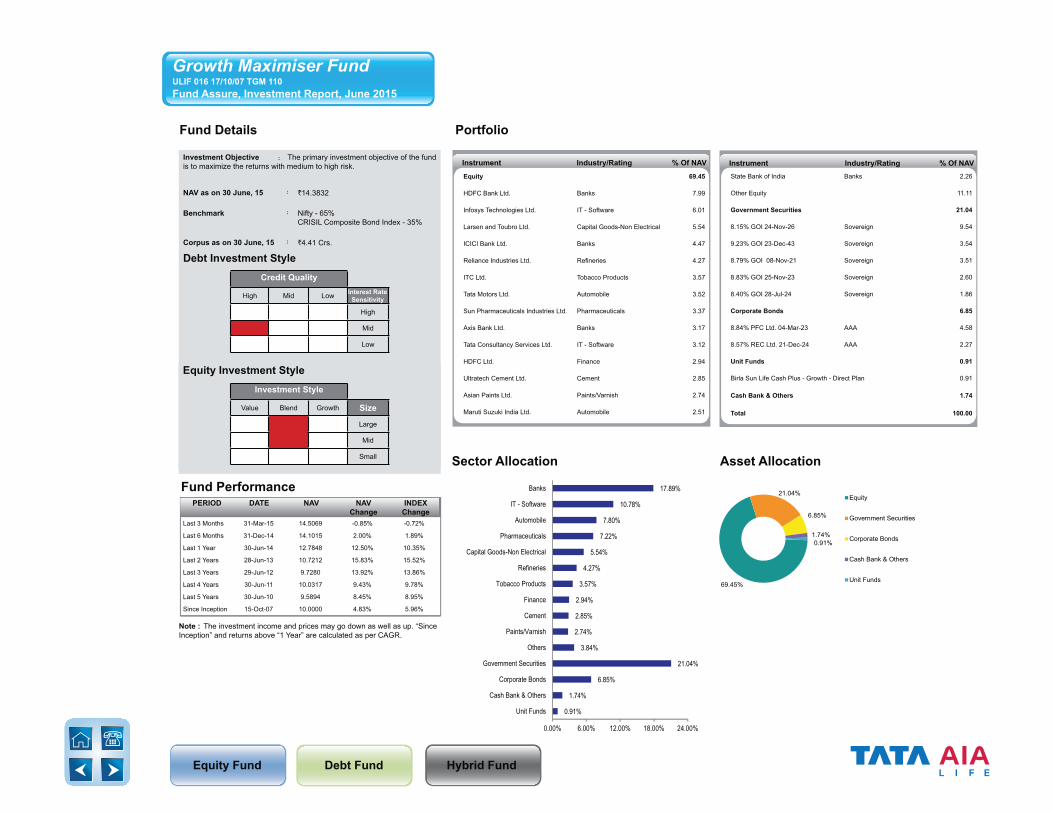
Equity Fund Debt Fund Hybrid Fund
Fund Details Portfolio
Instrument Industry/Rating % Of NAV
0.91%
1.74%
6.85%
21.04%
3.84%
2.74%
2.85%
2.94%
3.57%
4.27%
5.54%
7.22%
7.80%
10.78%
17.89%
0.00% 6.00% 12.00% 18.00% 24.00%
Unit Funds
Cash Bank & Others
Corporate Bonds
Government Securities
Others
Paints/Varnish
Cement
Finance
Tobacco Products
Refineries
Capital Goods-Non Electrical
Pharmaceuticals
Automobile
IT - Software
Banks
69.45%
21.04%
6.85%
1.74%0.91%
Equity
Government Securities
Corporate Bonds
Cash Bank & Others
Unit Funds
Sector Allocation Asset Allocation
Investment Objective : The primary investment objective of the fund is to maximize the returns with medium to high risk.
NAV as on 30 June, 15 : `14.3832
Benchmark : Nifty - 65%CRISIL Composite Bond Index - 35%
Corpus as on 30 June, 15 : `4.41 Crs.
Debt Investment StyleCredit Quality
High Mid Low Interest Rate Sensitivity
High
Mid
Low
Equity Investment StyleInvestment Style
Value Blend Growth Size
Large
Mid
Small
Instrument Industry/Rating % Of NAV
Growth Maximiser FundULIF 016 17/10/07 TGM 110Fund Assure, Investment Report, June 2015
Note : The investment income and prices may go down as well as up. “SinceInception” and returns above “1 Year” are calculated as per CAGR.
Last 3 Months 31-Mar-15 14.5069 -0.85% -0.72%
Last 6 Months 31-Dec-14 14.1015 2.00% 1.89%
Last 1 Year 30-Jun-14 12.7848 12.50% 10.35%
Last 2 Years 28-Jun-13 10.7212 15.83% 15.52%
Last 3 Years 29-Jun-12 9.7280 13.92% 13.86%
Last 4 Years 30-Jun-11 10.0317 9.43% 9.78%
Last 5 Years 30-Jun-10 9.5894 8.45% 8.95%
Since Inception 15-Oct-07 10.0000 4.83% 5.96%
PERIOD DATE NAV NAVChange
INDEXChange
Fund Performance
Equity 69.45
HDFC Bank Ltd. Banks 7.99
Infosys Technologies Ltd. IT - Software 6.01
Larsen and Toubro Ltd. Capital Goods-Non Electrical 5.54
ICICI Bank Ltd. Banks 4.47
Reliance Industries Ltd. Refineries 4.27
ITC Ltd. Tobacco Products 3.57
Tata Motors Ltd. Automobile 3.52
Sun Pharmaceuticals Industries Ltd. Pharmaceuticals 3.37
Axis Bank Ltd. Banks 3.17
Tata Consultancy Services Ltd. IT - Software 3.12
HDFC Ltd. Finance 2.94
Ultratech Cement Ltd. Cement 2.85
Asian Paints Ltd. Paints/Varnish 2.74
Maruti Suzuki India Ltd. Automobile 2.51
State Bank of India Banks 2.26
Other Equity 11.11
Government Securities 21.04
8.15% GOI 24-Nov-26 Sovereign 9.54
9.23% GOI 23-Dec-43 Sovereign 3.54
8.79% GOI 08-Nov-21 Sovereign 3.51
8.83% GOI 25-Nov-23 Sovereign 2.60
8.40% GOI 28-Jul-24 Sovereign 1.86
Corporate Bonds 6.85
8.84% PFC Ltd. 04-Mar-23 AAA 4.58
8.57% REC Ltd. 21-Dec-24 AAA 2.27
Unit Funds 0.91
Birla Sun Life Cash Plus - Growth - Direct Plan 0.91
Cash Bank & Others 1.74
Total 100.00

Equity Fund Debt Fund Hybrid Fund
Fund Details Portfolio
Instrument Industry/Rating % Of NAV
Note : The investment income and prices may go down as well as up. “SinceInception” and returns above “1 Year” are calculated as per CAGR.
Fund Performance
Last 3 Months 31-Mar-15 16.2481 -0.70% -0.21%
Last 6 Months 31-Dec-14 15.7028 2.75% 2.50%
Last 1 Year 30-Jun-14 14.4415 11.72% 10.64%
Last 2 Years 28-Jun-13 12.8455 12.07% 12.55%
Last 3 Years 29-Jun-12 11.5172 11.89% 11.90%
Last 4 Years 30-Jun-11 11.4889 8.86% 9.38%
Last 5 Years 30-Jun-10 11.0336 7.90% 8.55%
Since Inception 15-Oct-07 10.0000 6.40% 6.52%
PERIOD DATE NAV NAVChange
INDEXChange
3.52%
13.65%
41.29%
4.13%
1.33%
1.74%
1.83%
2.28%
2.32%
2.51%
3.68%
3.98%
5.68%
12.05%
0.00% 15.00% 30.00% 45.00% 60.00%
Unit Funds
Cash Bank & Others
Government Securities
Others
Paints/Varnish
Cement
Tobacco Products
Finance
Refineries
Capital Goods-Non Electrical
Pharmaceuticals
Automobile
IT - Software
Banks
41.55%
41.29%
13.65%
3.52%
Equity
Government Securities
Cash Bank & Others
Unit Funds
Sector Allocation Asset Allocation
Investment Objective : The primary investment objective of the fund is to provide reasonable returns with low to medium risk.
NAV as on 30 June, 15 : `16.1344
Benchmark : Nifty - 40%CRISIL Composite Bond Index - 60%
Corpus as on 30 June, 15 : `0.57 Crs.
Debt Investment StyleCredit Quality
High Mid Low Interest Rate Sensitivity
High
Mid
Low
Equity Investment StyleInvestment Style
Value Blend Growth Size
Large
Mid
Small
Growth Enabler FundULIF 015 17/10/07 TGE 110Fund Assure, Investment Report, June 2015
Equity 41.55HDFC Bank Ltd. Banks 4.32ICICI Bank Ltd. Banks 3.25Infosys Technologies Ltd. IT - Software 3.12Larsen and Toubro Ltd. Capital Goods-Non Electrical 2.51Reliance Industries Ltd. Refineries 2.32HDFC Ltd. Finance 2.28Axis Bank Ltd. Banks 1.97Tata Consultancy Services Ltd. IT - Software 1.89ITC Ltd. Tobacco Products 1.83Ultratech Cement Ltd. Cement 1.74Maruti Suzuki India Ltd. Automobile 1.63Sun Pharmaceuticals Industries Ltd. Pharmaceuticals 1.54Tata Motors Ltd. Automobile 1.34Asian Paints Ltd. Paints/Varnish 1.33State Bank of India Banks 1.25Other Equity 9.23Government Securities 41.298.15% GOI 24-Nov-26 Sovereign 29.959.23% GOI 23-Dec-43 Sovereign 5.898.79% GOI 08-Nov-21 Sovereign 5.45Unit Funds 3.52Birla Sun Life Cash Plus - Growth - Direct Plan 1.76ICICI Prudential Liquid - Direct Plan - Growth 1.76
Cash Bank & Others 13.65Total 100.00
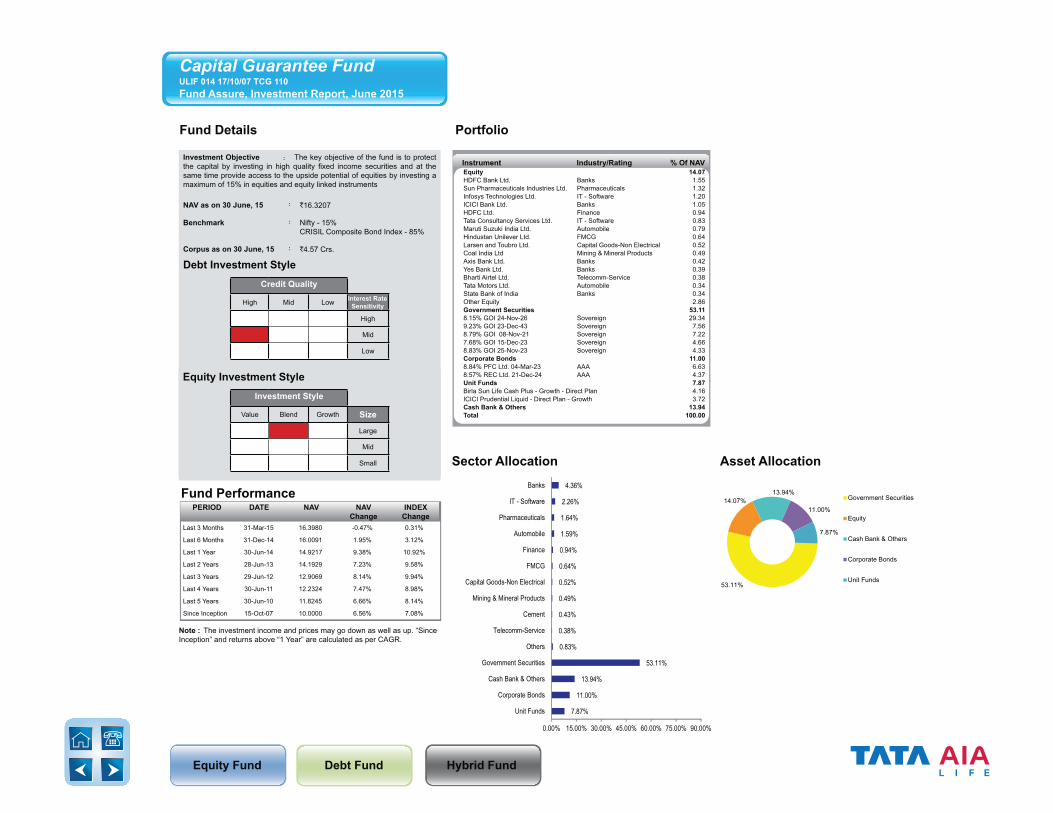
Equity Fund Debt Fund Hybrid Fund
Fund Details Portfolio
Instrument Industry/Rating % Of NAV
Note : The investment income and prices may go down as well as up. “SinceInception” and returns above “1 Year” are calculated as per CAGR.
Fund Performance
Last 3 Months 31-Mar-15 16.3980 -0.47% 0.31%
Last 6 Months 31-Dec-14 16.0091 1.95% 3.12%
Last 1 Year 30-Jun-14 14.9217 9.38% 10.92%
Last 2 Years 28-Jun-13 14.1929 7.23% 9.58%
Last 3 Years 29-Jun-12 12.9069 8.14% 9.94%
Last 4 Years 30-Jun-11 12.2324 7.47% 8.98%
Last 5 Years 30-Jun-10 11.8245 6.66% 8.14%
Since Inception 15-Oct-07 10.0000 6.56% 7.08%
PERIOD DATE NAV NAVChange
INDEXChange
7.87%
11.00%
13.94%
53.11%
0.83%
0.38%
0.43%
0.49%
0.52%
0.64%
0.94%
1.59%
1.64%
2.26%
4.36%
0.00% 15.00% 30.00% 45.00% 60.00% 75.00% 90.00%
Unit Funds
Corporate Bonds
Cash Bank & Others
Government Securities
Others
Telecomm-Service
Cement
Mining & Mineral Products
Capital Goods-Non Electrical
FMCG
Finance
Automobile
Pharmaceuticals
IT - Software
Banks
53.11%
14.07%13.94%
11.00%
7.87%
Government Securities
Equity
Cash Bank & Others
Corporate Bonds
Unit Funds
Sector Allocation Asset Allocation
Investment Objective : The key objective of the fund is to protect the capital by investing in high quality fixed income securities and at the same time provide access to the upside potential of equities by investing a maximum of 15% in equities and equity linked instruments
NAV as on 30 June, 15 : `16.3207
Benchmark : Nifty - 15%CRISIL Composite Bond Index - 85%
Corpus as on 30 June, 15 : `4.57 Crs.
Debt Investment StyleCredit Quality
High Mid Low Interest Rate Sensitivity
High
Mid
Low
Equity Investment StyleInvestment Style
Value Blend Growth Size
Large
Mid
Small
Capital Guarantee FundULIF 014 17/10/07 TCG 110Fund Assure, Investment Report, June 2015
Equity 14.07HDFC Bank Ltd. Banks 1.55Sun Pharmaceuticals Industries Ltd. Pharmaceuticals 1.32Infosys Technologies Ltd. IT - Software 1.20ICICI Bank Ltd. Banks 1.05HDFC Ltd. Finance 0.94Tata Consultancy Services Ltd. IT - Software 0.83Maruti Suzuki India Ltd. Automobile 0.79Hindustan Unilever Ltd. FMCG 0.64Larsen and Toubro Ltd. Capital Goods-Non Electrical 0.52Coal India Ltd Mining & Mineral Products 0.49Axis Bank Ltd. Banks 0.42Yes Bank Ltd. Banks 0.39Bharti Airtel Ltd. Telecomm-Service 0.38Tata Motors Ltd. Automobile 0.34State Bank of India Banks 0.34Other Equity 2.86Government Securities 53.118.15% GOI 24-Nov-26 Sovereign 29.349.23% GOI 23-Dec-43 Sovereign 7.568.79% GOI 08-Nov-21 Sovereign 7.227.68% GOI 15-Dec-23 Sovereign 4.668.83% GOI 25-Nov-23 Sovereign 4.33Corporate Bonds 11.008.84% PFC Ltd. 04-Mar-23 AAA 6.638.57% REC Ltd. 21-Dec-24 AAA 4.37Unit Funds 7.87Birla Sun Life Cash Plus - Growth - Direct Plan 4.16ICICI Prudential Liquid - Direct Plan - Growth 3.72Cash Bank & Others 13.94Total 100.00

Equity Fund Debt Fund Hybrid Fund
Fund Details Portfolio
Instrument Industry/Rating % Of NAV
Note : The investment income and prices may go down as well as up. “SinceInception” and returns above “1 Year” are calculated as per CAGR.
Fund Performance
Last 3 Months 31-Mar-15 16.0325 -0.50% 0.31%
Last 6 Months 31-Dec-14 15.6369 2.02% 3.12%
Last 1 Year 30-Jun-14 14.5071 9.97% 10.92%
Last 2 Years 28-Jun-13 13.7701 7.64% 9.58%
Last 3 Years 29-Jun-12 12.4985 8.47% 9.94%
Last 4 Years 30-Jun-11 11.8411 7.74% 8.98%
Last 5 Years 30-Jun-10 11.4625 6.83% 8.14%
Since Inception 04-Feb-08 10.0000 6.51% 7.06%
PERIOD DATE NAV NAVChange
INDEXChange
7.55%
13.19%
13.98%
51.25%
0.75%
0.40%
0.45%
0.47%
0.57%
0.64%
0.83%
1.29%
1.90%
2.40%
4.33%
0.00% 20.00% 40.00% 60.00% 80.00%
Unit Funds
Cash Bank & Others
Corporate Bonds
Government Securities
Others
Telecomm-Service
Mining & Mineral Products
Cement
Capital Goods-Non Electrical
FMCG
Finance
Pharmaceuticals
Automobile
IT - Software
Banks
51.25%
14.03%13.98%
13.19%
7.55%
Government Securities
Equity
Corporate Bonds
Cash Bank & Others
Unit Funds
Sector Allocation Asset Allocation
Investment Objective : The key objective of the fund is to protect the capital by investing in high quality fixed income securities and at the same time provide access to the upside potential of equities by investing a maximum of 15% in equities and equity linked instruments.
NAV as on 30 June, 15 : `15.9531
Benchmark : Nifty - 15%CRISIL Composite Bond Index - 85%
Corpus as on 30 June, 15 : `2.91 Crs.
Debt Investment StyleCredit Quality
High Mid Low Interest Rate Sensitivity
High
Mid
Low
Equity Investment StyleInvestment Style
Value Blend Growth Size
Large
Mid
Small
Future Capital Guarantee Pension FundULIF 019 04/02/08 FCG 110Fund Assure, Investment Report, June 2015
Equity 14.03HDFC Bank Ltd. Banks 1.36Infosys Technologies Ltd. IT - Software 1.28ICICI Bank Ltd. Banks 1.12Sun Pharmaceuticals Industries Ltd. Pharmaceuticals 0.99Tata Consultancy Services Ltd. IT - Software 0.88HDFC Ltd. Finance 0.83Maruti Suzuki India Ltd. Automobile 0.83Hindustan Unilever Ltd. FMCG 0.64Larsen and Toubro Ltd. Capital Goods-Non Electrical 0.57Mahindra and Mahindra Ltd. Automobile 0.55Axis Bank Ltd. Banks 0.46Coal India Ltd Mining & Mineral Products 0.45Yes Bank Ltd. Banks 0.41Bharti Airtel Ltd. Telecomm-Service 0.40State Bank of India Banks 0.35Other Equity 2.90Government Securities 51.258.15% GOI 24-Nov-26 Sovereign 33.348.79% GOI 08-Nov-21 Sovereign 7.799.23% GOI 23-Dec-43 Sovereign 6.898.83% GOI 25-Nov-23 Sovereign 3.22Corporate Bonds 13.988.84% PFC Ltd. 04-Mar-23 AAA 6.949.57% IRFC Ltd. 31-May-21 AAA 3.618.57% REC Ltd. 21-Dec-24 AAA 3.43Unit Funds 7.55Birla Sun Life Cash Plus - Growth - Direct Plan 4.12ICICI Prudential Liquid - Direct Plan - Growth 3.43Cash Bank & Others 13.19Total 100.00
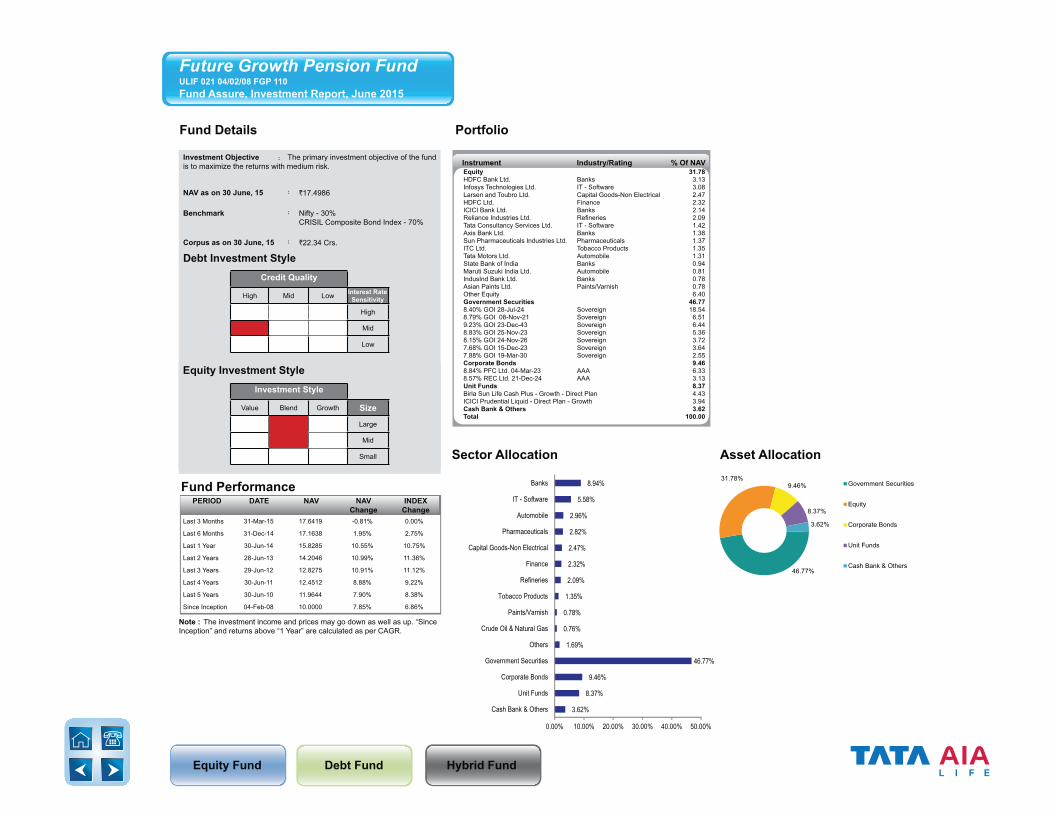
Equity Fund Debt Fund Hybrid Fund
Fund Details Portfolio
Instrument Industry/Rating % Of NAV
Note : The investment income and prices may go down as well as up. “SinceInception” and returns above “1 Year” are calculated as per CAGR.
Fund Performance
Last 3 Months 31-Mar-15 17.6419 -0.81% 0.00%
Last 6 Months 31-Dec-14 17.1638 1.95% 2.75%
Last 1 Year 30-Jun-14 15.8285 10.55% 10.75%
Last 2 Years 28-Jun-13 14.2046 10.99% 11.36%
Last 3 Years 29-Jun-12 12.8275 10.91% 11.12%
Last 4 Years 30-Jun-11 12.4512 8.88% 9.22%
Last 5 Years 30-Jun-10 11.9644 7.90% 8.38%
Since Inception 04-Feb-08 10.0000 7.85% 6.86%
PERIOD DATE NAV NAVChange
INDEXChange
3.62%
8.37%
9.46%
46.77%
1.69%
0.76%
0.78%
1.35%
2.09%
2.32%
2.47%
2.82%
2.96%
5.58%
8.94%
0.00% 10.00% 20.00% 30.00% 40.00% 50.00%
Cash Bank & Others
Unit Funds
Corporate Bonds
Government Securities
Others
Crude Oil & Natural Gas
Paints/Varnish
Tobacco Products
Refineries
Finance
Capital Goods-Non Electrical
Pharmaceuticals
Automobile
IT - Software
Banks
46.77%
31.78%9.46%
8.37%
3.62%
Government Securities
Equity
Corporate Bonds
Unit Funds
Cash Bank & Others
Sector Allocation Asset Allocation
Investment Objective : The primary investment objective of the fund is to maximize the returns with medium risk.
NAV as on 30 June, 15 : `17.4986
Benchmark : Nifty - 30%CRISIL Composite Bond Index - 70%
Corpus as on 30 June, 15 : `22.34 Crs.
Debt Investment StyleCredit Quality
High Mid Low Interest Rate Sensitivity
High
Mid
Low
Equity Investment StyleInvestment Style
Value Blend Growth Size
Large
Mid
Small
Future Growth Pension FundULIF 021 04/02/08 FGP 110Fund Assure, Investment Report, June 2015
Equity 31.78HDFC Bank Ltd. Banks 3.13Infosys Technologies Ltd. IT - Software 3.08Larsen and Toubro Ltd. Capital Goods-Non Electrical 2.47HDFC Ltd. Finance 2.32ICICI Bank Ltd. Banks 2.14Reliance Industries Ltd. Refineries 2.09Tata Consultancy Services Ltd. IT - Software 1.42Axis Bank Ltd. Banks 1.38Sun Pharmaceuticals Industries Ltd. Pharmaceuticals 1.37ITC Ltd. Tobacco Products 1.35Tata Motors Ltd. Automobile 1.31State Bank of India Banks 0.94Maruti Suzuki India Ltd. Automobile 0.81IndusInd Bank Ltd. Banks 0.78Asian Paints Ltd. Paints/Varnish 0.78Other Equity 6.40Government Securities 46.778.40% GOI 28-Jul-24 Sovereign 18.548.79% GOI 08-Nov-21 Sovereign 6.519.23% GOI 23-Dec-43 Sovereign 6.448.83% GOI 25-Nov-23 Sovereign 5.368.15% GOI 24-Nov-26 Sovereign 3.727.68% GOI 15-Dec-23 Sovereign 3.647.88% GOI 19-Mar-30 Sovereign 2.55Corporate Bonds 9.468.84% PFC Ltd. 04-Mar-23 AAA 6.338.57% REC Ltd. 21-Dec-24 AAA 3.13Unit Funds 8.37Birla Sun Life Cash Plus - Growth - Direct Plan 4.43ICICI Prudential Liquid - Direct Plan - Growth 3.94Cash Bank & Others 3.62Total 100.00

Equity Fund Debt Fund Hybrid Fund
Fund Details Portfolio
Instrument Industry/Rating % Of NAV
Note : The investment income and prices may go down as well as up. “SinceInception” and returns above “1 Year” are calculated as per CAGR.
Fund Performance
Last 3 Months 31-Mar-15 17.1452 -0.40% 0.41%
Last 6 Months 31-Dec-14 16.6919 2.31% 3.24%
Last 1 Year 30-Jun-14 15.4088 10.82% 10.98%
Last 2 Years 28-Jun-13 14.5464 8.35% 8.99%
Last 3 Years 29-Jun-12 13.1218 9.18% 9.55%
Last 4 Years 30-Jun-11 12.3002 8.55% 8.91%
Last 5 Years 30-Jun-10 11.8124 7.65% 8.06%
Since Inception 04-Feb-08 10.0000 7.49% 7.13%
PERIOD DATE NAV NAVChange
INDEXChange
8.22%
12.18%
19.78%
47.39%
0.76%
0.33%
0.34%
0.52%
0.63%
0.76%
0.97%
1.03%
1.31%
2.15%
3.61%
0.00% 15.00% 30.00% 45.00% 60.00%
Unit Funds
Cash Bank & Others
Corporate Bonds
Government Securities
Others
Telecomm-Service
Crude Oil & Natural Gas
Tobacco Products
Refineries
Finance
Capital Goods-Non Electrical
Pharmaceuticals
Automobile
IT - Software
Banks
47.39%
19.78% 12.42%
12.18%
8.22%
Government Securities
Corporate Bonds
Equity
Cash Bank & Others
Unit Funds
Sector Allocation Asset Allocation
Investment Objective : The primary investment objective of the fund is to provide reasonable returns with low to medium risk.
NAV as on 30 June, 15 : `17.0768
Benchmark : Nifty - 10%CRISIL Composite Bond Index - 90%
Corpus as on 30 June, 15 : `11.92 Crs.
Debt Investment StyleCredit Quality
High Mid Low Interest Rate Sensitivity
High
Mid
Low
Equity Investment StyleInvestment Style
Value Blend Growth Size
Large
Mid
Small
Future Balanced Pension Fund ULIF 018 04/02/08 FBP 110Fund Assure, Investment Report, June 2015
Equity 12.42HDFC Bank Ltd. Banks 1.34Infosys Technologies Ltd. IT - Software 1.16ICICI Bank Ltd. Banks 1.03Larsen and Toubro Ltd. Capital Goods-Non Electrical 0.97HDFC Ltd. Finance 0.76Reliance Industries Ltd. Refineries 0.63Sun Pharmaceuticals Industries Ltd. Pharmaceuticals 0.62Tata Consultancy Services Ltd. IT - Software 0.56ITC Ltd. Tobacco Products 0.52Tata Motors Ltd. Automobile 0.50Axis Bank Ltd. Banks 0.47Maruti Suzuki India Ltd. Automobile 0.42State Bank of India Banks 0.39Oil and Natural Gas Corpn Ltd. Crude Oil & Natural Gas 0.34Bharti Airtel Ltd. Telecomm-Service 0.33Other Equity 2.37Government Securities 47.398.15% GOI 24-Nov-26 Sovereign 13.609.23% GOI 23-Dec-43 Sovereign 9.828.40% GOI 28-Jul-24 Sovereign 8.588.83% GOI 25-Nov-23 Sovereign 5.688.79% GOI 08-Nov-21 Sovereign 5.107.68% GOI 15-Dec-23 Sovereign 4.60Corporate Bonds 19.789.57% IRFC Ltd. 31-May-21 AAA 8.828.84% PFC Ltd. 04-Mar-23 AAA 5.938.57% REC Ltd. 21-Dec-24 AAA 5.03Unit Funds 8.22Birla Sun Life Cash Plus - Growth - Direct Plan 4.36ICICI Prudential Liquid - Direct Plan - Growth 3.86Cash Bank & Others 12.18Total 100.00
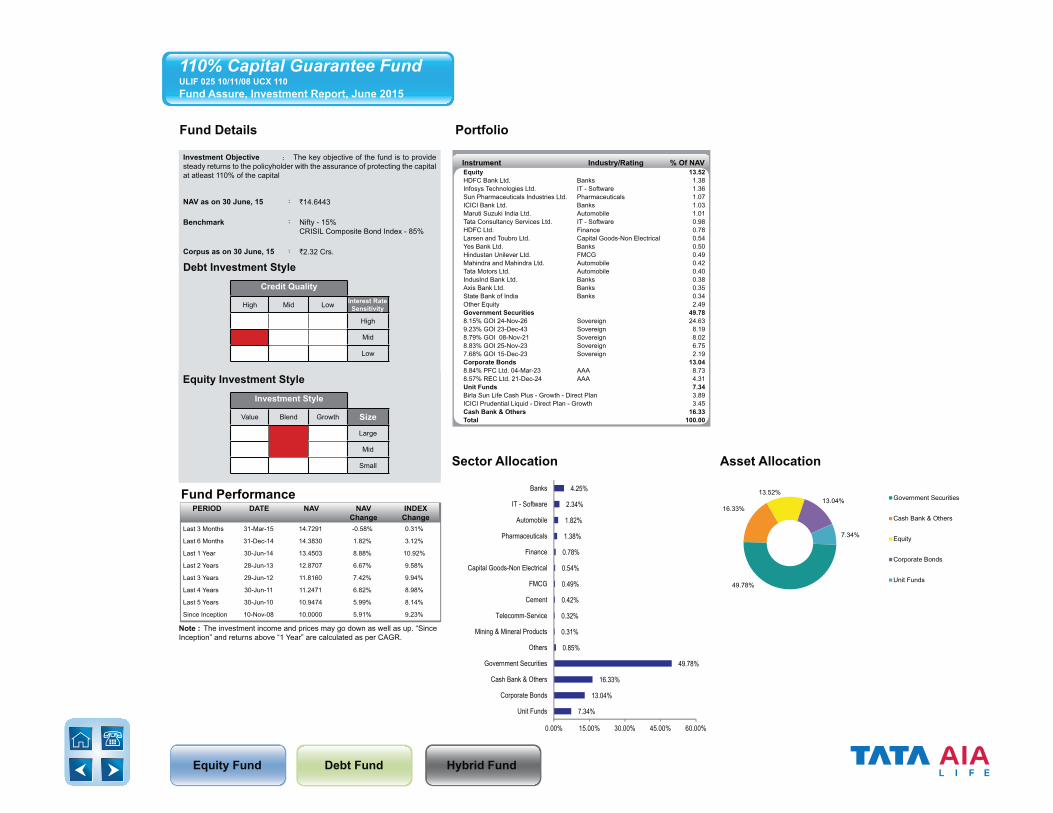
Equity Fund Debt Fund Hybrid Fund
Fund Details Portfolio
Instrument Industry/Rating % Of NAV
7.34%
13.04%
16.33%
49.78%
0.85%
0.31%
0.32%
0.42%
0.49%
0.54%
0.78%
1.38%
1.82%
2.34%
4.25%
0.00% 15.00% 30.00% 45.00% 60.00%
Unit Funds
Corporate Bonds
Cash Bank & Others
Government Securities
Others
Mining & Mineral Products
Telecomm-Service
Cement
FMCG
Capital Goods-Non Electrical
Finance
Pharmaceuticals
Automobile
IT - Software
Banks
49.78%
16.33%
13.52%13.04%
7.34%
Government Securities
Cash Bank & Others
Equity
Corporate Bonds
Unit Funds
Sector Allocation Asset Allocation
Investment Objective : The key objective of the fund is to provide steady returns to the policyholder with the assurance of protecting the capital at atleast 110% of the capital
NAV as on 30 June, 15 : `14.6443
Benchmark : Nifty - 15%CRISIL Composite Bond Index - 85%
Corpus as on 30 June, 15 : `2.32 Crs.
Debt Investment StyleCredit Quality
High Mid Low Interest Rate Sensitivity
High
Mid
Low
Equity Investment StyleInvestment Style
Value Blend Growth Size
Large
Mid
Small
110% Capital Guarantee Fund ULIF 025 10/11/08 UCX 110Fund Assure, Investment Report, June 2015
Equity 13.52HDFC Bank Ltd. Banks 1.38Infosys Technologies Ltd. IT - Software 1.36Sun Pharmaceuticals Industries Ltd. Pharmaceuticals 1.07ICICI Bank Ltd. Banks 1.03Maruti Suzuki India Ltd. Automobile 1.01Tata Consultancy Services Ltd. IT - Software 0.98HDFC Ltd. Finance 0.78Larsen and Toubro Ltd. Capital Goods-Non Electrical 0.54Yes Bank Ltd. Banks 0.50Hindustan Unilever Ltd. FMCG 0.49Mahindra and Mahindra Ltd. Automobile 0.42Tata Motors Ltd. Automobile 0.40IndusInd Bank Ltd. Banks 0.38Axis Bank Ltd. Banks 0.35State Bank of India Banks 0.34Other Equity 2.49Government Securities 49.788.15% GOI 24-Nov-26 Sovereign 24.639.23% GOI 23-Dec-43 Sovereign 8.198.79% GOI 08-Nov-21 Sovereign 8.028.83% GOI 25-Nov-23 Sovereign 6.757.68% GOI 15-Dec-23 Sovereign 2.19Corporate Bonds 13.048.84% PFC Ltd. 04-Mar-23 AAA 8.738.57% REC Ltd. 21-Dec-24 AAA 4.31Unit Funds 7.34Birla Sun Life Cash Plus - Growth - Direct Plan 3.89ICICI Prudential Liquid - Direct Plan - Growth 3.45Cash Bank & Others 16.33Total 100.00
Note : The investment income and prices may go down as well as up. “SinceInception” and returns above “1 Year” are calculated as per CAGR.
Fund Performance
Last 3 Months 31-Mar-15 14.7291 -0.58% 0.31%
Last 6 Months 31-Dec-14 14.3830 1.82% 3.12%
Last 1 Year 30-Jun-14 13.4503 8.88% 10.92%
Last 2 Years 28-Jun-13 12.8707 6.67% 9.58%
Last 3 Years 29-Jun-12 11.8160 7.42% 9.94%
Last 4 Years 30-Jun-11 11.2471 6.82% 8.98%
Last 5 Years 30-Jun-10 10.9474 5.99% 8.14%
Since Inception 10-Nov-08 10.0000 5.91% 9.23%
PERIOD DATE NAV NAVChange
INDEXChange

Equity Fund Debt Fund Hybrid Fund
Fund Details Portfolio
3.16%
8.34%
10.16%
37.05%
2.95%
1.13%
1.51%
1.90%
2.24%
2.62%
3.00%
3.92%
4.09%
6.55%
11.40%
0.00% 10.00% 20.00% 30.00% 40.00%
Cash Bank & Others
Unit Funds
Corporate Bonds
Government Securities
Others
Crude Oil & Natural Gas
Cement
Tobacco Products
Refineries
Finance
Capital Goods-Non Electrical
Pharmaceuticals
Automobile
IT - Software
Banks
41.30%
37.05%
10.16%
8.34%
3.16%
Equity
Government Securities
Corporate Bonds
Unit Funds
Cash Bank & Others
Sector Allocation Asset Allocation
Instrument Industry/Rating % Of NAV
Note : The investment income and prices may go down as well as up. “SinceInception” and returns above “1 Year” are calculated as per CAGR.
Fund Performance
Last 3 Months 31-Mar-15 16.8113 -1.07% -0.10%
Last 6 Months 31-Dec-14 16.3352 1.82% 2.63%
Last 1 Year 30-Jun-14 14.9032 11.60% 10.69%
Last 2 Years 28-Jun-13 13.1361 12.52% 11.96%
Last 3 Years 29-Jun-12 11.8088 12.09% 11.51%
Last 4 Years 30-Jun-11 11.4915 9.68% 9.30%
Last 5 Years 30-Jun-10 10.9775 8.66% 8.46%
Since Inception 12-Jan-09 10.0000 8.19% 11.21%
PERIOD DATE NAV NAVChange
INDEXChange
Investment Objective : Aggressive Flexi Fund is an Equity oriented balanced fund which primarily invests in large cap equity stocks and equity linked instruments along with Government Bonds and highly rated Fixed Income Instruments, with an objective to maximize the return with medium to high risk. The fund endeavors to offer long term capital appreciation along with stable returns over a long period of time.
NAV as on 30 June, 15 : `16.6320
Benchmark : Nifty - 35%CRISIL Composite Bond Index - 65%
Corpus as on 30 June, 15 : `14.87 Crs.
Debt Investment StyleCredit Quality
High Mid Low Interest Rate Sensitivity
High
Mid
Low
Equity Investment StyleInvestment Style
Value Blend Growth Size
Large
Mid
Small
Aggressive Flexi Fund ULIF 028 12/01/09 IAF 110Fund Assure, Investment Report, June 2015
Equity 41.30HDFC Bank Ltd. Banks 4.31ICICI Bank Ltd. Banks 3.37Infosys Technologies Ltd. IT - Software 3.31Larsen and Toubro Ltd. Capital Goods-Non Electrical 3.00HDFC Ltd. Finance 2.62Reliance Industries Ltd. Refineries 2.24ITC Ltd. Tobacco Products 1.90Tata Consultancy Services Ltd. IT - Software 1.84Tata Motors Ltd. Automobile 1.83Sun Pharmaceuticals Industries Ltd. Pharmaceuticals 1.76Ultratech Cement Ltd. Cement 1.51Axis Bank Ltd. Banks 1.32State Bank of India Banks 1.24IndusInd Bank Ltd. Banks 1.17Oil and Natural Gas Corpn Ltd. Crude Oil & Natural Gas 1.13Other Equity 8.75Government Securities 37.058.15% GOI 24-Nov-26 Sovereign 11.588.40% GOI 28-Jul-24 Sovereign 6.888.83% GOI 25-Nov-23 Sovereign 6.668.79% GOI 08-Nov-21 Sovereign 6.389.23% GOI 23-Dec-43 Sovereign 5.55Corporate Bonds 10.168.84% PFC Ltd. 04-Mar-23 AAA 6.808.57% REC Ltd. 21-Dec-24 AAA 3.36Unit Funds 8.34Birla Sun Life Cash Plus - Growth - Direct Plan 4.44ICICI Prudential Liquid - Direct Plan - Growth 3.90Cash Bank & Others 3.16Total 100.00

Equity Fund Debt Fund Hybrid Fund
Fund Details Portfolio
Instrument Industry/Rating % Of NAV
7.32%
8.22%
21.27%
44.55%
1.01%
0.59%
0.74%
0.83%
0.86%
1.01%
1.59%
1.80%
1.93%
3.32%
4.96%
0.00% 15.00% 30.00% 45.00% 60.00%
Cash Bank & Others
Unit Funds
Corporate Bonds
Government Securities
Others
Crude Oil & Natural Gas
Cement
Finance
Tobacco Products
Refineries
Capital Goods-Non Electrical
Pharmaceuticals
Automobile
IT - Software
Banks
44.55%
21.27% 18.64%
8.22%
7.32%
Government Securities
Corporate Bonds
Equity
Unit Funds
Cash Bank & Others
Sector Allocation Asset Allocation
Investment Objective : Stable Flexi Fund is a debt oriented balanced fund which primarily invests in Government Bonds and highly rated Fixed income instruments with some exposure to large cap equity stocks and equity linked instruments, with an objective to maximize the returns with low to medium risk. The fund endeavors to offer stable returns along with some capital appreciation over a long period of time.
NAV as on 30 June, 15 : `15.8059
Benchmark : Nifty - 15%CRISIL Composite Bond Index - 85%
Corpus as on 30 June, 15 : `10.10 Crs.
Debt Investment StyleCredit Quality
High Mid Low Interest Rate Sensitivity
High
Mid
Low
Equity Investment StyleInvestment Style
Value Blend Growth Size
Large
Mid
Small
Stable Flexi FundULIF 029 12/01/09 ISF 110Fund Assure, Investment Report, June 2015
Equity 18.64HDFC Bank Ltd. Banks 1.69Larsen and Toubro Ltd. Capital Goods-Non Electrical 1.59Infosys Technologies Ltd. IT - Software 1.58ICICI Bank Ltd. Banks 1.52Reliance Industries Ltd. Refineries 1.01Sun Pharmaceuticals Industries Ltd. Pharmaceuticals 0.87ITC Ltd. Tobacco Products 0.86Tata Motors Ltd. Automobile 0.84HDFC Ltd. Finance 0.83Tata Consultancy Services Ltd. IT - Software 0.83Axis Bank Ltd. Banks 0.83Ultratech Cement Ltd. Cement 0.74Oil and Natural Gas Corpn Ltd. Crude Oil & Natural Gas 0.59State Bank of India Banks 0.57Maruti Suzuki India Ltd. Automobile 0.48Other Equity 3.80Government Securities 44.558.15% GOI 24-Nov-26 Sovereign 22.908.79% GOI 08-Nov-21 Sovereign 8.689.23% GOI 23-Dec-43 Sovereign 7.408.83% GOI 25-Nov-23 Sovereign 5.57Corporate Bonds 21.279.57% IRFC Ltd. 31-May-21 AAA 8.338.84% PFC Ltd. 04-Mar-23 AAA 7.008.57% REC Ltd. 21-Dec-24 AAA 5.94Unit Funds 8.22Birla Sun Life Cash Plus - Growth - Direct Plan 4.36ICICI Prudential Liquid - Direct Plan - Growth 3.86Cash Bank & Others 7.32Total 100.00
Note : The investment income and prices may go down as well as up. “SinceInception” and returns above “1 Year” are calculated as per CAGR.
Fund Performance
Last 3 Months 31-Mar-15 15.9099 -0.65% 0.31%
Last 6 Months 31-Dec-14 15.4893 2.04% 3.12%
Last 1 Year 30-Jun-14 14.2753 10.72% 10.92%
Last 2 Years 28-Jun-13 13.3799 8.69% 9.58%
Last 3 Years 29-Jun-12 12.0683 9.41% 9.94%
Last 4 Years 30-Jun-11 11.4034 8.50% 8.98%
Last 5 Years 30-Jun-10 10.9190 7.68% 8.14%
Since Inception 12-Jan-09 10.0000 7.34% 8.93%
PERIOD DATE NAV NAVChange
INDEXChange
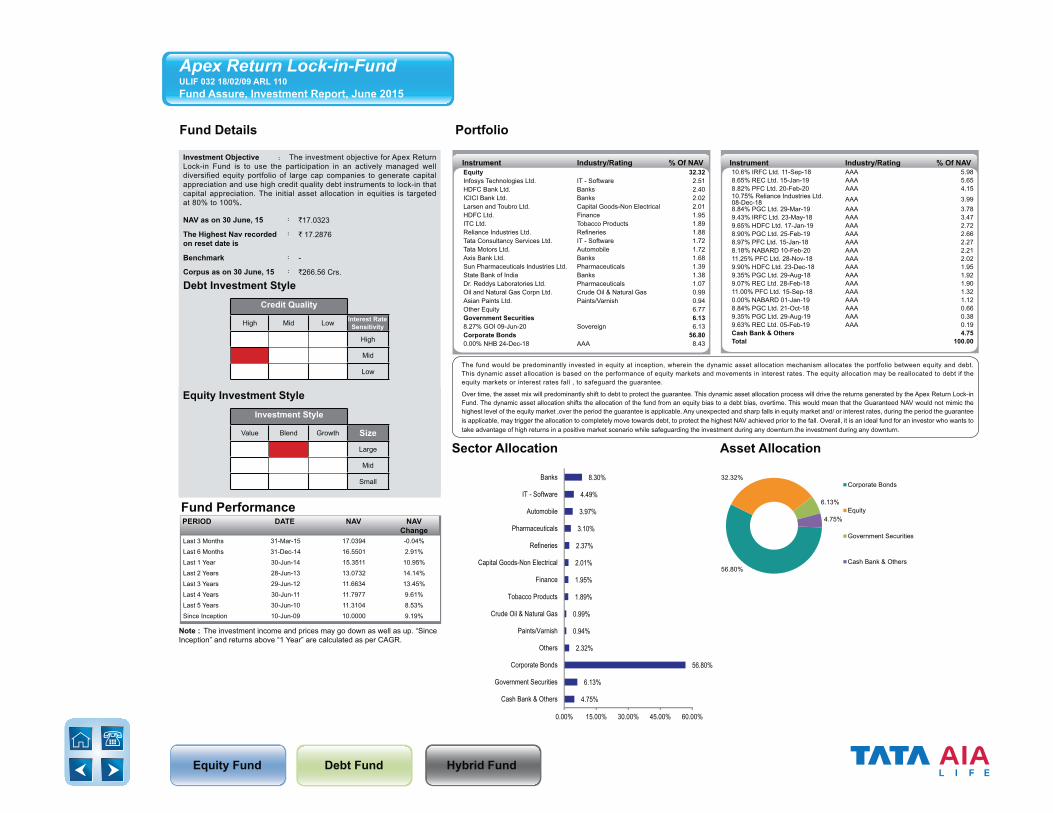
Equity Fund Debt Fund Hybrid Fund
Fund Details Portfolio
4.75%
6.13%
56.80%
2.32%
0.94%
0.99%
1.89%
1.95%
2.01%
2.37%
3.10%
3.97%
4.49%
8.30%
0.00% 15.00% 30.00% 45.00% 60.00%
Cash Bank & Others
Government Securities
Corporate Bonds
Others
Paints/Varnish
Crude Oil & Natural Gas
Tobacco Products
Finance
Capital Goods-Non Electrical
Refineries
Pharmaceuticals
Automobile
IT - Software
Banks
56.80%
32.32%
6.13%
4.75%
Corporate Bonds
Equity
Government Securities
Cash Bank & Others
Sector Allocation Asset Allocation
Instrument Industry/Rating % Of NAV Instrument Industry/Rating % Of NAV
The fund would be predominantly invested in equity at inception, wherein the dynamic asset allocation mechanism allocates the portfolio between equity and debt. This dynamic asset allocation is based on the performance of equity markets and movements in interest rates. The equity allocation may be reallocated to debt if the equity markets or interest rates fall , to safeguard the guarantee.
Over time, the asset mix will predominantly shift to debt to protect the guarantee. This dynamic asset allocation process will drive the returns generated by the Apex Return Lock-in Fund. The dynamic asset allocation shifts the allocation of the fund from an equity bias to a debt bias, overtime. This would mean that the Guaranteed NAV would not mimic the highest level of the equity market ,over the period the guarantee is applicable. Any unexpected and sharp falls in equity market and/ or interest rates, during the period the guarantee is applicable, may trigger the allocation to completely move towards debt, to protect the highest NAV achieved prior to the fall. Overall, it is an ideal fund for an investor who wants to take advantage of high returns in a positive market scenario while safeguarding the investment during any downturn.the investment during any downturn.
Investment Objective : The investment objective for Apex Return Lock-in Fund is to use the participation in an actively managed well diversified equity portfolio of large cap companies to generate capital appreciation and use high credit quality debt instruments to lock-in that capital appreciation. The initial asset allocation in equities is targeted at 80% to 100%.
NAV as on 30 June, 15 : `17.0323
The Highest Nav recorded on reset date is
: ` 17.2876
Benchmark : -
Corpus as on 30 June, 15 : `266.56 Crs.
Debt Investment StyleCredit Quality
High Mid Low Interest Rate Sensitivity
High
Mid
Low
Equity Investment StyleInvestment Style
Value Blend Growth Size
Large
Mid
Small
Note : The investment income and prices may go down as well as up. “SinceInception” and returns above “1 Year” are calculated as per CAGR.
Fund Performance
Last 3 Months 31-Mar-15 17.0394 -0.04%Last 6 Months 31-Dec-14 16.5501 2.91%Last 1 Year 30-Jun-14 15.3511 10.95%Last 2 Years 28-Jun-13 13.0732 14.14%Last 3 Years 29-Jun-12 11.6634 13.45%Last 4 Years 30-Jun-11 11.7977 9.61%Last 5 Years 30-Jun-10 11.3104 8.53%Since Inception 10-Jun-09 10.0000 9.19%
PERIOD DATE NAV NAVChange
Apex Return Lock-in-Fund ULIF 032 18/02/09 ARL 110Fund Assure, Investment Report, June 2015
Equity 32.32Infosys Technologies Ltd. IT - Software 2.51HDFC Bank Ltd. Banks 2.40ICICI Bank Ltd. Banks 2.02Larsen and Toubro Ltd. Capital Goods-Non Electrical 2.01HDFC Ltd. Finance 1.95ITC Ltd. Tobacco Products 1.89Reliance Industries Ltd. Refineries 1.88Tata Consultancy Services Ltd. IT - Software 1.72Tata Motors Ltd. Automobile 1.72Axis Bank Ltd. Banks 1.68Sun Pharmaceuticals Industries Ltd. Pharmaceuticals 1.39State Bank of India Banks 1.38Dr. Reddys Laboratories Ltd. Pharmaceuticals 1.07Oil and Natural Gas Corpn Ltd. Crude Oil & Natural Gas 0.99Asian Paints Ltd. Paints/Varnish 0.94Other Equity 6.77Government Securities 6.138.27% GOI 09-Jun-20 Sovereign 6.13Corporate Bonds 56.800.00% NHB 24-Dec-18 AAA 8.43
10.6% IRFC Ltd. 11-Sep-18 AAA 5.988.65% REC Ltd. 15-Jan-19 AAA 5.658.82% PFC Ltd. 20-Feb-20 AAA 4.1510.75% Reliance Industries Ltd. 08-Dec-18 AAA 3.998.84% PGC Ltd. 29-Mar-19 AAA 3.789.43% IRFC Ltd. 23-May-18 AAA 3.479.65% HDFC Ltd. 17-Jan-19 AAA 2.728.90% PGC Ltd. 25-Feb-19 AAA 2.668.97% PFC Ltd. 15-Jan-18 AAA 2.278.18% NABARD 10-Feb-20 AAA 2.2111.25% PFC Ltd. 28-Nov-18 AAA 2.029.90% HDFC Ltd. 23-Dec-18 AAA 1.959.35% PGC Ltd. 29-Aug-18 AAA 1.929.07% REC Ltd. 28-Feb-18 AAA 1.9011.00% PFC Ltd. 15-Sep-18 AAA 1.320.00% NABARD 01-Jan-19 AAA 1.128.84% PGC Ltd. 21-Oct-18 AAA 0.669.35% PGC Ltd. 29-Aug-19 AAA 0.389.63% REC Ltd. 05-Feb-19 AAA 0.19Cash Bank & Others 4.75Total 100.00

Equity Fund Debt Fund Hybrid Fund
Fund Details Portfolio
4.15%
5.21%
55.01%
2.36%
1.17%
1.19%
1.91%
2.15%
2.43%
3.06%
3.70%
4.31%
4.87%
8.47%
0.00% 20.00% 40.00% 60.00%
Government Securities
Cash Bank & Others
Corporate Bonds
Others
Paints/Varnish
Telecomm-Service
Finance
Tobacco Products
Capital Goods-Non Electrical
Refineries
Pharmaceuticals
IT - Software
Automobile
Banks
55.01%
35.62%
5.21%
4.15%
Corporate Bonds
Equity
Cash Bank & Others
GovernmentSecurities
Sector Allocation Asset Allocation
Instrument Industry/Rating % Of NAV Instrument Industry/Rating % Of NAV
Note : The investment income and prices may go down as well as up. “SinceInception” and returns above “1 Year” are calculated as per CAGR.
Fund Performance
Last 3 Months 31-Mar-15 16.0361 0.16%Last 6 Months 31-Dec-14 15.5480 3.31%Last 1 Year 30-Jun-14 14.4455 11.19%Last 2 Years 28-Jun-13 12.2281 14.61%Last 3 Years 29-Jun-12 10.8890 13.83%Last 4 Years 30-Jun-11 11.0704 9.75%Last 5 Years 30-Jun-10 10.4857 8.90%Since Inception 10-Nov-09 10.0000 8.77%
PERIOD DATE NAV NAVChange
The fund would be predominantly invested in equity at inception, wherein the dynamic asset allocation mechanism allocates the portfolio between equity and debt. This dynamic asset allocation is based on the performance of equity markets and movements in interest rates. The equity allocation may be reallocated to debt if the equity markets or interest rates fall , to safeguard the guarantee.
Over time, the asset mix will predominantly shift to debt to protect the guarantee. This dynamic asset allocation process will drive the returns generated by the Apex Return Lock-in Fund. The dynamic asset allocation shifts the allocation of the fund from an equity bias to a debt bias, overtime. This would mean that the Guaranteed NAV would not mimic the highest level of the equity market ,over the period the guarantee is applicable. Any unexpected and sharp falls in equity market and/ or interest rates, during the period the guarantee is applicable, may trigger the allocation to completely move towards debt, to protect the highest NAV achieved prior to the fall. Overall, it is an ideal fund for an investor who wants to take advantage of high returns in a positive market scenario while safeguarding the investment during any downturn.the investment during any downturn.
Investment Objective : The investment objective for Apex Return Lock-in Fund II is to use the participation in an actively managed well diversified equity portfolio of large cap companies to generate capital appreciation and use high credit quality debt instruments to lock-in that capital appreciation. The initial asset allocation in equities is targeted at 80% to 100%.
NAV as on 30 June, 15 : `16.0623
The Highest Nav recorded on reset date is
: `16.2505
Benchmark : -
Corpus as on 30 June, 15 : `194.16 Crs.
Debt Investment StyleCredit Quality
High Mid Low Interest Rate Sensitivity
High
Mid
Low
Equity Investment StyleInvestment Style
Value Blend Growth Size
Large
Mid
Small
Apex Return Lock-in-Fund II ULIF 033 03/08/09 AR2 110Fund Assure, Investment Report, June 2015
Equity 35.62HDFC Bank Ltd. Banks 2.75Infosys Technologies Ltd. IT - Software 2.53Larsen and Toubro Ltd. Capital Goods-Non Electrical 2.43ICICI Bank Ltd. Banks 2.38ITC Ltd. Tobacco Products 2.15HDFC Ltd. Finance 1.91Tata Consultancy Services Ltd. IT - Software 1.77Reliance Industries Ltd. Refineries 1.70Axis Bank Ltd. Banks 1.66Tata Motors Ltd. Automobile 1.65Bharat Petroleum Corporation Ltd. Refineries 1.36Sun Pharmaceuticals Industries Ltd. Pharmaceuticals 1.35Maruti Suzuki India Ltd. Automobile 1.35Dr. Reddys Laboratories Ltd. Pharmaceuticals 1.28Bharti Airtel Ltd. Telecomm-Service 1.19Other Equity 8.16Government Securities 4.158.27% GOI 09-Jun-20 Sovereign 4.15Corporate Bonds 55.019.00% EXIM Bank 10-Jan-19 AAA 5.269.63% REC Ltd. 05-Feb-19 AAA 5.067.60% HDFC Ltd. 21-Dec-17 AAA 4.06
0.00% NABARD 01-Jan-19 AAA 3.688.75% SAIL 23-Apr-20 AAA 3.1010.6% IRFC Ltd. 11-Sep-18 AAA 2.748.84% PGC Ltd. 21-Oct-19 AAA 2.598.55% IRFC Ltd. 15-Jan-19 AAA 2.598.60% IRFC Ltd. 11-Jun-19 AAA 2.598.72% REC Ltd. 04-Sep-19 AAA 2.588.60% PFC Ltd. 07-Aug-19 AAA 2.578.80% PFC Ltd. 15-Oct-19 AAA 2.339.35% PGC Ltd. 29-Aug-19 AAA 2.119.25% PGC Ltd. 26-Dec-19 AAA 2.108.18% NABARD 10-Feb-20 AAA 2.078.82% PFC Ltd. 20-Feb-20 AAA 2.079.65% HDFC Ltd. 17-Jan-19 AAA 1.609.64% PGC Ltd. 31-May-19 AAA 1.338.84% PGC Ltd. 21-Oct-18 AAA 1.3011.00% PFC Ltd. 15-Sep-18 AAA 0.948.19% IRFC Ltd. 27-Apr-19 AAA 0.777.89% NTPC Ltd. 05-May-19 AAA 0.758.97% PFC Ltd. 15-Jan-18 AAA 0.528.70% PFC Ltd. 14-May-20 AAA 0.31Cash Bank & Others 5.21Total 100.00

Equity Fund Debt Fund Hybrid Fund
Fund Details Portfolio
Instrument Industry/Rating % Of NAV
Note : The investment income and prices may go down as well as up. “SinceInception” and returns above “1 Year” are calculated as per CAGR.
Fund Performance
Last 3 Months 31-Mar-15 14.7892 -0.34% 0.31%Last 6 Months 31-Dec-14 14.3909 2.42% 3.12%Last 1 Year 30-Jun-14 13.3741 10.20% 10.92%Last 2 Years 28-Jun-13 12.6282 8.03% 9.58%Last 3 Years 29-Jun-12 11.4217 8.87% 9.94%Last 4 Years 30-Jun-11 10.5526 8.71% 8.98%Last 5 Years 30-Jun-10 10.1081 7.83% 8.14%Since Inception 23-Nov-09 10.0000 7.17% 7.85%
PERIOD DATE NAV NAVChange
INDEXChange
5.37%
11.61%
68.83%
0.71%
0.47%
0.51%
0.57%
0.63%
0.69%
0.84%
1.33%
1.59%
2.41%
4.44%
0.00% 15.00% 30.00% 45.00% 60.00% 75.00%
Unit Funds
Cash Bank & Others
Government Securities
Others
Telecomm-Service
Cement
Mining & Mineral Products
Capital Goods-Non Electrical
FMCG
Finance
Automobile
Pharmaceuticals
IT - Software
Banks
68.83%
14.19%
11.61%
5.37%
Government Securities
Equity
Cash Bank & Others
Unit Funds
Sector Allocation Asset Allocation
Investment Objective : The key objective of the fund is to provide steady returns to the policyholder with the assurance of protecting the capital at atleast 110% of the capital.
NAV as on 30 June, 15 : `14.7389
Benchmark : Nifty - 15%CRISIL Composite Bond Index - 85%
Corpus as on 30 June, 15 : `0.93 Crs.
Debt Investment StyleCredit Quality
High Mid Low Interest Rate Sensitivity
High
Mid
Low
Equity Investment StyleInvestment Style
Value Blend Growth Size
Large
Mid
Small
Super 110% Capital Guarantee Fund ULIF 036 23/11/09 UCS 110 Fund Assure, Investment Report, June 2015
Equity 14.19HDFC Bank Ltd. Banks 1.54Sun Pharmaceuticals Industries Ltd. Pharmaceuticals 1.40Infosys Technologies Ltd. IT - Software 1.21ICICI Bank Ltd. Banks 1.17Tata Consultancy Services Ltd. IT - Software 1.04Maruti Suzuki India Ltd. Automobile 0.86HDFC Ltd. Finance 0.84Hindustan Unilever Ltd. FMCG 0.69Larsen and Toubro Ltd. Capital Goods-Non Electrical 0.63Coal India Ltd Mining & Mineral Products 0.57Yes Bank Ltd. Banks 0.56Bharti Airtel Ltd. Telecomm-Service 0.47Tata Motors Ltd. Automobile 0.47IndusInd Bank Ltd. Banks 0.46Ultratech Cement Ltd. Cement 0.39Other Equity 1.89Government Securities 68.838.15% GOI 24-Nov-26 Sovereign 21.518.83% GOI 25-Nov-23 Sovereign 19.038.79% GOI 08-Nov-21 Sovereign 16.629.23% GOI 23-Dec-43 Sovereign 8.397.68% GOI 15-Dec-23 Sovereign 3.27Unit Funds 5.37Birla Sun Life Cash Plus - Growth - Direct Plan 3.22ICICI Prudential Liquid - Direct Plan - Growth 2.15Cash Bank & Others 11.61Total 100.00
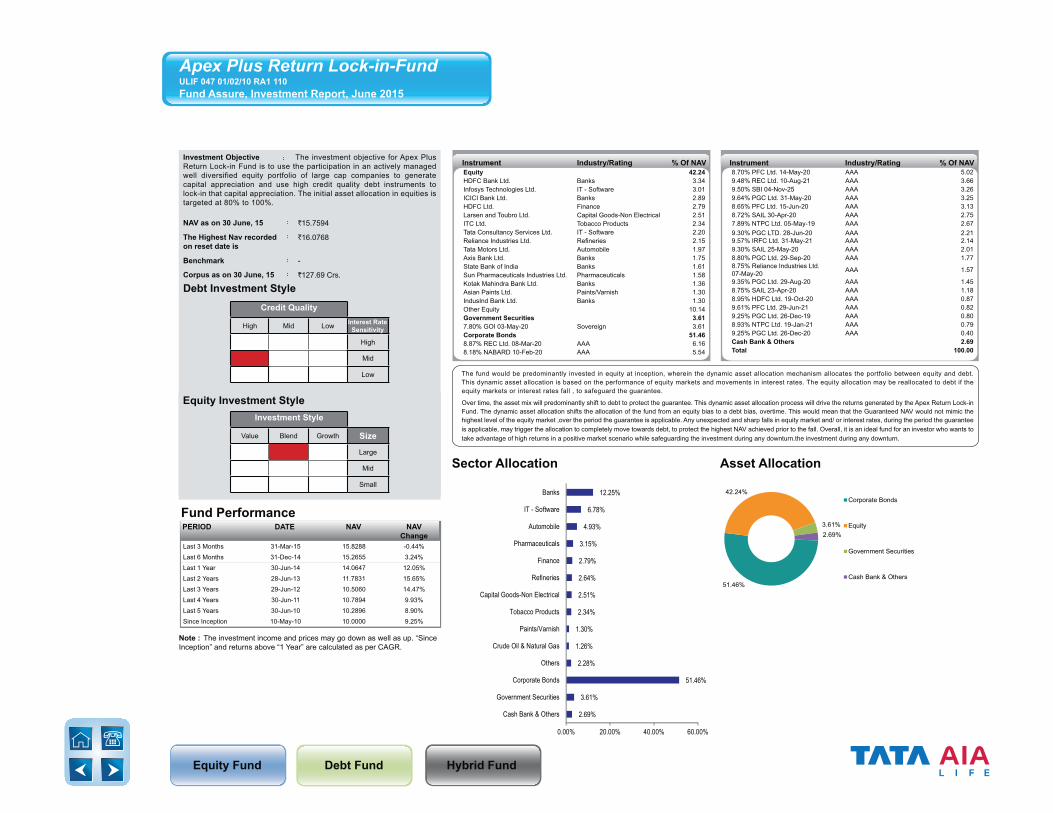
Equity Fund Debt Fund Hybrid Fund
Note : The investment income and prices may go down as well as up. “SinceInception” and returns above “1 Year” are calculated as per CAGR.
Fund Performance
Last 3 Months 31-Mar-15 15.8288 -0.44%Last 6 Months 31-Dec-14 15.2655 3.24%Last 1 Year 30-Jun-14 14.0647 12.05%Last 2 Years 28-Jun-13 11.7831 15.65%Last 3 Years 29-Jun-12 10.5060 14.47%Last 4 Years 30-Jun-11 10.7894 9.93%Last 5 Years 30-Jun-10 10.2896 8.90%Since Inception 10-May-10 10.0000 9.25%
PERIOD DATE NAV NAVChange
Instrument Industry/Rating % Of NAV Instrument Industry/Rating % Of NAV
2.69%
3.61%
51.46%
2.28%
1.26%
1.30%
2.34%
2.51%
2.64%
2.79%
3.15%
4.93%
6.78%
12.25%
0.00% 20.00% 40.00% 60.00%
Cash Bank & Others
Government Securities
Corporate Bonds
Others
Crude Oil & Natural Gas
Paints/Varnish
Tobacco Products
Capital Goods-Non Electrical
Refineries
Finance
Pharmaceuticals
Automobile
IT - Software
Banks
51.46%
42.24%
3.61%2.69%
Corporate Bonds
Equity
Government Securities
Cash Bank & Others
Sector Allocation Asset Allocation
The fund would be predominantly invested in equity at inception, wherein the dynamic asset allocation mechanism allocates the portfolio between equity and debt. This dynamic asset allocation is based on the performance of equity markets and movements in interest rates. The equity allocation may be reallocated to debt if the equity markets or interest rates fall , to safeguard the guarantee.
Over time, the asset mix will predominantly shift to debt to protect the guarantee. This dynamic asset allocation process will drive the returns generated by the Apex Return Lock-in Fund. The dynamic asset allocation shifts the allocation of the fund from an equity bias to a debt bias, overtime. This would mean that the Guaranteed NAV would not mimic the highest level of the equity market ,over the period the guarantee is applicable. Any unexpected and sharp falls in equity market and/ or interest rates, during the period the guarantee is applicable, may trigger the allocation to completely move towards debt, to protect the highest NAV achieved prior to the fall. Overall, it is an ideal fund for an investor who wants to take advantage of high returns in a positive market scenario while safeguarding the investment during any downturn.the investment during any downturn.
Investment Objective : The investment objective for Apex Plus Return Lock-in Fund is to use the participation in an actively managed well diversified equity portfolio of large cap companies to generate capital appreciation and use high credit quality debt instruments to lock-in that capital appreciation. The initial asset allocation in equities is targeted at 80% to 100%.
NAV as on 30 June, 15 : `15.7594
The Highest Nav recorded on reset date is
: `16.0768
Benchmark : -
Corpus as on 30 June, 15 : `127.69 Crs.
Debt Investment StyleCredit Quality
High Mid Low Interest Rate Sensitivity
High
Mid
Low
Equity Investment StyleInvestment Style
Value Blend Growth Size
Large
Mid
Small
Apex Plus Return Lock-in-Fund ULIF 047 01/02/10 RA1 110 Fund Assure, Investment Report, June 2015
Equity 42.24HDFC Bank Ltd. Banks 3.34Infosys Technologies Ltd. IT - Software 3.01ICICI Bank Ltd. Banks 2.89HDFC Ltd. Finance 2.79Larsen and Toubro Ltd. Capital Goods-Non Electrical 2.51ITC Ltd. Tobacco Products 2.34Tata Consultancy Services Ltd. IT - Software 2.20Reliance Industries Ltd. Refineries 2.15Tata Motors Ltd. Automobile 1.97Axis Bank Ltd. Banks 1.75State Bank of India Banks 1.61Sun Pharmaceuticals Industries Ltd. Pharmaceuticals 1.58Kotak Mahindra Bank Ltd. Banks 1.36Asian Paints Ltd. Paints/Varnish 1.30IndusInd Bank Ltd. Banks 1.30Other Equity 10.14Government Securities 3.617.80% GOI 03-May-20 Sovereign 3.61Corporate Bonds 51.468.87% REC Ltd. 08-Mar-20 AAA 6.168.18% NABARD 10-Feb-20 AAA 5.54
8.70% PFC Ltd. 14-May-20 AAA 5.029.48% REC Ltd. 10-Aug-21 AAA 3.669.50% SBI 04-Nov-25 AAA 3.269.64% PGC Ltd. 31-May-20 AAA 3.258.65% PFC Ltd. 15-Jun-20 AAA 3.138.72% SAIL 30-Apr-20 AAA 2.757.89% NTPC Ltd. 05-May-19 AAA 2.679.30% PGC LTD. 28-Jun-20 AAA 2.219.57% IRFC Ltd. 31-May-21 AAA 2.149.30% SAIL 25-May-20 AAA 2.018.80% PGC Ltd. 29-Sep-20 AAA 1.778.75% Reliance Industries Ltd. 07-May-20 AAA 1.57
9.35% PGC Ltd. 29-Aug-20 AAA 1.458.75% SAIL 23-Apr-20 AAA 1.188.95% HDFC Ltd. 19-Oct-20 AAA 0.879.61% PFC Ltd. 29-Jun-21 AAA 0.829.25% PGC Ltd. 26-Dec-19 AAA 0.808.93% NTPC Ltd. 19-Jan-21 AAA 0.799.25% PGC Ltd. 26-Dec-20 AAA 0.40Cash Bank & Others 2.69Total 100.00
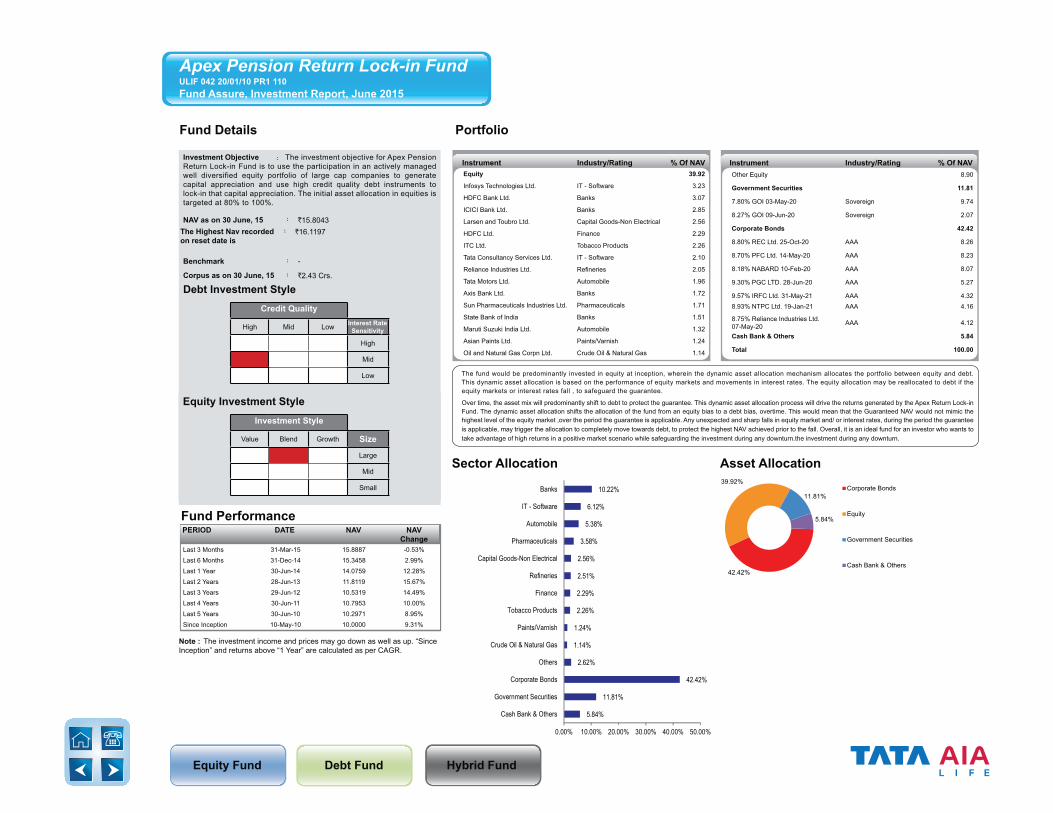
Equity Fund Debt Fund Hybrid Fund
Fund Details Portfolio
Instrument Industry/Rating % Of NAV Instrument Industry/Rating % Of NAV
5.84%
11.81%
42.42%
2.62%
1.14%
1.24%
2.26%
2.29%
2.51%
2.56%
3.58%
5.38%
6.12%
10.22%
0.00% 10.00% 20.00% 30.00% 40.00% 50.00%
Cash Bank & Others
Government Securities
Corporate Bonds
Others
Crude Oil & Natural Gas
Paints/Varnish
Tobacco Products
Finance
Refineries
Capital Goods-Non Electrical
Pharmaceuticals
Automobile
IT - Software
Banks
42.42%
39.92%
11.81%
5.84%
Corporate Bonds
Equity
Government Securities
Cash Bank & Others
Sector Allocation Asset Allocation
The fund would be predominantly invested in equity at inception, wherein the dynamic asset allocation mechanism allocates the portfolio between equity and debt. This dynamic asset allocation is based on the performance of equity markets and movements in interest rates. The equity allocation may be reallocated to debt if the equity markets or interest rates fall , to safeguard the guarantee.
Over time, the asset mix will predominantly shift to debt to protect the guarantee. This dynamic asset allocation process will drive the returns generated by the Apex Return Lock-in Fund. The dynamic asset allocation shifts the allocation of the fund from an equity bias to a debt bias, overtime. This would mean that the Guaranteed NAV would not mimic the highest level of the equity market ,over the period the guarantee is applicable. Any unexpected and sharp falls in equity market and/ or interest rates, during the period the guarantee is applicable, may trigger the allocation to completely move towards debt, to protect the highest NAV achieved prior to the fall. Overall, it is an ideal fund for an investor who wants to take advantage of high returns in a positive market scenario while safeguarding the investment during any downturn.the investment during any downturn.
Investment Objective : The investment objective for Apex Pension Return Lock-in Fund is to use the participation in an actively managed well diversified equity portfolio of large cap companies to generate capital appreciation and use high credit quality debt instruments to lock-in that capital appreciation. The initial asset allocation in equities is targeted at 80% to 100%.
NAV as on 30 June, 15 : `15.8043The Highest Nav recorded on reset date is
: `16.1197
Benchmark : -
Corpus as on 30 June, 15 : `2.43 Crs.
Debt Investment StyleCredit Quality
High Mid Low Interest Rate Sensitivity
High
Mid
Low
Equity Investment StyleInvestment Style
Value Blend Growth Size
Large
Mid
Small
Apex Pension Return Lock-in Fund ULIF 042 20/01/10 PR1 110Fund Assure, Investment Report, June 2015
Equity 39.92
Infosys Technologies Ltd. IT - Software 3.23
HDFC Bank Ltd. Banks 3.07
ICICI Bank Ltd. Banks 2.85
Larsen and Toubro Ltd. Capital Goods-Non Electrical 2.56
HDFC Ltd. Finance 2.29
ITC Ltd. Tobacco Products 2.26
Tata Consultancy Services Ltd. IT - Software 2.10
Reliance Industries Ltd. Refineries 2.05
Tata Motors Ltd. Automobile 1.96
Axis Bank Ltd. Banks 1.72
Sun Pharmaceuticals Industries Ltd. Pharmaceuticals 1.71
State Bank of India Banks 1.51
Maruti Suzuki India Ltd. Automobile 1.32
Asian Paints Ltd. Paints/Varnish 1.24
Oil and Natural Gas Corpn Ltd. Crude Oil & Natural Gas 1.14
Other Equity 8.90
Government Securities 11.81
7.80% GOI 03-May-20 Sovereign 9.74
8.27% GOI 09-Jun-20 Sovereign 2.07
Corporate Bonds 42.42
8.80% REC Ltd. 25-Oct-20 AAA 8.26
8.70% PFC Ltd. 14-May-20 AAA 8.23
8.18% NABARD 10-Feb-20 AAA 8.07
9.30% PGC LTD. 28-Jun-20 AAA 5.27
9.57% IRFC Ltd. 31-May-21 AAA 4.328.93% NTPC Ltd. 19-Jan-21 AAA 4.16
8.75% Reliance Industries Ltd. 07-May-20 AAA 4.12
Cash Bank & Others 5.84
Total 100.00
Note : The investment income and prices may go down as well as up. “SinceInception” and returns above “1 Year” are calculated as per CAGR.
Fund Performance
Last 3 Months 31-Mar-15 15.8887 -0.53%Last 6 Months 31-Dec-14 15.3458 2.99%Last 1 Year 30-Jun-14 14.0759 12.28%Last 2 Years 28-Jun-13 11.8119 15.67%Last 3 Years 29-Jun-12 10.5319 14.49%Last 4 Years 30-Jun-11 10.7953 10.00%Last 5 Years 30-Jun-10 10.2971 8.95%Since Inception 10-May-10 10.0000 9.31%
PERIOD DATE NAV NAVChange
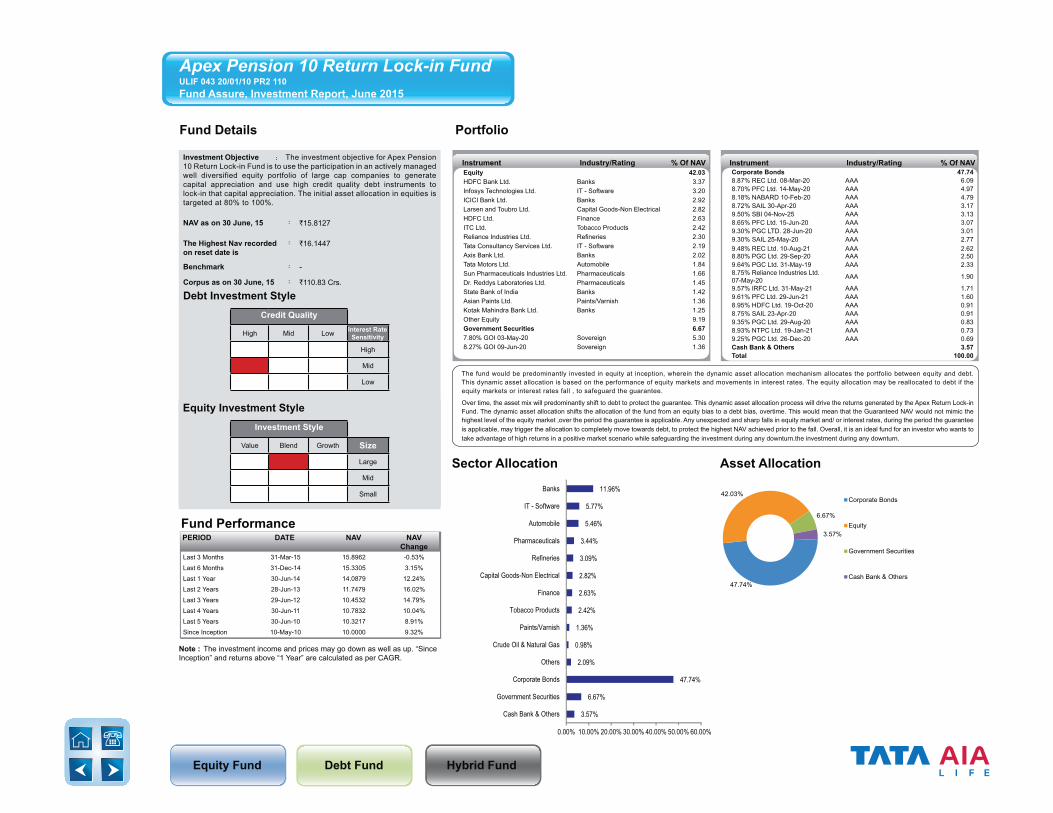
Equity Fund Debt Fund Hybrid Fund
Fund Details Portfolio
Instrument Industry/Rating % Of NAV Instrument Industry/Rating % Of NAV
3.57%
6.67%
47.74%
2.09%
0.98%
1.36%
2.42%
2.63%
2.82%
3.09%
3.44%
5.46%
5.77%
11.96%
0.00% 10.00% 20.00% 30.00% 40.00% 50.00% 60.00%
Cash Bank & Others
Government Securities
Corporate Bonds
Others
Crude Oil & Natural Gas
Paints/Varnish
Tobacco Products
Finance
Capital Goods-Non Electrical
Refineries
Pharmaceuticals
Automobile
IT - Software
Banks
47.74%
42.03%
6.67%
3.57%
Corporate Bonds
Equity
Government Securities
Cash Bank & Others
Sector Allocation Asset Allocation
The fund would be predominantly invested in equity at inception, wherein the dynamic asset allocation mechanism allocates the portfolio between equity and debt. This dynamic asset allocation is based on the performance of equity markets and movements in interest rates. The equity allocation may be reallocated to debt if the equity markets or interest rates fall , to safeguard the guarantee.
Over time, the asset mix will predominantly shift to debt to protect the guarantee. This dynamic asset allocation process will drive the returns generated by the Apex Return Lock-in Fund. The dynamic asset allocation shifts the allocation of the fund from an equity bias to a debt bias, overtime. This would mean that the Guaranteed NAV would not mimic the highest level of the equity market ,over the period the guarantee is applicable. Any unexpected and sharp falls in equity market and/ or interest rates, during the period the guarantee is applicable, may trigger the allocation to completely move towards debt, to protect the highest NAV achieved prior to the fall. Overall, it is an ideal fund for an investor who wants to take advantage of high returns in a positive market scenario while safeguarding the investment during any downturn.the investment during any downturn.
Investment Objective : The investment objective for Apex Pension 10 Return Lock-in Fund is to use the participation in an actively managed well diversified equity portfolio of large cap companies to generate capital appreciation and use high credit quality debt instruments to lock-in that capital appreciation. The initial asset allocation in equities is targeted at 80% to 100%.
NAV as on 30 June, 15 : `15.8127
The Highest Nav recorded on reset date is
: `16.1447
Benchmark : -
Corpus as on 30 June, 15 : `110.83 Crs.
Debt Investment StyleCredit Quality
High Mid Low Interest Rate Sensitivity
High
Mid
Low
Equity Investment StyleInvestment Style
Value Blend Growth Size
Large
Mid
Small
Apex Pension 10 Return Lock-in Fund ULIF 043 20/01/10 PR2 110Fund Assure, Investment Report, June 2015
Equity 42.03HDFC Bank Ltd. Banks 3.37Infosys Technologies Ltd. IT - Software 3.20ICICI Bank Ltd. Banks 2.92Larsen and Toubro Ltd. Capital Goods-Non Electrical 2.82HDFC Ltd. Finance 2.63ITC Ltd. Tobacco Products 2.42Reliance Industries Ltd. Refineries 2.30Tata Consultancy Services Ltd. IT - Software 2.19Axis Bank Ltd. Banks 2.02Tata Motors Ltd. Automobile 1.84Sun Pharmaceuticals Industries Ltd. Pharmaceuticals 1.66Dr. Reddys Laboratories Ltd. Pharmaceuticals 1.45State Bank of India Banks 1.42Asian Paints Ltd. Paints/Varnish 1.36Kotak Mahindra Bank Ltd. Banks 1.25Other Equity 9.19Government Securities 6.677.80% GOI 03-May-20 Sovereign 5.308.27% GOI 09-Jun-20 Sovereign 1.36
Corporate Bonds 47.748.87% REC Ltd. 08-Mar-20 AAA 6.098.70% PFC Ltd. 14-May-20 AAA 4.978.18% NABARD 10-Feb-20 AAA 4.798.72% SAIL 30-Apr-20 AAA 3.179.50% SBI 04-Nov-25 AAA 3.138.65% PFC Ltd. 15-Jun-20 AAA 3.079.30% PGC LTD. 28-Jun-20 AAA 3.019.30% SAIL 25-May-20 AAA 2.779.48% REC Ltd. 10-Aug-21 AAA 2.628.80% PGC Ltd. 29-Sep-20 AAA 2.509.64% PGC Ltd. 31-May-19 AAA 2.338.75% Reliance Industries Ltd. 07-May-20 AAA 1.90
9.57% IRFC Ltd. 31-May-21 AAA 1.719.61% PFC Ltd. 29-Jun-21 AAA 1.608.95% HDFC Ltd. 19-Oct-20 AAA 0.918.75% SAIL 23-Apr-20 AAA 0.919.35% PGC Ltd. 29-Aug-20 AAA 0.838.93% NTPC Ltd. 19-Jan-21 AAA 0.739.25% PGC Ltd. 26-Dec-20 AAA 0.69Cash Bank & Others 3.57Total 100.00
Note : The investment income and prices may go down as well as up. “SinceInception” and returns above “1 Year” are calculated as per CAGR.
Fund Performance
Last 3 Months 31-Mar-15 15.8962 -0.53%Last 6 Months 31-Dec-14 15.3305 3.15%Last 1 Year 30-Jun-14 14.0879 12.24%Last 2 Years 28-Jun-13 11.7479 16.02%Last 3 Years 29-Jun-12 10.4532 14.79%Last 4 Years 30-Jun-11 10.7832 10.04%Last 5 Years 30-Jun-10 10.3217 8.91%Since Inception 10-May-10 10.0000 9.32%
PERIOD DATE NAV NAVChange

Equity Fund Debt Fund Hybrid Fund
Fund Details Portfolio
2.96%
5.34%
33.60%
5.64%
1.45%
1.66%
3.35%
3.45%
3.65%
3.96%
4.48%
7.06%
9.59%
13.81%
0.00% 8.00% 16.00% 24.00% 32.00% 40.00%
Corporate Bonds
Cash Bank & Others
Government Securities
Others
Crude Oil & Natural Gas
Paints/Varnish
Capital Goods-Non Electrical
Tobacco Products
Finance
Refineries
Pharmaceuticals
Automobile
IT - Software
Banks
58.10%
33.60%
5.34%
2.96%
Equity
Government Securities
Cash Bank & Others
Corporate Bonds
Sector Allocation Asset Allocation
The fund would be predominantly invested in equity at inception, wherein the dynamic asset allocation mechanism allocates the portfolio between equity and debt. This dynamic asset allocation is based on the performance of equity markets and movements in interest rates. The equity allocation may be reallocated to debt if the equity markets or interest rates fall , to safeguard the guarantee.
Over time, the asset mix will predominantly shift to debt to protect the guarantee. This dynamic asset allocation process will drive the returns generated by the Apex Return Lock-in Fund. The dynamic asset allocation shifts the allocation of the fund from an equity bias to a debt bias, overtime. This would mean that the Guaranteed NAV would not mimic the highest level of the equity market ,over the period the guarantee is applicable. Any unexpected and sharp falls in equity market and/ or interest rates, during the period the guarantee is applicable, may trigger the allocation to completely move towards debt, to protect the highest NAV achieved prior to the fall. Overall, it is an ideal fund for an investor who wants to take advantage of high returns in a positive market scenario while safeguarding the investment during any downturn.the investment during any downturn.
Instrument Industry/Rating % Of NAV Instrument Industry/Rating % Of NAVInvestment Objective : The investment objective for Apex Pension 15 Return Lock-in Fund is to use the participation in an actively managed well diversified equity portfolio of large cap companies to generate capital appreciation and use high credit quality debt instruments to lock-in that capital appreciation. The initial asset allocation in equities is targeted at 80% to 100%
NAV as on 30 June, 15 : `15.7373
The Highest Nav recorded on reset date is
: `16.2286
Benchmark : -
Corpus as on 30 June, 15 : `31.93 Crs.
Debt Investment StyleCredit Quality
High Mid Low Interest Rate Sensitivity
High
Mid
Low
Equity Investment StyleInvestment Style
Value Blend Growth Size
Large
Mid
Small
Apex Pension 15 Return Lock-in Fund ULIF 044 20/01/10 PR3 110Fund Assure, Investment Report, June 2015
Equity 58.10
HDFC Bank Ltd. Banks 4.51
Infosys Technologies Ltd. IT - Software 4.32
ICICI Bank Ltd. Banks 3.86
HDFC Ltd. Finance 3.65
ITC Ltd. Tobacco Products 3.45
Larsen and Toubro Ltd. Capital Goods-Non Electrical 3.35
Tata Consultancy Services Ltd. IT - Software 3.20
Reliance Industries Ltd. Refineries 3.13
Axis Bank Ltd. Banks 2.45
Tata Motors Ltd. Automobile 2.45
Sun Pharmaceuticals Industries Ltd. Pharmaceuticals 1.92
State Bank of India Banks 1.69
Dr. Reddys Laboratories Ltd. Pharmaceuticals 1.67
Asian Paints Ltd. Paints/Varnish 1.66
Mahindra and Mahindra Ltd. Automobile 1.61
Other Equity 15.18
Government Securities 33.60
8.20% GOI 24-Sep-25 Sovereign 22.56
8.20% GOI 10-Nov-23 Sovereign 5.01
7.95% GOI 18-Jan-25 Sovereign 3.36
9.15% GOI 14-Nov-24 Sovereign 2.67
Corporate Bonds 2.96
9.35% PGC Ltd. 29-Aug-25 AAA 2.96
Cash Bank & Others 5.34
Total 100.00
Note : The investment income and prices may go down as well as up. “SinceInception” and returns above “1 Year” are calculated as per CAGR.
Fund Performance
Last 3 Months 31-Mar-15 15.9054 -1.06%Last 6 Months 31-Dec-14 15.2975 2.87%Last 1 Year 30-Jun-14 13.9944 12.45%Last 2 Years 28-Jun-13 11.6619 16.17%Last 3 Years 29-Jun-12 10.3294 15.07%Last 4 Years 30-Jun-11 10.7766 9.93%Last 5 Years 30-Jun-10 10.2722 8.91%Since Inception 10-May-10 10.0000 9.22%
PERIOD DATE NAV NAVChange

Equity Fund Debt Fund Hybrid Fund
Fund Details Portfolio
5.10%
6.50%
20.18%
5.01%
1.89%
2.10%
3.85%
4.05%
4.09%
4.76%
6.22%
8.78%
9.64%
17.82%
0.00% 10.00% 20.00% 30.00% 40.00% 50.00%
Cash Bank & Others
Corporate Bonds
Government Securities
Others
Crude Oil & Natural Gas
FMCG
Tobacco Products
Refineries
Capital Goods-Non Electrical
Finance
Pharmaceuticals
Automobile
IT - Software
Banks
68.22%
20.18%
6.50%
5.10%
Equity
Government Securities
Corporate Bonds
Cash Bank & Others
Sector Allocation Asset Allocation
The fund would be predominantly invested in equity at inception, wherein the dynamic asset allocation mechanism allocates the portfolio between equity and debt. This dynamic asset allocation is based on the performance of equity markets and movements in interest rates. The equity allocation may be reallocated to debt if the equity markets or interest rates fall , to safeguard the guarantee.
Over time, the asset mix will predominantly shift to debt to protect the guarantee. This dynamic asset allocation process will drive the returns generated by the Apex Return Lock-in Fund. The dynamic asset allocation shifts the allocation of the fund from an equity bias to a debt bias, overtime. This would mean that the Guaranteed NAV would not mimic the highest level of the equity market ,over the period the guarantee is applicable. Any unexpected and sharp falls in equity market and/ or interest rates, during the period the guarantee is applicable, may trigger the allocation to completely move towards debt, to protect the highest NAV achieved prior to the fall. Overall, it is an ideal fund for an investor who wants to take advantage of high returns in a positive market scenario while safeguarding the investment during any downturn.the investment during any downturn.
Instrument Industry/Rating % Of NAV Instrument Industry/Rating % Of NAVInvestment Objective : The investment objective for Apex Pension 20 Return Lock-in Fund is to use the participation in an actively managed well diversified equity portfolio of large cap companies to generate capital appreciation and use high credit quality debt instruments to lock-in that capital appreciation. The initial asset allocation in equities is targeted at 80% to 100%.
NAV as on 30 June, 15 : `16.3571
The Highest Nav recorded on reset date is
: `16.8116
Benchmark : -
Corpus as on 30 June, 15 : `3.27 Crs.
Debt Investment StyleCredit Quality
High Mid Low Interest Rate Sensitivity
High
Mid
Low
Equity Investment StyleInvestment Style
Value Blend Growth Size
Large
Mid
Small
Apex Pension 20 Return Lock-in Fund ULIF 045 20/01/10 PR4 110Fund Assure, Investment Report, June 2015
Equity 68.22
HDFC Bank Ltd. Banks 5.06
Infosys Technologies Ltd. IT - Software 4.81
HDFC Ltd. Finance 4.76
ICICI Bank Ltd. Banks 4.47
Larsen and Toubro Ltd. Capital Goods-Non Electrical 4.09
ITC Ltd. Tobacco Products 3.85
Axis Bank Ltd. Banks 3.84
Tata Consultancy Services Ltd. IT - Software 3.70
Reliance Industries Ltd. Refineries 3.52
Tata Motors Ltd. Automobile 3.12
State Bank of India Banks 2.41
Maruti Suzuki India Ltd. Automobile 2.15
Sun Pharmaceuticals Industries Ltd. Pharmaceuticals 2.14
Hindustan Unilever Ltd. FMCG 2.10
Mahindra and Mahindra Ltd. Automobile 1.96
Other Equity 16.23
Government Securities 20.18
8.97% GOI 05-Dec-30 Sovereign 15.24
8.28% GOI 15-Feb-32 Sovereign 4.94
Corporate Bonds 6.50
9.35% PGC Ltd. 29-Aug-30 AAA 6.50
Cash Bank & Others 5.10
Total 100.00
Note : The investment income and prices may go down as well as up. “SinceInception” and returns above “1 Year” are calculated as per CAGR.
Fund Performance
Last 3 Months 31-Mar-15 16.4690 -0.68%Last 6 Months 31-Dec-14 15.9131 2.79%Last 1 Year 30-Jun-14 14.4195 13.44%Last 2 Years 28-Jun-13 11.7926 17.77%Last 3 Years 29-Jun-12 10.4089 16.26%Last 4 Years 30-Jun-11 10.8392 10.84%Last 5 Years 30-Jun-10 10.3003 9.69%Since Inception 10-May-10 10.0000 10.04%
PERIOD DATE NAV NAVChange

Equity Fund Debt Fund Hybrid Fund
Fund Details Portfolio
Note : The investment income and prices may go down as well as up. “SinceInception” and returns above “1 Year” are calculated as per CAGR.
Fund Performance
Last 3 Months 31-Mar-15 14.2012 -0.20%Last 6 Months 31-Dec-14 13.7409 3.14%Last 1 Year 30-Jun-14 12.6248 12.26%Last 2 Years 28-Jun-13 10.5634 15.83%Last 3 Years 29-Jun-12 9.3919 14.70%Last 4 Years 30-Jun-11 9.6886 9.98%Since Inception 13-Sep-10 10.0000 7.54%
PERIOD DATE NAV NAVChange
6.61%
12.31%
36.84%
3.87%
1.14%
1.24%
2.57%
2.66%
2.81%
3.02%
3.76%
5.71%
6.28%
11.16%
0.00% 10.00% 20.00% 30.00% 40.00% 50.00%
Cash Bank & Others
Government Securities
Corporate Bonds
Others
Telecomm-Service
Crude Oil & Natural Gas
Tobacco Products
Capital Goods-Non Electrical
Finance
Refineries
Pharmaceuticals
Automobile
IT - Software
Banks
44.23%
36.84%12.31%
6.61%
Equity
Corporate Bonds
Government Securities
Cash Bank & Others
Sector Allocation Asset Allocation
The fund would be predominantly invested in equity at inception, wherein the dynamic asset allocation mechanism allocates the portfolio between equity and debt. This dynamic asset allocation is based on the performance of equity markets and movements in interest rates. The equity allocation may be reallocated to debt if the equity markets or interest rates fall , to safeguard the guarantee.
Over time, the asset mix will predominantly shift to debt to protect the guarantee. This dynamic asset allocation process will drive the returns generated by the Apex Return Lock-in Fund. The dynamic asset allocation shifts the allocation of the fund from an equity bias to a debt bias, overtime. This would mean that the Guaranteed NAV would not mimic the highest level of the equity market ,over the period the guarantee is applicable. Any unexpected and sharp falls in equity market and/ or interest rates, during the period the guarantee is applicable, may trigger the allocation to completely move towards debt, to protect the highest NAV achieved prior to the fall. Overall, it is an ideal fund for an investor who wants to take advantage of high returns in a positive market scenario while safeguarding the investment during any downturn.the investment during any downturn.
Instrument Industry/Rating % Of NAV Instrument Industry/Rating % Of NAVInvestment Objective : The investment objective for Apex Plus Return Lock-in Fund - II is to use the participation in an actively managed well diversified equity portfolio of large cap companies to generate capital appreciation and use high credit quality debt instruments to lock-in that capital appreciation. The initial asset allocation in equities is targeted at 80% to 100%.
NAV as on 30 June, 15 : `14.1729
The Highest Nav recorded on reset date is
: `14.4301
Benchmark : -
Corpus as on 30 June, 15 : `36.85 Crs.
Debt Investment StyleCredit Quality
High Mid Low Interest Rate Sensitivity
High
Mid
Low
Equity Investment StyleInvestment Style
Value Blend Growth Size
Large
Mid
Small
Apex Plus Return Lock-in-Fund IIULIF 052 01/07/10 RA2 110Fund Assure, Investment Report, June 2015
Equity 44.23HDFC Bank Ltd. Banks 3.48Infosys Technologies Ltd. IT - Software 3.21ICICI Bank Ltd. Banks 2.97HDFC Ltd. Finance 2.81Larsen and Toubro Ltd. Capital Goods-Non Electrical 2.66ITC Ltd. Tobacco Products 2.57Reliance Industries Ltd. Refineries 2.49Tata Consultancy Services Ltd. IT - Software 2.42Axis Bank Ltd. Banks 1.90Tata Motors Ltd. Automobile 1.86State Bank of India Banks 1.64Sun Pharmaceuticals Industries Ltd. Pharmaceuticals 1.54Dr. Reddys Laboratories Ltd. Pharmaceuticals 1.45Maruti Suzuki India Ltd. Automobile 1.26Oil and Natural Gas Corpn Ltd. Crude Oil & Natural Gas 1.24Other Equity 10.74Government Securities 12.318.27% GOI 09-Jun-20 Sovereign 6.84
7.80% GOI 03-May-20 Sovereign 5.47Corporate Bonds 36.848.87% REC Ltd. 08-Mar-20 AAA 5.479.38% EXIM BANK 29-Sep-21 AAA 4.219.30% PGC LTD. 28-Jun-20 AAA 4.188.95% HDFC Ltd. 19-Oct-20 AAA 3.848.65% PFC Ltd. 15-Jun-20 AAA 3.809.61% PFC Ltd. 29-Jun-21 AAA 3.409.35% PGC Ltd. 29-Aug-20 AAA 2.798.18% NABARD 10-Feb-20 AAA 2.678.80% REC Ltd. 25-Oct-20 AAA 1.919.30% SAIL 25-May-20 AAA 1.399.29% PFC Ltd. 21-Aug-22 AAA 0.848.72% SAIL 30-Apr-20 AAA 0.829.25% PGC Ltd. 26-Dec-20 AAA 0.709.48% REC Ltd. 10-Aug-21 AAA 0.568.70% PFC Ltd. 14-May-20 AAA 0.27Cash Bank & Others 6.61Total 100.00

Equity Fund Debt Fund Hybrid Fund
Fund Details Portfolio
Instrument Industry/Rating % Of NAV Instrument Industry/Rating % Of NAV
6.35%
9.04%
41.87%
2.56%
0.89%
1.12%
2.48%
2.69%
2.82%
3.13%
3.68%
5.34%
6.26%
11.77%
0.00% 10.00% 20.00% 30.00% 40.00% 50.00%
Cash Bank & Others
Government Securities
Corporate Bonds
Others
Telecomm-Service
Crude Oil & Natural Gas
Tobacco Products
Capital Goods-Non Electrical
Finance
Refineries
Pharmaceuticals
Automobile
IT - Software
Banks
42.74%
41.87%
9.04%
6.35%
Equity
Corporate Bonds
Government Securities
Cash Bank & Others
Sector Allocation Asset Allocation
The fund would be predominantly invested in equity at inception, wherein the dynamic asset allocation mechanism allocates the portfolio between equity and debt. This dynamic asset allocation is based on the performance of equity markets and movements in interest rates. The equity allocation may be reallocated to debt if the equity markets or interest rates fall , to safeguard the guarantee.
Over time, the asset mix will predominantly shift to debt to protect the guarantee. This dynamic asset allocation process will drive the returns generated by the Apex Return Lock-in Fund. The dynamic asset allocation shifts the allocation of the fund from an equity bias to a debt bias, overtime. This would mean that the Guaranteed NAV would not mimic the highest level of the equity market ,over the period the guarantee is applicable. Any unexpected and sharp falls in equity market and/ or interest rates, during the period the guarantee is applicable, may trigger the allocation to completely move towards debt, to protect the highest NAV achieved prior to the fall. Overall, it is an ideal fund for an investor who wants to take advantage of high returns in a positive market scenario while safeguarding the investment during any downturn.the investment during any downturn.
Investment Objective : The investment objective for Apex Pension Return Lock-in Fund - II is to use the participation in an actively managed well diversified equity portfolio of large cap companies to generate capital appreciation and use high credit quality debt instruments to lock-in - II that capital appreciation. The initial asset allocation in equities is targeted at 80% to 100%.
NAV as on 30 June, 15 : `14.4098
The Highest Nav recorded on reset date is
: `14.6900
Benchmark : -
Corpus as on 30 June, 15 : `8.27 Crs.
Debt Investment StyleCredit Quality
High Mid Low Interest Rate Sensitivity
High
Mid
Low
Equity Investment StyleInvestment Style
Value Blend Growth Size
Large
Mid
Small
Apex Pension Return Lock-in Fund IIULIF 048 01/07/10 PR5 110Fund Assure, Investment Report, June 2015
Equity 42.74HDFC Bank Ltd. Banks 3.42
Infosys Technologies Ltd. IT - Software 3.21
HDFC Ltd. Finance 2.82
ICICI Bank Ltd. Banks 2.79
Larsen and Toubro Ltd. Capital Goods-Non Electrical 2.69
ITC Ltd. Tobacco Products 2.48
Reliance Industries Ltd. Refineries 2.18
Tata Consultancy Services Ltd. IT - Software 2.16
Tata Motors Ltd. Automobile 2.10
Axis Bank Ltd. Banks 1.86
Sun Pharmaceuticals Industries Ltd. Pharmaceuticals 1.59
IndusInd Bank Ltd. Banks 1.58
State Bank of India Banks 1.43
Maruti Suzuki India Ltd. Automobile 1.22
Dr. Reddys Laboratories Ltd. Pharmaceuticals 1.18
Other Equity 10.04
Government Securities 9.04
7.80% GOI 03-May-20 Sovereign 4.78
8.27% GOI 09-Jun-20 Sovereign 4.26
Corporate Bonds 41.87
9.30% SAIL 25-May-20 AAA 6.19
8.18% NABARD 10-Feb-20 AAA 5.94
8.95% HDFC Ltd. 19-Oct-20 AAA 4.89
8.87% REC Ltd. 08-Mar-20 AAA 4.878.75% Reliance Industries Ltd. 07-May-20 AAA 4.85
9.61% PFC Ltd. 29-Jun-21 AAA 3.79
9.35% PGC Ltd. 29-Aug-20 AAA 3.73
8.70% PFC Ltd. 14-May-20 AAA 3.63
8.80% REC Ltd. 25-Oct-20 AAA 2.43
9.30% PGC LTD. 28-Jun-20 AAA 1.55
Cash Bank & Others 6.35
Total 100.00
Fund PerformancePERIOD DATE NAV NAV
Change
Note : The investment income and prices may go down as well as up. “SinceInception” and returns above “1 Year” are calculated as per CAGR.
Last 3 Months 31-Mar-15 14.4644 -0.38%Last 6 Months 31-Dec-14 13.9904 3.00%Last 1 Year 30-Jun-14 12.8490 12.15%Last 2 Years 28-Jun-13 10.7042 16.03%Last 3 Years 29-Jun-12 9.5252 14.80%Last 4 Years 30-Jun-11 9.7724 10.20%Since Inception 13-Sep-10 10.0000 7.91%

Equity Fund Debt Fund Hybrid Fund
Fund Details Portfolio
6.89%
12.70%
36.14%
4.25%
1.22%
1.29%
2.48%
2.67%
2.75%
3.04%
4.13%
5.15%
5.19%
12.09%
0.00% 10.00% 20.00% 30.00% 40.00%
Cash Bank & Others
Government Securities
Corporate Bonds
Others
Telecomm-Service
Paints/Varnish
Tobacco Products
Finance
Capital Goods-Non Electrical
Refineries
Pharmaceuticals
IT - Software
Automobile
Banks
44.27%
36.14%12.70%
6.89%
Equity
Corporate Bonds
Government Securities
Cash Bank & Others
Sector Allocation Asset Allocation
The fund would be predominantly invested in equity at inception, wherein the dynamic asset allocation mechanism allocates the portfolio between equity and debt. This dynamic asset allocation is based on the performance of equity markets and movements in interest rates. The equity allocation may be reallocated to debt if the equity markets or interest rates fall , to safeguard the guarantee.
Over time, the asset mix will predominantly shift to debt to protect the guarantee. This dynamic asset allocation process will drive the returns generated by the Apex Return Lock-in Fund. The dynamic asset allocation shifts the allocation of the fund from an equity bias to a debt bias, overtime. This would mean that the Guaranteed NAV would not mimic the highest level of the equity market ,over the period the guarantee is applicable. Any unexpected and sharp falls in equity market and/ or interest rates, during the period the guarantee is applicable, may trigger the allocation to completely move towards debt, to protect the highest NAV achieved prior to the fall. Overall, it is an ideal fund for an investor who wants to take advantage of high returns in a positive market scenario while safeguarding the investment during any downturn.the investment during any downturn.
Instrument Industry/Rating % Of NAV Instrument Industry/Rating % Of NAVInvestment Objective : The investment objective for Apex Pension 10 Return Lock-in Fund -II is to use the participation in an actively managed well diversified equity portfolio of large cap companies to generate capital appreciation and use high credit quality debt instruments to lock-in that capital appreciation. The initial asset allocation in equities is targeted at 80% to 100%.
NAV as on 30 June, 15 : `14.3476
The Highest Nav recorded on reset date is
: `14.6359
Benchmark : -
Corpus as on 30 June, 15 : `29.19 Crs.
Debt Investment StyleCredit Quality
High Mid Low Interest Rate Sensitivity
High
Mid
Low
Equity Investment StyleInvestment Style
Value Blend Growth Size
Large
Mid
Small
Apex Pension 10 Return Lock-in Fund IIULIF 049 01/07/10 PR6 110 Fund Assure, Investment Report, June 2015
Equity 44.27HDFC Bank Ltd. Banks 3.47Infosys Technologies Ltd. IT - Software 2.97ICICI Bank Ltd. Banks 2.95Larsen and Toubro Ltd. Capital Goods-Non Electrical 2.75HDFC Ltd. Finance 2.67ITC Ltd. Tobacco Products 2.48Tata Consultancy Services Ltd. IT - Software 2.19Reliance Industries Ltd. Refineries 2.06Tata Motors Ltd. Automobile 1.96Axis Bank Ltd. Banks 1.92State Bank of India Banks 1.67Sun Pharmaceuticals Industries Ltd. Pharmaceuticals 1.50Dr. Reddys Laboratories Ltd. Pharmaceuticals 1.34Asian Paints Ltd. Paints/Varnish 1.29Lupin Ltd. Pharmaceuticals 1.29Other Equity 11.77Government Securities 12.708.27% GOI 09-Jun-20 Sovereign 6.917.80% GOI 03-May-20 Sovereign 5.79
Corporate Bonds 36.148.87% REC Ltd. 08-Mar-20 AAA 6.229.38% EXIM BANK 29-Sep-21 AAA 3.908.95% HDFC Ltd. 19-Oct-20 AAA 3.818.65% PFC Ltd. 15-Jun-20 AAA 3.779.61% PFC Ltd. 29-Jun-21 AAA 3.229.35% PGC Ltd. 29-Aug-20 AAA 2.828.72% SAIL 30-Apr-20 AAA 2.068.18% NABARD 10-Feb-20 AAA 2.029.30% SAIL 25-May-20 AAA 1.768.80% REC Ltd. 25-Oct-20 AAA 1.729.57% IRFC Ltd. 31-May-21 AAA 1.449.30% PGC LTD. 28-Jun-20 AAA 1.329.29% PFC Ltd. 21-Aug-22 AAA 0.708.93% NTPC Ltd. 19-Jan-21 AAA 0.698.75% SAIL 23-Apr-20 AAA 0.348.70% PFC Ltd. 14-May-20 AAA 0.34Cash Bank & Others 6.89Total 100.00
Note : The investment income and prices may go down as well as up. “SinceInception” and returns above “1 Year” are calculated as per CAGR.
Fund PerformancePERIOD DATE NAV NAV
ChangeLast 3 Months 31-Mar-15 14.3830 -0.25%Last 6 Months 31-Dec-14 13.9282 3.01%Last 1 Year 30-Jun-14 12.8544 11.62%Last 2 Years 28-Jun-13 10.6506 16.07%Last 3 Years 29-Jun-12 9.5427 14.56%Last 4 Years 30-Jun-11 9.7105 10.25%Since Inception 13-Sep-10 10.0000 7.82%

Equity Fund Debt Fund Hybrid Fund
Fund Details Portfolio
6.66%
35.80%
6.32%
1.44%
1.63%
3.05%
3.30%
3.74%
3.74%
4.59%
6.93%
7.60%
15.20%
0.00% 10.00% 20.00% 30.00% 40.00%
Cash Bank & Others
Government Securities
Others
FMCG
Telecomm-Service
Refineries
Tobacco Products
Finance
Capital Goods-Non Electrical
Pharmaceuticals
Automobile
IT - Software
Banks
57.54%
35.80%
6.66%
Equity
Government Securities
Cash Bank & Others
Sector Allocation Asset Allocation
The fund would be predominantly invested in equity at inception, wherein the dynamic asset allocation mechanism allocates the portfolio between equity and debt. This dynamic asset allocation is based on the performance of equity markets and movements in interest rates. The equity allocation may be reallocated to debt if the equity markets or interest rates fall , to safeguard the guarantee.
Over time, the asset mix will predominantly shift to debt to protect the guarantee. This dynamic asset allocation process will drive the returns generated by the Apex Return Lock-in Fund. The dynamic asset allocation shifts the allocation of the fund from an equity bias to a debt bias, overtime. This would mean that the Guaranteed NAV would not mimic the highest level of the equity market ,over the period the guarantee is applicable. Any unexpected and sharp falls in equity market and/ or interest rates, during the period the guarantee is applicable, may trigger the allocation to completely move towards debt, to protect the highest NAV achieved prior to the fall. Overall, it is an ideal fund for an investor who wants to take advantage of high returns in a positive market scenario while safeguarding the investment during any downturn.the investment during any downturn.
Instrument Industry/Rating % Of NAV Instrument Industry/Rating % Of NAV
Apex Pension 15 Return Lock-in Fund IIULIF 050 01/07/10 PR7 110 Fund Assure, Investment Report, June 2015
Equity 57.54
HDFC Bank Ltd. Banks 4.43
Infosys Technologies Ltd. IT - Software 4.13
ICICI Bank Ltd. Banks 3.85
Larsen and Toubro Ltd. Capital Goods-Non Electrical 3.74
HDFC Ltd. Finance 3.74
ITC Ltd. Tobacco Products 3.30
Tata Consultancy Services Ltd. IT - Software 2.67
Axis Bank Ltd. Banks 2.44
Reliance Industries Ltd. Refineries 2.36
Tata Motors Ltd. Automobile 2.12
Sun Pharmaceuticals Industries Ltd. Pharmaceuticals 1.99
State Bank of India Banks 1.84
Bharti Airtel Ltd. Telecomm-Service 1.63
Maruti Suzuki India Ltd. Automobile 1.58
Mahindra and Mahindra Ltd. Automobile 1.57
Other Equity 16.17
Government Securities 35.80
8.20% GOI 24-Sep-25 Sovereign 19.22
9.15% GOI 14-Nov-24 Sovereign 9.31
6.90% GOI 04-Feb-26 Sovereign 4.73
7.95% GOI 18-Jan-25 Sovereign 2.55
Cash Bank & Others 6.66
Total 100.00
Investment Objective : The investment objective for Apex Pension 15 Return Lock-in Fund - II is to use the participation in an actively managed well diversified equity portfolio of large cap companies to generate capital appreciation and use high credit quality debt instruments to lock-in that capital appreciation. The initial asset allocation in equities is targeted at 80% to 100%.
NAV as on 30 June, 15 : `14.6323
The Highest Nav recorded on reset date is
: `15.0358
Benchmark : -
Corpus as on 30 June, 15 : `5.73 Crs.
Debt Investment StyleCredit Quality
High Mid Low Interest Rate Sensitivity
High
Mid
Low
Equity Investment StyleInvestment Style
Value Blend Growth Size
Large
Mid
Small
Note : The investment income and prices may go down as well as up. “SinceInception” and returns above “1 Year” are calculated as per CAGR.
Fund PerformancePERIOD DATE NAV NAV
ChangeLast 3 Months 31-Mar-15 14.7401 -0.73%Last 6 Months 31-Dec-14 14.2659 2.57%Last 1 Year 30-Jun-14 12.9703 12.81%Last 2 Years 28-Jun-13 10.7797 16.51%Last 3 Years 29-Jun-12 9.6345 14.95%Last 4 Years 30-Jun-11 9.7676 10.63%Since Inception 13-Sep-10 10.0000 8.26%
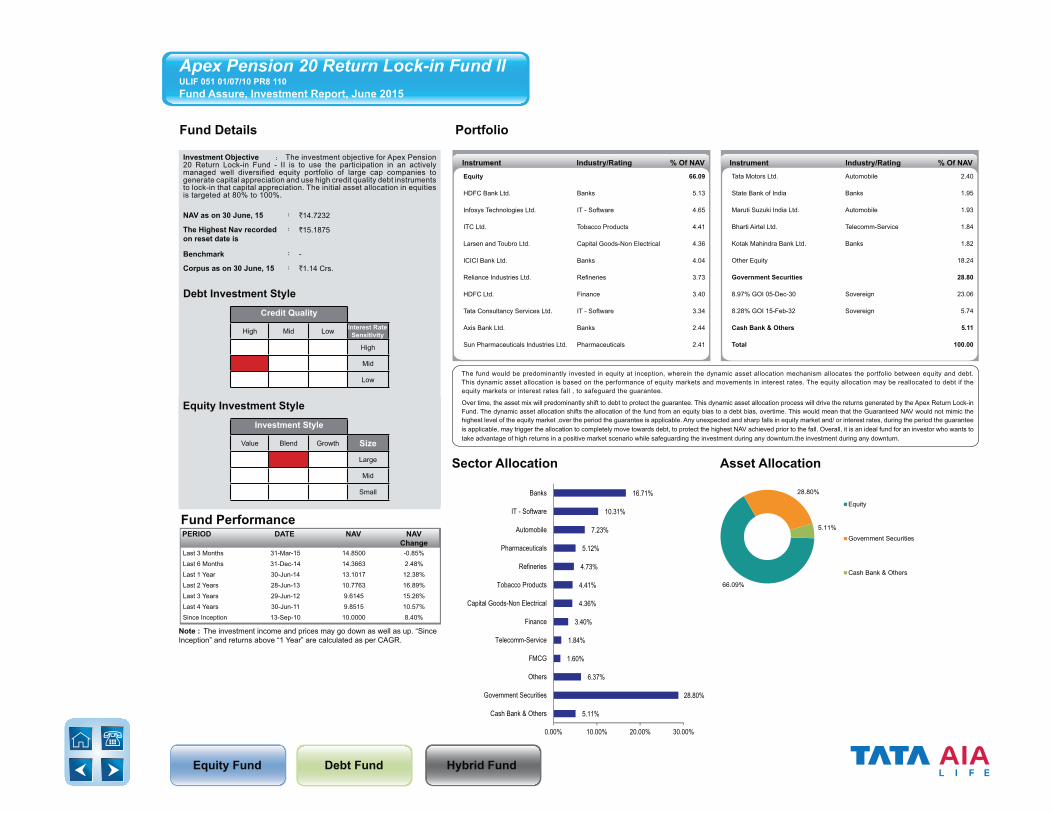
Equity Fund Debt Fund Hybrid Fund
Fund Details Portfolio
Instrument Industry/Rating % Of NAV Instrument Industry/Rating % Of NAV
5.11%
28.80%
6.37%
1.60%
1.84%
3.40%
4.36%
4.41%
4.73%
5.12%
7.23%
10.31%
16.71%
0.00% 10.00% 20.00% 30.00%
Cash Bank & Others
Government Securities
Others
FMCG
Telecomm-Service
Finance
Capital Goods-Non Electrical
Tobacco Products
Refineries
Pharmaceuticals
Automobile
IT - Software
Banks
66.09%
28.80%
5.11%
Equity
Government Securities
Cash Bank & Others
Sector Allocation Asset Allocation
The fund would be predominantly invested in equity at inception, wherein the dynamic asset allocation mechanism allocates the portfolio between equity and debt. This dynamic asset allocation is based on the performance of equity markets and movements in interest rates. The equity allocation may be reallocated to debt if the equity markets or interest rates fall , to safeguard the guarantee.
Over time, the asset mix will predominantly shift to debt to protect the guarantee. This dynamic asset allocation process will drive the returns generated by the Apex Return Lock-in Fund. The dynamic asset allocation shifts the allocation of the fund from an equity bias to a debt bias, overtime. This would mean that the Guaranteed NAV would not mimic the highest level of the equity market ,over the period the guarantee is applicable. Any unexpected and sharp falls in equity market and/ or interest rates, during the period the guarantee is applicable, may trigger the allocation to completely move towards debt, to protect the highest NAV achieved prior to the fall. Overall, it is an ideal fund for an investor who wants to take advantage of high returns in a positive market scenario while safeguarding the investment during any downturn.the investment during any downturn.
Investment Objective : The investment objective for Apex Pension 20 Return Lock-in Fund - II is to use the participation in an actively managed well diversified equity portfolio of large cap companies to generate capital appreciation and use high credit quality debt instruments to lock-in that capital appreciation. The initial asset allocation in equities is targeted at 80% to 100%.
NAV as on 30 June, 15 : `14.7232
The Highest Nav recorded on reset date is
: `15.1875
Benchmark : -
Corpus as on 30 June, 15 : `1.14 Crs.
Debt Investment StyleCredit Quality
High Mid Low Interest Rate Sensitivity
High
Mid
Low
Equity Investment StyleInvestment Style
Value Blend Growth Size
Large
Mid
Small
Apex Pension 20 Return Lock-in Fund IIULIF 051 01/07/10 PR8 110 Fund Assure, Investment Report, June 2015
Equity 66.09
HDFC Bank Ltd. Banks 5.13
Infosys Technologies Ltd. IT - Software 4.65
ITC Ltd. Tobacco Products 4.41
Larsen and Toubro Ltd. Capital Goods-Non Electrical 4.36
ICICI Bank Ltd. Banks 4.04
Reliance Industries Ltd. Refineries 3.73
HDFC Ltd. Finance 3.40
Tata Consultancy Services Ltd. IT - Software 3.34
Axis Bank Ltd. Banks 2.44
Sun Pharmaceuticals Industries Ltd. Pharmaceuticals 2.41
Tata Motors Ltd. Automobile 2.40
State Bank of India Banks 1.95
Maruti Suzuki India Ltd. Automobile 1.93
Bharti Airtel Ltd. Telecomm-Service 1.84
Kotak Mahindra Bank Ltd. Banks 1.82
Other Equity 18.24
Government Securities 28.80
8.97% GOI 05-Dec-30 Sovereign 23.06
8.28% GOI 15-Feb-32 Sovereign 5.74
Cash Bank & Others 5.11
Total 100.00
Note : The investment income and prices may go down as well as up. “SinceInception” and returns above “1 Year” are calculated as per CAGR.
Fund PerformancePERIOD DATE NAV NAV
ChangeLast 3 Months 31-Mar-15 14.8500 -0.85%Last 6 Months 31-Dec-14 14.3663 2.48%Last 1 Year 30-Jun-14 13.1017 12.38%Last 2 Years 28-Jun-13 10.7763 16.89%Last 3 Years 29-Jun-12 9.6145 15.26%Last 4 Years 30-Jun-11 9.8515 10.57%Since Inception 13-Sep-10 10.0000 8.40%
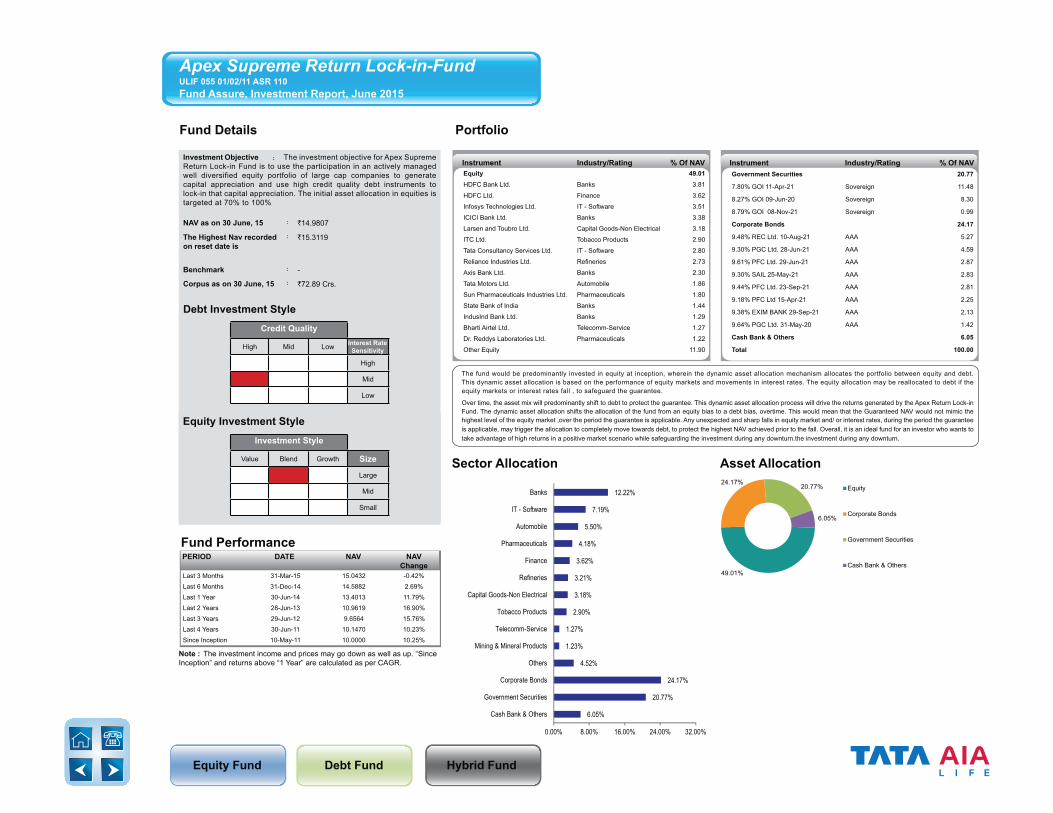
Equity Fund Debt Fund Hybrid Fund
Fund Details Portfolio
6.05%
20.77%
24.17%
4.52%
1.23%
1.27%
2.90%
3.18%
3.21%
3.62%
4.18%
5.50%
7.19%
12.22%
0.00% 8.00% 16.00% 24.00% 32.00%
Cash Bank & Others
Government Securities
Corporate Bonds
Others
Mining & Mineral Products
Telecomm-Service
Tobacco Products
Capital Goods-Non Electrical
Refineries
Finance
Pharmaceuticals
Automobile
IT - Software
Banks
49.01%
24.17%20.77%
6.05%
Equity
Corporate Bonds
Government Securities
Cash Bank & Others
Sector Allocation Asset Allocation
The fund would be predominantly invested in equity at inception, wherein the dynamic asset allocation mechanism allocates the portfolio between equity and debt. This dynamic asset allocation is based on the performance of equity markets and movements in interest rates. The equity allocation may be reallocated to debt if the equity markets or interest rates fall , to safeguard the guarantee.
Over time, the asset mix will predominantly shift to debt to protect the guarantee. This dynamic asset allocation process will drive the returns generated by the Apex Return Lock-in Fund. The dynamic asset allocation shifts the allocation of the fund from an equity bias to a debt bias, overtime. This would mean that the Guaranteed NAV would not mimic the highest level of the equity market ,over the period the guarantee is applicable. Any unexpected and sharp falls in equity market and/ or interest rates, during the period the guarantee is applicable, may trigger the allocation to completely move towards debt, to protect the highest NAV achieved prior to the fall. Overall, it is an ideal fund for an investor who wants to take advantage of high returns in a positive market scenario while safeguarding the investment during any downturn.the investment during any downturn.
Instrument Industry/Rating % Of NAV Instrument Industry/Rating % Of NAVInvestment Objective : The investment objective for Apex Supreme Return Lock-in Fund is to use the participation in an actively managed well diversified equity portfolio of large cap companies to generate capital appreciation and use high credit quality debt instruments to lock-in that capital appreciation. The initial asset allocation in equities is targeted at 70% to 100%
NAV as on 30 June, 15 : `14.9807
The Highest Nav recorded on reset date is
: `15.3119
Benchmark : -
Corpus as on 30 June, 15 : `72.89 Crs.
Debt Investment StyleCredit Quality
High Mid Low Interest Rate Sensitivity
High
Mid
Low
Equity Investment StyleInvestment Style
Value Blend Growth Size
Large
Mid
Small
Apex Supreme Return Lock-in-Fund ULIF 055 01/02/11 ASR 110Fund Assure, Investment Report, June 2015
Equity 49.01HDFC Bank Ltd. Banks 3.81
HDFC Ltd. Finance 3.62
Infosys Technologies Ltd. IT - Software 3.51
ICICI Bank Ltd. Banks 3.38
Larsen and Toubro Ltd. Capital Goods-Non Electrical 3.18
ITC Ltd. Tobacco Products 2.90
Tata Consultancy Services Ltd. IT - Software 2.80
Reliance Industries Ltd. Refineries 2.73
Axis Bank Ltd. Banks 2.30
Tata Motors Ltd. Automobile 1.86
Sun Pharmaceuticals Industries Ltd. Pharmaceuticals 1.80
State Bank of India Banks 1.44
IndusInd Bank Ltd. Banks 1.29
Bharti Airtel Ltd. Telecomm-Service 1.27
Dr. Reddys Laboratories Ltd. Pharmaceuticals 1.22
Other Equity 11.90
Government Securities 20.77
7.80% GOI 11-Apr-21 Sovereign 11.48
8.27% GOI 09-Jun-20 Sovereign 8.30
8.79% GOI 08-Nov-21 Sovereign 0.99
Corporate Bonds 24.17
9.48% REC Ltd. 10-Aug-21 AAA 5.27
9.30% PGC Ltd. 28-Jun-21 AAA 4.59
9.61% PFC Ltd. 29-Jun-21 AAA 2.87
9.30% SAIL 25-May-21 AAA 2.83
9.44% PFC Ltd. 23-Sep-21 AAA 2.81
9.18% PFC Ltd 15-Apr-21 AAA 2.25
9.38% EXIM BANK 29-Sep-21 AAA 2.13
9.64% PGC Ltd. 31-May-20 AAA 1.42
Cash Bank & Others 6.05
Total 100.00
Note : The investment income and prices may go down as well as up. “SinceInception” and returns above “1 Year” are calculated as per CAGR.
Fund PerformancePERIOD DATE NAV NAV
ChangeLast 3 Months 31-Mar-15 15.0432 -0.42%Last 6 Months 31-Dec-14 14.5882 2.69%Last 1 Year 30-Jun-14 13.4013 11.79%Last 2 Years 28-Jun-13 10.9619 16.90%Last 3 Years 29-Jun-12 9.6564 15.76%Last 4 Years 30-Jun-11 10.1470 10.23%Since Inception 10-May-11 10.0000 10.25%

Equity Fund Debt Fund Hybrid Fund
Fund Details Portfolio
Instrument Industry/Rating % Of NAV Instrument Industry/Rating % Of NAV
5.12%
20.45%
24.26%
3.20%
1.28%
1.43%
2.85%
3.12%
3.15%
3.33%
5.07%
5.51%
7.50%
13.74%
0.00% 8.00% 16.00% 24.00% 32.00%
Cash Bank & Others
Government Securities
Corporate Bonds
Others
Paints/Varnish
Telecomm-Service
Tobacco Products
Finance
Refineries
Capital Goods-Non Electrical
Pharmaceuticals
Automobile
IT - Software
Banks
50.17%
24.26%
20.45%
5.12%
Equity
Corporate Bonds
Government Securities
Cash Bank & Others
Sector Allocation Asset Allocation
The fund would be predominantly invested in equity at inception, wherein the dynamic asset allocation mechanism allocates the portfolio between equity and debt. This dynamic asset allocation is based on the performance of equity markets and movements in interest rates. The equity allocation may be reallocated to debt if the equity markets or interest rates fall , to safeguard the guarantee.
Over time, the asset mix will predominantly shift to debt to protect the guarantee. This dynamic asset allocation process will drive the returns generated by the Apex Return Lock-in Fund. The dynamic asset allocation shifts the allocation of the fund from an equity bias to a debt bias, overtime. This would mean that the Guaranteed NAV would not mimic the highest level of the equity market ,over the period the guarantee is applicable. Any unexpected and sharp falls in equity market and/ or interest rates, during the period the guarantee is applicable, may trigger the allocation to completely move towards debt, to protect the highest NAV achieved prior to the fall. Overall, it is an ideal fund for an investor who wants to take advantage of high returns in a positive market scenario while safeguarding the investment during any downturn.the investment during any downturn.
Investment Objective : The investment objective for Apex Supreme Return Lock-in Fund - II is to use the participation in an actively managed well diversified equity portfolio of large cap companies to generate capital appreciation and use high credit quality debt instruments to lock-in that capital appreciation. The initial asset allocation in equities is targeted at 70% to 100%.
NAV as on 30 June, 15 : `15.9976
The Highest Nav recorded on reset date is
: `16.3837
Benchmark : -
Corpus as on 30 June, 15 : `35.34 Crs.
Debt Investment StyleCredit Quality
High Mid Low Interest Rate Sensitivity
High
Mid
Low
Equity Investment StyleInvestment Style
Value Blend Growth Size
Large
Mid
Small
Apex Supreme Return Lock-in Fund II ULIF 057 01/07/11 SR2 110Fund Assure, Investment Report, June 2015
Equity 50.17
HDFC Bank Ltd. Banks 4.00
Infosys Technologies Ltd. IT - Software 3.73
Larsen and Toubro Ltd. Capital Goods-Non Electrical 3.33
ICICI Bank Ltd. Banks 3.27
HDFC Ltd. Finance 3.12
ITC Ltd. Tobacco Products 2.85
Tata Consultancy Services Ltd. IT - Software 2.78
Reliance Industries Ltd. Refineries 2.41
Axis Bank Ltd. Banks 2.37
Sun Pharmaceuticals Industries Ltd. Pharmaceuticals 1.98
Tata Motors Ltd. Automobile 1.94
Dr. Reddys Laboratories Ltd. Pharmaceuticals 1.76
State Bank of India Banks 1.49
Bharti Airtel Ltd. Telecomm-Service 1.43
Kotak Mahindra Bank Ltd. Banks 1.37
Other Equity 12.33
Government Securities 20.45
7.80% GOI 11-Apr-21 Sovereign 8.36
8.27% GOI 09-Jun-20 Sovereign 7.13
8.79% GOI 08-Nov-21 Sovereign 4.96
Corporate Bonds 24.26
9.48% REC Ltd. 10-Aug-21 AAA 6.47
9.30% PGC Ltd. 28-Jun-21 AAA 4.37
9.38% EXIM BANK 29-Sep-21 AAA 3.80
9.44% PFC Ltd. 23-Sep-21 AAA 2.90
9.61% PFC Ltd. 29-Jun-21 AAA 2.66
9.18% PFC Ltd 15-Apr-21 AAA 2.61
9.25% PGC Ltd. 26-Dec-20 AAA 1.45
Cash Bank & Others 5.12
Total 100.00
Fund Performance
Note : The investment income and prices may go down as well as up. “SinceInception” and returns above “1 Year” are calculated as per CAGR.
Last 3 Months 31-Mar-15 16.0940 -0.60%Last 6 Months 31-Dec-14 15.5242 3.05%Last 1 Year 30-Jun-14 14.1835 12.79%Last 2 Years 28-Jun-13 11.8470 16.20%Last 3 Years 29-Jun-12 10.4190 15.37%Since Inception 10-Oct-11 10.0000 13.45%
PERIOD DATE NAV NAVChange
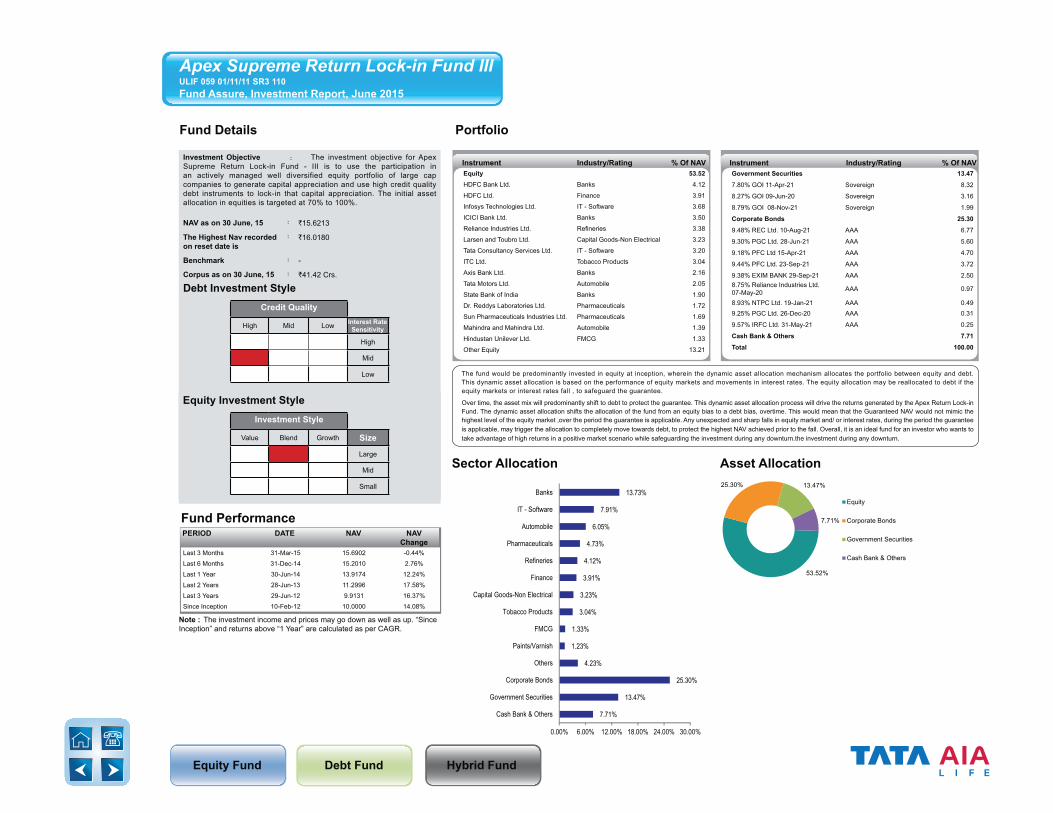
Equity Fund Debt Fund Hybrid Fund
Fund Details Portfolio
Instrument Industry/Rating % Of NAV Instrument Industry/Rating % Of NAV
7.71%
13.47%
25.30%
4.23%
1.23%
1.33%
3.04%
3.23%
3.91%
4.12%
4.73%
6.05%
7.91%
13.73%
0.00% 6.00% 12.00% 18.00% 24.00% 30.00%
Cash Bank & Others
Government Securities
Corporate Bonds
Others
Paints/Varnish
FMCG
Tobacco Products
Capital Goods-Non Electrical
Finance
Refineries
Pharmaceuticals
Automobile
IT - Software
Banks
53.52%
25.30% 13.47%
7.71%
Equity
Corporate Bonds
Government Securities
Cash Bank & Others
Sector Allocation Asset Allocation
The fund would be predominantly invested in equity at inception, wherein the dynamic asset allocation mechanism allocates the portfolio between equity and debt. This dynamic asset allocation is based on the performance of equity markets and movements in interest rates. The equity allocation may be reallocated to debt if the equity markets or interest rates fall , to safeguard the guarantee.
Over time, the asset mix will predominantly shift to debt to protect the guarantee. This dynamic asset allocation process will drive the returns generated by the Apex Return Lock-in Fund. The dynamic asset allocation shifts the allocation of the fund from an equity bias to a debt bias, overtime. This would mean that the Guaranteed NAV would not mimic the highest level of the equity market ,over the period the guarantee is applicable. Any unexpected and sharp falls in equity market and/ or interest rates, during the period the guarantee is applicable, may trigger the allocation to completely move towards debt, to protect the highest NAV achieved prior to the fall. Overall, it is an ideal fund for an investor who wants to take advantage of high returns in a positive market scenario while safeguarding the investment during any downturn.the investment during any downturn.
Investment Objective : The investment objective for Apex Supreme Return Lock-in Fund - III is to use the participation in an actively managed well diversified equity portfolio of large cap companies to generate capital appreciation and use high credit quality debt instruments to lock-in that capital appreciation. The initial asset allocation in equities is targeted at 70% to 100%.
NAV as on 30 June, 15 : `15.6213
The Highest Nav recorded on reset date is
: `16.0180
Benchmark : -
Corpus as on 30 June, 15 : `41.42 Crs.
Debt Investment StyleCredit Quality
High Mid Low Interest Rate Sensitivity
High
Mid
Low
Equity Investment StyleInvestment Style
Value Blend Growth Size
Large
Mid
Small
Apex Supreme Return Lock-in Fund IIIULIF 059 01/11/11 SR3 110 Fund Assure, Investment Report, June 2015
Equity 53.52HDFC Bank Ltd. Banks 4.12
HDFC Ltd. Finance 3.91
Infosys Technologies Ltd. IT - Software 3.68
ICICI Bank Ltd. Banks 3.50
Reliance Industries Ltd. Refineries 3.38
Larsen and Toubro Ltd. Capital Goods-Non Electrical 3.23
Tata Consultancy Services Ltd. IT - Software 3.20
ITC Ltd. Tobacco Products 3.04
Axis Bank Ltd. Banks 2.16
Tata Motors Ltd. Automobile 2.05
State Bank of India Banks 1.90
Dr. Reddys Laboratories Ltd. Pharmaceuticals 1.72
Sun Pharmaceuticals Industries Ltd. Pharmaceuticals 1.69
Mahindra and Mahindra Ltd. Automobile 1.39
Hindustan Unilever Ltd. FMCG 1.33
Other Equity 13.21
Government Securities 13.47
7.80% GOI 11-Apr-21 Sovereign 8.32
8.27% GOI 09-Jun-20 Sovereign 3.16
8.79% GOI 08-Nov-21 Sovereign 1.99
Corporate Bonds 25.30
9.48% REC Ltd. 10-Aug-21 AAA 6.77
9.30% PGC Ltd. 28-Jun-21 AAA 5.60
9.18% PFC Ltd 15-Apr-21 AAA 4.70
9.44% PFC Ltd. 23-Sep-21 AAA 3.72
9.38% EXIM BANK 29-Sep-21 AAA 2.508.75% Reliance Industries Ltd. 07-May-20 AAA 0.97
8.93% NTPC Ltd. 19-Jan-21 AAA 0.499.25% PGC Ltd. 26-Dec-20 AAA 0.31
9.57% IRFC Ltd. 31-May-21 AAA 0.25
Cash Bank & Others 7.71
Total 100.00
Fund Performance
Note : The investment income and prices may go down as well as up. “SinceInception” and returns above “1 Year” are calculated as per CAGR.
Last 3 Months 31-Mar-15 15.6902 -0.44%Last 6 Months 31-Dec-14 15.2010 2.76%Last 1 Year 30-Jun-14 13.9174 12.24%Last 2 Years 28-Jun-13 11.2996 17.58%Last 3 Years 29-Jun-12 9.9131 16.37%Since Inception 10-Feb-12 10.0000 14.08%
PERIOD DATE NAV NAVChange
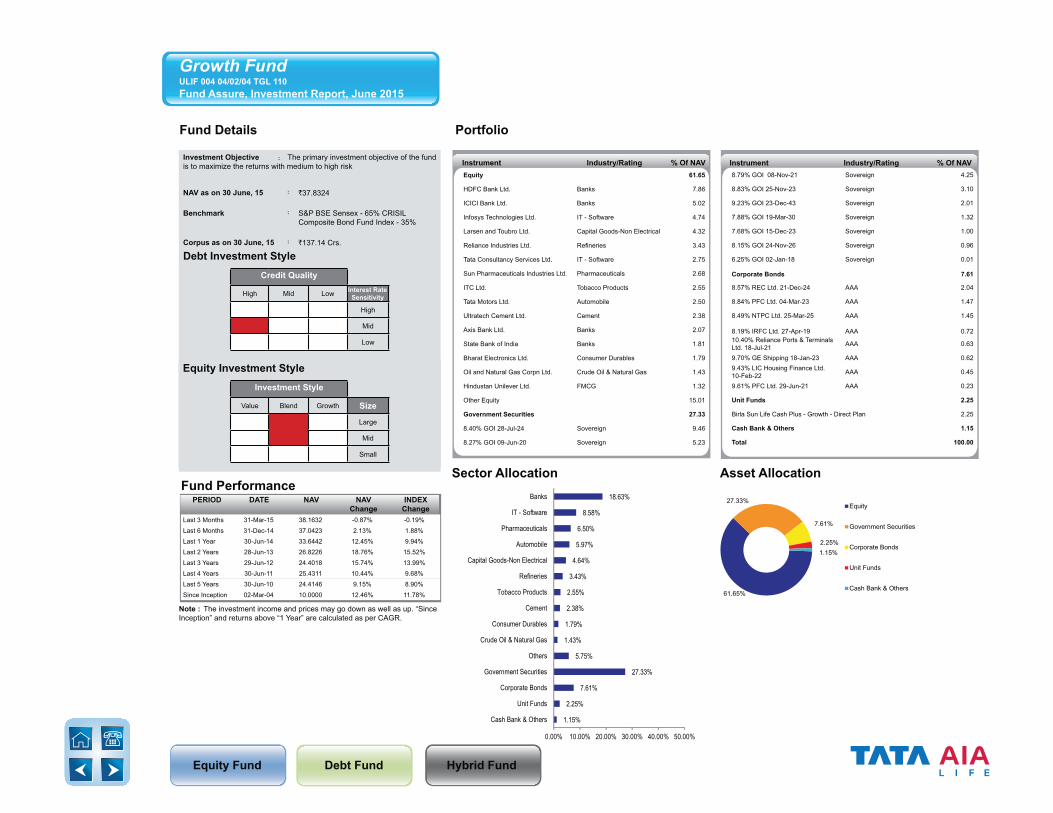
Equity Fund Debt Fund Hybrid Fund
Fund Details Portfolio
1.15%
2.25%
7.61%
27.33%
5.75%
1.43%
1.79%
2.38%
2.55%
3.43%
4.64%
5.97%
6.50%
8.58%
18.63%
0.00% 10.00% 20.00% 30.00% 40.00% 50.00%
Cash Bank & Others
Unit Funds
Corporate Bonds
Government Securities
Others
Crude Oil & Natural Gas
Consumer Durables
Cement
Tobacco Products
Refineries
Capital Goods-Non Electrical
Automobile
Pharmaceuticals
IT - Software
Banks
61.65%
27.33%
7.61%
2.25%1.15%
Equity
Government Securities
Corporate Bonds
Unit Funds
Cash Bank & Others
Sector Allocation Asset Allocation
Note : The investment income and prices may go down as well as up. “SinceInception” and returns above “1 Year” are calculated as per CAGR.
Fund Performance
Last 3 Months 31-Mar-15 38.1632 -0.87% -0.19%Last 6 Months 31-Dec-14 37.0423 2.13% 1.88%Last 1 Year 30-Jun-14 33.6442 12.45% 9.94%Last 2 Years 28-Jun-13 26.8226 18.76% 15.52%Last 3 Years 29-Jun-12 24.4018 15.74% 13.99%Last 4 Years 30-Jun-11 25.4311 10.44% 9.68%Last 5 Years 30-Jun-10 24.4146 9.15% 8.90%Since Inception 02-Mar-04 10.0000 12.46% 11.78%
PERIOD DATE NAV NAVChange
INDEXChange
Instrument Industry/Rating % Of NAV Instrument Industry/Rating % Of NAVInvestment Objective : The primary investment objective of the fund is to maximize the returns with medium to high risk
NAV as on 30 June, 15 : `37.8324
Benchmark : S&P BSE Sensex - 65% CRISIL Composite Bond Fund Index - 35%
Corpus as on 30 June, 15 : `137.14 Crs.
Debt Investment StyleCredit Quality
High Mid Low Interest Rate Sensitivity
High
Mid
Low
Equity Investment StyleInvestment Style
Value Blend Growth Size
Large
Mid
Small
Growth FundULIF 004 04/02/04 TGL 110Fund Assure, Investment Report, June 2015
Equity 61.65
HDFC Bank Ltd. Banks 7.86
ICICI Bank Ltd. Banks 5.02
Infosys Technologies Ltd. IT - Software 4.74
Larsen and Toubro Ltd. Capital Goods-Non Electrical 4.32
Reliance Industries Ltd. Refineries 3.43
Tata Consultancy Services Ltd. IT - Software 2.75
Sun Pharmaceuticals Industries Ltd. Pharmaceuticals 2.68
ITC Ltd. Tobacco Products 2.55
Tata Motors Ltd. Automobile 2.50
Ultratech Cement Ltd. Cement 2.38
Axis Bank Ltd. Banks 2.07
State Bank of India Banks 1.81
Bharat Electronics Ltd. Consumer Durables 1.79
Oil and Natural Gas Corpn Ltd. Crude Oil & Natural Gas 1.43
Hindustan Unilever Ltd. FMCG 1.32
Other Equity 15.01
Government Securities 27.33
8.40% GOI 28-Jul-24 Sovereign 9.46
8.27% GOI 09-Jun-20 Sovereign 5.23
8.79% GOI 08-Nov-21 Sovereign 4.25
8.83% GOI 25-Nov-23 Sovereign 3.10
9.23% GOI 23-Dec-43 Sovereign 2.01
7.88% GOI 19-Mar-30 Sovereign 1.32
7.68% GOI 15-Dec-23 Sovereign 1.00
8.15% GOI 24-Nov-26 Sovereign 0.96
6.25% GOI 02-Jan-18 Sovereign 0.01
Corporate Bonds 7.61
8.57% REC Ltd. 21-Dec-24 AAA 2.04
8.84% PFC Ltd. 04-Mar-23 AAA 1.47
8.49% NTPC Ltd. 25-Mar-25 AAA 1.45
8.19% IRFC Ltd. 27-Apr-19 AAA 0.7210.40% Reliance Ports & Terminals Ltd. 18-Jul-21 AAA 0.63
9.70% GE Shipping 18-Jan-23 AAA 0.629.43% LIC Housing Finance Ltd. 10-Feb-22 AAA 0.45
9.61% PFC Ltd. 29-Jun-21 AAA 0.23
Unit Funds 2.25
Birla Sun Life Cash Plus - Growth - Direct Plan 2.25
Cash Bank & Others 1.15
Total 100.00
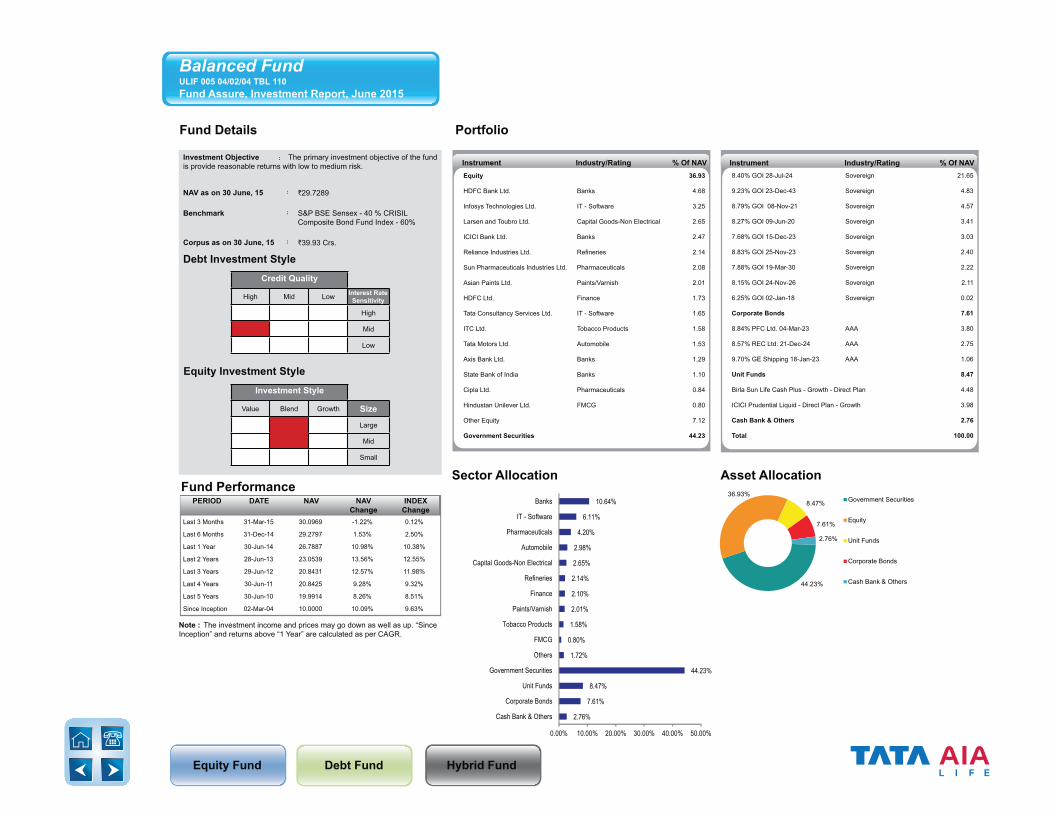
Equity Fund Debt Fund Hybrid Fund
Fund Details Portfolio
Sector Allocation Asset Allocation
2.76%
7.61%
8.47%
44.23%
1.72%
0.80%
1.58%
2.01%
2.10%
2.14%
2.65%
2.98%
4.20%
6.11%
10.64%
0.00% 10.00% 20.00% 30.00% 40.00% 50.00%
Cash Bank & Others
Corporate Bonds
Unit Funds
Government Securities
Others
FMCG
Tobacco Products
Paints/Varnish
Finance
Refineries
Capital Goods-Non Electrical
Automobile
Pharmaceuticals
IT - Software
Banks
44.23%
36.93%8.47%
7.61%
2.76%
Government Securities
Equity
Unit Funds
Corporate Bonds
Cash Bank & Others
Instrument Industry/Rating % Of NAV Instrument Industry/Rating % Of NAV
Note : The investment income and prices may go down as well as up. “SinceInception” and returns above “1 Year” are calculated as per CAGR.
Fund Performance
Last 3 Months 31-Mar-15 30.0969 -1.22% 0.12%
Last 6 Months 31-Dec-14 29.2797 1.53% 2.50%
Last 1 Year 30-Jun-14 26.7887 10.98% 10.38%
Last 2 Years 28-Jun-13 23.0539 13.56% 12.55%
Last 3 Years 29-Jun-12 20.8431 12.57% 11.98%
Last 4 Years 30-Jun-11 20.8425 9.28% 9.32%
Last 5 Years 30-Jun-10 19.9914 8.26% 8.51%
Since Inception 02-Mar-04 10.0000 10.09% 9.63%
PERIOD DATE NAV NAVChange
INDEXChange
Investment Objective : The primary investment objective of the fund is provide reasonable returns with low to medium risk.
NAV as on 30 June, 15 : `29.7289
Benchmark : S&P BSE Sensex - 40 % CRISIL Composite Bond Fund Index - 60%
Corpus as on 30 June, 15 : `39.93 Crs.
Debt Investment StyleCredit Quality
High Mid Low Interest Rate Sensitivity
High
Mid
Low
Equity Investment StyleInvestment Style
Value Blend Growth Size
Large
Mid
Small
Balanced FundULIF 005 04/02/04 TBL 110Fund Assure, Investment Report, June 2015
Equity 36.93
HDFC Bank Ltd. Banks 4.68
Infosys Technologies Ltd. IT - Software 3.25
Larsen and Toubro Ltd. Capital Goods-Non Electrical 2.65
ICICI Bank Ltd. Banks 2.47
Reliance Industries Ltd. Refineries 2.14
Sun Pharmaceuticals Industries Ltd. Pharmaceuticals 2.08
Asian Paints Ltd. Paints/Varnish 2.01
HDFC Ltd. Finance 1.73
Tata Consultancy Services Ltd. IT - Software 1.65
ITC Ltd. Tobacco Products 1.58
Tata Motors Ltd. Automobile 1.53
Axis Bank Ltd. Banks 1.29
State Bank of India Banks 1.10
Cipla Ltd. Pharmaceuticals 0.84
Hindustan Unilever Ltd. FMCG 0.80
Other Equity 7.12
Government Securities 44.23
8.40% GOI 28-Jul-24 Sovereign 21.65
9.23% GOI 23-Dec-43 Sovereign 4.83
8.79% GOI 08-Nov-21 Sovereign 4.57
8.27% GOI 09-Jun-20 Sovereign 3.41
7.68% GOI 15-Dec-23 Sovereign 3.03
8.83% GOI 25-Nov-23 Sovereign 2.40
7.88% GOI 19-Mar-30 Sovereign 2.22
8.15% GOI 24-Nov-26 Sovereign 2.11
6.25% GOI 02-Jan-18 Sovereign 0.02
Corporate Bonds 7.61
8.84% PFC Ltd. 04-Mar-23 AAA 3.80
8.57% REC Ltd. 21-Dec-24 AAA 2.75
9.70% GE Shipping 18-Jan-23 AAA 1.06
Unit Funds 8.47
Birla Sun Life Cash Plus - Growth - Direct Plan 4.48
ICICI Prudential Liquid - Direct Plan - Growth 3.98
Cash Bank & Others 2.76
Total 100.00
Equity Fund Debt Fund Hybrid Fund
Fund Details Portfolio
Choose a convenient contact option from the following:
For any enquiriesCall on our toll free no.1800 267 9966 or helpline no. 1860 266 9966 (local charges apply)
Just SMS ‘SERVICE’ to 58888or to get the summary of allshort codes within 2 minutes,please send HELP to 5676799
Write to UsCustomer Services TeamB- wing, 9th Floor, I-Think Techno Campus, Behind TCS, Pokhran Road No.2, Close to Eastern Express Highway, Thane (West) Pin Code – 400 607.
Contact Us
Unique Reference Number: L&C/Misc/2015/Jul/140
Disclaimer1. The fund is managed by Tata AIA Life Insurance Company Ltd. (hereinafter the “Company”).2. Past performance is not indicative of future performance. Returns are calculated on an absolute basis for a period of less than (or equal to) a year, with reinvestment of dividends (if
any).3. All investments made by the Company are subject to market risks. The Company does not guarantee any assured returns. The investment income and price may go down as well as
up depending on several factors influencing the market.4. Every effort is made to ensure that all information contained in this publication is accurate at the date of publication, but no responsibility or liability in respect of any error or omission
is accepted by the Company.5. Please know the associated risks and the applicable charges, from your Insurance agent or the Intermediary or policy document issued by the insurance company.6. Various funds offered are the names of funds and do not, in any way, indicate the quality of the funds, their future prospects & returns. 7. Premium paid in ULIPs are subject to Investment risks associated with capital markets & the NAV of the units may go up or down based on the performance of the fund and factors
influencing capital markets & the insured is responsible for his/her decision.8. Whilst every care has been taken in the preparation of this document, it is subject to correction and markets may not perform in a similar fashion based on factors influencing the
capital and debt markets; hence this review note does not individually confer any legal rights or duties.9. Unit Linked Life Insurance products are different from traditional insurance products and are subject to risk factors.10. Tata AIA Life Insurance Company Limited is only the name of the Insurance Company & any contract bearing the prefix ‘Tata AIA Life” is only the name of the Unit Linked Life
Insurance contract and does not in any way indicate the quality of the contract, its future prospects or returns.11. Insurance is the subject matter of the solicitation. BEWARE OF SPURIOUS PHONE CALLS AND FICTITIOUS/FRAUDULENT OFFERS IRDA of India clarifies to public that
IRDA of India or its officials do not involve in activities like sale of any kind of insurance or financial products nor invest premiums.• IRDA of India does not announce any bonus.• Public recieving such phone calls are requested to lodge a police complaint along with details of phone call, number.
Tata AIA Life Insurance Company Ltd. (IRDA of India Regn. No. 110) CIN: U66010MH2000PLC128403.Registered and Corporate Office: 14th Floor, Tower A, Peninsula Business Park, Senapati Bapat Marg, Lower Parel, Mumbai 400013
Name DesignationHarshad Patil Chief Investment OfficerRajeev Tewari Head of EquitiesJayanth Udupa Head of Credit Analysis & EconomistNitin Bansal Senior Analyst & Fund ManagerCheenu Gupta Senior Analyst & Fund ManagerPankaj Khetan Fund ManagerNimesh Mistry AnalystAnirban Ray AnalystNalin Ladiwala AnalystHS Bharath DealerPankaj Agarwal Dealer
Tata AIA Life Insurance’s Investment team