fund manager’s report - ablamc.com11)(1).pdf · fund manager's report, oct 2017 cpi for the...
TRANSCRIPT

FUNDMANAGER’S
REPORTOCTOBER 2017
FUNDFOCUS
A Wholly Owned Subsidiary of

FUND MANAGER'SREPORT, OCT 2017
CPI for the month of October 2017 clocked in at 3.8%YoY (+0.7%MoM), versus 3.9%YoY recorded in September 2017. The monthly increase is mainly due to surge in house rent (+1.38%MoM), food inflation (+0.6%MoM) and education fee (+3.66%MoM). Overall 4MFY18 average CPI now stands at 3.50%YoY compared to 3.95%YoY in the same period last year. External account position continued to remain under pressure amid increase in trade deficit to USD2.2 billion owing to declining exports and drop in workers’ remittances to USD1.3 billion. Current Account deficit (CAD) during 1QFY18 was up by a massive 143%YoY to USD3.6 billion as compared to USD1.5 billion during 1QFY17. However, the situation eased off somewhat in August and September 2017 due to lower trade deficit where CAD clocked in at USD550 million and USD956 million as compared to USD2.1 billion in July 2017. Nevertheless, foreign exchange reserves remained at USD19.8 billion
during the period, potentially due to recently reported commercial loan facility acquired, thus, keeping the exchange rate stable against the greenback. On fiscal front, government once again missed tax collection target by PKR47 billion as FBR provisionally collected taxes worth PKR1,024 billion during 4MFY17 (+17.9%YoY) against the target of PKR1,071 billion. Standard and Poor's credit rating agency affirmed Pakistan's long-term and short term sovereign credit rating as ‘B’ with stable outlook as it believes that the country’s economic prospects remain favorable. Going forward, the government is planning to raise USD1 billion Sukuk and Eurobond each, to provide much needed support to the BoP. To recall, government has already increased regulatory duties to curb non-essential imports. Moreover, affirmation of long-term credit rating of Pakistan by S&P and ongoing implementation of CPEC projects will pave the way for higher GDP growth target.
Uptick in CADECONOMY AND CAPITAL MARKETS UPDATE
During the month, money market traded close to the target rate amid regular liquidity injections (5x OMO injections) by SBP at close to policy rate. OMO maturity witnessed a dip in maturity size to PKR1,375 billion at month end compared to PKR1,424 billion last month. Investors remained biased towards short term bills as evident by a massive cumulative participation of PKR1,892 billion in T-bills auctions vs a target of PKR1,300 billion, which was mainly concentrated in 3 months paper. The central bank accepted total bids worth PKR1,522 billion with cutoff rates unchanged
from the previous month. Interest in PIBs remained extremely lackluster as the SBP received bids of only PKR24.7 billion against a target of PKR33 billion. The central bank remained resilient over high cost borrowing and rejected all bids. On the monetary front, CPI reading for October remained in-line with expectation. Secondary market yields in the shorter tenors remained relatively flat while witnessed a slight correction in the longer tenor. Moving ahead, market is expected to remain range bound in near term given a stable interest rates scenario.
Status-Quo
The KSE-100 Index posted a negative return of 6.6%MoM (-2,792 points) to close at 39,619 points in October 2017. The lackluster performance could be attributable to unrest in political landscape along with economic uncertainty. The benchmark index is now down 15% FYTD and 25% from its peak levels (52,876 on 24 May 2017). Mutual funds emerged as the major seller in the month with outflows of USD40 million while Banks/DFIs bought USD32 million worth of stocks. Foreigners were net buyer during large part of last month, but heavy selling in the last 2 days (Portfolio rebalancing) made them net sellers of USD8.9 million as opposed to net buyers of USD28 million during September 2017. During the month major foreign selling was witnessed in E&Ps (USD15.4 million), Fertilizer (USD4.4 million), Cement (USD3.2 million) and Banks (USD2.5 million). Cumulatively, in 4MFY18, foreign investors pulled out USD98 million worth of investments from PSX. During the month, Banks
provided the largest drag on the index, contributing 768 points to the index decline. Other sectors that contributed negatively to the index were Cement (-449.04 points), Power Generation & Distribution (-291.62 points) and Fertilizer (-265.82 points). However, Oil & Gas Exploration Companies provided some support to the market and contributed +223.6 points due to re-pricing of Tal Block, sizeable discovery in Ikhlas Block (POL only), and recovery in oil prices during the month (Arab light up 6.2%MoM). On the volumetric front, trading activity remained dull during the period as average daily traded volumes recorded at 148 million shares in October 2017 against 153 million shares in September 2017 while average traded value stood at USD71 million. Pakistan continues to trade at an attractive 1Yr forward P/E of 7.8x and offering a dividend yield of 6.6%.
Political Uncertainty Persists
ECONOMIC SUMMARY
CPI Inflation
Trade Deficit (USD mn)
Remittances (USD mn)
Current A/C (USD mn)
FDI (USD mn)
Tax Collection ** (PKR bn)
M2 Growth*
FX Reserves* (USD bn)
October
September
September
September
September
October
October
October
3.80%
(2,167)
1,294
(956)
205
271
3.86%
(2,161)
1,955
(550)
235
305
3.95%
(7,220)
4,791
(3,557)
663
1,024
(1.18%)
19.8
LastReported
Month
CurrentMonth
PreviousMonth YTD
Source SBP, FBS
* Latest monthly figures
** Provisional figures
EQUITY MARKET PERFORMANCE
KSE - 100 Index
Avg. Daily Vol. (mn)
Avg. Daily Val. (USD mn)
2017E PE(X)
2017E DY
Source: KSE, Bloomberg
39,617
148
71
9.2 - - - -
5.6% - - - -
42,409
153
76
(6.6%)
(3%)
(7%)
39,617
71
38
52,876
696
508
Oct-17 Sep-17 M/M 1 YrLow
1 YrHigh
IN FOCUS
GOVERNMENT SECURITIES
PKRV Yields (%)
October 31, 2017
September 30, 2017
Change (bps)
Source : FMA
6 M
6.01
6.01
0
1 Yr
6.03
6.03
0
3 Yr
6.95
6.94
1
5 Yr
7.61
7.66
-5
10 Yr
8.30
8.31
-1

IN FOCUS ABL INCOMEFUND
For the month of Oct’17, ABL Income Fund posted a return of 5.51% against the benchmark return of 6.17% . On YTD basis, the fund’s return stood at 4.68% against the benchmark return of 6.16 %. Fund's size as at October 31, 2017 stood at PKR 4,266.02 Million.At month end, the total exposure in Cash, TDRs, TFCs & Commercial Papers stood at 63.21%, 8.71%, 22.16% & 2.32% respectively as compared to 57.10%, 9.35%, 26.87% & 2.47% at the end of Sep'17. At month end total exposure in Government Guranteed TFCs stood at 1.88%.
The Fund's weighted average maturity at the end of Oct'17 stood at 522 days as compared to 670 days at the end of Sep'17.The Scheme has maintained the provision against Sindh Workers’ Welfare Fund’s Liability to the tune of Rs. 3.526 million, had the same not been made, the NAV per unit of the scheme would have been higher by Rs. 0.0026 per unit.The Scheme has also maintained Total expense ratio (TER) 0.69% (0.11% representing Government Levies and SECP Fee etc).
To earn superior risk adjusted rate of return by investing in a blend of short, medium and long term instruments, both within and outside PakistanINVESTMENT OBJECTIVE
FUND MANAGER'S COMMENTS
Alee Khalid Ghaznavi - CEO Saqib Matin, ACA - CFO & CSKashif Rafi - CIO Fahad Aziz, Fund ManagerM. Abdul Hayee, CFA - Fund Manager Aniel Victor - Head of Risk Management
Investment Committee Members:
FUND MANAGER'SREPORT, OCT 2017
BASIC FUND INFORMATIONFund Type
Category
Launch Date
Net Assets
Net Assets (Excluding FoF Investments)
NAV
Benchmark
Dealing Days
Cut-off time
Pricing Mechanism
Management Fees
Front -end Load
Trustee
Auditor
Asset Manager Rating
Risk Profile of the Fund
Fund Stability Rating
Fund Manager
Listing
Open-end
Income Scheme
September 20, 2008
PKR 4266.02 mn as at October 31, 2017
PKR 3428.55mn as at October 31, 2017PKR 10.1938 as at October 31, 20176 Months KIBOR
As Per Banking Days
4:00 PM
Forward
1.5 % p.a
1.5%
Central Depository Company of Pakistan Ltd (CDC)
A.F. Ferguson - Chartered Accountants
AM2 + (Stable Outlook) (JCR-VIS)
Low
A(f) (JCR-VIS)
Fahad Aziz
Pakistan Stock Exchange
Disclaimer: This publication is for informational purposes only and nothing here in should be construed as a solicitation, recommendation or an offer to buy or sell any fund. All Investments in mutual funds are subject to market risks. The NAV based prices of units and any dividends /returns there on are dependent on forces and factors affecting the capital markets. These may go up or down based on market conditions . Past performance is not necessarily indicative of future results. Please read the offering document to understand the investment policies and the risk involved including risk disclosures for special features.
ABL-IF
Benchmark
*Funds returns computed on NAV to NAV with the dividend reinvestment (excluding sales load)
5.51%
6.17%
4.68%
6.15%
1%
0%
(0.18)
302.07
(0.55%)
N/A
Oct - 31,2017 YTD* St. Dev** Sharpe
Ratio** Alpha***
PERFORMANCE
3 month
ABL-IF*Benchmark
4.63%6.16%
5.07%6.16%
5.78%6.13%
9.01%6.81%
9.87%7.93%
15.44%10.24%
6 month 1 Year 3 Year 5 Year Since Inception
*Funds returns computed on Simple annualized basis / Performance data does not include cost incurred by investor in the form of sales load
TECHNICAL INFORMATION
Leverage
Weighted average time to maturity of net assets
NIL
522
*DETAILS OF NON-COMPLIANT INVESTMENT WITH THE INVESTMENT CRITERIA OF ASSIGNED CATEGORY
Name of Entity Exposure Type % of Net Assets Limit Excess - - 0% 0% 0%
TOP TFCs / SUKUK HOLDING (% OF TOTAL ASSETS) October 31, 2017
JSBL TFC 14-12-2016MCB Bank TFC II (Formerly NIB BANK LTD TFC II)BOP-TFC-ABLIFJSCL TFCWAPDA PPTFC IIIBAFL V TFCASKARI VASKARI TFC 4Total
5.82%5.24%4.31%3.58%1.88%1.57%1.53%0.12%
24.05%
Cash
Placements with Banks(TDRs)
TFCs
WAPDA PPTFC III
Commercial Paper
T-Bills
Others including Receivables
Total
57.1%
9.35%
26.87%
2.01%
2.47%
0.02%
2.18%
100%
63.21%
8.71%
22.16%
1.88%
2.32%
0.02%
1.7%
100%
September 30,2017
October 31,2017
ASSET ALLOCATION
PORTFOLIO QUALITY (% OF TOTAL ASSETS)
Govt Securities,0.02%
AAA, 15.91% AA+, 4.19%
AA-, 68.28%
Credit Quality of Portfolio (% of Assets)
AA, 4.07%
A+, 5.82%
Unrated/Others,1.71%
12%
10%
8%
6%
4%
2%
0%
-2%
-4%
31-O
ct-1
6
14-N
ov-1
6
28-N
ov-1
6
12-D
ec-1
6
26-D
ec-1
6
9-Ja
n-17
23-J
an-1
7
6-Fe
b-17
20-F
eb-1
7
6-M
ar-1
7
20-M
ar-1
7
3-A
pr-1
7
17-A
pr-1
7
1-M
ay-1
7
15-M
ay-1
7
29-M
ay-1
7
12-J
un-1
7
26-J
un-1
7
10-J
ul-1
7
24-J
ul-1
7
7-A
ug-1
7
4-Se
p-17
18-S
ep-1
7
2-O
ct-1
7
16-O
ct-1
7
30-O
ct-1
7
ABL IF 6 Months KIBOR
Amount Invested by Fund of Funds is Rs. 837.47 million

IN FOCUS ABL STOCKFUND
ABL-SF declined by 6.84% in October 2017 against -6.58% return of the benchmark, reflecting an underperformance of 26 basis points. During the period under review, profit was realized in Automobile Parts & Accessories sector as the allocation decreased from 7.10% to 2.80%. As at October 31, 2017, ABL-SF was 87.93% invested in equities and remaining in bank deposits.The KSE-100 Index dropped by 6.58% in October 2017 mainly owning to prevalent political upheaval resulting from Panama cases against ruling political parties. Besides, rising concerns on external account due to mounting trade deficit kept the investors at bay. Mutual funds emerged as the major seller in the month with net outflows of USD40 million. However, Oil & Gas Exploration Companies provided
some support to the market due to re-pricing of some blocks, sizeable discoveries and recovery in oil prices during the month. Moving ahead, positive stance is intact based on strong corporate earnings, abundant domestic liquidity and attractive valuation. The Scheme has maintained the provision against Sindh Workers’ Welfare Fund’s Liability to the tune of Rs. 56.6million, had the same not been made, the NAV per unit of the scheme would have been higher by Rs. 0.1228 per unit.The Scheme has total expense ratio (TER) of 1.09% (0.15% representing Government Levies and SECP Fee etc.). TER also includes the provision of sales & marketing expenses with 0.4% p.a. of Net Assets amounting to PKR 9.622 million.
To provide higher risk adjusted returns over the long term by investing in a diversified portfolio of equity instruments offering capital gain and dividends.INVESTMENT OBJECTIVE
FUND MANAGER'S COMMENTS
FUND MANAGER'SREPORT, OCT 2017
BASIC FUND INFORMATIONOpen-end
Equity Scheme
June 27, 2009
Rs 6355.11mn as at October 31, 2017
Rs 5,657.20mn as at October 31, 2017
Rs 13.7874 as at October 31, 2017
KSE-100 Index
As Per Local Stock Exchanges
4:00 PM
Forward
2% p.a
2%
Central Depositary Company of Pakistan Limited
M/S. A.F. Ferguson & Co, Chartered Accountants
AM2+ (Stable outlook) (JCR-VIS)
High
MFR 4-Star (JCR VIS) (Based on one Year weighted average ranking),
MFR 3-Star (JCR VIS) (Based on Three Year Weighted average ranking)
MFR 4-Star (JCR VIS) (Based on Five Year Weighted average ranking)
for the period ended December 31,2015.
Muhammad Abdul Hayee, CFA
Pakistan Stock Exchange
ABL-SF
Benchmark
*Funds returns computed on NAV to NAV with the dividend reinvestment (excluding sales load) ** 12M Trailing Data
(6.84%)
(6.58%)
(18.39%)
(14.92%)
19.24%
17.81%
1.04
1.00
(0.35%)
N/A
Stock/Equities
Bank Balances
T-Bills
Others
Leverage
Total
87.94%
10.48%
0.00%
1.59%
NIL
100.00%
87.93%
10.82%
0.00%
1.25%
NIL
100.00%
September 30,2017
October 31,2017ASSET ALLOCATION
SECTOR ALLOCATION (% OF TOTAL ASSETS)
"Disclaimer: This publication is for informational purposes only and nothing here in should be construed as a solicitation, recommendation or an offer to buy or sell any fund. All Investments in mutual funds are subject to market risks. The NAV based prices of units and any dividends /returns there on are dependent on forces and factors affecting the capital markets. These may go up or down based on market conditions . Past performance is not necessarily indicative of future results. Please read the offering document to understand the investment policies and the risk involved including risk disclosure for special feature.
3 month
ABL-SFBenchmark
(16.68%)(13.90%)
(22.41%)(19.64%)
(0.15%)(0.69%)
48.28%30.42%
178.94%149.01%
579.99%453.08%
6 month 1 Year 3 Year 5 Year Since Inception
*Funds returns computed on Absolute basis. Performance data does not include cost incurred by investor in the form of sales load.
Fund Type
Category
Launch Date
Net Assets
Net Assets (Excluding FoF Investments)
NAV
Benchmark
Dealing Days
Cut-off time
Pricing Mechanism
Management Fee
Front -end Load
Trustee
Auditor
Asset Manager Rating
Risk Profile of the Fund
Performance Ranking
Fund Manager
Listing
Alee Khalid Ghaznavi - CEO Saqib Matin, ACA - CFO & CSKashif Rafi - CIO Fahad Aziz, Fund ManagerM. Abdul Hayee, CFA - Fund Manager Aniel Victor - Head of Risk Management
Investment Committee Members:
TOP TEN HOLDINGS (% OF TOTAL ASSETS) September 30, 2017 October 31, 2017
Sui Northern Gas Pipelines LimitedMari Petroleum Company LimitedOil and Gas Development Co. Ltd.I.C.I. Pakistan LimitedPackages LimitedPakistan State Oil Company LimitedUnited Bank LimitedMCB Bank LimitedD.G. Khan Cement Company LimitedInternational Steels LimitedTotal
7.10%5.92%4.70%4.67%4.33%4.30%3.85%3.78%3.49%3.41%
45.55%
8.19%5.76%4.18%5.00%4.41%3.00%3.98%2.79%0.17%3.99%
41.47%
-10%
0%
10%
20%
30%
40%
1-Nov-16
15-Nov-16
29-Nov-16
13-Dec-16
27-Dec-16
10-Jan-17
24-Jan-17
7-Feb-17
21-Feb-17
7-Mar-17
21-Mar-17
4-Apr-17
18-Apr-17
2-May-17
16-May-17
30-May-17
13-Jun-17
27-Jun-17
11-Jul-17
25-Jul-17
8-Aug-17
22-Aug-17
5-Sep-17
19-Sep-17
3-Oct-17
17-Oct-17
31-Oct-17
KSE-100 ABL SF
Oil & Gas Exploration CompaniesBank Balance & Others
Commercial BanksOil & Gas Marketing Companies
CementAutomobile Assembler
FertilizerEngineering
ChemicalPaper & Board
Power Generation & DistributionAutomobile Parts & Accessories
InsurancePharmaceuticals
Textile CompositeRefinery
Leather & TanneriesSugar & Allied Industries
14.10%12.08%
11.52%11.49%
8.39%7.97%
5.85%5.75%
4.67%4.33%
3.92%2.80%
2.57%1.55%1.44%
1.12%0.33%
0.12%
0% 5% 10% 15%
Note: Amount invested by Fund of Fund is Rs. 697.9mn
Oct - 17* YTD* St. Dev** Beta** Alpha
PERFORMANCE

IN FOCUS ABL CASHFUND
For the month of Oct’17, ABL Cash Fund posted a return of 5.40% against the benchmark return of 5.17% outperforming the benchmark return by 23 bps. On year-to-date basis, the fund posted a return of 5.33% against the benchmark return of 5.17% thereby outperforming the benchmark by 16 basis points. Fund's size as at October 31, 2017 stood at PKR 14,592.95Million.On the Asset Allocation side, exposure in cash during the month of October 2017 reduced to 46.76% from 81.17% at the end of Sep’2017. At month end exposure in TDRs and Commercial Papers stood at 16.84% and 0.68% respectively. Going forward the fund will continue to maintain a higher level of exposure in Cash &
TDRs owing to better returns at year end. The exposure in T-bills shall be maintained at lower end of the fund, simultaneously the fund will continue to look for opportunities in the LOP market. At month end, fund’s weighted average maturity stood at 36.08 days.The Scheme has maintained the provision against Sindh Workers’ Welfare Fund’s Liability to the tune of Rs. 3.526 million, had the same not been made, the NAV per unit of the scheme would have been higher by Rs. 0.0026 per unit. The Scheme has also maintained Total expense ratio (TER) 0.38% (0.07% representing Government Levies, SECP Fee etc).
To earn superior risk adjusted rate of return by investing in a blend of short, medium and long term instruments, both within and outside Pakistan INVESTMENT OBJECTIVE
FUND MANAGER'S COMMENTS
FUND MANAGER'SREPORT, OCT 2017
BASIC FUND INFORMATIONFund Type
Category
Launch Date
Net Assets
Net Assets (Excluding FoF investments)
NAV
Benchmark
Dealing Days
Cut-off time
Pricing Mechanism
Management Fees
Front -end Load
Trustee
Auditor
Asset Manager Rating
Risk Profile of the Fund
Fund Stability Rating
Fund Manager
Listing
Open-end
Money Market Scheme
July 31, 2010
PKR 14592.95 mn as at October 31, 2017PKR 14526.65 mn as at October 31, 2017PKR 10.2330 as at October 31, 201770%-Avg of 3M PKRV rates + 30% 3M Avg Deposit
Rate of 3 AA rated banks
As Per Banking Days
4:00 PM
Backward
10% of gross earnings subject to a minimum fee of
0.75% and a maximum fee of 1.00% of average daily net assets
Nil
Central Depository Company of Pakistan Ltd (CDC)
A.F. Ferguson - Chartered Accountants
AM2 + (Stable Outlook) (JCR-VIS)
Low
AA(f) (JCR-VIS)
Fahad Aziz
Pakistan Stock Exchange
ABL-CF
Benchmark
*Funds returns computed on NAV to NAV with the dividend reinvestment (excluding sales load) ** 12M Trailing Data ***3MPKRV used as RFR
5.4%
5.17%
5.33%
5.17%
2.4%
0%
1.08
(223.25)
3.18%
N/A
Cash
Placements with Banks(TDRs)
T-Bills
Commercial Paper
Others including Receivables
Total
81.17%
17.54%
0.00%
0.68%
0.61%
100%
46.76%
16.84%
34.93%
0.68%
0.79%
100%
September 30,2017
October 31,2017ASSET ALLOCATION
PORTFOLIO QUALITY (% OF TOTAL ASSETS)
"Disclaimer: This publication is for informational purposes only and nothing here in should be construed as a solicitation, recommendation or an offer to buy or sell any fund. All Investments in mutual funds are subject to market risks. The NAV based prices of units and any dividends /returns there on are dependent on forces and factors affecting the capital markets. These may go up or down based on market conditions . Past performance is not necessarily indicative of future results. Please read the offering document to understand the investment policies and the risk involved including risk disclosures for special features.
3 month
ABL-CF Benchmark
5.29%5.17%
7.37%5.19%
8.56%5.23%
8.13%4.77%
9.17%5.49%
11.91%6.09%
6 month 1 Year 3 Year 5 Year Since Inception
*Funds returns computed on Simple annualized basis / Performance data does not include cost incurred by investor in the form of sales load
TECHNICAL INFORMATION
*DETAILS OF NON-COMPLIANT INVESTMENT WITH THE INVESTMENT CRITERIA OF ASSIGNED CATEGORY
Leverage
Weighted average time to maturity of net assets
Name of Entity Exposure Type % of Net Assets Limit Excess - - - - -
- - - - -
NIL
36.08
Alee Khalid Ghaznavi - CEO Saqib Matin, ACA - CFO & CSKashif Rafi - CIO Fahad Aziz, Fund ManagerM. Abdul Hayee, CFA - Fund Manager Aniel Victor - Head of Risk Management
Investment Committee Members:
Note : Amount investment by Fund of Fund is Rs. 66.31 million
Credit Quality of Portfolio (% of Assets)
AA, 0.68% AAA, 49.51%
AA+, 14.08%Govt Securities,
34.93%
Unrated/Others,0.79%
0%
2%
4%
6%
8%
10%
12%
14%
16%
18%
31-O
ct-1
6
14-N
ov-1
6
28-N
ov-1
6
12-D
ec-1
6
26-D
ec-1
6
9-Ja
n-17
23-J
an-1
7
6-Fe
b-17
20-F
eb-1
7
6-M
ar-1
7
20-M
ar-1
7
3-A
pr-1
7
17-A
pr-1
7
1-M
ay-1
7
15-M
ay-1
7
29-M
ay-1
7
12-J
un-1
7
26-J
un-1
7
10-J
ul-1
7
24-J
ul-1
7
7-A
ug-1
7
21-A
ug-1
7
4-Se
p-17
18-S
ep-1
7
2-O
ct-1
7
16-O
ct-1
7
30-O
ct-1
7
ABL CF 70%-Avg of 3M PKRV rates + 30% 3M Avg Deposit Rate of 3 AA rated banks
Oct - 31,2017 YTD* St. Dev** Sharpe
Ratio** Alpha***
PERFORMANCE

IN FOCUS ABL GOVERNMENTSECURITIES FUND
For the month of Oct’17, ABL GSF posted a return of 5.10% against the benchmark return of 6.01%. On year to date basis, the fund underperformed the benchmark by 91bps, whereas on YTD the fund posted a return of 5.04% against the benchmark return of 6.00% At month end, the fund maintained a total of 76.00% in government securities whereas 7.70% was placed with Banks as TDRs while 4.74% was placed as cash in Bank.The Scheme has maintained the provision against Sindh Workers’ Welfare Fund’s Liability
to the tune of Rs. 3.526 million, had the same not been made, the NAV per unit of the scheme would have been higher by Rs. 0.0026 per unit. The Scheme has also maintained Total expense ratio (TER) 0.60% (0.09% representing Government Levies, SECP Fee etc).The fund’s weighted average maturity stood at 342 days at the end of Oct'17 as compared to 302 days at the Sept'17
To earn superior risk adjusted rate of return by investing in a blend of short, medium and long term instruments, both within and outside PakistanINVESTMENT OBJECTIVE
FUND MANAGER'S COMMENTS
FUND MANAGER'SREPORT, OCT 2017
BASIC FUND INFORMATIONFund Type
Category
Launch Date
Net Assets
Net Assets (Excluding FoF Investments)
NAV
Benchmark
Dealing Days
Cut-off time
Pricing Mechanism
Management Fees
Front -end Load
Trustee
Auditor
Asset Manager Rating
Risk Profile of the Fund
Fund Stability Rating
Fund Manager
Listing
Open-end
Income Scheme
November 28, 2011
PKR 3181.91mn as at October 31, 2017PKR 3013.43mn as at October 31, 2017PKR 10.1882 as at October 31, 20176 Months PKRV rates
As Per Banking Days
4:00 PM
Forward
Class-B unit 1.25% p.a.
1.5%
Central Depository Company of Pakistan Ltd (CDC)
A.F. Ferguson - Chartered Accountants
AM2 + (Stable Outlook) (JCR-VIS)
Low
A(f) (JCR-VIS)
Fahad Aziz
Pakistan Stock Exchange
Cash
Placements with Banks(TDRs)
T-Bills
TFCs
Others including Receivables
Total
52.41%
5.36%
34.25%
7.61%
0.37%
100%
4.74%
7.7%
76%
10.95%
0.61%
100%
September 30,2017
October 31,2017ASSET ALLOCATION
Amount Invested by Fund of Funds is Rs. 168.49 million Subtracted from total.
PORTFOLIO QUALITY (% OF TOTAL ASSETS)
"Disclaimer: This publication is for informational purposes only and nothing here in should be construed as a solicitation, recommendation or an offer to buy or sell any fund. All Investments in mutual funds are subject to market risks. The NAV based prices of units and any dividends /returns there on are dependent on forces and factors affecting the capital markets. These may go up or down based on market conditions . Past performance is not necessarily indicative of future results. Please read the offering document to understand the investment policies and the risk involved including risk disclosures for special features.
TOP TFCs / SUKUK HOLDING (% OF TOTAL ASSETS)
BOP-TFC-GSF
JSCL TFC
ASKARI V
BAFL TFC IV FLOATER
Total
TECHNICAL INFORMATION
Leverage
Weighted average time to maturity of net assets
5.28%
4.74%
0.47%
0.46%
10.95%
NIL
342
October 31, 2017
*DETAILS OF NON-COMPLIANT INVESTMENT WITH THE INVESTMENT CRITERIA OF ASSIGNED CATEGORY
Name of Entity Exposure Type % of Net Assets Limit Excess - - - - -
3 month
ABL-GSFBenchmark
5.13%6%
4.95%6%
6.96%5.98%
9.76%6.23%
11.25%7.22%
12.64%7.66%
6 month 1 Year 3 Year 5 Year Since Inception
*Funds returns computed on Simple annualized basis / Performance data does not include cost incurred by investor in the form of sales load
ABL-GSF
Benchmark
*Funds returns computed on NAV to NAV with the dividend reinvestment (excluding sales load) ** 12M Trailing Data ***3MPKRV used as RFR
5.1%
6.01%
5.04%
6%
2.09%
0%
0.48
120.49
0.79%
N/A
Alee Khalid Ghaznavi - CEO Saqib Matin, ACA - CFO & CSKashif Rafi - CIO Fahad Aziz, Fund ManagerM. Abdul Hayee, CFA - Fund Manager Aniel Victor - Head of Risk Management
Investment Committee Members:
Credit Quality of Portfolio (% of Assets)
AA, 0.48%
Unrated\Others,0.62%
AAA, 7.76%
AA+, 5.04%
Govt Securities,76%
AA-, 10.09%
0%
5%
10%
15%
20%
25%
31-O
ct-1
6
14-N
ov-1
6
28-N
ov-1
6
12-D
ec-1
6
26-D
ec-1
6
9-Ja
n-17
23-J
an-1
7
6-Fe
b-17
20-F
eb-1
7
6-M
ar-1
7
20-M
ar-1
7
3-A
pr-1
7
17-A
pr-1
7
1-M
ay-1
7
15-M
ay-1
7
29-M
ay-1
7
12-J
un-1
7
26-J
un-1
7
10-J
ul-1
7
24-J
ul-1
7
7-A
ug-1
7
21-A
ug-1
7
4-Se
p-17
18-S
ep-1
7
2-O
ct-1
7
16-O
ct-1
7
30-O
ct-1
7
ABL GSF-B 6 Month PKRV
Oct - 31,2017 YTD* St. Dev** Sharpe
Ratio** Alpha***
PERFORMANCE

FUND MANAGER'SREPORT, OCT 2017
IN FOCUS ABL ISLAMICINCOME FUND
For the month of Oct’17, ABL Islamic Income Fund posted a return of 4.46% against the benchmark return of 2.51%, thereby outperforming the benchmark by 195 bps. The return can be attributed towards placement of funds with top Islamic banks at competitive rates. On YTD basis, the fund continued to outperform the market by posting a return of 4.02%.During the month, the fund’s exposure in Cash, TDRs & Corporate Sukuk stood at 72.70%, 9.09% & 17.51% at the end of Oct'17 as compared to 68.68%, 15.95% & 14.92% in Sept'17. The fund’s WAM increased to 510 days in Oct’17 from 436 days in Sep'17.
Going forward, the fund will maintain its strategy of placement with top quality banks. We will also continue to look for opportunities to investment in quality corporate Sukuks.The Scheme has maintained the provision against Sindh Workers’ Welfare Fund’s Liability to the tune of Rs. 3.526 million, had the same not been made, the NAV per unit of the scheme would have been higher by Rs. 0.0026 per unit. The Scheme has also maintained Total expense ratio (TER) 0.49% (0.08% representing Government Levies, SECP Fee).
To earn superior risk adjusted rate of return by investing in a blend of short, medium and long term instruments, both within and outside PakistanINVESTMENT OBJECTIVE
FUND MANAGER'S COMMENTS
BASIC FUND INFORMATIONFund Type
Category
Launch Date
Net Assets
Net Assets (Excluding Investment from FoF)
NAV
Benchmark
Dealing Days
Cut-off time
Pricing Mechanism
Management Fees
Front -end Load
Trustee
Auditor
Asset Manager Rating
Risk Profile of the Fund
Fund Stability Rating
Fund Manager
Listing
Open-end
Islamic Income Scheme
July 31, 2010
PKR 5468.51mn as at October 31, 2017PKR 2766.73mn as at October 31, 2017PKR 10.3038 as at October 31, 2017Average of 6 Month Deposit Rate of 3 A rated Islamic Banks
As Per Banking Days
4:00 PM
Forward
1 % p.a
1.5%
Central Depository Company of Pakistan Ltd (CDC)
Deloitte - Yousuf Adil. Chartered Accountants
AM2 + (Stable Outlook) (JCR-VIS)
Low
A(f) (JCR-VIS)
Kashif Rafi
Pakistan Stock Exchange
"Disclaimer: This publication is for informational purposes only and nothing here in should be construed as a solicitation, recommendation or an offer to buy or sell any fund. All Investments in mutual funds are subject to market risks. The NAV based prices of units and any dividends /returns there on are dependent on forces and factors affecting the capital markets. These may go up or down based on market conditions . Past performance is not necessarily indicative of future results. Please read the offering document to understand the investment policies and the risk involved including risk disclosures for special features.
TECHNICAL INFORMATION
Leverage Weighted average time to maturity of net assets
NIL 510
TOP TFCs / SUKUK HOLDING (% OF TOTAL ASSETS) October 31, 2017
MEEZAN BANK SUKUK II IIF
DIB SUKUK (14-07-2017)
FFCL SUKUK IIF
K-ELECTRIC IIF NEW
Total
7.12%
5.54%
2.93%
1.92%
17.51%
*DETAILS OF NON-COMPLIANT INVESTMENT WITH THE INVESTMENT CRITERIA OF ASSIGNED CATEGORY
Name of Entity Exposure Type % of Net Assets Limit Excess
- - 0% 0% 0%
Cash
Placements with Banks(TDRs)
Corporate Sukuk
Others including Receivables
Total
68.68%
15.95%
14.92%
0.45%
100%
72.7%
9.09%
17.51%
0.7%
100%
September 30,2017
October 31,2017ASSET ALLOCATION
Amount Invested by Fund of Funds is Rs. 2701.80 million
3 month
ABL-IIFBenchmark
4.17%2.47%
4.3%2.43%
5.12%2.61%
6.63%4.46%
8.17%5.34%
10.72%6.2%
6 month 1 Year 3 Year 5 Year Since Inception
*Funds returns computed on Simple annualized basis / Performance data does not include cost incurred by investor in the form of sales load
ABL-IIF
Benchmark
*Funds returns computed on NAV to NAV with the dividend reinvestment (excluding sales load) ** 12M Trailing Data
4.46%
2.51%
4.02%
2.45%
0.86%
0.01%
(0.97)
(320.07)
2.48%
N/A
Alee Khalid Ghaznavi - CEO Saqib Matin, ACA - CFO & CSKashif Rafi - CIO Fahad Aziz, Fund ManagerM. Abdul Hayee, CFA - Fund Manager Aniel Victor - Head of Risk Management
Investment Committee Members:
PORTFOLIO QUALITY (% OF TOTAL ASSETS)
Credit Quality of Portfolio (% of Assets)
AAA, 0.05%
AA+, 2.19%
AA-, 37.55%
A, 50.86%
A+, 8.65%
Unrated/Others,0.7%
0%
5%
10%
15%
20%
25%
30%31
-Oct
-16
14-N
ov-1
6
28-N
ov-1
6
12-D
ec-1
6
26-D
ec-1
6
9-Ja
n-17
23-J
an-1
7
6-Fe
b-17
20-F
eb-1
7
6-M
ar-1
7
20-M
ar-1
7
3-A
pr-1
7
17-A
pr-1
7
1-M
ay-1
7
15-M
ay-1
7
29-M
ay-1
7
12-J
un-1
7
26-J
un-1
7
10-J
ul-1
7
24-J
ul-1
7
7-A
ug-1
7
21-A
ug-1
7
4-Se
p-17
18-S
ep-1
7
2-O
ct-1
7
16-O
ct-1
7
30-O
ct-1
7
ABL IIF Average of 6 Month Deposit Rate of 3 A Rated Islamic Banks
Oct - 31,2017 YTD* St. Dev** Sharpe
Ratio** Alpha***
PERFORMANCE

IN FOCUS ABL ISLAMICSTOCK FUND
ABL-ISF declined by 6.07% in October 2017 against a negative return of 5.80% of the benchmark, reflecting an underperformance of 27 basis points. During the period under review, allocation to Automobile Parts & Accessories sector decreased from 8.65% to 2.61%. As at October 31, 2017, ABL-ISF was 81.23% invested in equities and remaining in bank deposits.The KMI-30 Index dropped by 5.80% in October 2017 mainly owning to prevalent political upheaval resulting from Panama cases against ruling political parties. Besides, rising concerns on external account due to mounting trade deficit kept the investors at bay. Mutual funds emerged as the major seller in the month with net outflows of USD40 million. However, Oil & Gas Exploration Companies provided
some support to the market due to re-pricing of some blocks, sizeable discoveries and recovery in oil prices during the month. Moving ahead, positive stance is intact based on strong corporate earnings, abundant domestic liquidity and attractive valuation. The Scheme has maintained the provision against Sindh Workers’ Welfare Fund’s Liability to the tune of Rs. 24.605million, had the same not been made, the NAV per unit of the scheme would have been higher by Rs. 0.1404 per unit.The Scheme has total expense ratio (TER) of 1.12% (0.16% representing Government Levies and SECP Fee etc.). TER also includes the provision of sales & marketing expenses with 0.4% p.a. of Net Assets amounting to PKR 3.571 million.
To provide higher risk adjusted returns over the long term by investing in a diversified Islamic portfolio of equity instruments offering capital gain and dividends.INVESTMENT OBJECTIVE
FUND MANAGER'S COMMENTS
FUND MANAGER'SREPORT, OCT 2017
TOP TEN HOLDINGS (% OF TOTAL ASSETS) September 30, 2017 October 31, 2017
Sui Northern Gas Pipelines LimitedOil and Gas Development Co. Ltd.Mari Petroleum Company LimitedPakistan Oilfields LimitedPakistan State Oil Company LimitedPackages LimitedEngro Fertilizers LimitedD.G. Khan Cement Company LimitedInternational Steels LimitedI.C.I. Pakistan LimitedTotal
7.24%6.61%6.18%5.84%5.20%4.78%4.19%4.13%4.03%3.66%
51.86%
8.30%6.52%6.41%0.19%3.66%5.27%2.59%0.97%4.78%4.41%
43.10%
Stock/Equities
Bank Balances
Others
Leverage
Total
84.66%
13.72%
1.63%
NIL
100.00%
81.23%
15.39%
3.38%
NIL
100.00%
September 30,2017
October 31,2017ASSET ALLOCATION
Note: Amount invested by Fund of Fund is Rs. 541.2mn
ABL-ISF
Benchmark
*Funds returns computed on NAV to NAV with the dividend reinvestment (excluding sales load) ** 12M Trailing Data
(6.07%)
(5.80%)
(17.69%)
(14.38%)
20.30%
20.63%
0.91
1.00
0.49%
N/A
Oct - 17* YTD* St. Dev** Beta Alpha
PERFORMANCE
"Disclaimer: This publication is for informational purposes only and nothing here in should be construed as a solicitation, recommendation or an offer to buy or sell any fund. All Investments in mutual funds are subject to market risks. The NAV based prices of units and any dividends /returns there on are dependent on forces and factors affecting the capital markets. These may go up or down based on market conditions . Past performance is not necessarily indicative of future results. Please read the offering document to understand the investment policies and the risk involved including risk disclosure for special feature.
SECTOR ALLOCATION (% OF TOTAL ASSETS)
3 month
ABL-ISF
Benchmark
(17.06%)(14.99%)
(22.07%)(20.33%)
1.46%
0.98%
43.16%
38.19%
n/a
n/a
77.43%
79.08%
6 month 1 Year 3 Year 5 Year Since Inception
*Funds returns computed on Absolute basis. Performance data does not include cost incurred by investor in the form of sales load.
BASIC FUND INFORMATIONOpen-end
Islamic Equity Scheme
June 12, 2013
Rs 2497.11mn as at October 31, 2017
Rs 1955.93mn as at October 31, 2017
Rs 14.2517 as at October 31, 2017
KMI-30 Index
As Per Local Stock Exchanges
4:00 PM
Forward
2% p.a
2%
MCB Financial Services Limited
M/S. A.F. Ferguson & Co, Chartered Accountants
AM2+ (Stable outlook) (JCR-VIS)
High
MFR 4-Star (JCR VIS) (Based on one Year weighted
average) For the period ended December 31,2015.
M. Abdul Hayee, CFA
Pakistan Stock Exchange
Fund Type
Category
Launch Date
Net Assets
Net Assets (Excluding FoF Investments)
NAV
Benchmark
Dealing Days
Cut-off time
Pricing Mechanism
Management Fees
Front -end Load
Trustee
Auditor
Asset Manager Rating
Risk Profile of the Fund
Performance Ranking
Fund Manager
Listing
Alee Khalid Ghaznavi - CEO Saqib Matin, ACA - CFO & CSKashif Rafi - CIO Fahad Aziz, Fund ManagerM. Abdul Hayee, CFA - Fund Manager Aniel Victor - Head of Risk Management
Investment Committee Members:
-10.0%-5.0%0.0%5.0%
10.0%15.0%20.0%25.0%30.0%35.0%40.0%
1-N
ov-1
6
12-N
ov-1
6
23-N
ov-1
6
4-D
ec-1
6
15-D
ec-1
6
26-D
ec-1
6
6-Ja
n-17
17-J
an-1
7
28-J
an-1
7
8-Fe
b-17
19-F
eb-1
7
2-M
ar-1
7
13-M
ar-1
7
24-M
ar-1
7
4-A
pr-1
7
15-A
pr-1
7
26-A
pr-1
7
7-M
ay-1
7
18-M
ay-1
7
29-M
ay-1
7
9-Ju
n-17
20-J
un-1
7
1-Ju
l-17
12-J
ul-1
7
23-J
ul-1
7
3-A
ug-1
7
14-A
ug-1
7
25-A
ug-1
7
5-Se
p-17
16-S
ep-1
7
27-S
ep-1
7
8-O
ct-1
7
19-O
ct-1
7
30-O
ct-1
7
KMI-30 ABL ISF
Oil & Gas Exploration Companies
Bank Balance & Others
Oil & Gas Marketing Companies
Cement
Fertilizer
Engineering
Paper & Board
Automobile Assembler
Chemical
Commercial Banks
Textile Composite
Power Generation & Distribution
Automobile Parts & Accessories
Pharmaceuticals
Refinery
Sugar & Allied Industries
0% 2% 4% 6% 8% 10% 12% 14% 16% 18% 20% 22%
0.09%
1.07%
1.65%
2.61%
2.66%
2.68%
2.97%
3.66%
4.76%
4.78%
5.67%
6.58%
8.22%
12.63%
18.77%
21.19%

IN FOCUS ABL ISLAMICDEDICATED STOCK FUND
ABL-IDSF declined by 6.01% in October 2017 against 5.80% decrease of the benchmark, reflecting an underperformance of 20 basis points. During the period under review, allocation to Automobile Parts & Accessories Sector decreased from 8.40% to 2.65%. As at October 31, 2017, ABL-IDSF was 86.08% invested in equities and remaining in bank deposits.The KMI-30 Index dropped by 5.80% in October 2017 mainly owning to prevalent political upheaval resulting from Panama cases against ruling political parties. Besides, rising concerns on external account due to mounting trade deficit kept the investors at bay. Mutual funds emerged as the major seller in the month with net outflows of USD40 million. However, Oil & Gas Exploration Companies provided
some support to the market due to re-pricing of some blocks, sizeable discoveries and recovery in oil prices during the month. Moving ahead, positive stance is intact based on strong corporate earnings, abundant domestic liquidity and attractive valuation. The Scheme has maintained the provision against Sindh Workers’ Welfare Fund’s Liability to the tune of Rs. 1.553million, had the same not been made, the NAV per unit of the scheme would have been higher by Rs. 0.0066 per unit. The Scheme has total expense ratio (TER) of 1.12% (0.15% representing Government Levies and SECP Fee etc.). TER also includes the provision of sales & marketing expenses with 0.4% p.a. of Net Assets amounting to PKR 2.876 million.
To provide capital appreciation to investors of ‘Fund of Funds’ schemes by investing in Shariah compliant equity securities.INVESTMENT OBJECTIVE
FUND MANAGER'S COMMENTS
FUND MANAGER'SREPORT, OCT 2017
"Disclaimer: This publication is for informational purposes only and nothing here in should be construed as a solicitation, recommendation or an offer to buy or sell any fund. All Investments in mutual funds are subject to market risks. The NAV based prices of units and any dividends /returns there on are dependent on forces and factors affecting the capital markets. These may go up or down based on market conditions . Past performance is not necessarily indicative of future results. Please read the offering document to understand the investment policies and the risk involved including risk disclosure for special feature.
BASIC FUND INFORMATIONFund Type
Category
Launch Date
Net Assets
Net Assets (Excluding FoF Investments)
NAV
Benchmark
Dealing Days
Cut-off time
Pricing Mechanism
Management Fees
Front -end Load
Trustee
Auditor
Asset Manager Rating
Risk Profile of the Fund
Performance Ranking
Fund Manager
Listing
Open-end
Islamic Equity Scheme
December 20, 2016
Rs 1976.93mn as at October 31, 2017
Rs 0.01mn as at October 31, 2017
Rs 8.3438 as at October 31, 2017
KMI-30 Index
As Per Local Stock Exchanges
4:00 PM
Forward
2% p.a
NIL
MCB Financial Services Limited
M/S. A.F. Ferguson & Co, Chartered Accountants
AM2+ (Stable outlook) (JCR-VIS)
High
n/a
M. Abdul Hayee, CFA
Pakistan Stock Exchange
Stock/Equities
Bank Balances
Others
Leverage
Total
92.68%
5.60%
1.72%
NIL
100.00%
86.08%
11.28%
2.64%
NIL
100.00%
September 30,2017
October 31,2017ASSET ALLOCATION
Note: Amount invested by Fund of Fund is Rs. 1,976.9mn
3 month
ABL-IDSF
Benchmark(16.86%)(14.99%)
(21.67%)(20.33%)
n/a
n/a
n/a
n/a
n/a
n/a
(14.90%)(16.63%)
6 month 1 Year 3 Year 5 Year Since Inception
ABL-IDSF
Benchmark
*Funds returns computed on NAV to NAV with the dividend reinvestment (excluding sales load) ** 12M Trailing Data
(6.01%)
(5.80%)
(17.26%)
(14.38%)
N/A
N/A
N/A
N/A
N/A
N/A
Oct - 17* YTD* St. Dev** Beta Alpha
PERFORMANCE
Alee Khalid Ghaznavi - CEO Saqib Matin, ACA - CFO & CSKashif Rafi - CIO Fahad Aziz, Fund ManagerM. Abdul Hayee, CFA - Fund Manager Aniel Victor - Head of Risk Management
Investment Committee Members:
TOP TEN HOLDINGS (% OF TOTAL ASSETS) September 30, 2017 October 31, 2017
Mari Petroleum Company LimitedSui Northern Gas Pipelines LimitedPakistan State Oil Company LimitedOil and Gas Development Co. Ltd.Packages LimitedPakistan Oilfields LimitedI.C.I. Pakistan LimitedD.G. Khan Cement Company LimitedPak Suzuki Motor Company LimitedMillat Tractors LimitedTotal
7.68%7.38%7.23%6.50%5.10%4.91%4.44%4.33%3.57%3.36%
54.50%
8.13%8.45%7.48%5.95%5.72%0.17%5.29%1.00%3.30%3.82%
49.31%
-15.00%
-10.00%
-5.00%
0.00%
5.00%
10.00%
15.00%
20.00%
20-Dec-16
3-Jan-17
17-Jan-17
31-Jan-17
14-Feb-17
28-Feb-17
14-Mar-17
28-Mar-17
11-Apr-17
25-Apr-17
9-May-17
23-May-17
6-Jun-17
20-Jun-17
4-Jul-17
18-Jul-17
1-Aug-17
15-Aug-17
29-Aug-17
12-Sep-17
26-Sep-17
10-Oct-17
24-Oct-17
KMI-30 ABL IDSF
SECTOR ALLOCATION (% OF TOTAL ASSETS)
*Funds returns computed on Absolute basis. Performance data does not include cost incurred by investor in the form of sales load.
Oil & Gas Exploration Companies
Oil & Gas Marketing Companies
Bank Balance & Others
Cement
Automobile Assembler
Engineering
Paper & Board
Chemical
Fertilizer
Commercial Banks
Textile Composite
Power Generation & Distribution
Automobile Parts & Accessories
Pharmaceuticals
Refinery
Sugar & Allied Industries
Leather & Tanneries 0.04%
0.08%
1.05%
2.09%
2.65%
2.79%
2.87%
3.23%
4.22%
4.44%
5.10%
5.53%
7.12%
8.11%
13.92%
14.61%
22.15%
0.00% 4.00% 8.00% 12.00% 16.00% 20.00%

TECHNICAL INFORMATION APF-DSF APF-ESF
Fund Size (PKR Millions)NAV
91.213153.0674
78.218139.8032
APF-MMSF
45.219115.3714
IN FOCUS ABL PENSIONFUND
ABL Pension Fund - Debt Sub Fund posted an annualized yield 2.26% during the month of October’17. During the month, exposure in T-bills remained unchanged and Corporate Sukuks decreased from 15.91% to 15.70% during October’17. At month end, portfolio comprised of 72.56%, T-bills, while cash at bank and investment in Corporate sukuks stood at 11.29% & 15.70% respectively. Going forward, we intend to maintain a low duration portfolio in order to avoid volatility. The Scheme has maintained the provision against Sindh Workers’ Welfare Fund’s Liability to the tune of Rs. 169,489, had the same not been made, the NAV per unit of the scheme would have been higher by Rs. 0.3029per unit. ABL Pension Fund - Money Market Sub Fund generated an annualized return of 3.33% in October’17. Since Inception basis, ABLPF - MMSF yielded an annualized return of 4.80% respectively. At the end of the month, cash in bank increased from 54.99% to 56.25%, while exposure in T-bills decreased from 44.62% from 43.38%. Going forward, we intend to maintain a low duration portfolio in order to avoid volatility in returns.
The Scheme has maintained the provision against Sindh Workers’ Welfare Fund’s Liability to the tune of Rs. 88,030, had the same not been made, the NAV per unit of the scheme would have been higher by Rs. 0.2246 per unit. ABL Pension Fund - Equity Sub Fund decreased by 6.06% in Oct’17. The KSE-100 Index dropped by 6.58% in October 2017 mainly owning to prevalent political upheaval resulting from Panama cases against ruling political parties. Besides, rising concerns on external account due to mounting trade deficit kept the investors at bay. Mutual funds emerged as the major seller in the month with net outflows of USD40 million. However, Oil & Gas Exploration Companies provided some support to the market due to re-pricing of some blocks, sizeable discoveries and recovery in oil prices. Moving ahead, positive stance is intact based on strong corporate earnings, abundant domestic liquidity and attractive valuation. The Scheme has maintained the provision against Sindh Workers’ Welfare Fund’s Liability to the tune of Rs. 629,693, had the same not been made, the NAV per unit of the scheme would have been higher by Rs. 1.0567 per unit.
To provide a secure source of savings and regular income after retirement to the ParticipantsINVESTMENT OBJECTIVEFUND MANAGER'S COMMENTS
FUND MANAGER'SREPORT, OCT 2017
BASIC FUND INFORMATIONOpen-end
Voluntary Pension Scheme
August 20, 2014
As Per Banking Days
4.00 pm
Forward
1.5 % p.a. on average Net Assets of each Sub-Fund
Maximum of 3 % on all Contributions, unless
exempt under the Offering Document
Central Depository Company of Pakistan Ltd (CDC)
Deloitte – Yousuf Adil – Chartered Accountants
AM2+ (Stable Outlook) (JCR-VIS)
NA
Investor dependent
M. Abdul Hayee, CFA
Cash Placements with Banks (TDRs) Corporate Sukuk T-Bills PIBs Others Including ReceivablesTotal
11.19%0.00%
15.91%72.55%
0.00%0.35%
100.00%
11.29%0.00%
15.70%72.56%
0.00%0.45%
100.00%
September 30, 2017APF DEBT SUB FUND October 31, 2017
CashCorporate SukukPIBsT-BillsOthers Including ReceivablesTotal
54.99%0.00%0.00%
44.62%0.39%
100.00%
56.25%0.00%0.00%
43.38%0.37%
100.00%
September 30, 2017APF MONEY MARKET SUB FUND October 31, 2017
Stock/EquitiesBank BalancesT-BillsOthersLeverageTotal
86.47%12.45%
0.00%1.08%
NIL100.00%
91.23%7.22%0.00%1.55%
NIL100.00%
September 30, 2017APF EQUITY SUB FUND October 31, 2017
EQUITY SUB-FUND (% OF TOTAL ASSETS) September 30, 2017 October 31, 2017
Thal LimitedMari Petroleum Company LimitedLucky Cement LimitedPakistan State Oil Company LimitedNishat Mills LimitedI.C.I. Pakistan LimitedHabib Bank LimitedHonda Atlas Cars (Pakistan) LimitedEngro Corporation LimitedEngro Fertilizers LimitedTotal
7.38%5.97%5.54%5.30%5.28%4.99%4.90%4.54%4.52%3.98%
52.40%
7.43%5.75%5.97%5.33%5.47%5.42%5.13%4.40%4.57%3.58%
53.05%
DISCLOSURE IN COMPLIANCE WITH SECP'S DISCRETION NO # 23 OF 2016
SECTOR ALLOCATION (% OF EQUITY SUB-FUND)
"Disclaimer: This publication is for informational purposes only and nothing here in should be construed as a solicitation, recommendation or an offer to buy or sell any fund. All Investments in mutual funds are subject to market risks. The NAV based prices of units and any dividends /returns there on are dependent on forces and factors affecting the capital markets. These may go up or down based on market conditions . Past performance is not necessarily indicative of future results. Please read the offering document to understand the investment policies and the risk involved including risk disclosures for special features.
3 month
APF-DSF*APF- MMSF*APF- ESF**
3.31%3.65%
(15.08%)
3.53%3.75%
(22.39%)
4.47%3.88%
(0.20%)
11.32%4.65%
47.04%
- - -
12.44%4.80%
53.07%
6 month 1 Year 3 Year 5 Year Since Inception
Fund Type
Category
Launch Date
Dealing Days
Cut-off time
Pricing Mechanism
Management Fees
Front -end Load
Trustee
Auditor
Asset Manager Rating
Fund Stability Rating
Risk Profile of the Fund
Fund Manager
*Fund returns are computed on simple annualized basis.**Fund returns are computed on simple annualized basis. Performance data does not include cost incurred by investor in the form of sales load.
APF DEBT SUB FUNDThe Scheme has also mantained Total expense ratio (TER) 0.73% (0.10% representing Government Levies and SECP Fee etc.).APF MONEY MARKET SUB FUNDScheme has also mantained Total expense ratio (TER) 0.78% (0.09% representing Government Levies and SECP Fee etc).APF EQUITY SUB FUNDThe Scheme has also mantained Total expense ratio (TER) 0.73% (0.10% representing Government Levies and SECP Fee etc.).
*DETAILS OF NON-COMPLIANT INVESTMENT WITH THE INVESTMENT CRITERIA OF ASSIGNED CATEGORY
Nameof Fund -
Exposure Type
-
% of Net Assets
-
Limit
-
Excess /Short
-
October-17YTD *Funds returns computed on NAV to NAV with the dividend reinvestment (excluding sales load)
2.26%3.42%
3.33%3.76%
(6.06%)(18.13%)
APF-DSF APF-MMSF APF-ESF
PERFORMANCE
Alee Khalid Ghaznavi - CEO Saqib Matin, ACA - CFO & CSKashif Rafi - CIO Fahad Aziz, Fund ManagerM. Abdul Hayee, CFA - Fund Manager Aniel Victor - Head of Risk Management
Investment Committee Members:
0.00% 3.00% 6.00% 9.00% 12.00% 15.00% 18.00%
0.82%
1.98%
2.04%
2.30%
3.55%
4.54%
4.99%
5.28%
8.63%
8.78%
8.91%
9.57%
11.95%
12.01%
14.65%Oil & Gas Exploration Companies
Cement
Commercial Banks
Fertilizer
Oil & Gas Marketing Companies
Bank Balance & Others
Automobile Parts & Accessories
Textile Composite
Chemical
Automobile Assembler
Paper & Board
Engineering
Pharmaceuticals
Insurance
Sugar & Allied Industries

IN FOCUS ABL ISLAMICPENSION FUND
ABL Islamic Pension fund - Debt Sub Fund posted a return of 2.02% in October’17. Other than GoP Ijarah Sukuk, portfolio comprised of 10.33% allocated in Corporate Sukuk and 7.00% placed as cash at banks. Going forward, we intend to maintain the current portfolio allocations as we expect price appreciation in Corporate Sukuks in the near term owing to the lack of shariah complaint instruments in the market.The Scheme has maintained the provision against Sindh Workers’ Welfare Fund’s Liability to the tune of Rs. 73,755, had the same not been made, the NAV per unit of the scheme would have been higher by Rs. 0.180 per unit.ABL Islamic Pension Fund - Money Market SubFund generated an annualized return of 2.48% in October’17. Fund size remained largely stable and closed at PKR 36.826 million. During the month significant allocation was maintained as bank deposits (i.e. 70.46%) owing to better deposit rates offered by banks while remaining 28.47% of the portfolio was placed in GoP Ijarah Sukuks.The Scheme has maintained the provision against Sindh Workers’ Welfare Fund’s Liability to
the tune of Rs. 39,909, had the same not been made, the NAV per unit of the scheme would have been higher by Rs. 0.1211 per unit.ABL Islamic Pension Fund - Equity Sub Fund decreased by 5.76% in the month of October’17. The KMI-30 Index dropped by 5.80% in October 2017 mainly owning to prevalent political upheaval resulting from Panama cases against ruling political parties. Besides, rising concerns on external account due to mounting trade deficit kept the investors at bay. Mutual funds emerged as the major seller in the month with net outflows of USD40 million. However, Oil & Gas Exploration Companies provided some support to the market due to re-pricing of some blocks, sizeable discoveries and recovery in oil prices. Moving ahead, positive stance is intact based on strong corporate earnings, abundant domestic liquidity and attractive valuation.The Scheme has maintained the provision against Sindh Workers’ Welfare Fund’s Liability to the tune of Rs. 633,377, had the same not been made, the NAV per unit of the scheme would have been higher by Rs. 1.4665 per unit.
To provide a secure source of savings and regular income after retirement to the Participants
INVESTMENT OBJECTIVE
FUND MANAGER'S COMMENTS
FUND MANAGER'SREPORT, OCT 2017
BASIC FUND INFORMATIONOpen-end
Voluntary Pension Scheme
August 20, 2014
As Per Banking Days
4.00 pm
Forward
1.5 % p.a. on average Net Assets of each Sub-Fund
Maximum of 3 % on all Contributions, unless
exempt under the Offering Document
Central Depository Company of Pakistan Ltd (CDC)
Deloitte – Yousuf Adil – Chartered Accountants
AM2+ (Stable Outlook) (JCR-VIS)
NA
Investor dependent
M. Abdul Hayee, CFA
Cash GoP Ijarah Sukuk Corporate Sukuk Others Including ReceivablesTotal
7.52%80.33%10.40%
1.75%100.00%
7.00%80.49%10.33%
2.18%100.00%
September 30, 2017APF ISLAMIC DEBT SUB FUND October 31, 2017
CashGoP Ijarah SukukCorporate SukukOthers Including ReceivablesTotal
70.59%28.49%
0.00%0.92%
100.00%
70.46%28.47%
0.00%1.07%
100.00%
September 30, 2017APF ISLAMIC MONEY MARKET SUB FUND October 31, 2017
Shariah Compliant EquitiesBank BalancesOthersLeverageTotal
90.86%7.89%1.25%
NIL100.00%
86.60%3.02%
10.38%NIL
100.00%
September 30, 2017APF ISLAMIC EQUITY SUB FUND October 31, 2017
TECHNICAL INFORMATION APF-IDSF APF-IESF
Fund Size (PKR Millions)NAV
68.3340158.2193
46.8431114.2989
APF-IMMSF
36.8259111.7798
EQUITY SUB-FUND (% OF TOTAL ASSETS) September 30, 2017 October 31, 2017
Mari Petroleum Company LimitedThal LimitedLucky Cement LimitedI.C.I. Pakistan LimitedNishat Mills LimitedEngro Fertilizers LimitedOil and Gas Development Co. Ltd.Pakistan State Oil Company LimitedPackages LimitedD.G. Khan Cement Company LimitedTotal
7.81%7.41%6.27%5.95%5.77%5.76%5.38%5.36%4.72%4.64%
59.07%
7.63%8.92%6.85%6.55%6.06%8.36%5.24%6.83%4.89%1.07%
62.40%
DISCLOSURE IN COMPLIANCE WITH SECP'S DISCRETION NO # 23 OF 2016
SECTOR ALLOCATION (% OF EQUITY SUB-FUND)
"Disclaimer: This publication is for informational purposes only and nothing here in should be construed as a solicitation, recommendation or an offer to buy or sell any fund. All Investments in mutual funds are subject to market risks. The NAV based prices of units and any dividends /returns there on are dependent on forces and factors affecting the capital markets. These may go up or down based on market conditions . Past performance is not necessarily indicative of future results. Please read the offering document to understand the investment policies and the risk involved including risk disclosures for special features.
3 month
APF-IDSF*APF- IMMSF*APF- IESF**
1.16%1.73%
(14.17%)
2.01%2.17%
(20.32%)
2.49%2.33%1.91%
4.42%3.59%
50.45%
- - -
4.47%3.68%
58.22%
6 month 1 Year 3 Year 5 Year Since Inception
Fund Type
Category
Launch Date
Dealing Days
Cut-off time
Pricing Mechanism
Management Fees
Front -end Load
Trustee
Auditor
Asset Manager Rating
Fund Stability Rating
Risk Profile of the Fund
Fund Manager
*Fund returns are computed on simple annualized basis. Performance data does not include cost incurred by investor in the form of sales load.**Fund returns are computed on Absolute Basis
APF ISLAMIC DEBT SUB FUNDThe Scheme has also mantained Total expense ratio (TER) 0.79% (0.10% representing Government Levies and SECP Fee etc).APF ISLAMIC MONEY MARKET SUB FUNDThe Scheme has also mantained Total expense ratio (TER) 0.82% (0.10% representing Government Levies and SECP Fee etc).APF ISLAMIC EQUITY SUB FUNDThe Scheme has also mantained Total expense ratio (TER) 0.78% (0.10% representing Government Levies and SECP Fee etc).
*DETAILS OF NON-COMPLIANT INVESTMENT WITH THE INVESTMENT CRITERIA OF ASSIGNED CATEGORY
Nameof Fund -
Exposure Type
-
% of Net Assets
-
Limit
-
Excess /Short
-
October-17YTD*Funds returns computed on NAV to NAV with the dividend reinvestment (excluding sales load)
2.02%(0.03%)
2.48%1.39%
-5.76%(15.37%)
APF-IDSF APF-IMMSF APF-IESF
PERFORMANCE
Alee Khalid Ghaznavi - CEO Saqib Matin, ACA - CFO & CSKashif Rafi - CIO Fahad Aziz, Fund ManagerM. Abdul Hayee, CFA - Fund Manager Aniel Victor - Head of Risk Management
Investment Committee Members:
0.00% 4.00% 8.00% 12.00% 16.00% 20.00% 24.00%
1.00%
2.60%
3.07%
4.72%
5.77%
5.95%
9.20%
9.29%
10.13%
13.40%
14.04%
20.83%Oil & Gas Exploration Companies
Cement
Bank Balance & Others
Oil & Gas Marketing Companies
Automobile Parts & Accessories
Fertilizer
Chemical
Textile Composite
Paper & Board
Engineering
Pharmaceuticals
Sugar & Allied Industries

IN FOCUS ABL FINANCIALPLANNING FUND
To generate returns on investment as per the respective allocation plan by investing in mutual funds in line with the risk tolerance of the investor.INVESTMENT OBJECTIVE
FUND MANAGER'SREPORT, OCT 2017
BASIC FUND INFORMATION ASSET ALLOCATIONOpen-end
Fund of funds scheme
December 31, 2015
Weighted average return of KSE-30 Index and
average 6 month deposit rate of three Banks
Monday to Friday
Forward
4.00 pm
NIL (upto 1.50% p.a. on the value of underlying
Funds not managed by ABLAMC)
Up to 2%
MCB Financial Services Limited (MCBFSL)
Deloitte - Yousuf Adil . Chartered Accountants
AM2+ (Stable Outlook) (JCR-VIS)
Low to High
Kashif Rafi
Pakistan Stock Exchange
Conv: 0.18% (0.04% including Gop Levy and SECP FEE etc)
Active: 0.13% (0.04% including Gop Levy and SECP FEE etc)
Strategic: 0.12% (0.04% including Gop Levy and SECP FEE etc)
Leverage is NIL for all Plans
*Funds returns computed on NAV to NAV with the dividend reinvestment (excluding sales load)*Funds returns computed on Absolute basis. Performance data does not include cost incurred by investor in the form of sales load
Equity Funds
Income Funds
Money Market Funds
Cash
Others
Total
17.21%
76.69%
5.11%
0.52%
0.48%
100.00%
18.40%
74.55%
5.89%
0.59%
0.57%
100.00%
September 30, 2017 October 31, 2017CONSERVATIVE PLAN
Equity Funds
Income Funds
Money Market Funds
Cash
Others
Total
68.56%
0.00%
30.94%
0.43%
0.08%
100.00%
73.52%
25.32%
0.00%
0.48%
0.68%
100.00%
September 30, 2017 October 31, 2017ACTIVE ALLOCATION PLAN
Equity Funds
Income Funds
Money Market Funds
Cash
Others
Total
13.40%
80.29%
5.85%
0.45%
0.01%
100.00%
18.71%
74.92%
5.93%
0.45%
(0.02%)100.00%
September 30, 2017 October 31, 2017STRATEGIC ALLOCATION PLAN
Conservative Plan
Active Allocation Plan
Strategic Allocation Plan
261,326,598
660,333,775
855,236,652
106.7547
93.9158
96.4286
Net AssŜǘǎ NAVTECHNICAL INFORMATION
"Disclaimer: This publication is for informational purposes only and nothing here in should be construed as a solicitation, recommendation or an offer to buy or sell any fund. All Investments in mutual funds are subject to market risks. The NAV based prices of units and any dividends /returns there on are dependent on forces and factors affecting the capital markets. These may go up or down based on market conditions . Past performance is not necessarily indicative of future results. Please read the offering document to understand the investment policies and the risk involved including risk disclosures for special features.
Fund Type
Category
Launch Date
Benchmark
Dealing Days
Pricing Mechanism
Cut-off time
Management Fees
Structuring Fee
Trustee
Auditor
Asset Manager Rating
Risk Profile of the Fund
Fund Manager
Listing
TER
Conv: The Scheme has maintained the provision against Sindh Workers’ Welfare Fund’s Liability to the tune of Rs. 1.001 million, had the same not been made, the NAV per unit of the scheme would have been higher by Rs. 0.4089 per unit.
Active: The Scheme has maintained the provision against Sindh Workers’ Welfare Fund’s Liability to the tune of Rs. 3.53 million, had the same not been made, the NAV per unit of the scheme would have been higher by Rs. 0.502 per unit.
Strategic: The Scheme has maintained the provision against Sindh Workers’ Welfare Fund’s Liability to the tune of Rs. 0.104 million, had the same not been made, the NAV per unit of the scheme would have been higher by Rs. 0.0117 per unit.
Oct-17
YTD
3 Months
6 Months
Since Inception
(0.91%)(2.50%)(2.40%)(2.73%)12.35%
(0.75%)(1.17%)(1.42%)(1.36%)12.68%
(4.83%)(13.63%)(11.85%)(17.75%)
8.47%
(4.59%)(10.67%)
(9.51%)(15.31%)
7.49%
(0.85%)(4.11%)(1.98%)(6.09%)(3.57%)
(0.78%)(2.32%)(1.07%)(4.78%)(2.56%)
Returns* Benchmark Returns* Benchmark Returns* BenchmarkConservative Active Allocation Strategic
PERFORMANCE
Alee Khalid Ghaznavi - CEO Saqib Matin, ACA - CFO & CSKashif Rafi - CIO Fahad Aziz, Fund ManagerM. Abdul Hayee, CFA - Fund Manager Aniel Victor - Head of Risk Management
Investment Committee Members:

IN FOCUS ABL ISLAMICFINANCIAL PLANNINGFUND
To generate returns on investment as per the respective allocation plan by investing in Shariah compliant mutual funds in line with the risk tolerance of the investor.
INVESTMENT OBJECTIVE
FUND MANAGER'SREPORT, OCT 2017
BASIC FUND INFORMATION ASSET ALLOCATIONOpen-end
Shariah compliant fund of funds scheme
December 23, 2015
Weighted average return of KMI-30 Index and
average 6 month deposit rate of three Islamic Banks
Monday to Friday
Forward
4.00 pm
NIL (upto 1.50% p.a. on the value of underlying
Funds not managed by ABLAMC)
Up to 2%
MCB Financial Services Limited (MCBFSL)
Deloitte - Yousuf Adil . Chartered Accountants
AM2+ (Stable Outlook) (JCR-VIS)
Low to High
Kashif Rafi
Conv: 0.22% (0.04% including Gop Levy and SECP FEE etc)
Aggressive: 0.12% (0.04% including Gop Levy and SECP FEE etc)
Active: 0.13% (0.04% including Gop Levy and SECP FEE etc)
Strategic: 0.13% (0.04% including Gop Levy and SECP FEE etc)
Strategic II: 0.14% (0.04% including Gop Levy and SECP FEE etc)
Strategic III: 0.13% (0.04% including Gop Levy and SECP FEE etc)
Strategic IV: 0.01% (0.05% including Gop Levy and SECP FEE etc)
Leverage is NIL for all Plans
*Funds returns computed on NAV to NAV with the dividend reinvestment (excluding sales load)*Funds returns computed on Absolute basis. Performance data does not include cost incurred by investor in the form of sales load
Equity FundsIncome FundsCashOthersTotal
17.88%75.81%
5.43%0.88%
100.00%
18.50%74.00%
6.40%1.10%
100.00%
September 30,2017
October 31,2017CONSERVATIVE PLAN
Equity FundsIncome FundsCashOthersTotal
67.58%27.23%
5.14%0.05%
100.00%
71.37%20.59%
7.98%0.06%
100.00%
September 30,2017
October 31,2017AGGRESSIVE PLAN
Equity FundsIncome FundsCashOthersTotal
66.98%25.62%
7.35%0.05%
100.00%
73.74%18.72%
7.45%0.09%
100.00%
September 30,2017
October 31,2017ACTIVE ALLOCATION PLAN
Equity FundsIncome FundsCashOthersTotal
53.83%39.97%
6.15%0.05%
100.00%
54.49%37.81%
5.34%2.36%
100.00%
September 30,2017
October 31,2017STRATEGIC ALLOCATION PLAN
Equity FundsIncome FundsCashOthersTotal
38.41%60.39%
1.15%0.06%
100.00%
41.74%49.81%
8.40%0.04%
100.00%
September 30,2017
October 31,2017STRATEGIC ALLOCATION PLAN-II
Equity FundsIncome FundsCashOthersTotal
15.22%80.10%
4.63%0.05%
100.00%
19.19%74.17%
6.59%0.05%
100.00%
September 30,2017
October 31,2017STRATEGIC ALLOCATION PLAN-III
Equity FundsIncome FundsCashOthersTotal
9.08%83.24%
7.50%0.18%
100.00%
19.22%74.24%
6.52%0.02%
100.00%
September 30,2017
October 31,2017STRATEGIC ALLOCATION PLAN-IV
Conservative Plan
Aggressive Plan
Active Allocation Plan
Strategic Allocation Plan
Strategic Allocation Plan II
Strategic Allocation Plan III
Strategic Allocation Plan IV
234,410,527
319,512,248
1,350,654,088
907,547,121
879,600,682
1,139,042,837
765,981,407
108.9450
103.2674
100.8686
101.6645
92.2334
96.5097
99.6732
Net Assets NAVTECHNICAL INFORMATION
"Disclaimer: This publication is for informational purposes only and nothing here in should be construed as a solicitation, recommendation or an offer to buy or sell any fund. All Investments in mutual funds are subject to market risks. The NAV based prices of units and any dividends /returns there on are dependent on forces and factors affecting the capital markets. These may go up or down based on market conditions . Past performance is not necessarily indicative of future results. Please read the offering document to understand the investment policies and the risk involved including risk disclosures for special features.
Fund Type
Category
Launch Date
Benchmark
Dealing Days
Pricing Mechanism
Cut-off time
Management Fees
Structuring Fee
Trustee
Auditor
Asset Manager Rating
Risk Profile of the Fund
Fund Manager
TER
Conv: The Scheme has maintained the provision against Sindh Workers’ Welfare Fund’s Liability to the tune of Rs. 0.93 million, had the same not been made, the NAV per unit of the scheme would have been higher by Rs. 0.4324 per unit.Aggressive: The Scheme has maintained the provision against Sindh Workers’ Welfare Fund’s Liability to the tune of Rs.1.789 million, had the same not been made, the NAV per unit of the scheme would have been higher by Rs. 0.5781 per unit.Active: The Scheme has maintained the provision against Sindh Workers’ Welfare Fund’s Liability to the tune of Rs. 6.116 million, had the same not been made, the NAV per unit of the scheme would have been higher by Rs. 0.4567 per unit.Strategic: The Scheme has maintained the provision against Sindh Workers’ Welfare Fund’s Liability to the tune of Rs. 2.752 million, had the same not been made, the NAV per unit of the scheme would have been higher by Rs. 0.3083 per unit.Strategic II: The Scheme has maintained the provision against Sindh Workers’ Welfare Fund’s Liability to the tune of Rs. 0.252 million, had the same not been made, the NAV per unit of the scheme would have been higher by Rs. 0.0264 per unit.Strategic III: The Scheme has maintained the provision against Sindh Workers’ Welfare Fund’s Liability to the tune of Rs. 0.084 million, had the same not been made, the NAV per unit of the scheme would have been higher by Rs. 0.0071 per unit.Strategic IV: The Scheme has maintained the provision against Sindh Workers’ Welfare Fund’s Liability to the tune of Rs. 0 million, had the same not been made, the NAV per unit of the scheme would have been higher by Rs. 0 per unit.
Period*
Period* Strategic IV
ReturnsOct-17
YTD
3 Months
6 Months
Since Inception
Oct-17
YTD
3 Months
6 Months
Since Inception
(0.85%)(2.73%)(2.68%)(2.96%)10.85%
(0.33%)(0.33%)
n/a
n/a
(0.33%)
(0.74%)(0.78%)
n/a
n/a
(0.78%)
(0.90%)(2.24%)(2.56%)(3.33%)10.24%
(4.18%)(11.96%)(11.66%)(15.06%)14.21%
(4.17%)(10.22%)(10.87%)(14.70%)17.34%
(4.14%)(12.40%)(11.77%)(16.89%)
7.26%
(4.27%)(10.88%)(11.07%)(17.27%)
6.75%
(3.27%)(9.85%)(9.24%)
(14.17%)2.84%
(3.29%)(7.94%)(8.50%)
(14.17%)0.61%
(2.30%)(8.87%)(6.67%)
(12.91%)(7.77%)
(2.36%)(7.27%)(6.06%)
(13.03%)(9.91%)
(0.80%)(3.52%)(2.24%)(3.84%)(3.20%)
(0.94%)(2.79%)(2.26%)(4.31%)(3.79%)
Benchmark
Returns Benchmark
Returns Benchmark Returns Benchmark Returns Benchmark Returns Benchmark Returns Benchmark
Conservative Aggressive Active Allocation Strategic Strategic II Strategic III
PERFORMANCE
InvestmentCommittee Members:
Alee Khalid Ghaznavi - CEOSaqib Matin, ACA - CFO & CSKashif Rafi - CIO
Fahad Aziz, Fund ManagerM. Abdul Hayee, CFA - Fund ManagerAniel Victor - Head of Risk Management
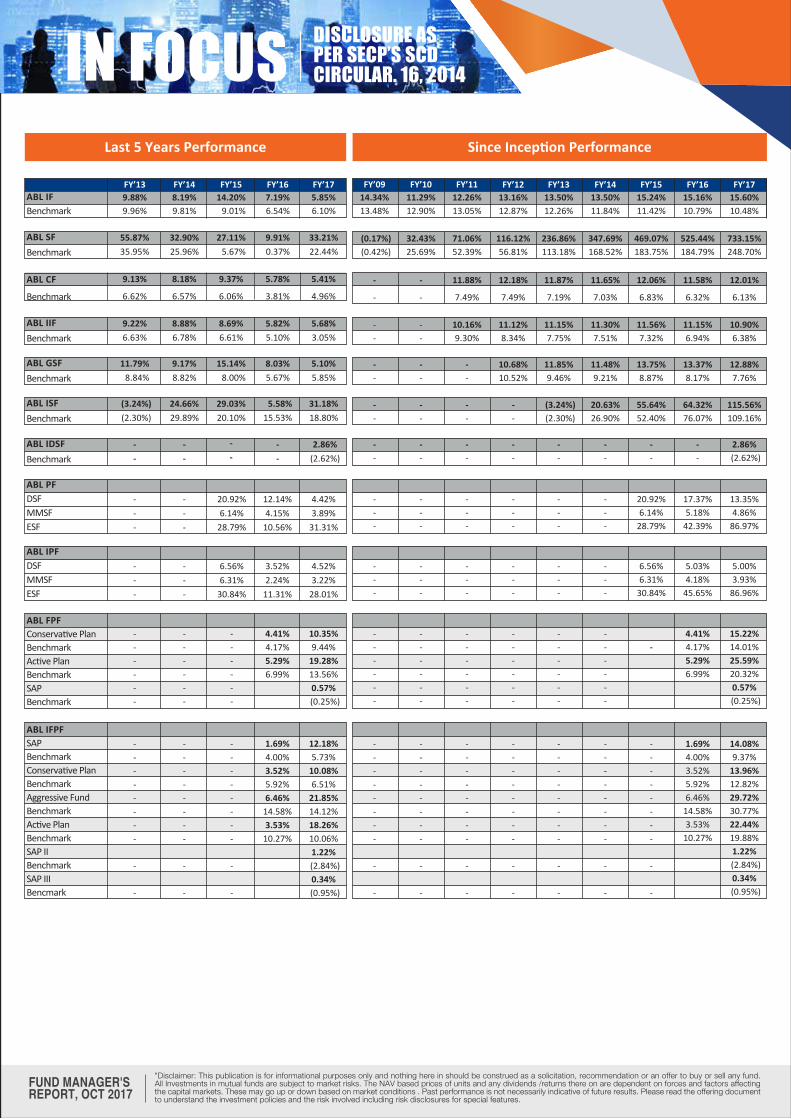
ABL IFBenchmark
FY’139.88%9.96%
8.19%9.81%
14.20%9.01%
7.19%6.54%
5.85%6.10%
FY’14 FY’15 FY’16 FY’17
ABL SF
Benchmark
55.87%
35.95%
32.90%
25.96%
27.11%
5.67%
9.91%
0.37%
33.21%
22.44%
FY’09 FY’10 FY’1112.26%13.05%
11.29%12.90%
14.34%13.48%
13.16%12.87%
13.50%12.26%
13.50%11.84%
15.24%11.42%
15.16%10.79%
15.60%10.48%
FY’12 FY’13 FY’14 FY’15 FY’16 FY’17
71.06%52.39%
32.43%25.69%
(0.17%)(0.42%)
116.12%56.81%
236.86%113.18%
347.69%168.52%
469.07%183.75%
525.44%184.79%
733.15%248.70%
11.88%
7.49%
-
-
-
-
12.18%
7.49%
11.87%
7.19%
11.65%
7.03%
12.06%
6.83%
11.58%
6.32%
12.01%
6.13%
Last 5 Years Performance Since Inception Performance
IN FOCUS DISCLOSURE ASPER SECP’S SCDCIRCULAR. 16, 2014
ABL CF
Benchmark
9.13%
6.62%
8.18%
6.57%
9.37%
6.06%
5.78%
3.81%
5.41%
4.96%
FUND MANAGER'SREPORT, OCT 2017
"Disclaimer: This publication is for informational purposes only and nothing here in should be construed as a solicitation, recommendation or an offer to buy or sell any fund. All Investments in mutual funds are subject to market risks. The NAV based prices of units and any dividends /returns there on are dependent on forces and factors affecting the capital markets. These may go up or down based on market conditions . Past performance is not necessarily indicative of future results. Please read the offering document to understand the investment policies and the risk involved including risk disclosures for special features.
ABL IIF
Benchmark
9.22%
6.63%
8.88%
6.78%
8.69%
6.61%
5.82%
5.10%
5.68%
3.05%
ABL GSF
Benchmark
11.79%
8.84%
9.17%
8.82%
15.14%
8.00%
8.03%
5.67%
5.10%
5.85%
ABL ISF
Benchmark
(3.24%)(2.30%)
24.66%
29.89%
29.03%
20.10%
5.58%
15.53%
31.18%
18.80%
ABL IDSF
Benchmark
-
-
-
-
-
--
-
2.86%
(2.62%)
ABL PFDSFMMSFESF
-
-
-
-
-
-
20.92%
6.14%
28.79%
12.14%
4.15%
10.56%
4.42%
3.89%
31.31%
ABL IPFDSFMMSFESF
-
-
-
-
-
-
6.56%
6.31%
30.84%
3.52%
2.24%
11.31%
4.52%
3.22%
28.01%
4.41%4.17%5.29%6.99%
10.35%9.44%
19.28%13.56%0.57%(0.25%)
ABL FPFConservative PlanBenchmarkActive PlanBenchmarkSAPBenchmark
ABL IFPFSAPBenchmarkConservative PlanBenchmarkAggressive FundBenchmarkActive PlanBenchmarkSAP IIBenchmarkSAP IIIBencmark
------
--------
-
-
--------
-
-
--------
-
-
------
------
1.69%4.00%3.52%5.92%6.46%
14.58%3.53%
10.27%
12.18%5.73%
10.08%6.51%
21.85%14.12%18.26%10.06%1.22%(2.84%)0.34%(0.95%)
10.16%9.30%
--
--
11.12%8.34%
11.15%7.75%
11.30%7.51%
11.56%7.32%
11.15%6.94%
10.90%6.38%
--
--
--
10.68%10.52%
11.85%9.46%
11.48%9.21%
13.75%8.87%
13.37%8.17%
12.88%7.76%
--
--
--
--
(3.24%)(2.30%)
20.63%26.90%
55.64%52.40%
64.32%76.07%
115.56%109.16%
--
--
--
--
--
--
--
--
2.86%(2.62%)
---
---
---
---
---
---
20.92%6.14%
28.79%
17.37%5.18%
42.39%
13.35%4.86%
86.97%
---
---
---
---
---
---
6.56%6.31%
30.84%
5.03%4.18%
45.65%
5.00%3.93%
86.96%
------
------
------
------
------
------
-4.41%4.17%5.29%6.99%
15.22%14.01%25.59%20.32%0.57%(0.25%)
1.69%4.00%3.52%5.92%6.46%
14.58%3.53%
10.27%
14.08%9.37%
13.96%12.82%29.72%30.77%22.44%19.88%1.22%(2.84%)0.34%(0.95%)
--------
-
-
--------
-
-
--------
-
-
--------
-
-
--------
-
-
--------
-
-
--------
-
-

Plot # 24-B Mezznine Floor,Main Market Gulberg 111, LahoreTel: 0423-5750953Mobile: 0345-4268272,0335-4184426
LAHORE2nd Floor, Main Khayaban-e-Ittehad DHA, KarachiTel: 0213-5311001Mobile: 0300-2441896,0332-3081021
KARACHIPlot # 171 A-1 Phase 1DHA, RawalpindiTel: 051-5788728Fax: 051-5789382Mobile: 0333-8505435
RAWALPINDI15 Club Road, Main FaisalLane, Off Club Road, CilvilLines, FaislabadTel: 041-2409413, 041-2409420Mobile: 0301-845066
FAISALABAD
Plot No. 14. Sector MB, DHA, Phase 6, LahoreREGISTERED ADDRESS

Rating as per JCR-VIS
SMSCallEmailWebsite
::::
‘INVEST’ to 82620800 ABL-AM (0800 225 26)[email protected]
ABLAssetManagement
ABLAssetManagement
ablamcl