fund portfolio for today: public sector banks result review 3qfy14
TRANSCRIPT
26th Feb 2014
Most of PSBs profitability were declined due to higher operating cost, surge in provisions and contingencies and creation of DTL special reserve.
But declining profitability and deteriorating asset quality is not a concern but structure damage of balance sheet. Going forward banks with
higher CASA base and healthy growth in deposits would able to protect margin and hence profitability. Post result we like SBI, Union Bank and
UCO Bank due to their structural improvement in balance sheet, operating and financial metrics.
............................................................................ ( Page : 2-3)
Bank’s performance was lower than our expectation in all fronts and reported very weak set of numbers. Operating as well as financials metrics
were remained muted. Profitability was declined by 67% YoY despite of tax reversal owing to muted growth in NII and higher operating
expenses. We are pessimist about the growth parameters. We have neutral view on the stock. .............................................................. ( Page :
18- 22 )
Bank of Baroda’s profitability was up by 3.6% YoY due to right back of depreciation provisions. Bank’s operating and financials metrics were
remained muted except healthy loan growth. Margin compressed sequentially but management guided domestic NIM of 3% from present of
2.95% which seems achievable if we look at balance sheet structure. We value bank at Rs.634/share which implies 0.75 times of FY14E’s book
value. ......................................................................... ( Page : 23- 27)
BANKBARODA : "BUY" 21th Feb 2014
IEA-Equity
Strategy
DENA BANK : "Neutral" 24th Feb 2014
26th Feb, 2014
Edition : 214
Vardhman Textiles : "BUY" 24th Feb 2014
Nestle India :"The nest becomes weaker" "Neutral" 24th Feb 2014
For 4QCY13, Nestle Ind reported below numbers than street expectations in all counts, sales grew by 4.7%(YoY) led by 3.7% domestic growth
and 20.9% export growth. Its domestic sales contribute 94% and exports 6% of sales. While, PAT marginally declined by 0.7% on YoY basis. At a
CMP of Rs 5043, stock trades at 15.9x P/BV of CY14E. We have a “Neutral” view on stock. .................................................................. ( Page : 12-
14)
Considering the favourable export scenario and completion of capacity expansions, we remain positive on FY14. We, hereby, initiate our
coverage with Vardhman Textiles to BUY with a target price of Rs.412 . Currently the stock is trading at 0.8x p/b , we cut our Earning parameter
for FY15 and cut p/b to 0.7x for FY15 . Looking at the current earning growth and environment the stock is looking very good but due to lack of
trigeers in FY15 we are really conservative for FY15 . ................................................. ( Page : 15-17)
Public Sector Banks Result Review 3QFY14
AXIS BANK : "BOOK PART
PROFIT "25th Feb 2014
We advice our investor to book part profit in Axis Bank as bank has achieve our target price level of Rs.1217. We still stick to our valuation on
account of bank’s uncomfortable earnings and asset quality stress. Bank’s profitability was up by 19% YoY on the back of right back of
investment depreciation provisions. Exposure to risky sector remained high which would keep asset quality under stress. These factors compel
us to value bank at 1.5 times of FY14E’s book value......................................................... ( Page : 7-11)
SHREE CEMENT. "BOOK PROFIT " 25th Feb 2014
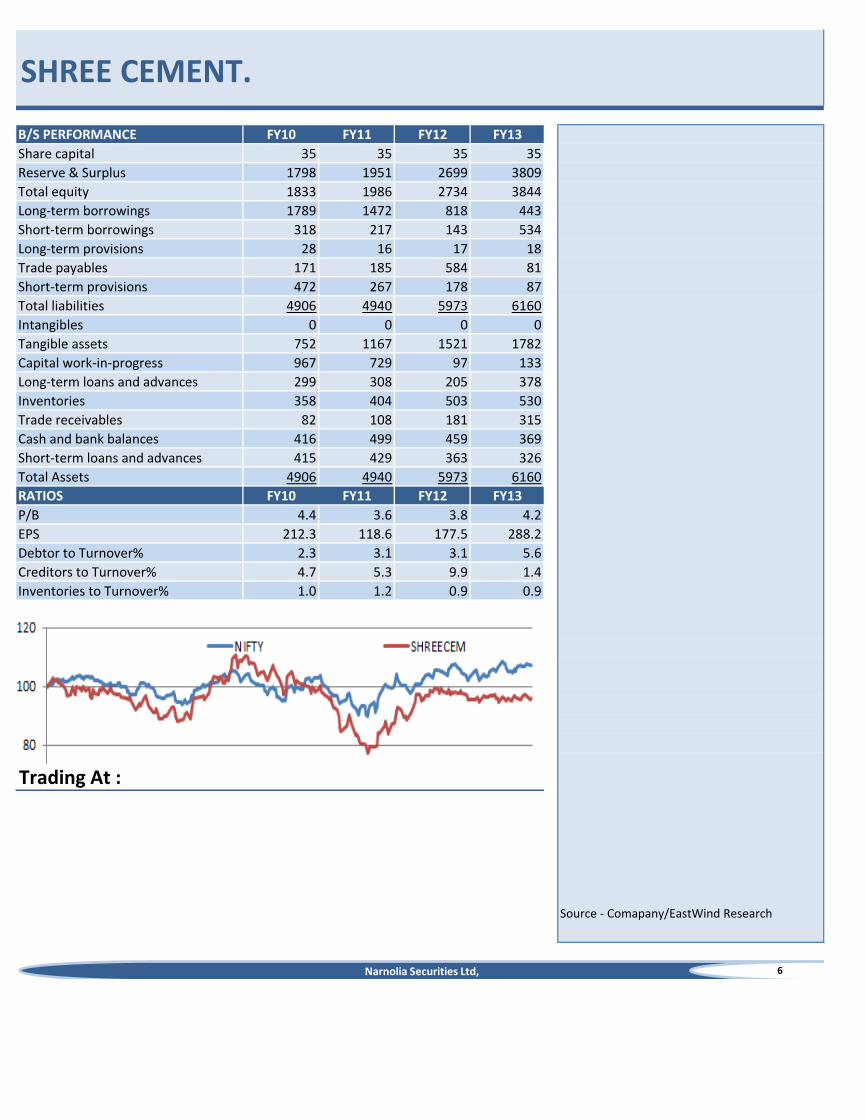
The stock is trading at 4x in 1 yr forward P/B chart.we believe for the current market scenario the price is fare enough to trade.But looking at
future capex plans and sluggish demand we belive the earnings and profitability of Shree cement may fall for the next two consecutive
quarters.The profitability may fall due to incrising depriciation.Till now the company's depriciation level is stable but it may surprise further.so
we recommend its a better pic to book profit. ................................................................. ( Page : 4-6)
Narnolia Securities Ltd,
India Equity AnalyticsDaily Fundamental Report on Indian Equities
2
Please refer to the Disclaimers at the end of this Report.
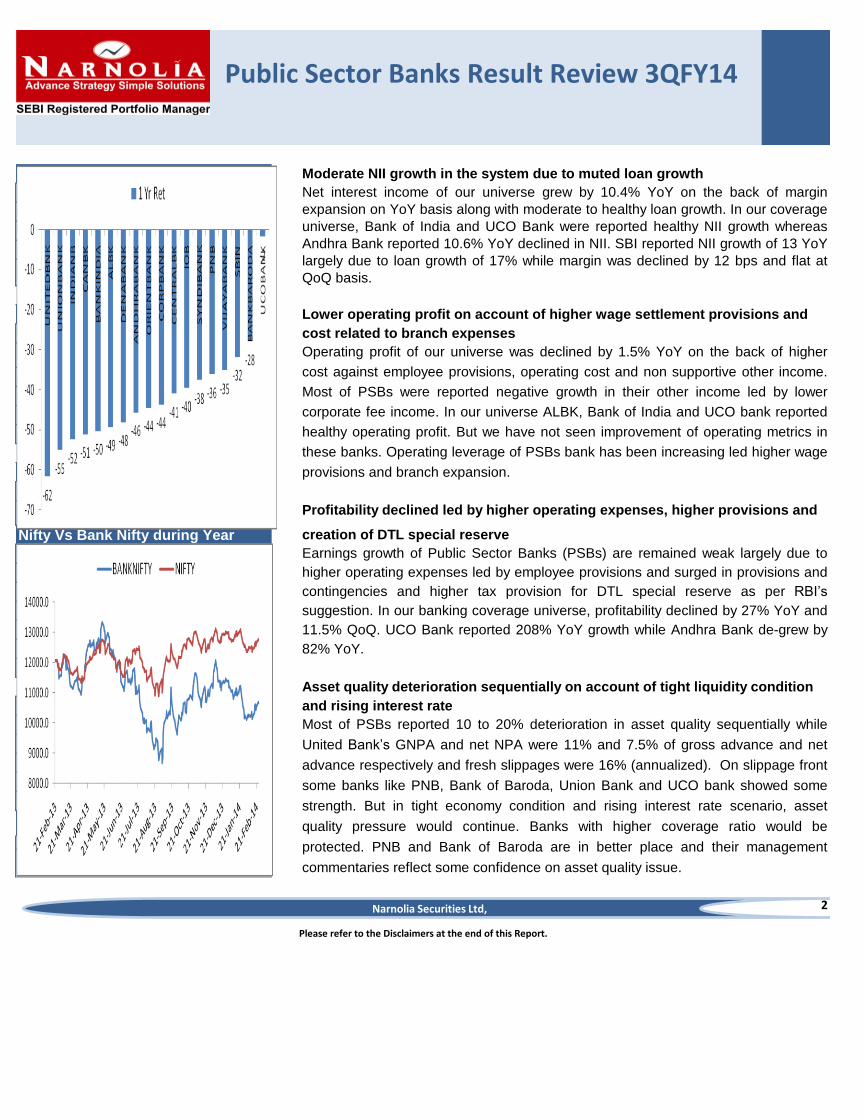
Net interest income of our universe grew by 10.4% YoY on the back of margin
expansion on YoY basis along with moderate to healthy loan growth. In our coverage
universe, Bank of India and UCO Bank were reported healthy NII growth whereas
Andhra Bank reported 10.6% YoY declined in NII. SBI reported NII growth of 13 YoY
largely due to loan growth of 17% while margin was declined by 12 bps and flat at
QoQ basis.
Moderate NII growth in the system due to muted loan growth
Operating profit of our universe was declined by 1.5% YoY on the back of higher
cost against employee provisions, operating cost and non supportive other income.
Most of PSBs were reported negative growth in their other income led by lower
corporate fee income. In our universe ALBK, Bank of India and UCO bank reported
healthy operating profit. But we have not seen improvement of operating metrics in
these banks. Operating leverage of PSBs bank has been increasing led higher wage
provisions and branch expansion.
Lower operating profit on account of higher wage settlement provisions and
cost related to branch expenses
Public Sector Banks Result Review 3QFY14
Profitability declined led by higher operating expenses, higher provisions and
creation of DTL special reserve
Earnings growth of Public Sector Banks (PSBs) are remained weak largely due to
higher operating expenses led by employee provisions and surged in provisions and
contingencies and higher tax provision for DTL special reserve as per RBI’s
suggestion. In our banking coverage universe, profitability declined by 27% YoY and
11.5% QoQ. UCO Bank reported 208% YoY growth while Andhra Bank de-grew by
82% YoY.
Nifty Vs Bank Nifty during Year
Loan (Rs tn) and YoY Gr(%)
Asset quality deterioration sequentially on account of tight liquidity condition
and rising interest rate
Most of PSBs reported 10 to 20% deterioration in asset quality sequentially while
United Bank’s GNPA and net NPA were 11% and 7.5% of gross advance and net
advance respectively and fresh slippages were 16% (annualized). On slippage front
some banks like PNB, Bank of Baroda, Union Bank and UCO bank showed some
strength. But in tight economy condition and rising interest rate scenario, asset
quality pressure would continue. Banks with higher coverage ratio would be
protected. PNB and Bank of Baroda are in better place and their management
commentaries reflect some confidence on asset quality issue.
Narnolia Securities Ltd,

3
Public Sector Banks Result Review 3QFY14
Please refer to the Disclaimers at the end of this Report.
Worry about the structure damage of balance sheet, declined profit is not matter
Outlook
Most of PSBs are trading at lower range of valuation multiple owing to absence of core
earnings, operating leverage, deteriorating asset quality and higher amount of restructure
assets that are in pipeline. Most of banking stocks reported moderate revenue and profit
growth owing to multiple headwinds. In near term we are not seeing improvement in
economic condition and asset quality pressure are expected to remain in the system due
to tight liquidity situation and rising interest rate. Post result we like SBI, Union Bank and
UCO Bank due to their structural improvement in balance sheet, operating and financial
metrics.
Result Snapshot
We are not worried about the declining trend of PSBs profitability but to worry about the
structural damage of balance sheet. Most of PSBs were reported moderate to healthy
loan growth but their deposits and CASA growth were absent. In rising interest rate
scenario, banks with higher low cost deposits would be able to report healthy NII growth
on the back of margin expansion and would absorb operating cost. In our sense, PSBs
would either have to improve their cost structure or improve deposits franchise to report
growth at operating profit level. On cost structure front, we are pessimist as PSBs have
higher numbers of unproductive employee than private banks and their salary at lower to
middle level management are no means less than private sector banks. So banks with
higher deposits growth and strong CASA would be able to report healthy growth going
forward. We have buy rating on SBI on the back of its high CASA base and reasonable
valuation despite of bank’s profitability was declined by 34% YoY.
Narnolia Securities Ltd,
PSU BANKS NII PPP Net Profit NII PPP Net Profit NII PPP Net Profit NII PPP Net Profit NII PPP Net Profit
ALBK 1336 1008 325 1309 1154 276 1330 860 311 0.4 17.2 4.7 2.0 -12.6 18.0
ANDHRABANK 868 522 46 1045 643 71 971 712 257 -10.6 -26.8 -82.3 -16.9 -18.9 -35.5
BANKBARODA 3057 2197 1048 2895 2125 1168 2841 2256 1012 7.6 -2.6 3.6 5.6 3.4 -10.3
BANKINDIA 2719 2144 586 2527 2102 622 2308 1856 803 17.8 15.5 -27.0 7.6 2.0 -5.8
CANBK 2191 1425 626 2191 1425 626 1988 1516 714 10.2 -6.0 -12.3 0.0 0.0 0.0
DENABANK 661 371 68 107 369 625 615 443 206 7.5 -16.3 -67.1 517.7 0.5 -89.2
IOB 1398 961 75 1452 791 133 1382 1017 116 1.2 -5.5 -35.3 -3.7 21.5 -43.6
ORIENTBANK 1230 858 224 1281 825 251 1204 926 326 2.2 -7.3 -31.2 -3.9 4.0 -10.6
PNB 4221 2702 755 4016 2535 505 3733 2682 1306 13.1 0.8 -42.2 5.1 6.6 49.6
SBIN 12641 7618 2235 12251 6312 2375 11154 7791 3396 13.3 -2.2 -34.2 3.2 20.7 -5.9
SYNDIBANK 1359 806 380 1411 811 470 1400 864 508 -3.0 -6.8 -25.2 -3.7 -0.7 -19.2
UCOBANK 1566 1137 315 1569 1166 400 1177 831 102 33.0 36.8 208.4 -0.2 -2.5 -21.4
UNIONBANK 1964 1262 349 1954 1225 208 1891 1358 302 3.8 -7.1 15.5 0.5 3.0 67.8
VIJAYABANK 495 168 11 705 273 136 456 261 127 8.5 -35.7 -91.0 -29.8 -38.6 -91.6
Total 34369 22170 6717 33404 20601 7590 31120 22513 9175 10.4 -1.5 -26.8 2.9 7.6 -11.5
3QFY14 2QFY14 3QFY13 YoY Growth QoQ Growth
SHREE CEMENT.
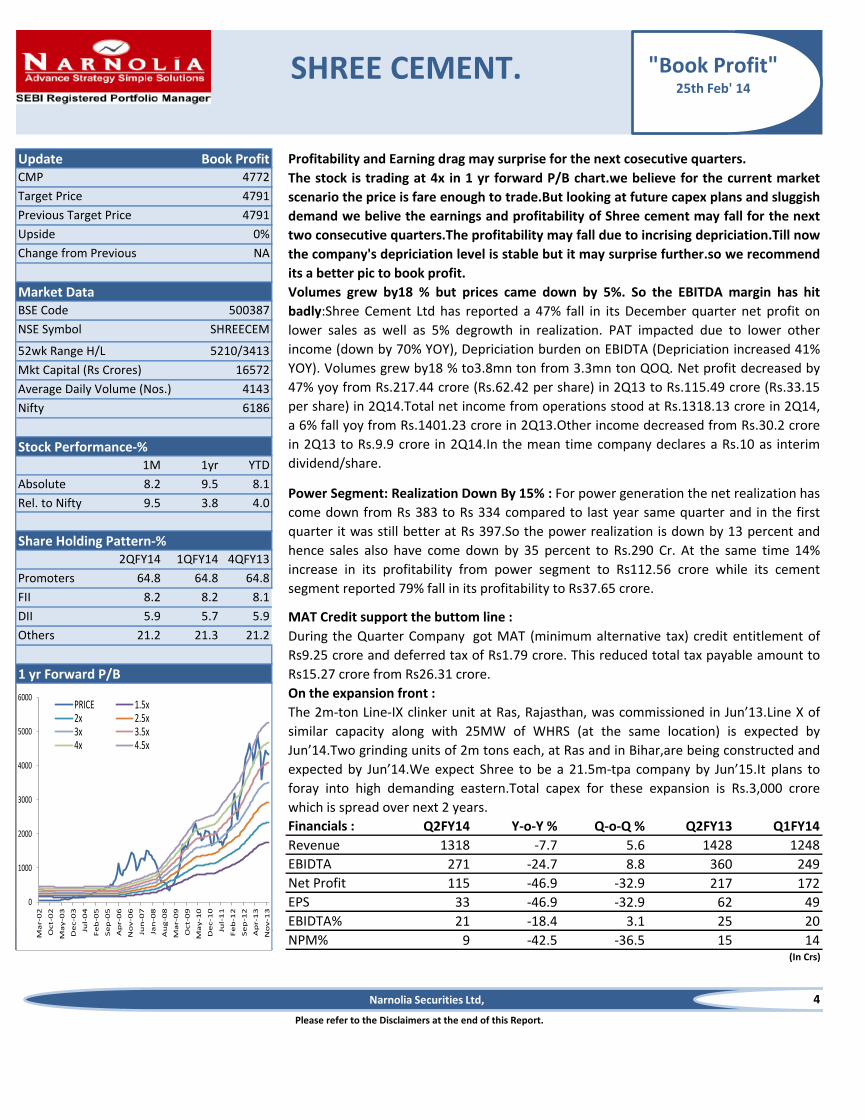
Profitability and Earning drag may surprise for the next cosecutive quarters.4772
4791
4791
0%
NA
500387
16572
4143
6186
1M 1yr YTD
Absolute 8.2 9.5 8.1
Rel. to Nifty 9.5 3.8 4.0
2QFY14 1QFY14 4QFY13
Promoters 64.8 64.8 64.8
FII 8.2 8.2 8.1
DII 5.9 5.7 5.9 MAT Credit support the buttom line :Others 21.2 21.3 21.2
Financials : Q2FY14 Y-o-Y % Q-o-Q % Q2FY13 Q1FY14
Revenue 1318 -7.7 5.6 1428 1248
EBIDTA 271 -24.7 8.8 360 249
Net Profit 115 -46.9 -32.9 217 172
EPS 33 -46.9 -32.9 62 49
EBIDTA% 21 -18.4 3.1 25 20
NPM% 9 -42.5 -36.5 15 14(In Crs)
4
Upside
Change from Previous
CMP
Target Price
Please refer to the Disclaimers at the end of this Report.
Stock Performance-%
Share Holding Pattern-%
1 yr Forward P/B
Source - Comapany/EastWind Research
On the expansion front :
During the Quarter Company got MAT (minimum alternative tax) credit entitlement of
Rs9.25 crore and deferred tax of Rs1.79 crore. This reduced total tax payable amount to
Rs15.27 crore from Rs26.31 crore.
Volumes grew by18 % but prices came down by 5%. So the EBITDA margin has hit
badly:Shree Cement Ltd has reported a 47% fall in its December quarter net profit on
lower sales as well as 5% degrowth in realization. PAT impacted due to lower other
income (down by 70% YOY), Depriciation burden on EBIDTA (Depriciation increased 41%
YOY). Volumes grew by18 % to3.8mn ton from 3.3mn ton QOQ. Net profit decreased by
47% yoy from Rs.217.44 crore (Rs.62.42 per share) in 2Q13 to Rs.115.49 crore (Rs.33.15
per share) in 2Q14.Total net income from operations stood at Rs.1318.13 crore in 2Q14,
a 6% fall yoy from Rs.1401.23 crore in 2Q13.Other income decreased from Rs.30.2 crore
in 2Q13 to Rs.9.9 crore in 2Q14.In the mean time company declares a Rs.10 as interim
dividend/share.
Power Segment: Realization Down By 15% : For power generation the net realization has
come down from Rs 383 to Rs 334 compared to last year same quarter and in the first
quarter it was still better at Rs 397.So the power realization is down by 13 percent and
hence sales also have come down by 35 percent to Rs.290 Cr. At the same time 14%
increase in its profitability from power segment to Rs112.56 crore while its cement
segment reported 79% fall in its profitability to Rs37.65 crore.
Market Data
Average Daily Volume (Nos.)
The 2m-ton Line-IX clinker unit at Ras, Rajasthan, was commissioned in Jun’13.Line X of
similar capacity along with 25MW of WHRS (at the same location) is expected by
Jun’14.Two grinding units of 2m tons each, at Ras and in Bihar,are being constructed and
expected by Jun’14.We expect Shree to be a 21.5m-tpa company by Jun’15.It plans to
foray into high demanding eastern.Total capex for these expansion is Rs.3,000 crore
which is spread over next 2 years.
The stock is trading at 4x in 1 yr forward P/B chart.we believe for the current market
scenario the price is fare enough to trade.But looking at future capex plans and sluggish
demand we belive the earnings and profitability of Shree cement may fall for the next
two consecutive quarters.The profitability may fall due to incrising depriciation.Till now
the company's depriciation level is stable but it may surprise further.so we recommend
its a better pic to book profit.
BSE Code
SHREECEMNSE Symbol
52wk Range H/L
Mkt Capital (Rs Crores)
5210/3413
Previous Target Price
Nifty
Update Book Profit
"Book Profit"25th Feb' 14
Narnolia Securities Ltd,
0
1000
2000
3000
4000
5000
6000
Ma
r-0
2
Oct-
02
Ma
y-0
3
De
c-0
3
Jul-
04
Fe
b-0
5
Se
p-0
5
Ap
r-0
6
No
v-0
6
Jun
-07
Jan
-08
Au
g-0
8
Ma
r-0
9
Oct-
09
Ma
y-1
0
De
c-1
0
Jul-
11
Fe
b-1
2
Se
p-1
2
Ap
r-1
3
No
v-1
3
PRICE 1.5x2x 2.5x3x 3.5x4x 4.5x
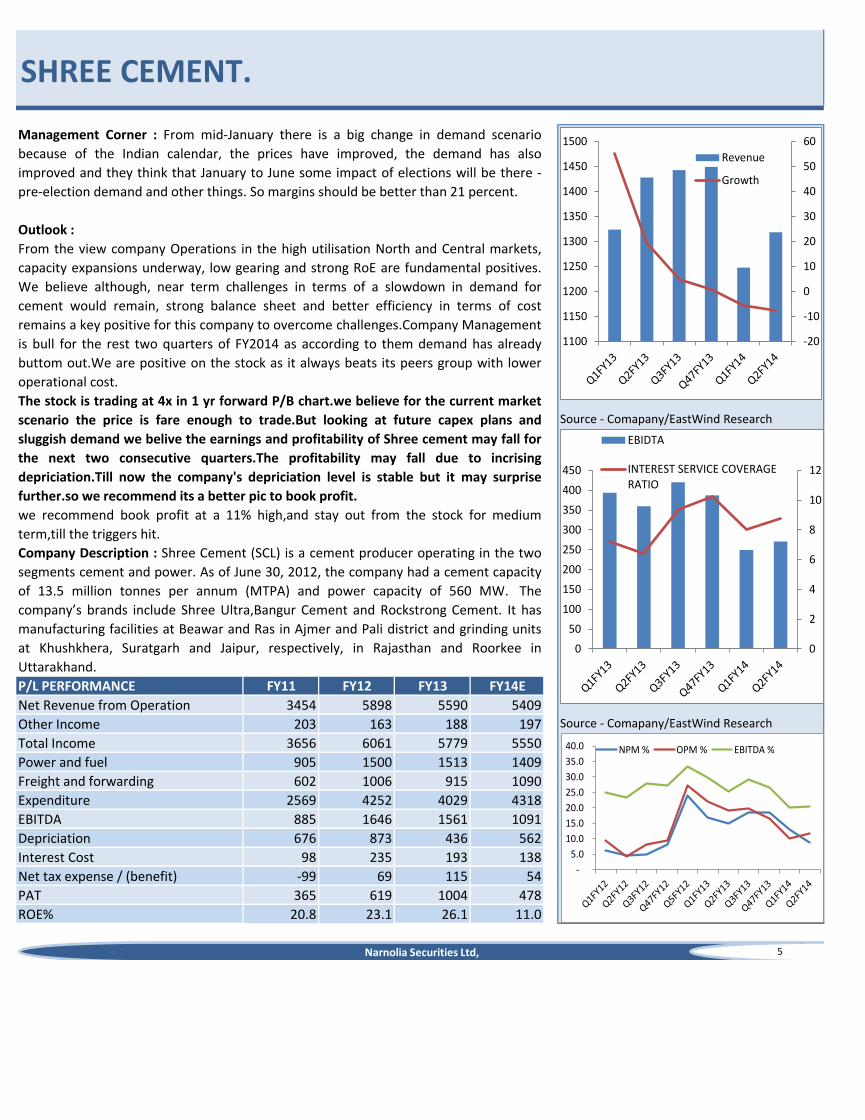
Outlook :
FY11 FY12 FY13 FY14E
3454 5898 5590 5409
203 163 188 197
3656 6061 5779 5550
905 1500 1513 1409
602 1006 915 1090
2569 4252 4029 4318
885 1646 1561 1091
676 873 436 562
98 235 193 138
-99 69 115 54
365 619 1004 478
20.8 23.1 26.1 11.0
5
SHREE CEMENT.
P/L PERFORMANCE
Net Revenue from Operation
Other Income
Total Income
Management Corner : From mid-January there is a big change in demand scenario
because of the Indian calendar, the prices have improved, the demand has also
improved and they think that January to June some impact of elections will be there -
pre-election demand and other things. So margins should be better than 21 percent.
Net tax expense / (benefit)
PAT
ROE%
Power and fuel
Freight and forwarding
Expenditure
EBITDA
Depriciation
Interest Cost
From the view company Operations in the high utilisation North and Central markets,
capacity expansions underway, low gearing and strong RoE are fundamental positives.
We believe although, near term challenges in terms of a slowdown in demand for
cement would remain, strong balance sheet and better efficiency in terms of cost
remains a key positive for this company to overcome challenges.Company Management
is bull for the rest two quarters of FY2014 as according to them demand has already
buttom out.We are positive on the stock as it always beats its peers group with lower
operational cost.
The stock is trading at 4x in 1 yr forward P/B chart.we believe for the current market
scenario the price is fare enough to trade.But looking at future capex plans and
sluggish demand we belive the earnings and profitability of Shree cement may fall for
the next two consecutive quarters.The profitability may fall due to incrising
depriciation.Till now the company's depriciation level is stable but it may surprise
further.so we recommend its a better pic to book profit.
we recommend book profit at a 11% high,and stay out from the stock for medium
term,till the triggers hit.
Company Description : Shree Cement (SCL) is a cement producer operating in the two
segments cement and power. As of June 30, 2012, the company had a cement capacity
of 13.5 million tonnes per annum (MTPA) and power capacity of 560 MW. The
company’s brands include Shree Ultra,Bangur Cement and Rockstrong Cement. It has
manufacturing facilities at Beawar and Ras in Ajmer and Pali district and grinding units
at Khushkhera, Suratgarh and Jaipur, respectively, in Rajasthan and Roorkee in
Uttarakhand.
Source - Comapany/EastWind Research
Source - Comapany/EastWind Research
Narnolia Securities Ltd,
-20
-10
0
10
20
30
40
50
60
1100
1150
1200
1250
1300
1350
1400
1450
1500
Revenue
Growth
-
5.0
10.0
15.0
20.0
25.0
30.0
35.0
40.0 NPM % OPM % EBITDA %
0
2
4
6
8
10
12
0
50
100
150
200
250
300
350
400
450
EBIDTA
INTEREST SERVICE COVERAGERATIO
FY10 FY11 FY12 FY13
35 35 35 35
1798 1951 2699 3809
1833 1986 2734 3844
1789 1472 818 443
318 217 143 534
28 16 17 18
171 185 584 81
472 267 178 87
4906 4940 5973 6160
0 0 0 0
752 1167 1521 1782
967 729 97 133
299 308 205 378
358 404 503 530
82 108 181 315
416 499 459 369
415 429 363 326
4906 4940 5973 6160
FY10 FY11 FY12 FY13
4.4 3.6 3.8 4.2
212.3 118.6 177.5 288.2
2.3 3.1 3.1 5.6
4.7 5.3 9.9 1.4
1.0 1.2 0.9 0.9
6
B/S PERFORMANCE
Trading At :
RATIOS
Capital work-in-progress
Source - Comapany/EastWind Research
SHREE CEMENT.
Share capital
Reserve & Surplus
Total equity
Long-term borrowings
Intangibles
Long-term loans and advances
Inventories
Trade receivables
Cash and bank balances
Short-term borrowings
Long-term provisions
Trade payables
Short-term provisions
Total liabilities
Tangible assets
Inventories to Turnover%
Short-term loans and advances
Total Assets
P/B
EPS
Debtor to Turnover%
Creditors to Turnover%
Narnolia Securities Ltd,
AXIS BANK
1237
1217
1147
-2
6
1M 1yr YTD
Absolute -2.2 -17.4 -17.4
Rel.to Nifty 0.8 -21.0 -21.0
Current 4QFY13 3QFY1
3Promoters 33.9 33.9 33.9
FII 43.2 43.4 40.7
DII 9.7 4.9 8.8
Others 13.2 17.8 16.6
Financials Rs, Cr
2011 2012 2013 2014E 2015E
NII 6566 8026 9666 12224 14775
Total Income 11238 13513 16217 19146 21697
PPP 6377 7413 9303 11206 12367
Net Profit 3340 4224 5179 5826 6934
EPS 81.4 102.2 110.7 124.2 148.2
7
Company Updated BOOK PART
PROFITCMP
Target Price
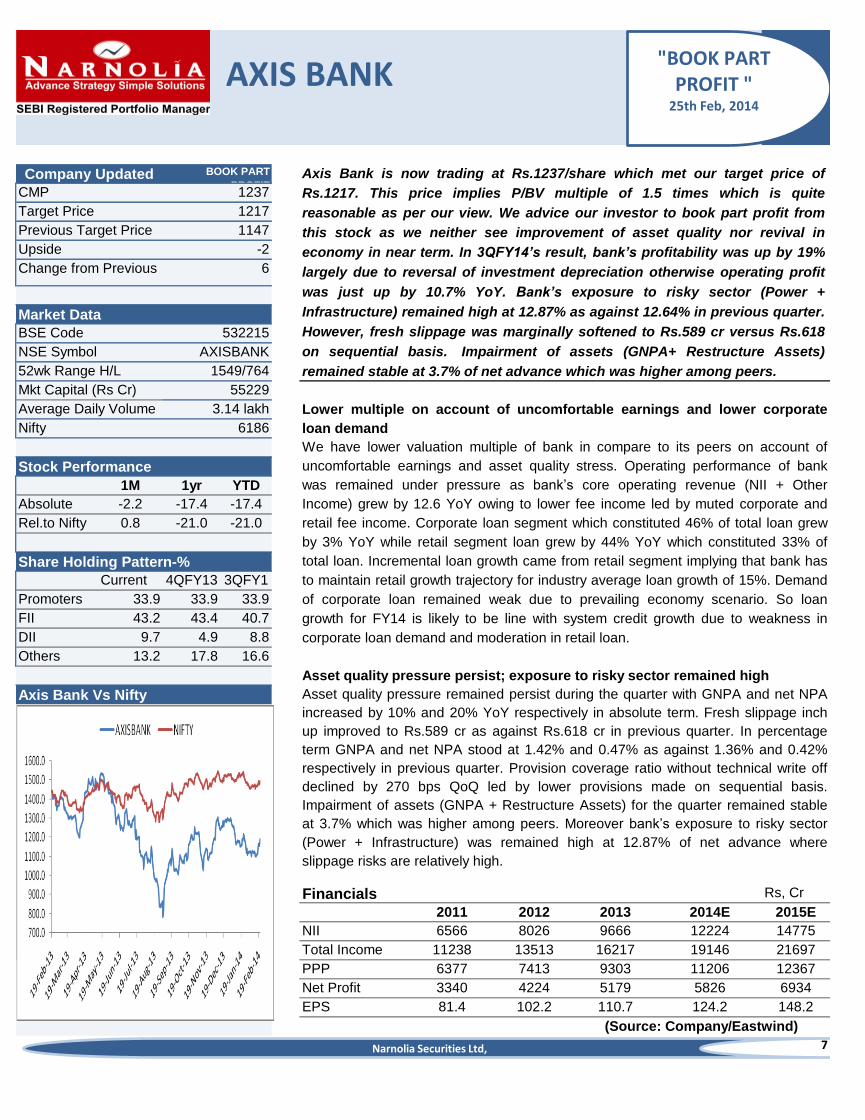
Axis Bank is now trading at Rs.1237/share which met our target price of
Rs.1217. This price implies P/BV multiple of 1.5 times which is quite
reasonable as per our view. We advice our investor to book part profit from
this stock as we neither see improvement of asset quality nor revival in
economy in near term. In 3QFY14’s result, bank’s profitability was up by 19%
largely due to reversal of investment depreciation otherwise operating profit
was just up by 10.7% YoY. Bank’s exposure to risky sector (Power +
Infrastructure) remained high at 12.87% as against 12.64% in previous quarter.
However, fresh slippage was marginally softened to Rs.589 cr versus Rs.618
on sequential basis. Impairment of assets (GNPA+ Restructure Assets)
remained stable at 3.7% of net advance which was higher among peers.
Previous Target Price
AXISBANK
52wk Range H/L
Upside
1549/764
BSE Code 532215
NSE Symbol
Change from Previous
Axis Bank Vs Nifty
Share Holding Pattern-%
3.14 lakh
Nifty 6186
Market Data
55229Mkt Capital (Rs Cr)
(Source: Company/Eastwind)
Stock Performance
Average Daily Volume
Asset quality pressure remained persist during the quarter with GNPA and net NPA
increased by 10% and 20% YoY respectively in absolute term. Fresh slippage inch
up improved to Rs.589 cr as against Rs.618 cr in previous quarter. In percentage
term GNPA and net NPA stood at 1.42% and 0.47% as against 1.36% and 0.42%
respectively in previous quarter. Provision coverage ratio without technical write off
declined by 270 bps QoQ led by lower provisions made on sequential basis.
Impairment of assets (GNPA + Restructure Assets) for the quarter remained stable
at 3.7% which was higher among peers. Moreover bank’s exposure to risky sector
(Power + Infrastructure) was remained high at 12.87% of net advance where
slippage risks are relatively high.
Lower multiple on account of uncomfortable earnings and lower corporate
loan demand
We have lower valuation multiple of bank in compare to its peers on account of
uncomfortable earnings and asset quality stress. Operating performance of bank
was remained under pressure as bank’s core operating revenue (NII + Other
Income) grew by 12.6 YoY owing to lower fee income led by muted corporate and
retail fee income. Corporate loan segment which constituted 46% of total loan grew
by 3% YoY while retail segment loan grew by 44% YoY which constituted 33% of
total loan. Incremental loan growth came from retail segment implying that bank has
to maintain retail growth trajectory for industry average loan growth of 15%. Demand
of corporate loan remained weak due to prevailing economy scenario. So loan
growth for FY14 is likely to be line with system credit growth due to weakness in
corporate loan demand and moderation in retail loan.
Asset quality pressure persist; exposure to risky sector remained high
"BOOK PART PROFIT "
25th Feb, 2014
Narnolia Securities Ltd,
8
AXIS BANK
Please refer to the Disclaimers at the end of this Report.
Bank’s profitability was up by 19% due to reversal of investment depreciation. Overall
provisions and contingencies were lower by 71% QoQ which led PBT growth of 22%
YoY. At operating profit level, bank grew by 10.7% YoY which was lower among peers
(HDFC Bank 29 YoY, ICICI bank 28.6%). Bank’s NII grew by 19.6% YoY largely due to
margin expansion of 14 bps YoY which was supported by low cost deposits franchise.
Core operating revenue (NII+ other income) grew 12.6% owing to muted other income
growth of 1.8% YoY.
Valuation & View
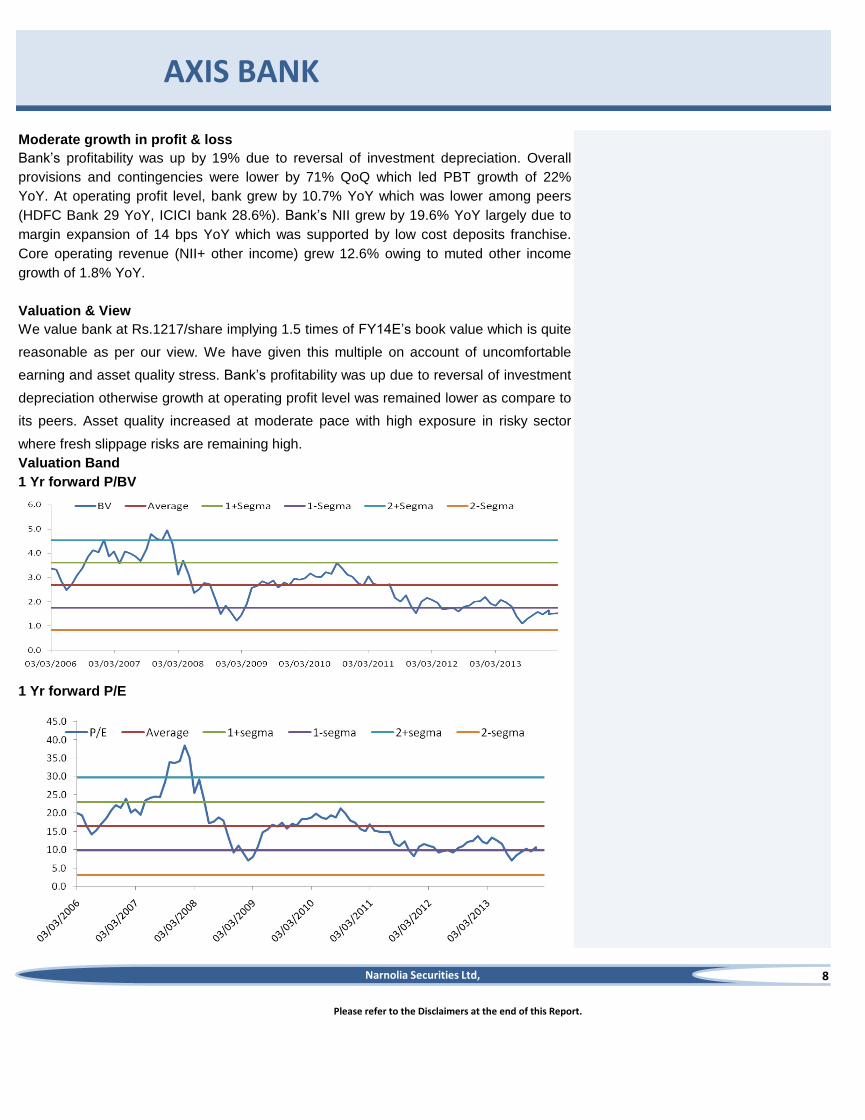
We value bank at Rs.1217/share implying 1.5 times of FY14E’s book value which is quite
reasonable as per our view. We have given this multiple on account of uncomfortable
earning and asset quality stress. Bank’s profitability was up due to reversal of investment
depreciation otherwise growth at operating profit level was remained lower as compare to
its peers. Asset quality increased at moderate pace with high exposure in risky sector
where fresh slippage risks are remaining high.
1 Yr forward P/BV
Valuation Band
1 Yr forward P/E
Moderate growth in profit & loss
Narnolia Securities Ltd,
9
AXIS BANK
Source: Eastwind/Company
Please refer to the Disclaimers at the end of this Report.
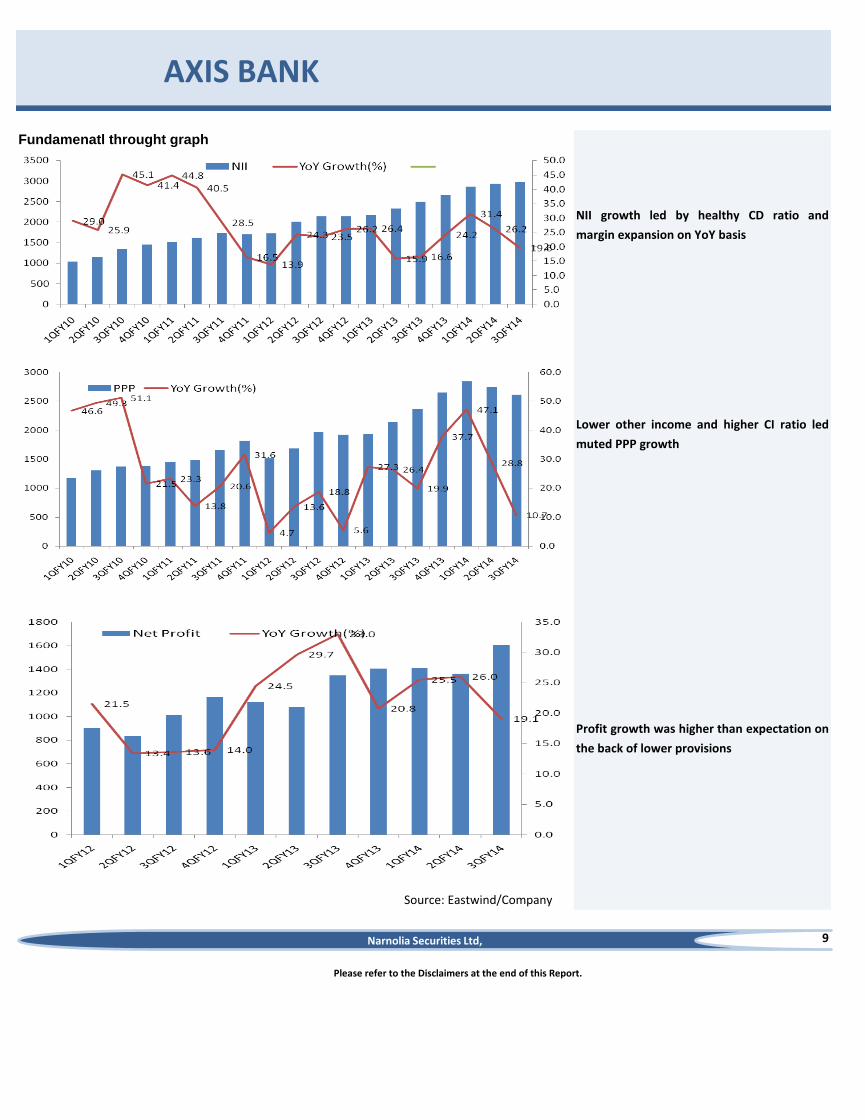
Fundamenatl throught graph
NII growth led by healthy CD ratio and
margin expansion on YoY basis
Lower other income and higher CI ratio led
muted PPP growth
Profit growth was higher than expectation on
the back of lower provisions
Narnolia Securities Ltd,

10
Quarterly Result
AXIS BANK
Source: Eastwind/Company
Please refer to the Disclaimers at the end of this Report.
Narnolia Securities Ltd,
Quarterly Result 3QFY14 2QFY14 3QFY13 % YoY Gr % QoQ Gr 3QFY14E Variation
Interest/discount on advances / bills 5557 5394 4907 13.3 3.0 5748 3.4
Income on investments 2110 2143 2014 4.8 -1.5 2235 5.9
Interest on balances with Reserve Bank of India 49 35 25 97.7 39.4 35 -29.2
Others 73 37 19 277.1 95.6 38 -47.4
Total Interest Income 7789 7609 6965 11.8 2.4 8056 3.4
Others Income 1644 1766 1615 1.8 -6.9 1774 7.9
Total Income 4628 4703 4110 12.6 -1.6 4780 3.3
Interest Expended 4805 4672 4470 7.5 2.8 5049 5.1
NII 2984 2937 2495 19.6 1.6 3006 0.8
Other Income 1644 1766 1615 1.8 -6.9 1774 7.9
Total Income 4628 4703 4110 12.6 -1.6 4780 3.3
Employee 655 644 615 6.5 1.7 0
Other Expenses 1358 1309 1134 19.8 3.8 0
Operating Expenses 2013 1953 1749 15.1 3.1 2008 -0.3
PPP( Rs Cr) 2615 2750 2362 10.7 -4.9 2772 6.0
Provisions 202 687 387 -47.7 -70.5 752 271.4
PBT 2413 2062 1975 22.2 17.0 2020 -16.3
Tax 808 700 628 28.8 15.5 687 -15.0
Net Profit 1604 1362 1347 19.1 17.7 1333 -16.9
Balance Sheet Date
Net Worth 37649 36224 27027 39.3 3.9 37558 -0.2
Deposits 262398 255365 244501 7.3 2.8 272935 4.0
Loan 211467 201303 179504 17.8 5.0 214892 1.6
Asset qualtiy( Rs Cr)
GNPA 3008 2734 2275 32.2 10.0 -
NPA 1003 838 679 47.8 19.7 -
%GNPA 1.4 1.4 1.3 -
%NPA 0.5 0.4 0.4 -
11
AXIS BANK
FINANCIALS & ASSUPTION
Source: Eastwind/Company
Please refer to the Disclaimers at the end of this Report.
Narnolia Securities Ltd,
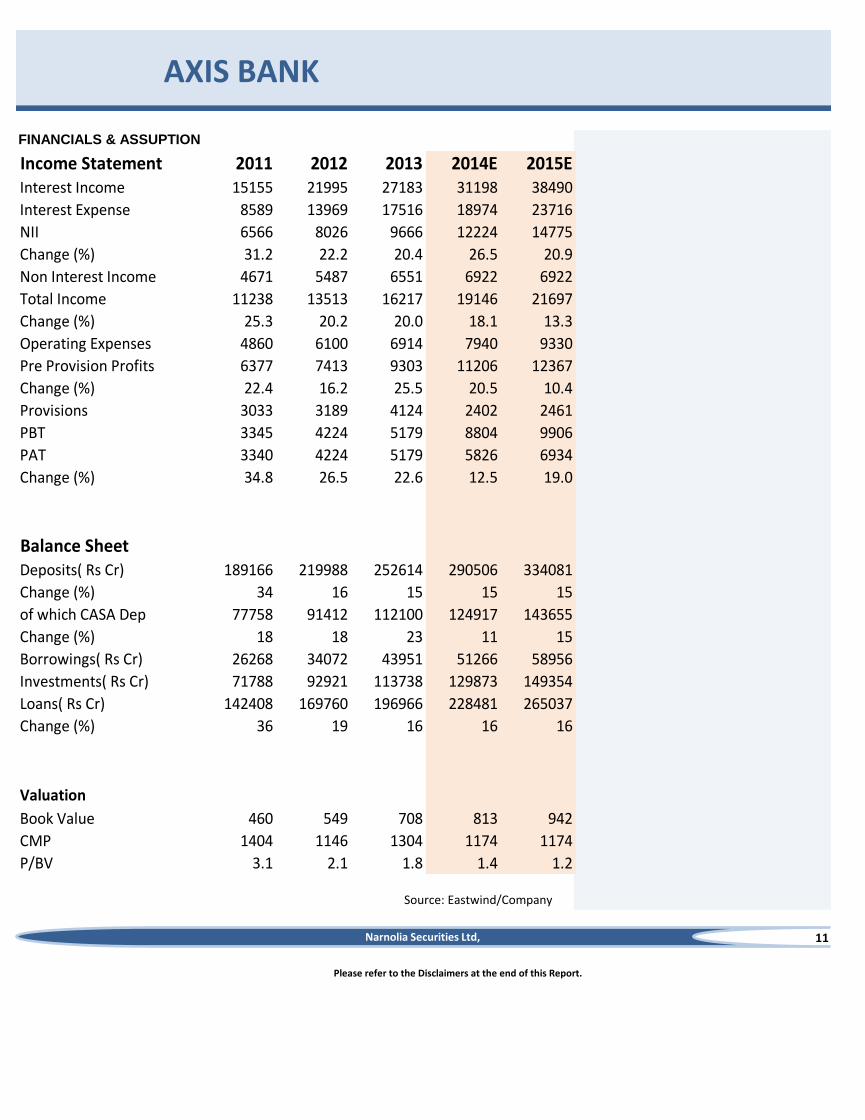
Income Statement 2011 2012 2013 2014E 2015EInterest Income 15155 21995 27183 31198 38490
Interest Expense 8589 13969 17516 18974 23716
NII 6566 8026 9666 12224 14775
Change (%) 31.2 22.2 20.4 26.5 20.9
Non Interest Income 4671 5487 6551 6922 6922
Total Income 11238 13513 16217 19146 21697
Change (%) 25.3 20.2 20.0 18.1 13.3
Operating Expenses 4860 6100 6914 7940 9330
Pre Provision Profits 6377 7413 9303 11206 12367
Change (%) 22.4 16.2 25.5 20.5 10.4
Provisions 3033 3189 4124 2402 2461
PBT 3345 4224 5179 8804 9906
PAT 3340 4224 5179 5826 6934
Change (%) 34.8 26.5 22.6 12.5 19.0
Balance SheetDeposits( Rs Cr) 189166 219988 252614 290506 334081
Change (%) 34 16 15 15 15
of which CASA Dep 77758 91412 112100 124917 143655
Change (%) 18 18 23 11 15
Borrowings( Rs Cr) 26268 34072 43951 51266 58956
Investments( Rs Cr) 71788 92921 113738 129873 149354
Loans( Rs Cr) 142408 169760 196966 228481 265037
Change (%) 36 19 16 16 16
Valuation
Book Value 460 549 708 813 942
CMP 1404 1146 1304 1174 1174
P/BV 3.1 2.1 1.8 1.4 1.2

Nestle India
5043
-
-
-
-
1M 1yr YTD
Absolute -3.7 10.7 3.4
Rel. to Nifty -1.0 7.4 1.8
Current 3QCY13 2QCY13
Promoters 62.8 62.8 62.8
FII 13.1 12.6 12.6
DII 5.9 6.3 6.2
Others 18.2 18.3 18.5
Financials Rs, Cr
4QCY13 3QCY13 (QoQ)-% 4QCY12 (YoY)-%
Revenue 2262.97 2360 -4.1% 2161.1 4.7%
EBITDA 478.3 503.9 -5.1% 504.1 -5.1%
PAT 287.1 289.6 -0.9% 289.2 -0.7%
EBITDA Margin 21.1% 21.4% (30bps) 23.3% (210bps)
PAT Margin 12.7% 12.3% 40bps 13.4% (70bps)
12
"The nest becomes weaker"
CMP
Market Data
Upside
Weak numbers and showing up margin as well…,
Target Price
Previous Target Price
For CY13, Company posted 9.2% sales growth, hugely impacted by weak consumer
demand and high competitive intensity environment, PAT up by 6%.
Result update NEUTRAL
BSE Code 500790
Change from Previous
View and Valuation: Company’s less aggression on volume growth and the excessive
focus on Margin expansion make us cautious on the stock. At same time, company
believes on expansion of new plant set up by ignoring the dividend payout to
investors. Consistently, its RoE is on downward direction. At a CMP of Rs 5043, stock
trades at 15.9x P/BV of CY14E. We have a “Neutral” view on stock.
1 yr Forward P/B
Share Holding Pattern-%
21590
Nifty 6091
NESTLEIND Management will continue to focus on reinforcing the fundamentals of growth drivers.
Further, improve operational efficiencies, and keep rationalizing its SKUs. They are
very confident of strategy to deliver long-term sustainable profitable growth, despite
the short-term challenges.
Margin dip: During the quarter, company has been efficient to maintain its mark of
margin above than 20%. However, Margin ramp down by 210bps(YOY) to 21.1% because
of inflationary pressure on raw material. There was improvement in raw material cost by
110 bps to 46.1% of adjusted net sales. PAT margin inched down by 70bps(YOY) to
12.7%. For CY13, EBITDA Margin and PAT margin were flat at 22.2% and 13%.
Mix impact on RM Cost: Its top 3 inputs by value are milk and milk products, flour, and
palm oil, which together account for two-thirds of its material cost. Milk and wheat flour
have both seen prices increase, while a weak rupee has affected palm oil prices.
However, other inputs such as green coffee and sugar have seen softer price trends.
Jerk on Potential Market share: Nestle has been enjoying its leadership position (No.1)
in all categories except soups and its positioning in Chocolates, noodles, Coffee has
dominantly been unchallenged. Despite all facts, company has been facing many
challenges over the past one and half years from Cadbury's and Ferrero Rocher in
Chocolate, from HUL and ITC in noodles and from HUL in Coffee (Bru).
Please refer to the Disclaimers at the end of this Report.
(Source: Company/Eastwind)
Stock Performance
For 4QCY13, Nestle Ind reported below numbers than street expectations in all counts,
sales grew by 4.7%(YoY) led by 3.7% domestic growth and 20.9% export growth. Its
domestic sales contribute 94% and exports 6% of sales. While, PAT marginally declined
by 0.7% on YoY basis. The company does not share volume growth numbers, but its
statement did mention that sales rose mainly because of higher prices and product
mix.
Average Daily Volume
Nestlé’s more focus on margin stability could sacrifice its volume. Company’s cash cow
portfolio baby foods becoming weaker because of low ad spend. Now, Mead Jhonson
and Danone are dominating in same segment.
48593Mkt Capital (Rs Cr)
52wk Range H/L 5865/4410
NSE Symbol
"NEUTRAL"24th Feb' 14
Narnolia Securities Ltd,

13
Nestle India
RM inflation outlook appears adverse
and that could impact margins to hold
out.
Domestic revenue growth continues to
be very weak
Sales growth led by 4.7% (YoY) India
growth, contributed by net realization
and volume growth in certain product
categories
Margin-%
Concerns: (1)Continued input cost pressure could impacts its margin, (2) Competitive
intensity impacting its market share adversely, (3) Any adverse impact of inflation on
consumer demand would significantly impact sales and earnings growth assumptions.
Please refer to the Disclaimers at the end of this Report.
Sales and Sales Growth(%)
(Source: Company/Eastwind)
(Source: Company/Eastwind)
(Source: Company/Eastwind)
Domestic and Export sales-(% of Sales)
Catalysts and Concerns;
Catalysts: Nestle plays on “Urban consumption theme” and now urban consumption and
demand are stagnant. Thus, we see steady growth in near term, while we maintain that
Nestle is a great long-term story with excellent quality management, strong leadership
across several categories in the food segment and with brand portfolio, there are several
headwinds, which will keep volume growth muted.
Narnolia Securities Ltd,
14
Please refer to the Disclaimers at the end of this Report.
(Source: Company/Eastwind)
Nestle India
Financials
Narnolia Securities Ltd,
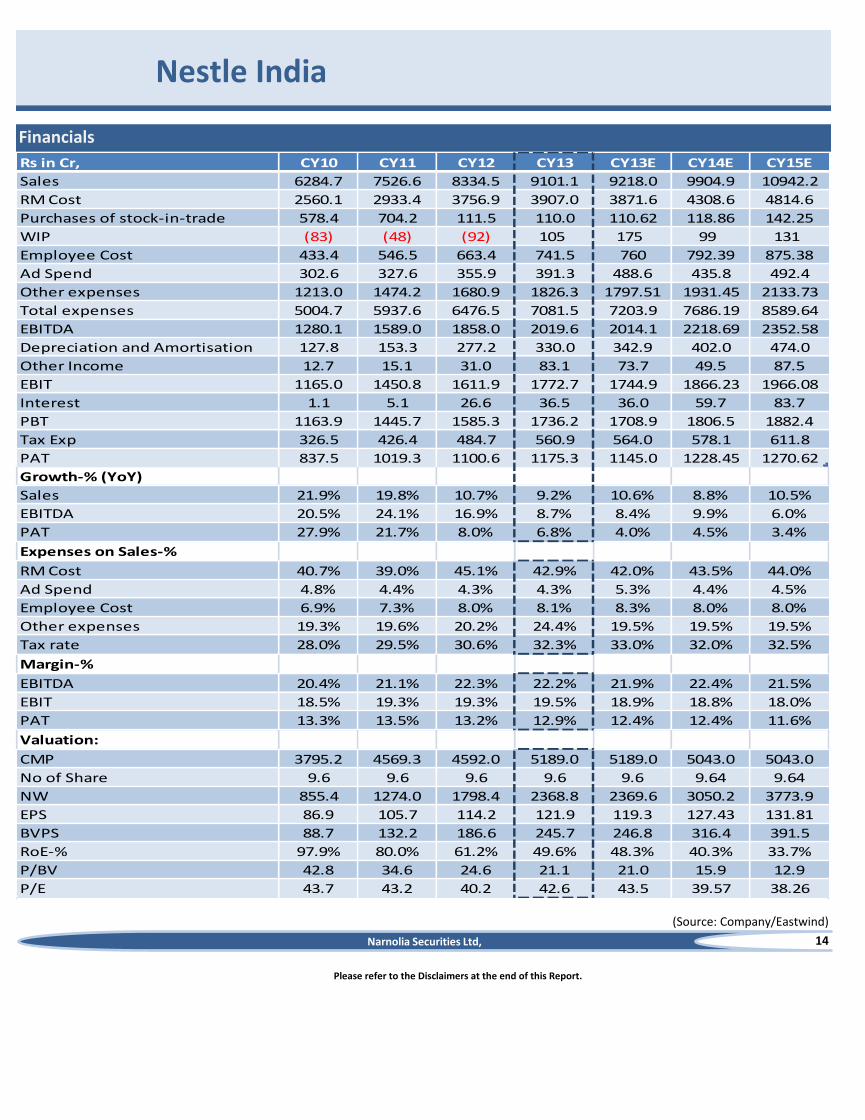
Rs in Cr, CY10 CY11 CY12 CY13 CY13E CY14E CY15E
Sales 6284.7 7526.6 8334.5 9101.1 9218.0 9904.9 10942.2
RM Cost 2560.1 2933.4 3756.9 3907.0 3871.6 4308.6 4814.6
Purchases of stock-in-trade 578.4 704.2 111.5 110.0 110.62 118.86 142.25
WIP (83) (48) (92) 105 175 99 131
Employee Cost 433.4 546.5 663.4 741.5 760 792.39 875.38
Ad Spend 302.6 327.6 355.9 391.3 488.6 435.8 492.4
Other expenses 1213.0 1474.2 1680.9 1826.3 1797.51 1931.45 2133.73
Total expenses 5004.7 5937.6 6476.5 7081.5 7203.9 7686.19 8589.64
EBITDA 1280.1 1589.0 1858.0 2019.6 2014.1 2218.69 2352.58
Depreciation and Amortisation 127.8 153.3 277.2 330.0 342.9 402.0 474.0
Other Income 12.7 15.1 31.0 83.1 73.7 49.5 87.5
EBIT 1165.0 1450.8 1611.9 1772.7 1744.9 1866.23 1966.08
Interest 1.1 5.1 26.6 36.5 36.0 59.7 83.7
PBT 1163.9 1445.7 1585.3 1736.2 1708.9 1806.5 1882.4
Tax Exp 326.5 426.4 484.7 560.9 564.0 578.1 611.8
PAT 837.5 1019.3 1100.6 1175.3 1145.0 1228.45 1270.62
Growth-% (YoY)
Sales 21.9% 19.8% 10.7% 9.2% 10.6% 8.8% 10.5%
EBITDA 20.5% 24.1% 16.9% 8.7% 8.4% 9.9% 6.0%
PAT 27.9% 21.7% 8.0% 6.8% 4.0% 4.5% 3.4%
Expenses on Sales-%
RM Cost 40.7% 39.0% 45.1% 42.9% 42.0% 43.5% 44.0%
Ad Spend 4.8% 4.4% 4.3% 4.3% 5.3% 4.4% 4.5%
Employee Cost 6.9% 7.3% 8.0% 8.1% 8.3% 8.0% 8.0%
Other expenses 19.3% 19.6% 20.2% 24.4% 19.5% 19.5% 19.5%
Tax rate 28.0% 29.5% 30.6% 32.3% 33.0% 32.0% 32.5%
Margin-%
EBITDA 20.4% 21.1% 22.3% 22.2% 21.9% 22.4% 21.5%
EBIT 18.5% 19.3% 19.3% 19.5% 18.9% 18.8% 18.0%
PAT 13.3% 13.5% 13.2% 12.9% 12.4% 12.4% 11.6%
Valuation:
CMP 3795.2 4569.3 4592.0 5189.0 5189.0 5043.0 5043.0
No of Share 9.6 9.6 9.6 9.6 9.6 9.64 9.64
NW 855.4 1274.0 1798.4 2368.8 2369.6 3050.2 3773.9
EPS 86.9 105.7 114.2 121.9 119.3 127.43 131.81
BVPS 88.7 132.2 186.6 245.7 246.8 316.4 391.5
RoE-% 97.9% 80.0% 61.2% 49.6% 48.3% 40.3% 33.7%
P/BV 42.8 34.6 24.6 21.1 21.0 15.9 12.9
P/E 43.7 43.2 40.2 42.6 43.5 39.57 38.26
Vardhman Textiles
341
412
NA
21%
NA
502986
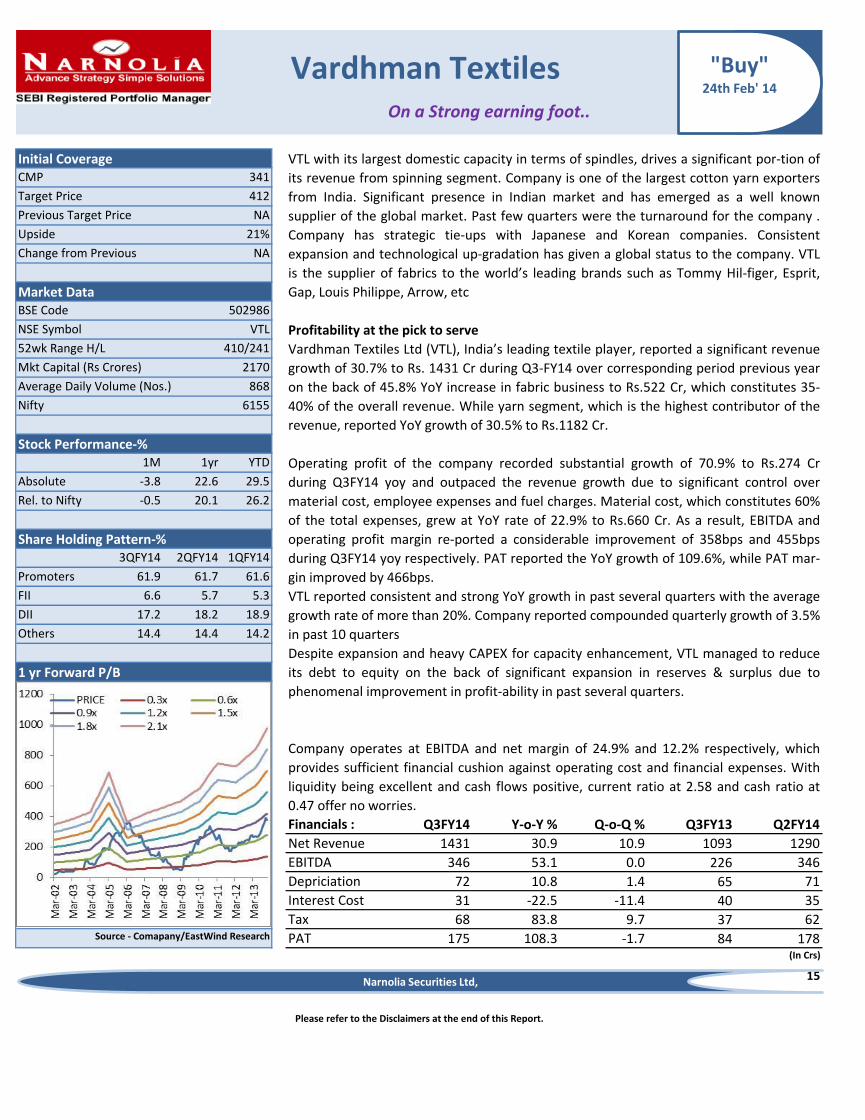
Profitability at the pick to serve
2170
868
6155
1M 1yr YTD
Absolute -3.8 22.6 29.5
Rel. to Nifty -0.5 20.1 26.2
3QFY14 2QFY14 1QFY14
Promoters 61.9 61.7 61.6
FII 6.6 5.7 5.3
DII 17.2 18.2 18.9
Others 14.4 14.4 14.2
Financials : Q3FY14 Y-o-Y % Q-o-Q % Q3FY13 Q2FY14
Net Revenue 1431 30.9 10.9 1093 1290
EBITDA 346 53.1 0.0 226 346
Depriciation 72 10.8 1.4 65 71
Interest Cost 31 -22.5 -11.4 40 35
Tax 68 83.8 9.7 37 62
PAT 175 108.3 -1.7 84 178(In Crs)
15
Please refer to the Disclaimers at the end of this Report.
Stock Performance-%
Share Holding Pattern-%
1 yr Forward P/B
Source - Comapany/EastWind Research
Operating profit of the company recorded substantial growth of 70.9% to Rs.274 Cr
during Q3FY14 yoy and outpaced the revenue growth due to significant control over
material cost, employee expenses and fuel charges. Material cost, which constitutes 60%
of the total expenses, grew at YoY rate of 22.9% to Rs.660 Cr. As a result, EBITDA and
operating profit margin re-ported a considerable improvement of 358bps and 455bps
during Q3FY14 yoy respectively. PAT reported the YoY growth of 109.6%, while PAT mar-
gin improved by 466bps.
VTL reported consistent and strong YoY growth in past several quarters with the average
growth rate of more than 20%. Company reported compounded quarterly growth of 3.5%
in past 10 quarters
Despite expansion and heavy CAPEX for capacity enhancement, VTL managed to reduce
its debt to equity on the back of significant expansion in reserves & surplus due to
phenomenal improvement in profit-ability in past several quarters.
Company operates at EBITDA and net margin of 24.9% and 12.2% respectively, which
provides sufficient financial cushion against operating cost and financial expenses. With
liquidity being excellent and cash flows positive, current ratio at 2.58 and cash ratio at
0.47 offer no worries.
Average Daily Volume (Nos.)
NSE Symbol
52wk Range H/L
Mkt Capital (Rs Crores)
410/241
On a Strong earning foot..
VTL with its largest domestic capacity in terms of spindles, drives a significant por-tion of
its revenue from spinning segment. Company is one of the largest cotton yarn exporters
from India. Significant presence in Indian market and has emerged as a well known
supplier of the global market. Past few quarters were the turnaround for the company .
Company has strategic tie-ups with Japanese and Korean companies. Consistent
expansion and technological up-gradation has given a global status to the company. VTL
is the supplier of fabrics to the world’s leading brands such as Tommy Hil-figer, Esprit,
Gap, Louis Philippe, Arrow, etc
Vardhman Textiles Ltd (VTL), India’s leading textile player, reported a significant revenue
growth of 30.7% to Rs. 1431 Cr during Q3-FY14 over corresponding period previous year
on the back of 45.8% YoY increase in fabric business to Rs.522 Cr, which constitutes 35-
40% of the overall revenue. While yarn segment, which is the highest contributor of the
revenue, reported YoY growth of 30.5% to Rs.1182 Cr.
Nifty
Upside
Change from Previous
Initial CoverageCMP
Target Price
Previous Target Price
Market DataBSE Code
VTL
"Buy"24th Feb' 14
Narnolia Securities Ltd,
Advantage India remains for most of FY14E
Business and its strategies
Views and Valuation
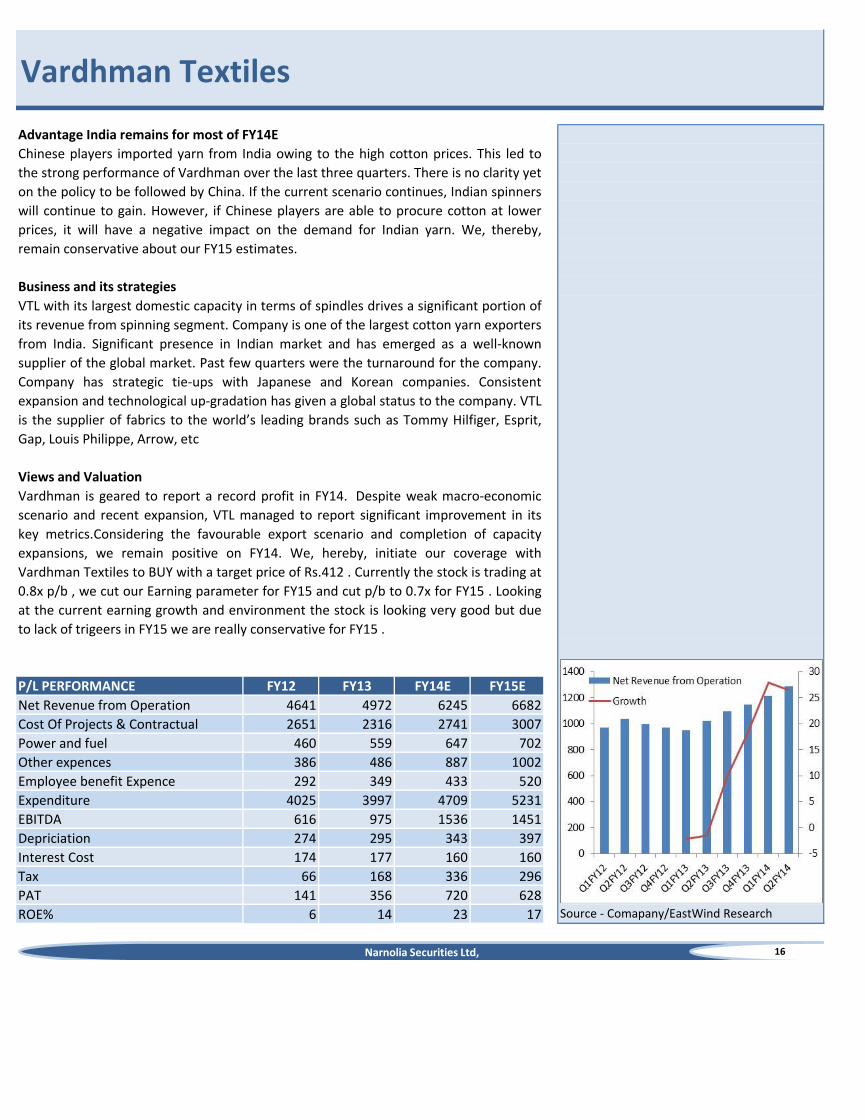
FY12 FY13 FY14E FY15E
4641 4972 6245 6682
2651 2316 2741 3007
460 559 647 702
386 486 887 1002
292 349 433 520
4025 3997 4709 5231
616 975 1536 1451
274 295 343 397
174 177 160 160
66 168 336 296
141 356 720 628
6 14 23 17
16
Source - Comapany/EastWind Research
Depriciation
Interest Cost
Tax
PAT
ROE%
Employee benefit Expence
Expenditure
EBITDA
Vardhman is geared to report a record profit in FY14. Despite weak macro-economic
scenario and recent expansion, VTL managed to report significant improvement in its
key metrics.Considering the favourable export scenario and completion of capacity
expansions, we remain positive on FY14. We, hereby, initiate our coverage with
Vardhman Textiles to BUY with a target price of Rs.412 . Currently the stock is trading at
0.8x p/b , we cut our Earning parameter for FY15 and cut p/b to 0.7x for FY15 . Looking
at the current earning growth and environment the stock is looking very good but due
to lack of trigeers in FY15 we are really conservative for FY15 .
P/L PERFORMANCE
Net Revenue from Operation
Cost Of Projects & Contractual
Power and fuel
Other expences
Vardhman Textiles
VTL with its largest domestic capacity in terms of spindles drives a significant portion of
its revenue from spinning segment. Company is one of the largest cotton yarn exporters
from India. Significant presence in Indian market and has emerged as a well-known
supplier of the global market. Past few quarters were the turnaround for the company.
Company has strategic tie-ups with Japanese and Korean companies. Consistent
expansion and technological up-gradation has given a global status to the company. VTL
is the supplier of fabrics to the world’s leading brands such as Tommy Hilfiger, Esprit,
Gap, Louis Philippe, Arrow, etc
Chinese players imported yarn from India owing to the high cotton prices. This led to
the strong performance of Vardhman over the last three quarters. There is no clarity yet
on the policy to be followed by China. If the current scenario continues, Indian spinners
will continue to gain. However, if Chinese players are able to procure cotton at lower
prices, it will have a negative impact on the demand for Indian yarn. We, thereby,
remain conservative about our FY15 estimates.
Narnolia Securities Ltd,

FY10 FY11 FY12 FY13
57 63 63 63
1548 2202 2144 2444
1604 2264 2207 2506
2346 2925 2044 2100
297 20 505 778
3 3 5 6
87 123 116 84
26 30 48 64
5077 6103 5967 6789
0 0 18 22
2553 2534 2557 2679
45 156 185 213
77 111 92 147
1297 1933 1535 1784
476 667 630 746
262 71 84 65
272 395 326 475
5077 6103 5967 6789
FY10 FY11 FY12 FY13
1.0 0.7 0.6 0.7
45.3 82.5 22.2 56.0
14.2 15.1 13.6 15.0
2.6 2.8 2.5 1.7
3.9 4.4 3.3 3.6
FY10 FY11 FY12 FY13
640 933 576 843
-629 -902 444 -510
11 31 1020 333
-132 -456 -647 -517
10 234 -355 165
-111 -192 18 -19
17
Trading At :
Changes In Working Capital
Net Cash From Operation
Cash From Investment
Cash from Finance
Net Cash Flow during year
Debtor to Turnover%
Creditors to Turnover%
Inventories to Turnover%
Source - Comapany/EastWind Research
CASH FLOWS
B/S PERFORMANCE
Share capital
Reserve & Surplus
Total equity
Long-term borrowings
Short-term borrowings
Long-term provisions
Cash from Operation
Short-term loans and advances
Total Assets
RATIOS
P/B
EPS
Source - Comapany/EastWind Research
Vardhman Textiles
Trade payables
Short-term provisions
Tangible assets
Capital work-in-progress
Long-term loans and advances
Inventories
Total liabilities
Intangibles
Cash and bank balances
Trade receivables
Narnolia Securities Ltd,

51.55
57
55
11
-
1M 1yr YTD
Absolute -13.6 -50.3 -50.3
Rel.to Nifty -10.7 -53.9 -53.9
Current 4QFY13 3QFY1
3Promoters 66.6 55.2 55.2
FII 7.9 8.6 16.5
DII 4.9 7.3 8.1
Others 20.7 28.9 20.2
Financials Rs, Cr
2011 2012 2013 2014E 2015E
NII 1763 2101 2383 2551 3538
Total Income 2297 2683 3039 3410 4397
PPP 1224 1528 1739 1808 1627
Net Profit 612 803 810 445 502
EPS 18.3 22.9 23.2 9.5 10.7
18
DENA BANK
Provision and contingencies were up on the back of deteriorating asset quality
Higher operating expenses led negative growth in PPP
Operating expenses during quarter was higher at 32.5% YoY which escalated cost
income ratio to 63.4% versus 51.4% in last year. Bank’s employee cost and other
operating expenses both surged to 33% and 32% YoY respectively. This had make
down operating profit to Rs.371 cr (down by 16.3% YoY) versus Rs.443 cr in last
quarter and Rs.371 cr in previous quarter.
NII grew at moderate pace owing to margin compression on Y-o-Y
Dena bank reported very weak set of numbers during quarter with NII grew by 7.5%
YoY to Rs.661 cr largely due to margin compression in year on year basis led by
higher cost of fund than fund yield. Higher cost of fund was due to 208 bps declined
in low cost franchise deposits. Other income was lower at 10.7% YoY to Rs.129 cr
versus Rs.144 cr in previous quarter. Total income was moderate at 4% YoY growth.
NEUTRAL
ANNUAL REPORT UPDATE
Target Price
Bank’s performance was lower than street expectation and disappointed in
most of operating metrics. GNPA remain high at 2.96% while net NPA were
1.97%. Provision coverage ratio (without technical write off) improved slightly
on sequential basis. Valuation wise, stock is trading at 0.4 times of one year
forward book which is quite reasonable. But looking at growth and operating
metrics, we believe bank would be trade in the range of 0.3 to 0.4 times of one
year forward book. We have neutral view on the stock with price target of
Rs.57.
Previous Target Price
Upside
52wk Range H/L
532121
NSE Symbol DENABANK
Result update
CMP
Change from Previous
DENA Bank Vs Nifty
Share Holding Pattern-%
1.16 lakh
Nifty 6155
Average Daily Volume
1809
Market Data
103/42
BSE Code
Mkt Capital (Rs Cr)
Please refer to the Disclaimers at the end of this Report.
(Source: Company/Eastwind)
Stock Performance
Provisions and contingencies were up by 44% QoQ on the back of deteriorating
asset quality. In absolute term gross NPA and net NPA both increased by 5% YoY
each. In percentage term GNPA and net NPA stood at 2.96% and 1.97 versus
3.04% and 2.02% in previous quarter. Cumulative provision was up by 4.7% which
slightly improved provisions coverage ratio without technical write off to 33.4% from
33.5% in 2QFY14. Dena Bank's Capital Adequacy Ratio as per Basel III norms stood
at 10.61% as against 10.21% in previous quarter.
"NEUTRAL"24th Feb, 2014
Narnolia Securities Ltd,

19
DENA BANK
Please refer to the Disclaimers at the end of this Report.
Valuation & View
Bank’s performance was lower than street expectation and disappointed in most of
operating metrics. GNPA remain high at 2.96% while net NPA were 1.97%. Provision
coverage ratio (without technical write off) improved slightly on sequential basis.
Valuation wise, stock is trading at 0.4 times of one year forward book which is quite
reasonable. But looking at growth and operating metrics, we believe bank would be trade
in the range of 0.3 to 0.4 times of one year forward book. We have neutral view on the
stock with price target of Rs.57.
Profitability declined despite of tax reversal
Profitability declined by 67% YoY due to reversal of tax to the tune of Rs. 79 cr as against
reversal of Rs.73 cr in previous quarter. At PBT level, bank was negative at Rs.12 cr
which was highly discouraging. This was basically due to moderate NII growth, higher
operating expenses and higher provisions.
Sequentially margin improved on the back of stable loan yield and slightly
increased of cost of deposits
NIM improved by 10 bps sequentially on the back of higher yield on advance than cost of
deposits. During quarter, bank’s yield on advances remained flat at 11.6% while yield on
investment improved by 4 bps QoQ to 7.6%. Cost of deposits increased by 5 bps QoQ to
7.6%. Going forward, management guided NIM at the range of 2.75% to 3%.
Deposits growth faster than loan growth
On balance sheet growth front, bank’s deposits grew by 13.2% YoY led by term deposits
which grew by 17% YoY. Current account deposits de-grew by 5% YoY while saving
account deposits grew by 9% YoY. Overall CASA ratio de-grew by 208 bps to 29%.
Bank’s loan grew by 11% YoY aided by agriculture and MSME segment which was grown
by 30.7% and 25.4% YoY respectively. Retail advance grew by moderate at 14.4% YoY.
Management guided loan growth of 15-17% for FY14. We model 15% loan growth and
6% deposits growth for FY14.
Narnolia Securities Ltd,

20
DENA BANK
Source: Eastwind/Company
Please refer to the Disclaimers at the end of this Report.
NII grew by 7.5% YoY to Rs.661 cr largely due
to margin compression in year on year basis
led by higher cost of fund than fund yield.
Higher operating expenses led negative
growth in PPP
Profitability declined by 67% YoY due to
reversal of tax to the tune of Rs. 79 cr as
against reversal of Rs.73 cr in previous
quarter.
Narnolia Securities Ltd,

21
DENA BANK
Source: Eastwind/Company
Please refer to the Disclaimers at the end of this Report.
Narnolia Securities Ltd,
Quarterly Result ( Rs Cr) 3QFY14 2QFY14 3QFY13 % YoY Gr % QoQ Gr 3QFY14EVariation(%)
Interest/discount on advances / bills 1848 1790 1742 6.1 3.2 1931 -4.3
Income on investments 654 644 519 26.0 1.4 666 -1.9
Interest on balances with Reserve Bank of India 3 9 3 -1.5 -70.1 9 -72.2
Others 30 7 0 7541.0 303.8 4 707.6
Total Interest Income 2534 2450 2264 11.9 3.4 2610 -2.9
Others Income 129 150 144 -10.7 -13.9 150 -14.0
Total Income 2663 2600 2408 10.6 2.4 2760 -3.5
Interest Expended 1873 1825 1649 13.6 2.6 1926 -2.8
NII 661 625 615 7.5 5.7 684 -3.3
Other Income 129 150 144 -10.7 -13.9 150 -14.0
Total Income 790 775 759 4.0 1.9 834 -5.3
Employee 255 251 192 32.8 1.6 225 13.4
Other Expenses 164 154 124 32.1 6.1 150 9.2
Operating Expenses 419 406 316 32.5 3.3 375 11.7
PPP( Rs Cr) 371 369 443 -16.3 0.4 458 -19.1
Provisions( Incl. tax provision) 382 335 157 144.2 14.1 351 8.9
PBT -12 34 286 -104.1 -134.2 107 -110.9
Tax -79 -73 80 -199.3 8.6 21 -470.0
Net Profit 68 107 206 -67.2 -36.9 86 -21.1
Balance Sheet Data (Rs Cr)
Deposits 96081 93669 84882
Saving Accounts 21983 21476 20216
Current Accounts 5786 5695 6083
Loan 69895 64785 63040
Asset Quality
GNPA (Rs Cr) 2066 1968 1317
NPA (Rs Cr) 1375 1309 817
GNPA(%) 2.96 3.04 2.09
NPA(%) 1.97 2.02 1.30
PCR(%) (Without technical writeoff) 33 34 38

22
DENA BANK
Source: Eastwind/Company
Please refer to the Disclaimers at the end of this Report.
Narnolia Securities Ltd,
P/L 2011 2012 2013 2014E 2015EInterest/discount on advances / bills 3820 5161 6819 7421 8737
Income on investments 1193 1544 2019 2536 2307
Interest on balances with Reserve Bank of India 16 38 31 28 28
Others 4 51 30 50 50
Total Interest Income 5034 6794 8899 10035 11122
Others Income 534 582 655 859 859
Total Income 5567 7376 9555 10894 11981
Interest on deposits 3117 4528 6234 6583 7242
Interest on RBI/Inter bank borrowings 8 18 59 0 0
Others 145 147 223 228 342
Interest Expended 3270 4693 6516 7484 7583
NII 1763 2101 2383 2551 3538
NII Growth(%) 60.3 19.1 13.4 7.1 38.7
Other Income 534 582 655 859 859
Total Income 2297 2683 3039 3410 4397
Employee 688 715 792 978 1690
Other Expenses 385 440 508 625 1080
Operating Expenses 1073 1155 1300 1603 2770
PPP( Rs Cr) 1224 1528 1739 1808 1627
Provisions 612 725 706 1308 1000
Net Profit 612 803 810 445 502
Key Balance sheet dataDeposits 64210 77167 97207 102068 112274
Deposits Growth(%) 25.1 20.2 26.0 5.0 10.0
Borrowings 1692 3881 8414 6515 9763
Borrowings Growth(%) 8.3 129.4 116.8 -22.6 49.9
Loan 44828 56693 65781 72359 83213
Loan Growth(%) 26.4 26.5 16.0 10.0 15.0
Investments 18769 23028 34343 34203 38442
Investments Growth(%) 19.6 22.7 49.1 -0.4 12.4
Eastwind CalculationYield on Advances 8.5 9.1 10.4 10.5 10.5
Yield on Investments 6.4 6.7 5.9 7.4 6.0
Yield on Funds 7.4 8.0 8.1 9.4 9.1
Cost of deposits 4.9 5.9 6.4 6.5 6.5
Cost of Borrowings 9.0 4.2 3.4 3.4 3.5
Cost of fund 5.0 5.8 6.2 6.9 6.2
BANKBARODA
513
624
-
22
1M 1yr YTD
Absolute -18.8 -32.4 -32.4
Rel.to Nifty -15.3 -35.7 -35.7
Current 4QFY13 3QFY1
3Promoters 55.4 55.4 55.4
FII 15.5 15.5 15.3
DII 19.6 19.6 19.0
Others 9.5 9.5 10.3
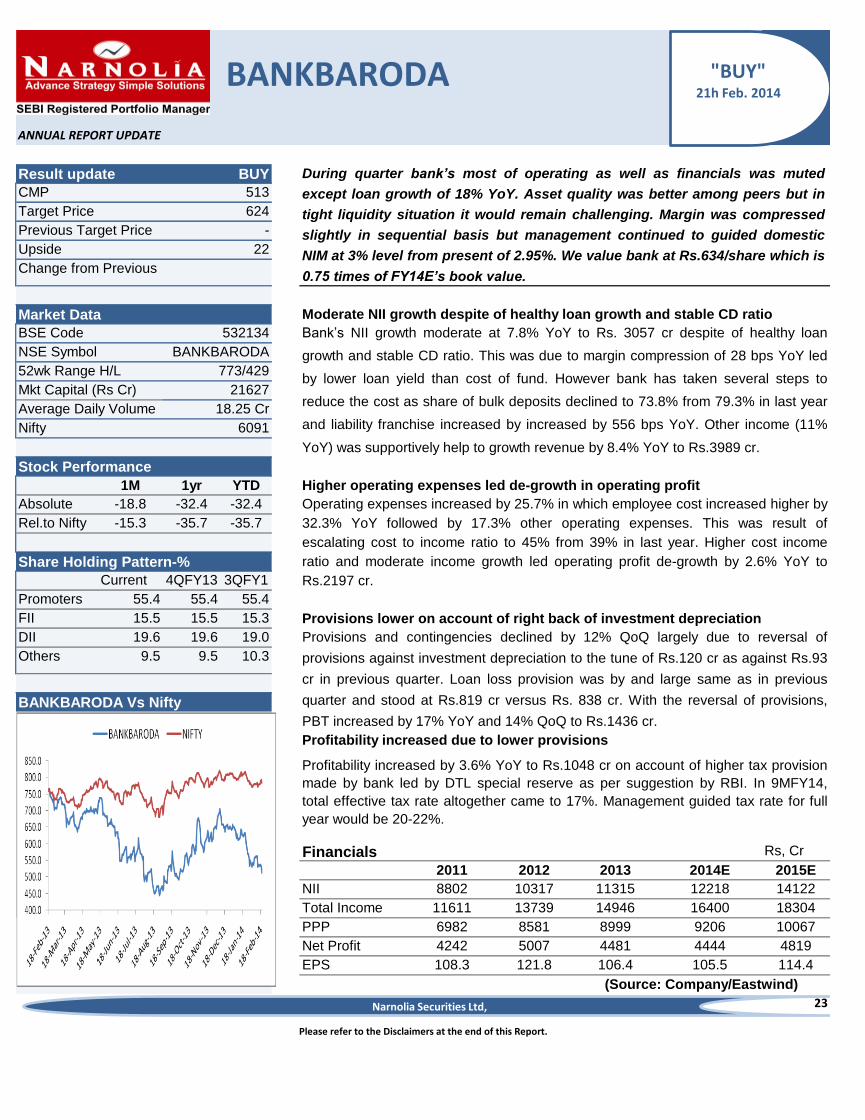
Financials Rs, Cr
2011 2012 2013 2014E 2015E
NII 8802 10317 11315 12218 14122
Total Income 11611 13739 14946 16400 18304
PPP 6982 8581 8999 9206 10067
Net Profit 4242 5007 4481 4444 4819
EPS 108.3 121.8 106.4 105.5 114.4
23
Please refer to the Disclaimers at the end of this Report.
(Source: Company/Eastwind)
Stock Performance
Average Daily Volume
Profitability increased by 3.6% YoY to Rs.1048 cr on account of higher tax provision
made by bank led by DTL special reserve as per suggestion by RBI. In 9MFY14,
total effective tax rate altogether came to 17%. Management guided tax rate for full
year would be 20-22%.
Higher operating expenses led de-growth in operating profit
Operating expenses increased by 25.7% in which employee cost increased higher by
32.3% YoY followed by 17.3% other operating expenses. This was result of
escalating cost to income ratio to 45% from 39% in last year. Higher cost income
ratio and moderate income growth led operating profit de-growth by 2.6% YoY to
Rs.2197 cr.
Provisions lower on account of right back of investment depreciation
Provisions and contingencies declined by 12% QoQ largely due to reversal of
provisions against investment depreciation to the tune of Rs.120 cr as against Rs.93
cr in previous quarter. Loan loss provision was by and large same as in previous
quarter and stood at Rs.819 cr versus Rs. 838 cr. With the reversal of provisions,
PBT increased by 17% YoY and 14% QoQ to Rs.1436 cr.
Profitability increased due to lower provisions
BANKBARODA Vs Nifty
Share Holding Pattern-%
18.25 Cr
Nifty 6091
Moderate NII growth despite of healthy loan growth and stable CD ratio
Bank’s NII growth moderate at 7.8% YoY to Rs. 3057 cr despite of healthy loan
growth and stable CD ratio. This was due to margin compression of 28 bps YoY led
by lower loan yield than cost of fund. However bank has taken several steps to
reduce the cost as share of bulk deposits declined to 73.8% from 79.3% in last year
and liability franchise increased by increased by 556 bps YoY. Other income (11%
YoY) was supportively help to growth revenue by 8.4% YoY to Rs.3989 cr.
52wk Range H/L
Mkt Capital (Rs Cr)
Market Data
773/429
BSE Code 532134
NSE Symbol BANKBARODA
21627
CMP
ANNUAL REPORT UPDATE
Target Price
Previous Target Price
During quarter bank’s most of operating as well as financials was muted
except loan growth of 18% YoY. Asset quality was better among peers but in
tight liquidity situation it would remain challenging. Margin was compressed
slightly in sequential basis but management continued to guided domestic
NIM at 3% level from present of 2.95%. We value bank at Rs.634/share which is
0.75 times of FY14E’s book value.
Result update BUY
Upside
Change from Previous
"BUY"21h Feb. 2014
Narnolia Securities Ltd,

24
BANKBARODA
Please refer to the Disclaimers at the end of this Report.
Asset quality by and large stable, PCR increased
On asset quality front, bank’s gross NPA increased by 10% YoY and net NPA
deteriorated by 5% in absolute term led by higher provision in balance sheet. In
percentage term, GNPA and net NPA stood at 3.4% and 1.9% versus 3.2% and 1.9% in
previous quarter. Provisions coverage ratio without technical write off was improved by
246 bps QoQ to 44.5%. Bank’s asset quality was better than among peers under our
coverage universe.
Margin compression on account of higher cost of fund than fund yield
Valuation & View
During quarter bank’s most of operating as well as financials was muted except loan
growth of 18% YoY. Asset quality was better among peers but in tight liquidity situation it
would remain challenging. Margin was compressed slightly in sequential basis but
management continued to guided domestic NIM at 3% level from present of 2.95%. We
value bank at Rs.634/share which is 0.75 times of FY14E’s book value.
NIM compressed by 5 bps QoQ to 2.37% due to stable loan yield while cost of fund
increased marginally by 10 bps to 5.4%. Bank has taken several steps to curtail cost by
reducing share of bulk deposits and increasing CASA ratio. Domestic NIM improved to
2.95% versus 2.85% in previous quarter whereas oversea NIM remained flat at 1.18% as
against 1.19%. Domestic NIM improvement was on account of higher investment yield to
7.98% from 7.9% on sequential basis.
Loan growth healthy led by SME and retail
Overall deposits de-grew by 4% YoY led by 10% declined of term deposits on year on
year basis. Current account and saving account deposits registered growth of 19% and
13% YoY respectively. This was the result of CASA ratio increased by 556 bps YoY to
26.2%. Loan grew by 18% YoY led by SME growth of 39.2% YoY followed by 21% YoY
growth retail. Corporate loan growth remained intact as bank’s has caution outlook
towards corporate exposure in tight economy scenario.
Narnolia Securities Ltd,22

25
BANKBARODA
Source: eastwind/Company
Please refer to the Disclaimers at the end of this Report.
Bank’s NII growth moderate at 7.8% YoY to Rs.
3057 cr despite of healthy loan growth and
stable CD ratio. This was due to margin
compression of 28 bps YoY led by lower loan
yield than cost of fund
Higher operating expenses led de-growth in
operating profit
Profitability increased due to lower provisions
Narnolia Securities Ltd,

26
BANKBARODA
Source: Eastwind/Company
Please refer to the Disclaimers at the end of this Report.
Narnolia Securities Ltd,
Quarterly Result (Rs Cr) 3QFY14 2QFY14 3QFY13 % YoY Gr % QoQ Gr 3QFY14E
Interest/discount on advances / bills 7061 6832 6485 8.9 3.3 7173
Income on investments 2175 2220 1898 14.6 -2.0 2350
Interest on balances with Reserve Bank of India 245 281 403 -39.2 -12.8 397
Others 209 140 58 258.2 50.1 173
Total Interest Income 9691 9473 8845 9.6 2.3 10092
Others Income 932 974 841 10.9 -4.3 1102
Total Income 10623 10447 9686 9.7 1.7 11194
Interest Expended 6634 6579 6004 10.5 0.8 6792
NII 3057 2895 2841 7.6 5.6 3300
Other Income 932 974 841 10.9 -4.3 1102
Total Income 3989 3869 3681 8.4 3.1 4402
Employee 1056 1030 798 32.3 2.5 1189
Other Expenses 736 714 627 17.3 3.1 792
Operating Expenses 1792 1744 1426 25.7 2.7 1981
PPP( Rs Cr) 2197 2125 2256 -2.6 3.4 2421
Provisions 762 861 1029 -26.0 -11.5 897
Exceptional Items 16 16 12 25.0 0.0 0
PBT 1436 1264 1227 17.0 13.6 1524
Tax 372 80 203 83.7 364.7 457
Net Profit 1048 1168 1012 3.6 -10.3 1067
Balance Sheet Date( Rs Cr)
Equity Capital 423 423 412 2.5 0.0
Reserve & Surplus 35232 35127 30966 13.8 0.3
Net Worth 35654 35549 31379 13.6 0.3
Total Deposits 503772 484931 414733 21.5 3.9
Borrowings 29304 28558 27899 5.0 2.6
Other liabilities and provisions 18638 13995 14552 28.1 33.2
Total Liability 587368 563033 488563 20.2 4.3
Cash in hand 16742 15681 17147 -2.4 6.8
Cash and balances with RBI 87599 79980 58295 50.3 9.5
Total Investment 115210 111840 101848 13.1 3.0
Advances 352446 339855 299318 17.7 3.7
Fixed Assets 2562 2498 2399 6.8 2.6
Others Assets 12809 13179 9557 34.0 -2.8
Total Assets 587368 563033 488563 20.2 4.3
Asset Quality
GNPA( Rs Cr) 11926 10888 7321
NPA(Rs Cr) 6624 6316 3363
% GNPA 3.4 3.2 2.4
% NPA 1.9 1.9 1.1
% PCR (without technical writeoff) 44.5 42.0 54.1
27
BANKBARODA
Source: Eastwind/Company
Please refer to the Disclaimers at the end of this Report.
Narnolia Securities Ltd,
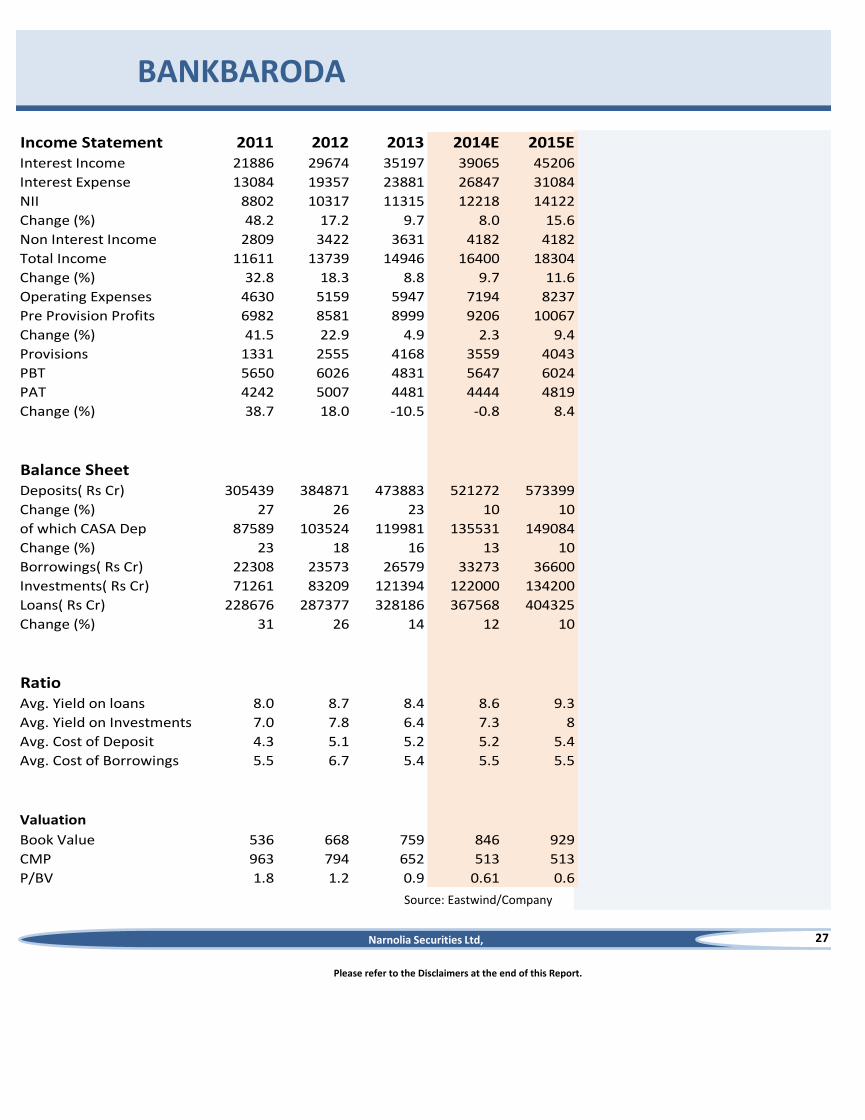
Income Statement 2011 2012 2013 2014E 2015EInterest Income 21886 29674 35197 39065 45206
Interest Expense 13084 19357 23881 26847 31084
NII 8802 10317 11315 12218 14122
Change (%) 48.2 17.2 9.7 8.0 15.6
Non Interest Income 2809 3422 3631 4182 4182
Total Income 11611 13739 14946 16400 18304
Change (%) 32.8 18.3 8.8 9.7 11.6
Operating Expenses 4630 5159 5947 7194 8237
Pre Provision Profits 6982 8581 8999 9206 10067
Change (%) 41.5 22.9 4.9 2.3 9.4
Provisions 1331 2555 4168 3559 4043
PBT 5650 6026 4831 5647 6024
PAT 4242 5007 4481 4444 4819
Change (%) 38.7 18.0 -10.5 -0.8 8.4
Balance SheetDeposits( Rs Cr) 305439 384871 473883 521272 573399
Change (%) 27 26 23 10 10
of which CASA Dep 87589 103524 119981 135531 149084
Change (%) 23 18 16 13 10
Borrowings( Rs Cr) 22308 23573 26579 33273 36600
Investments( Rs Cr) 71261 83209 121394 122000 134200
Loans( Rs Cr) 228676 287377 328186 367568 404325
Change (%) 31 26 14 12 10
RatioAvg. Yield on loans 8.0 8.7 8.4 8.6 9.3
Avg. Yield on Investments 7.0 7.8 6.4 7.3 8
Avg. Cost of Deposit 4.3 5.1 5.2 5.2 5.4
Avg. Cost of Borrowings 5.5 6.7 5.4 5.5 5.5
Valuation
Book Value 536 668 759 846 929
CMP 963 794 652 513 513
P/BV 1.8 1.2 0.9 0.61 0.6

Narnolia Securities Ltd402, 4th floor 7/ 1, Lords Sinha Road Kolkata 700071, Ph
033-32011233 Toll Free no : 1-800-345-4000
email: [email protected],
website : www.narnolia.com
Risk Disclosure & Disclaimer: This report/message is for the personal information of
the authorized recipient and does not construe to be any investment, legal or taxation
advice to you. Narnolia Securities Ltd. (Hereinafter referred as NSL) is not soliciting any
action based upon it. This report/message is not for public distribution and has been
furnished to you solely for your information and should not be reproduced or
redistributed to any other person in any from. The report/message is based upon publicly
available information, findings of our research wing “East wind” & information that we
consider reliable, but we do not represent that it is accurate or complete and we do not
provide any express or implied warranty of any kind, and also these are subject to change
without notice. The recipients of this report should rely on their own investigations,
should use their own judgment for taking any investment decisions keeping in mind that
past performance is not necessarily a guide to future performance & that the the value of
any investment or income are subject to market and other risks. Further it will be safe to
assume that NSL and /or its Group or associate Companies, their Directors, affiliates
and/or employees may have interests/ positions, financial or otherwise, individually or
otherwise in the recommended/mentioned securities/mutual funds/ model funds and
other investment products which may be added or disposed including & other mentioned
in this report/message.