fundamental analysis project on beml
TRANSCRIPT

7/28/2019 fundamental analysis project on beml
http://slidepdf.com/reader/full/fundamental-analysis-project-on-beml 1/71
TABLE CONTENTS
Sl.no TITLE Page no.
1. Introduction to fundamental analysis 6
2. Economic analysis 14
3. Industry analysis 17
4. Company analysis 26
5. Research methodology 33
6. Data analysis 36
Economic 38
Industry 45
Company 52
7. Finding & Limitations 72
8. Conclusion & Suggestion 76
9. Bibliography 80

7/28/2019 fundamental analysis project on beml
http://slidepdf.com/reader/full/fundamental-analysis-project-on-beml 2/71
INTRODUCTION TOFUNDAMENTAL
ANALYSIS[CHAPTER-1]

7/28/2019 fundamental analysis project on beml
http://slidepdf.com/reader/full/fundamental-analysis-project-on-beml 3/71
INTRODUCTION:INDUSTRIAL BACKGROUND:Industries are the pointing light to the growth of an economy and are the backbone of thecountry. The department and growth of a country largely depends on the industrialization of itseconomy.
India is basically an agriculture based country. It is after the independence, India has givenimportance to the growth of the industries through 5 years planning programmer. Governmenthas taken a leading march to upheaval the movement of industrialization.
For any country small or big developed need good infrastructure facilities, are the primaryneed for the transportation or movement of goods, roads play an important role in this aspects.
Tremendous development has taken place in science and technology, which has mechanizedevery work in every field. Manually carried out work is less productive and time consuming.
Foreigners have rules India for many years. And as such, after independence, India has given priority to strengthen the country’s defense force. Several industries producing defenseequipments have been started by the Indian government thereafter. In this view, the ministry of defense has established BEML.
BEML was mainly established to produce defense equipments and heavy capital equipmentslike railways coaches, earth mover machineries, etc.
Two aggressive wars with Pakistan and china have made defense ministry to start one moreunit BEML. It was started in the kolar gold fields, in the year 1964. It is one of the biggest unitsin Asia.
BEML has number of branches all over India. Its various units in different parts of thecountry have immensely contributed to the growth of the economy. It is also earning foreign tothe country. It has emerged as a powerful industrial unit of Indian economy.
India’s heavy earth moving equipments and spare parts manufacturers manufacture variouscapacities ranging from mini version to giant. Overseas manufacturers are also manufacturingthe equipments and spares and exports to our country, hence, providing a stiff competition.
There are four major earth movers and around 500 spare parts manufactures in the country.The four major manufactures are
BEML
L&T- KOMASTUTATA-HITACHI,ESCORTS
Among them BEML is dominating.
The major customers for the above products are coal mines ministry, defense ministry,fleet owners in the construction industry, state government civil engineering and irrigationdepartment and some small individual operator.
7/28/2019 fundamental analysis project on beml
http://slidepdf.com/reader/full/fundamental-analysis-project-on-beml 4/71
THEORETICAL BACKGROUND:
FUNDAMENTAL ANALYSIS:
Fundamental analysis is the examination of the underlying forces that affect the well
being of the economy, industry groups, and companies. As with most analysis, the goal is to
derive a forecast and profit from future price movements. At the company level, fundamental
analysis may involve examination of financial data, management, business concept and
competition. At the industry level, there might be an examination of supply and demand forces
for the products offered. For the national economy, fundamental analysis might focus on
economic data to assess the present and future growth of the economy. To forecast future stock
prices, fundamental analysis combines economic, industry, and company analysis to derive a
stock's current fair value and forecast future value. If fair value is not equal to the current stock
price, fundamental analysts believe that the stock is either over or under valued and the market
price will ultimately gravitate towards fair value. Fundamentalists do not heed the advice of the
random walkers and believe that markets are weak form efficient.
By believing that prices do not accurately reflect all available information, fundamental
analysts look to capitalize on perceived price discrepancies.
STRENGTHS AND WEAKNESS OF FUNDAMENTAL
ANALYSIS
Long-term Trends:
Fundamental analysis is good for long-term investments based on long-term trends, very
long-term. The ability to identify and predict long-term economic, demographic, technological or
consumer trends can benefit patient investors who pick the right industry groups or companies.
Value Spotting:
Sound fundamental analysis will help identify companies that represent good value.
Some of the most legendary investors think long-term and value. Graham and Dodd, Warren

7/28/2019 fundamental analysis project on beml
http://slidepdf.com/reader/full/fundamental-analysis-project-on-beml 5/71
Buffett and John Neff are seen as the champions of value investing. Fundamental analysis can
help uncover companies with valuable assets, a strong balance sheet, stable earnings and staying
power
WEAKNESS
Time Constraints:
Fundamental analysis may offer excellent insights, but it can be extraordinarily time
consuming. Time-consuming models often produce valuations that are contradictory to the
current price.
Industry/Company Specific:
Valuation techniques vary depending on the industry group and specifics of each company. For
this reason, a different technique and model is required for different industries and different
companies. This can get quite time consuming and limit the amount of research that can be
performed.
Subjectivity:
Fair value is based on assumptions. Any changes to growth or multiplier assumptions can
greatly alter the ultimate valuation. Fundamental analysts are generally aware of this and use
sensitivity analysis to present a base-case valuation, a best-case valuation and a worst-case
valuation. However, even on a worst case, most models are almost always bullish, the only
question is how much so.
Analyst Bias:
The majority of the information that goes into the analysis comes from the companyitself. Companies employ investor relations managers specifically to handle the analyst
community and release information.
What is fundamental analysis?
Fundamental Analysis involves examining the economic, financial and other qualitative and
quantitative factors related to a security in order to determine its intrinsic value. It attempts to
7/28/2019 fundamental analysis project on beml
http://slidepdf.com/reader/full/fundamental-analysis-project-on-beml 6/71
study everything that can affect the security's value, including macroeconomic factors (like the
overall economy and industry conditions) and individually specific factors (like the financial
condition and management of companies). Fundamental analysis, which is also known as
quantitative analysis, involves delving into a company’s financial statements (such as profit and
loss account and balance sheet) in order to study various financial indicators (such as revenues,
earnings, liabilities, expenses and assets). Such analysis is usually carried out by analysts,
brokers and savvy investors.
Many analysts and investors focus on a single number--net income (or earnings)--to evaluate
performance. When investors attempt to forecast the market value of a firm, they frequently rely
on earnings. Many institutional investors, analysts and regulators believe earnings are not as
relevant as they once were. Due to nonrecurring events, disparities in measuring risk and
management's ability to disguise fundamental earnings problems, other measures beyond net
income can assist in predicting future firm earnings.
Two Approaches of fundamental analysis:
While carrying out fundamental analysis, investors can use either of the following approaches:
1 .Top-down approach: In this approach, an analyst investigates both international and nationaleconomic indicators, such as GDP growth rates, energy prices, inflation and interest rates.
The Search for the best security then trickles down to the analysis of total sales, price levels andforeign competition in a sector in order to identify the best business in the sector
2. Bottom-up approach: In this approach, an analyst starts the search with specific businesses,irrespective of their industry/region.
How does fundamental analysis works? Fundamental analysis is carried out with the aim of predicting the future performance of a
company. It is based on the theory that the market price of a security tends to move towards its
'real value' or 'intrinsic value.' Thus, the intrinsic value of a security being higher than the
security’s market value represents a time to buy. If the value of the security is lower than its
market price, investors should sell it
The steps involved in fundamental analysis are:
1. Macroeconomic analysis, which involves considering currencies, commodities and indices.
2. Industry sector analysis, which involves the analysis of companies that are a part of the sector.
3. Situational analysis of a company.
4. Financial analysis of the company.
5. Valuation.
The valuation of any security is done through the discounted cash flow (DCF) model, whichtakes into consideration:
7/28/2019 fundamental analysis project on beml
http://slidepdf.com/reader/full/fundamental-analysis-project-on-beml 7/71
1. Dividends received by investors
2. Earnings or cash flows of a company
3. Debt, which is calculated by using the debt to equity ratio and the current ratio (currentassets/current liabilities)
Fundamental Analysis Tools
These are the most popular tools of fundamental analysis.
Earnings per Share – EPS
Price to Earnings Ratio – P/E
Projected Earnings Growth – PEG
Price to Sales – P/S
Price to Book – P/B
Dividend Payout Ratio
Dividend Yield
Book Value
Return on Equity
Ratio analysis
Financial ratios are tools for interpreting financial statements to provide a basis for valuingsecurities and appraising financial and management performance.
A good financial analyst will build in financial ratio calculations extensively in a financialmodeling exercise to enable robust analysis. Financial ratios allow a financial analyst to:
Standardize information from financial statements across multiple financial years to allowcomparison of a firm’s performance over time in a financial model.
Standardize information from financial statements from different companies to allow apples toapples comparison between firms of differing size in a financial model.
Measure key relationships by relating inputs (costs) with outputs (benefits) and facilitatescomparison of these relationships over time and across firms in a financial model.

7/28/2019 fundamental analysis project on beml
http://slidepdf.com/reader/full/fundamental-analysis-project-on-beml 8/71
In general, there are 4 kinds of financial ratios that a financial analyst will use most frequently,these are:
Performance ratios Working capital ratios
Liquidity ratios
Solvency ratios
These 4 financial ratios allow a good financial analyst to quickly and efficiently address thefollowing questions or concerns:
Performance ratios
What return is the company making on its capital investment?What are its profit margins?
Working capital ratios
How quickly are debts paid?
How many times is inventory turned?
Liquidity ratios
Can the company continue to pay its liabilities and debts?
Solvency ratios (Longer term)
What is the level of debt in relation to other assets and to equity?
Is the level of interest payable out of profits?

7/28/2019 fundamental analysis project on beml
http://slidepdf.com/reader/full/fundamental-analysis-project-on-beml 9/71
CHAPTER PLAN
It is proposed to divide the project into following chapters.
CHAPTER 1: INTRODUCTION TO STUDY
This chapter will be introductory in nature covering the relevance of study.
CHAPTER 2: CONCEPTUAL FRAMEWORK OF FUNDAMENTALANALYSIS
This chapter will include a comprehensive study of the concept of Fundamentalanalysis and its tools.
CHAPTER 3: DATA SOURCE AND RESEARCH METHODOLOGY
This chapter will give an inside into source of data and method of undertakingresearch.
CHAPTER 4: DATA ANALYSIS
This is the chapter of all observations, inferences, analysis and conclusions thatwill be made out of the data analysis during the course of study.
CHAPTER 5: LIMITATIONS AND SUGGESTIONS
All the limitations and stumbling blocks that will be encountered during the studywill be discussed in this chapter along with the future scope and suggestions.
BIBLIOGRAPHY

7/28/2019 fundamental analysis project on beml
http://slidepdf.com/reader/full/fundamental-analysis-project-on-beml 10/71
ECONOMIC ANALYSIS[CHAPTER-2]
7/28/2019 fundamental analysis project on beml
http://slidepdf.com/reader/full/fundamental-analysis-project-on-beml 11/71
The economic analysis aims at determining if the economic climate is conclusive and is
capable of encouraging the growth of business sector, especially the capital market. When
the economy expands, most industry groups and companies are expected to benefit and
grow. When the economy declines, most sectors and companies usually face survival
problems. Hence, to predict share prices, an investor has to spend time exploring the forces
operating in overall economy. Exploring the global economy is essential in an international
investment setting. The selection of country for investment has to focus itself to examination
of a national economic scenario. It is important to predict the direction of the national
economy because economic activity affects corporate profits, not necessarily through tax
policies but also through foreign policies and administrative procedures.
Tools for Economy Analysis
The most used tools for performing economic analysis are:
Gross Domestic Product (GDP)
Monetary policy and Liquidity
Inflation
Interest rates
International influences
Fiscal policy
Influences on long term expectations
Influences on short term expectations
1) Gross Domestic product
GDP is one measure of economic activity. This is the total amount of goods and
services produced in a country in a year. It is calculated by adding the market values of all
the final goods and services produced in a year.
It is a gross measurement because it includes the total amount of goods and
services produced, of which some merely replace goods that have depreciated or
have worn out.
It is domestic production because it includes only goods and services producedwithin the country.
7/28/2019 fundamental analysis project on beml
http://slidepdf.com/reader/full/fundamental-analysis-project-on-beml 12/71
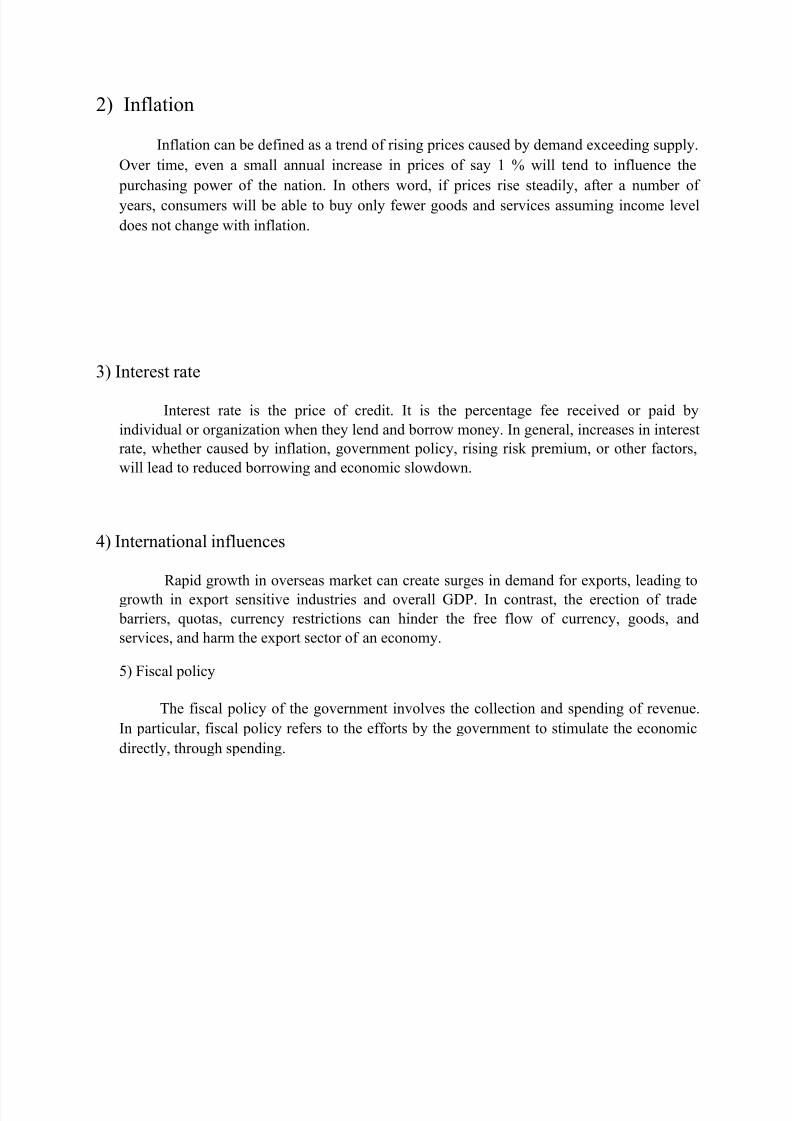
2) Inflation
Inflation can be defined as a trend of rising prices caused by demand exceeding supply.
Over time, even a small annual increase in prices of say 1 % will tend to influence the
purchasing power of the nation. In others word, if prices rise steadily, after a number of
years, consumers will be able to buy only fewer goods and services assuming income level
does not change with inflation.
3) Interest rate
Interest rate is the price of credit. It is the percentage fee received or paid by
individual or organization when they lend and borrow money. In general, increases in interest
rate, whether caused by inflation, government policy, rising risk premium, or other factors,
will lead to reduced borrowing and economic slowdown.
4) International influences
Rapid growth in overseas market can create surges in demand for exports, leading to
growth in export sensitive industries and overall GDP. In contrast, the erection of trade
barriers, quotas, currency restrictions can hinder the free flow of currency, goods, and
services, and harm the export sector of an economy.
5) Fiscal policy
The fiscal policy of the government involves the collection and spending of revenue.
In particular, fiscal policy refers to the efforts by the government to stimulate the economic
directly, through spending.

7/28/2019 fundamental analysis project on beml
http://slidepdf.com/reader/full/fundamental-analysis-project-on-beml 13/71
INDUSTRYANALYSIS
[CHAPTER-3]
‘
7/28/2019 fundamental analysis project on beml
http://slidepdf.com/reader/full/fundamental-analysis-project-on-beml 14/71
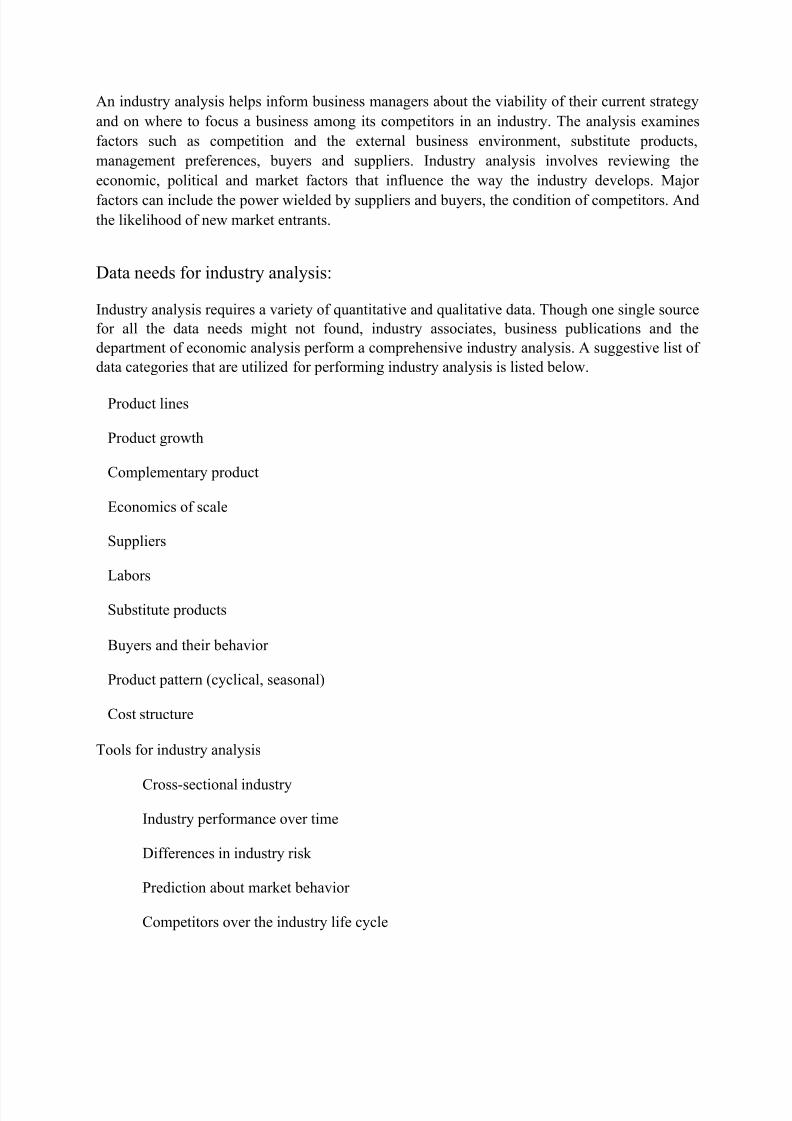
An industry analysis helps inform business managers about the viability of their current strategy
and on where to focus a business among its competitors in an industry. The analysis examines
factors such as competition and the external business environment, substitute products,
management preferences, buyers and suppliers. Industry analysis involves reviewing the
economic, political and market factors that influence the way the industry develops. Major
factors can include the power wielded by suppliers and buyers, the condition of competitors. Andthe likelihood of new market entrants.
Data needs for industry analysis:
Industry analysis requires a variety of quantitative and qualitative data. Though one single source
for all the data needs might not found, industry associates, business publications and the
department of economic analysis perform a comprehensive industry analysis. A suggestive list of
data categories that are utilized for performing industry analysis is listed below.
Product lines
Product growth
Complementary product
Economics of scale
Suppliers
Labors
Substitute products
Buyers and their behavior
Product pattern (cyclical, seasonal)
Cost structure
Tools for industry analysis
Cross-sectional industry
Industry performance over time
Differences in industry risk
Prediction about market behavior
Competitors over the industry life cycle

7/28/2019 fundamental analysis project on beml
http://slidepdf.com/reader/full/fundamental-analysis-project-on-beml 15/71
INDUSTRY PROFILE:
The Indian construction equipment sector has an estimated market size of US$ 2.4 – 2.6 billionfor the year 2012.The industry has been growing due to the large investments made by the government and private
sector infrastructure developments.The prospects of the construction equipment industry look attractive with projected investmentof US$320 billion in the infrastructure sector over the next few years.The imports markets are estimated around US$375 million. Of these, the earthmoving,excavation and hauling equipment categories command around 25%.Imported used equipment, which include high-end hydraulic mobile cranes, excavators, motorsgraders, vibratory compactors comprise a negligible 0.4 per cent of the total constructionequipment market.
SECTOR COMPOSITION AND SIZE:
1. Product consumption constitutes the bulk of the segment with around 56%.2. While the unorganized sector contributes to around 15 percent.3. Unorganized players are more prevalent in the relatively less technology
intensive material handling, material preparation and concrete equipmentsegment.
INDUSTRY STRUCTURE:
India produces the entire range of construction equipment for different
applications. The industry can be broadly classified under the following categories.
Earth moving equipment
Road construction equipment
Material handling equipment
Tunneling and drilling equipment
COMPETITOR ANALYSIS:After the new economic policy OF 1991, the economy opened its floodgates to foreigncompanies to start their business in India. as a result of this many multinational came intoexistence to compete with the domestic industries in all sectors of the economy. As much BEMLis also facing competition from many MNC’s and domestic industries such as
1. Earth movers equipment
Hindustan motors, India

7/28/2019 fundamental analysis project on beml
http://slidepdf.com/reader/full/fundamental-analysis-project-on-beml 16/71
Caterpillar, Russia Larsen & turbo, Japan Telco-wabco Volvo-Swiss
2. Small loaders
JCB Larsen & turbo, Japan Hindustan motors, India
3. Rail & coaches
Integral coach factory- Perambur- Tamilnadu Rail coach factory-kapurtala, Punjab
JCB INDIA: JCB came to india in 1979 The company has a turnover of US $335 million The company is growing by 25-30% annually JCB INDIA is a subsidiary of JC bam ford excavators ltd. (JCB) The product range from backhoe loaders, wheeled loaders to excavators and skid steel
loaders The company has 70% market share in the backhoe loaders segment and around
13%market share in the overall INDIAN economy It has facilities at ballabgarh in Haryana and pune in Maharashtra It has 38 dealers and 206 outlets It has a dedicated parts centre in ballabgarh and parts distribution depots in Chennai,
pune and Kolkata
BEML:
BEML is its largest player in earthmoving equipment The company turnover is around US$484 million The mining and construction equipment segment is around US$306.6 million Defence segment is about US$154.2 million, and railways around US$23 million
The company is the largest public sector undertaking in this industry.
1. PORTERS FIVE FORCE MODEL OF BEML:
(a) New Entrants – Medium

7/28/2019 fundamental analysis project on beml
http://slidepdf.com/reader/full/fundamental-analysis-project-on-beml 17/71
Supply side economies of scale, huge capital requirements and high exit costs deter entry of new players. However, MNCs looking to diversify their business could find India as an attractivedestination.
(b) Supplier Power - Low to Medium Raw materials used in capital goods companies are mostly standardized and largely domestic inorigin, which leaves little scope for a bargain. However, if productionLine is set up adjacent to supplier’s manufacturing facility; manufacturer may face switchingcost in changing suppliers.
(c) Buyer Power – Medium to High Large volume buyers like industrial customers are major purchasers of capital goods which pressurize manufacturers to offer products on thin margins. Indian capital goods sectors arecharacterized by a large array of standardized products which provides ample scope for buyers
to switch between suppliers.(d) Substitute Products - Low There is less number of products that can be substituted with other products in the sector.
(e) Rivalry Intensity – Medium to High The Indian capital goods space is highly fragmented industry with dominance of PSEs in heavyengineering, machine tools, boiler manufacturing while private firms exist in industrial segmentssuch as cement, sugar and non-electrical machinery. There is high level of competition amongorganized players.

7/28/2019 fundamental analysis project on beml
http://slidepdf.com/reader/full/fundamental-analysis-project-on-beml 18/71
Company analysis[Chapter-4]
7/28/2019 fundamental analysis project on beml
http://slidepdf.com/reader/full/fundamental-analysis-project-on-beml 19/71
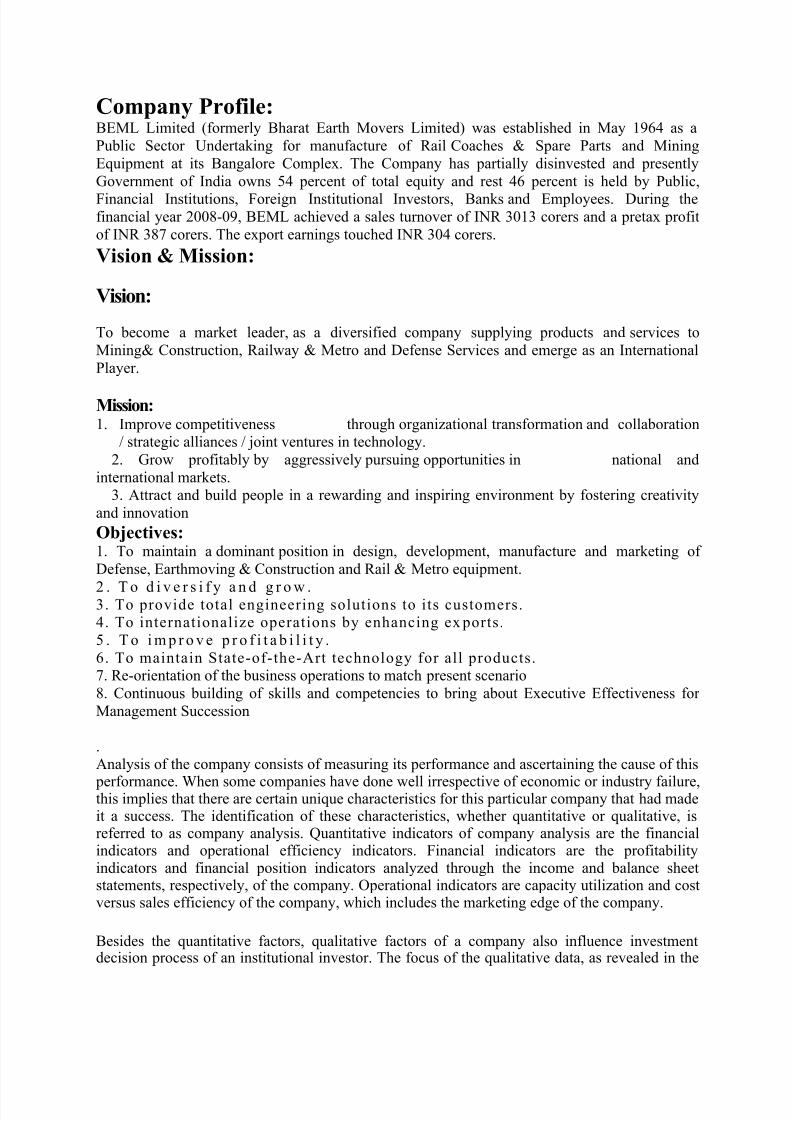
Company Profile: BEML Limited (formerly Bharat Earth Movers Limited) was established in May 1964 as aPublic Sector Undertaking for manufacture of Rail Coaches & Spare Parts and MiningEquipment at its Bangalore Complex. The Company has partially disinvested and presentlyGovernment of India owns 54 percent of total equity and rest 46 percent is held by Public,
Financial Institutions, Foreign Institutional Investors, Banks and Employees. During thefinancial year 2008-09, BEML achieved a sales turnover of INR 3013 corers and a pretax profitof INR 387 corers. The export earnings touched INR 304 corers.
Vision & Mission:
Vision:
To become a market leader, as a diversified company supplying products and services toMining& Construction, Railway & Metro and Defense Services and emerge as an InternationalPlayer.
Mission: 1. Improve competitiveness through organizational transformation and collaboration
/ strategic alliances / joint ventures in technology.2. Grow profitably by aggressively pursuing opportunities in national and
international markets.3. Attract and build people in a rewarding and inspiring environment by fostering creativity
and innovation
Objectives: 1. To maintain a dominant position in design, development, manufacture and marketing of Defense, Earthmoving & Construction and Rail & Metro equipment.
2 . T o d i v e r s i f y a n d g r o w .3. To provide total engineering solutions to its customers.4. To internationalize operations by enhancing ex ports.5 . T o i m p r o v e p r o f i t a b i l i t y .6. To maintain State-of-the-Art technology for all products.7. Re-orientation of the business operations to match present scenario8. Continuous building of skills and competencies to bring about Executive Effectiveness for Management Succession
.Analysis of the company consists of measuring its performance and ascertaining the cause of this
performance. When some companies have done well irrespective of economic or industry failure,this implies that there are certain unique characteristics for this particular company that had madeit a success. The identification of these characteristics, whether quantitative or qualitative, isreferred to as company analysis. Quantitative indicators of company analysis are the financialindicators and operational efficiency indicators. Financial indicators are the profitabilityindicators and financial position indicators analyzed through the income and balance sheetstatements, respectively, of the company. Operational indicators are capacity utilization and costversus sales efficiency of the company, which includes the marketing edge of the company.
Besides the quantitative factors, qualitative factors of a company also influence investmentdecision process of an institutional investor. The focus of the qualitative data, as revealed in the
7/28/2019 fundamental analysis project on beml
http://slidepdf.com/reader/full/fundamental-analysis-project-on-beml 20/71
annual report- as in the director ’s speech. Rather than on quantitative data.
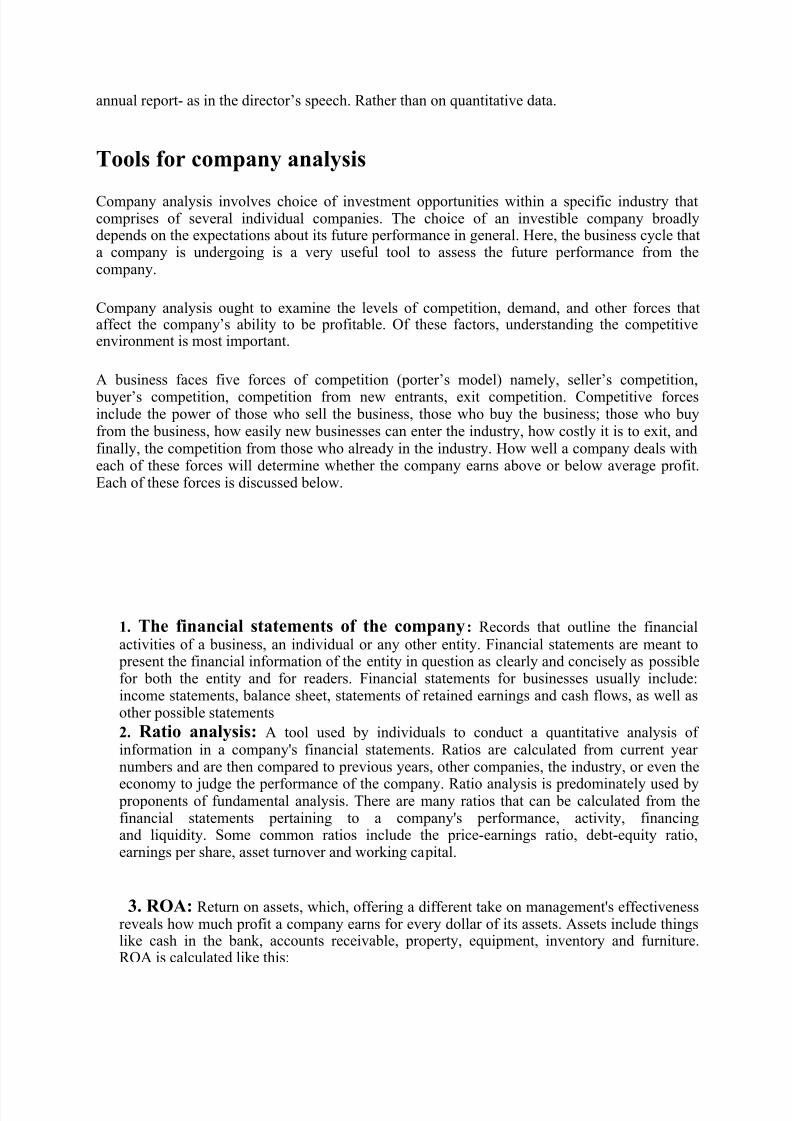
Tools for company analysis
Company analysis involves choice of investment opportunities within a specific industry thatcomprises of several individual companies. The choice of an investible company broadlydepends on the expectations about its future performance in general. Here, the business cycle thata company is undergoing is a very useful tool to assess the future performance from thecompany.
Company analysis ought to examine the levels of competition, demand, and other forces thataffect the company’s ability to be profitable. Of these factors, understanding the competitiveenvironment is most important.
A business faces five forces of competition (porter ’s model) namely, seller ’s competition,
buyer ’s competition, competition from new entrants, exit competition. Competitive forcesinclude the power of those who sell the business, those who buy the business; those who buyfrom the business, how easily new businesses can enter the industry, how costly it is to exit, andfinally, the competition from those who already in the industry. How well a company deals witheach of these forces will determine whether the company earns above or below average profit.Each of these forces is discussed below.
1. The financial statements of the company: Records that outline the financialactivities of a business, an individual or any other entity. Financial statements are meant to present the financial information of the entity in question as clearly and concisely as possiblefor both the entity and for readers. Financial statements for businesses usually include:income statements, balance sheet, statements of retained earnings and cash flows, as well asother possible statements
2. Ratio analysis: A tool used by individuals to conduct a quantitative analysis of information in a company's financial statements. Ratios are calculated from current year numbers and are then compared to previous years, other companies, the industry, or even the
economy to judge the performance of the company. Ratio analysis is predominately used by proponents of fundamental analysis. There are many ratios that can be calculated from thefinancial statements pertaining to a company's performance, activity, financingand liquidity. Some common ratios include the price-earnings ratio, debt-equity ratio,earnings per share, asset turnover and working capital.
3. ROA: Return on assets, which, offering a different take on management's effectiveness reveals how much profit a company earns for every dollar of its assets. Assets include thingslike cash in the bank, accounts receivable, property, equipment, inventory and furniture.ROA is calculated like this:
7/28/2019 fundamental analysis project on beml
http://slidepdf.com/reader/full/fundamental-analysis-project-on-beml 21/71
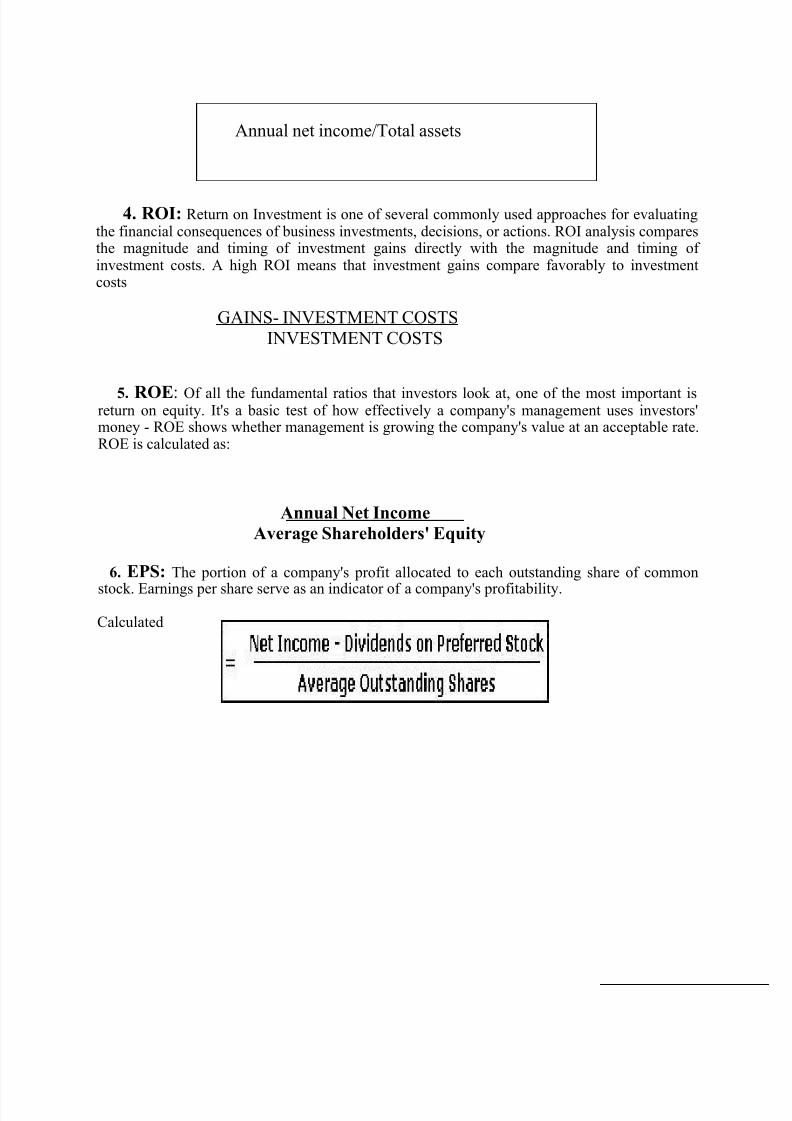
4. ROI: Return on Investment is one of several commonly used approaches for evaluating the financial consequences of business investments, decisions, or actions. ROI analysis comparesthe magnitude and timing of investment gains directly with the magnitude and timing of investment costs. A high ROI means that investment gains compare favorably to investmentcosts
GAINS- INVESTMENT COSTSINVESTMENT COSTS
5. ROE: Of all the fundamental ratios that investors look at, one of the most important is return on equity. It's a basic test of how effectively a company's management uses investors'money - ROE shows whether management is growing the company's value at an acceptable rate.ROE is calculated as:
Annual Net Income
Average Shareholders' Equity
6. EPS: The portion of a company's profit allocated to each outstanding share of common
stock. Earnings per share serve as an indicator of a company's profitability.
Calculated
Annual net income/Total assets
7/28/2019 fundamental analysis project on beml
http://slidepdf.com/reader/full/fundamental-analysis-project-on-beml 22/71
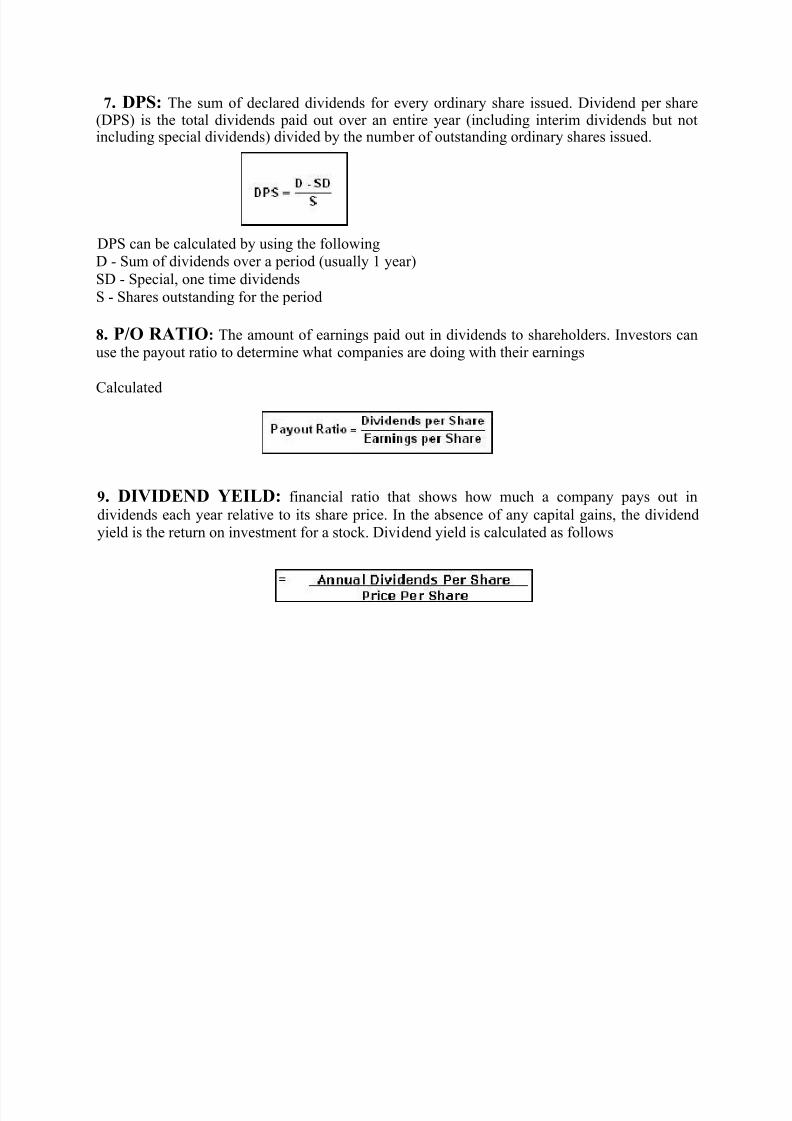
7. DPS: The sum of declared dividends for every ordinary share issued. Dividend per share(DPS) is the total dividends paid out over an entire year (including interim dividends but notincluding special dividends) divided by the number of outstanding ordinary shares issued.
DPS can be calculated by using the followingD - Sum of dividends over a period (usually 1 year)SD - Special, one time dividendsS - Shares outstanding for the period
8. P/O RATIO: The amount of earnings paid out in dividends to shareholders. Investors canuse the payout ratio to determine what companies are doing with their earnings
Calculated
9. DIVIDEND YEILD: financial ratio that shows how much a company pays out in
dividends each year relative to its share price. In the absence of any capital gains, the dividendyield is the return on investment for a stock. Dividend yield is calculated as follows

7/28/2019 fundamental analysis project on beml
http://slidepdf.com/reader/full/fundamental-analysis-project-on-beml 23/71
RESEARCH DESIGN
[CHAPTER-5]

7/28/2019 fundamental analysis project on beml
http://slidepdf.com/reader/full/fundamental-analysis-project-on-beml 24/71
RESEARCH DESIGN OF THE STUDY
INTRODUCTION:
Every stock available in the markets has a value called market price, which is the
indicator of the company’s performance. According to fundamental analysis we will try to find
the intrinsic value of a particular stock, which is the true value of the stock, based on which
investment arguments take place.
STATEMENT OF PROBLEM:
Every asset, financial as well as real, has value. The key to successfully investing in and
managing these assets lies in understanding not only what the value is, but the sources of the
value. Any asset at can be valued but some assets are easier to value than others, and the details
of the valuation will vary from case to case. Thus, the valuation of a share of a real estate
property will require different information and follow a different format from the valuation of a
publicly traded stock. What is surprising; however, is not the difference in valuation techniques
across assets, but the degree of similarity in basic principles. There is undeniably uncertainty
associated with valuation. Often the
Uncertainty comes from the asset being valued, although the valuation model may add to that
ascertained.
A postulate of sound investing is that an investor does not pay more for asset than it’s
worth. This statement may seem logical and obvious as financial assets are acquired for the cash
flows expected from owning them, which implies that the price that is paid for any asset should
reflect the cash flows it is expected to generate.
The problem in valuation is not that there are not enough models to value an asset; it is
that there are too many. Choosing the right model to use in valuation is as critical to arriving at a
reasonable value as understanding how to use the model. Analysts use a wide variety of models
from simple to the sophisticated. These models often make different assumptions about pricing,
but they do share some common characteristics so in the study we tried to use price-earnings
multiples and discounted cash flow models of valuation.

7/28/2019 fundamental analysis project on beml
http://slidepdf.com/reader/full/fundamental-analysis-project-on-beml 25/71
OBJECTIVES OF THE STUDY:
2. To understand the macroeconomic variables those will an impact on the company
progress.
3. To study the various trends, opportunities, challenges of the industry in which the company
operates.
4. To understand the various policies of the company those have impact on the financial
performance of the company.
5. To understand the various investment valuation models that can be used.
6. To select the appropriate model that suits the stock.
7. Find the intrinsic value of the stock and compare with market value of the study.
8. To recommend whether to buy, hold or sell the stock based on the analysis.
SCOPE OF THE STUDY:
The study basically tries to identify the intrinsic value of the company by using the
published financial details of the company. The study is restricted to one particular company in
the sector. The study also includes testing the intrinsic value of the company.
RESEARCH METHODOLOGY:
Type of research:
Research design is the conceptual structure within which research is conducted. It
constitutes the blue print for the collection, measurement, and analysis of data. The type of
research adopted for the study is descriptive research as the research does not require any
manipulation of variables and does not establish causal relationship between events; it just
simply describes the variables.
Sources of data:
Primary data
7/28/2019 fundamental analysis project on beml
http://slidepdf.com/reader/full/fundamental-analysis-project-on-beml 26/71
Those are the data that are obtained by a study specially designed to fulfill the data needs
of the problem. Meeting the company professionals personally collected the information
necessary for the study.
Secondary data
The sources of secondary data for solve the problems are:-
Company Annual Report
ACE equity database
Internet-websitesPeriod of study
The period of the study is 5 years i.e. (2009-20112). Company 4 years data has been taken for the analysis.
Tools
These are the most popular tools of fundamental analysis. They focus on earnings, growth, andvalue in the market.
Earnings per Share – EPS
Price to Earnings Ratio – P/E
Projected Earnings Growth – PEG
Price to Sales – P/S
Price to Book – P/B
Dividend Payout Ratio
Dividend Yield
Book Value
Ratio AnalysisLiquid ratio

7/28/2019 fundamental analysis project on beml
http://slidepdf.com/reader/full/fundamental-analysis-project-on-beml 27/71
LIMITATIONS OF THE STUDY:
The study was confined only to one particular sector.
The study was more confined with secondary data.
The study assumes no changes in the tax rates in the country.
The study was done for a short period of time, which might not hold true over a long
period of time.
As the scope is defined by the researcher it restricts the number of variables which
Influence the industry.

7/28/2019 fundamental analysis project on beml
http://slidepdf.com/reader/full/fundamental-analysis-project-on-beml 28/71
DATA ANALYSIS[CHAPTER-6]

7/28/2019 fundamental analysis project on beml
http://slidepdf.com/reader/full/fundamental-analysis-project-on-beml 29/71
The process of evaluating data using analytical and logical reasoning to examine each
component of the data provided. This form of analysis is just one of the many steps that must
be completed when conducting a research experiment. Data from various sources is gathered,
reviewed, and then analyzed to form some sort of finding or conclusion. There are a variety of
specific data analysis method, some of which include data mining, text analytics, business
intelligence, and data visualizations
Data can be of several types
Quantitative data is a number Qualitative data is a pass/fail or the presence of a characteristic
Quantitative data is data measured or identified on a numerical scale. Numerical data can beanalyzed using statistical methods, and results can be displayed using tables, charts, histogramsand graphs.
The term qualitative data is used to describe certain types of information. This is almost theconverse of quantitative data, in which items are more precisely described as data in terms of quantity and in which numerical values are used. However, data originally obtained asqualitative information about individual items may give rise to quantitative data if they aresummarized by means of counts.
Qualitative data described items in terms of some quality or categorization that may be 'informal'or may use relatively ill-defined characteristics such as warmth and flavor. However, qualitativedata can include well-defined aspects such as gender, nationality or commodity type.

7/28/2019 fundamental analysis project on beml
http://slidepdf.com/reader/full/fundamental-analysis-project-on-beml 30/71
BALANCE SHEET:
MAR’12 MAR’11 MAR’10 MAR’09 MAR’08
Sources Of Funds
Total ShareCapital
41.77 41.77 41.77 41.77 41.77
Equity ShareCapital
41.77 41.77 41.77 41.77 41.77
Share ApplicationMoney
0.00 0.00 0.00 0.00 0.00
Preference
Share Capital
0.00 0.00 0.00 0.00 0.00
Reserves 2,130.31 2,097.27 1,996.07 1,873.60 1,663.93
RevaluationReserves
0.00 0.00 0.00 0.00 0.00
Networth 2,172.08 2,139.04 2,037.84 1,915.37 1,705.70
SecuredLoans
781.71 676.22 753.05 470.91 303.27
UnsecuredLoans
161.22 140.90 155.50 96.73 0.00
Total Debt 942.93 817.12 908.55 567.64 303.27
TotalLiabilities
3,115.01 2,956.16 2,946.39 2,483.01 2,008.97
Mar '12 Mar '11 Mar '10 Mar '09 Mar '08
12 mths 12 mths 12 mths 12 mths 12 mths
ApplicationOf Funds
Gross Block 1,128.45 945.43 798.71 749.51 680.28
Less: Acumen.Depreciation
599.23 555.90 524.84 494.02 469.70
Net Block 529.22 389.53 273.87 255.49 210.58
Capital Work
in Progress 23.86 79.58 32.21 23.61 24.63Investments 4.43 8.20 8.20 7.95 7.95
Inventories 2,420.64 1,888.91 1,653.00 1,620.58 929.58
SundryDebtors
792.46 1,287.53 1,360.74 1,545.27 1,496.06
Cash andBank Balance
192.47 48.28 417.10 98.51 156.10
Total Current 3,405.57 3,224.72 3,430.84 3,264.36 2,581.74

7/28/2019 fundamental analysis project on beml
http://slidepdf.com/reader/full/fundamental-analysis-project-on-beml 31/71
Assets
Loans and Advances
972.00 598.93 536.53 459.46 202.23
FixedDeposits
0.00 0.00 150.05 165.00 365.00
Total CA,
Loans & Advances
4,377.57 3,823.65 4,117.42 3,888.82 3,148.97
DefferedCredit
0.00 0.00 0.00 0.00 0.00
CurrentLiabilities
1,501.05 1,025.65 925.88 1,164.99 1,329.35
Provisions 319.02 319.14 560.88 536.15 67.75
Total CL &Provisions
1,820.07 1,344.79 1,486.76 1,701.14 1,397.10
Net CurrentAssets
2,557.50 2,478.86 2,630.66 2,187.68 1,751.87
MiscellaneousExpenses 0.00 0.00 1.45 8.30 13.94
Total Assets 3,115.01 2,956.17 2,946.39 2,483.03 2,008.97
ContingentLiabilities
212.52 179.21 206.49 150.71 125.55
Book Value(Rs)
521.58 513.64 489.34 459.93 409.59

7/28/2019 fundamental analysis project on beml
http://slidepdf.com/reader/full/fundamental-analysis-project-on-beml 32/71
PROFIT & LOSS:
MAR’12 MAR’11 MAR’10 MAR’09 MAR’08
Income
Sales
Turnover
2,920.58 2,824.54 3,005.93 2,949.67 2,733.38
Excise Duty 194.09 197.05 150.09 127.32 186.19
Net Sales 2,726.49 2,627.49 2,855.84 2,822.35 2,547.19
Other Income 73.91 62.79 53.08 39.37 52.13
Stock Adjustments
428.81 145.08 150.99 280.72 113.60
Total Income 3,229.21 2,835.36 3,059.91 3,142.44 2,712.92
Expenditure
Raw Materials 2,920.58 2,824.54 3,005.93 2,949.67 2,733.38
Power & FuelCost
194.09 197.05 150.09 127.32 186.19
Employee
Cost2,726.49 2,627.49 2,855.84 2,822.35 2,547.19
Other ManufacturingExpenses
73.91 62.79 53.08 39.37 52.13
Selling and AdminExpenses
428.81 145.08 150.99 280.72 113.60
MiscellaneousExpenses
3,229.21 2,835.36 3,059.91 3,142.44 2,712.92
PreoperativeExpCapitalized
0.00 0.00 0.00 0.00 -0.46
TotalExpenses
3,032.15 2,646.92 2,685.65 2,722.24 2,336.00
Mar '12 Mar '11 Mar '10 Mar '09 Mar '08
12 mths 12 mths 12 mths 12 mths 12 mths
OperatingProfit
123.15 125.65 321.18 380.83 324.79
PBDIT 197.06 188.44 374.26 420.20 376.92
Interest 88.43 72.04 60.60 43.18 26.61PBDT 108.63 116.40 313.66 377.02 350.31
Depreciation 43.92 33.64 32.22 27.31 17.70Other WrittenOff
0.00 6.87 0.00 2.36 6.29
Profit BeforeTax
64.71 75.89 281.44 347.35 326.32
Extra-ordinaryitems
1.73 120.21 40.71 54.91 21.69
PBT (PostExtra-ord
66.44 196.10 322.15 402.26 348.01
7/28/2019 fundamental analysis project on beml
http://slidepdf.com/reader/full/fundamental-analysis-project-on-beml 33/71
Items)
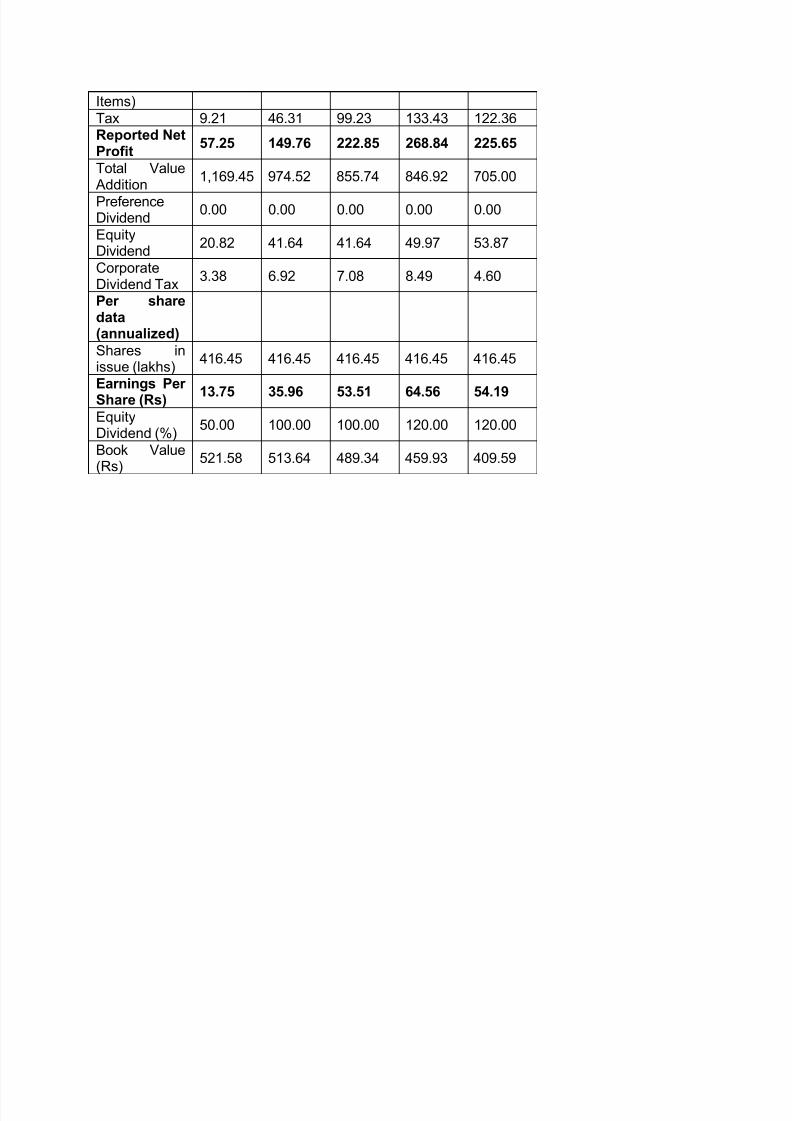
Tax 9.21 46.31 99.23 133.43 122.36Reported NetProfit
57.25 149.76 222.85 268.84 225.65
Total Value Addition
1,169.45 974.52 855.74 846.92 705.00
PreferenceDividend
0.00 0.00 0.00 0.00 0.00
EquityDividend
20.82 41.64 41.64 49.97 53.87
CorporateDividend Tax
3.38 6.92 7.08 8.49 4.60
Per sharedata(annualized)
Shares inissue (lakhs)
416.45 416.45 416.45 416.45 416.45
Earnings Per Share (Rs) 13.75 35.96 53.51 64.56 54.19
EquityDividend (%)
50.00 100.00 100.00 120.00 120.00
Book Value(Rs)
521.58 513.64 489.34 459.93 409.59

7/28/2019 fundamental analysis project on beml
http://slidepdf.com/reader/full/fundamental-analysis-project-on-beml 34/71
CASH FLOW STATEMENTS:
MAR’12 MAR’11 MAR’10 MAR’09 MAR’08
Net Profit Before
Tax
66.46 186.75 319.55 387.47 348.01
Net Cash FromOperating Activities
241.82-158.33
98.18-412.40
-476.86
Net Cash (usedin)/fromInvesting Activities
-106.43
-161.75
-28.06 -37.94 -56.93
Net Cash (usedin)/from Financing
Activities8.80
-198.79
233.52 192.75 707.04
Net(decrease)/increaseIn Cash and Cash
Equivalents
144.19-518.87
303.64-257.59
173.26
Opening Cash &Cash Equivalents
48.28 567.15 263.51 521.10 347.84
Closing Cash &Cash Equivalents
192.47 48.28 567.15 263.51 521.10
7/28/2019 fundamental analysis project on beml
http://slidepdf.com/reader/full/fundamental-analysis-project-on-beml 35/71
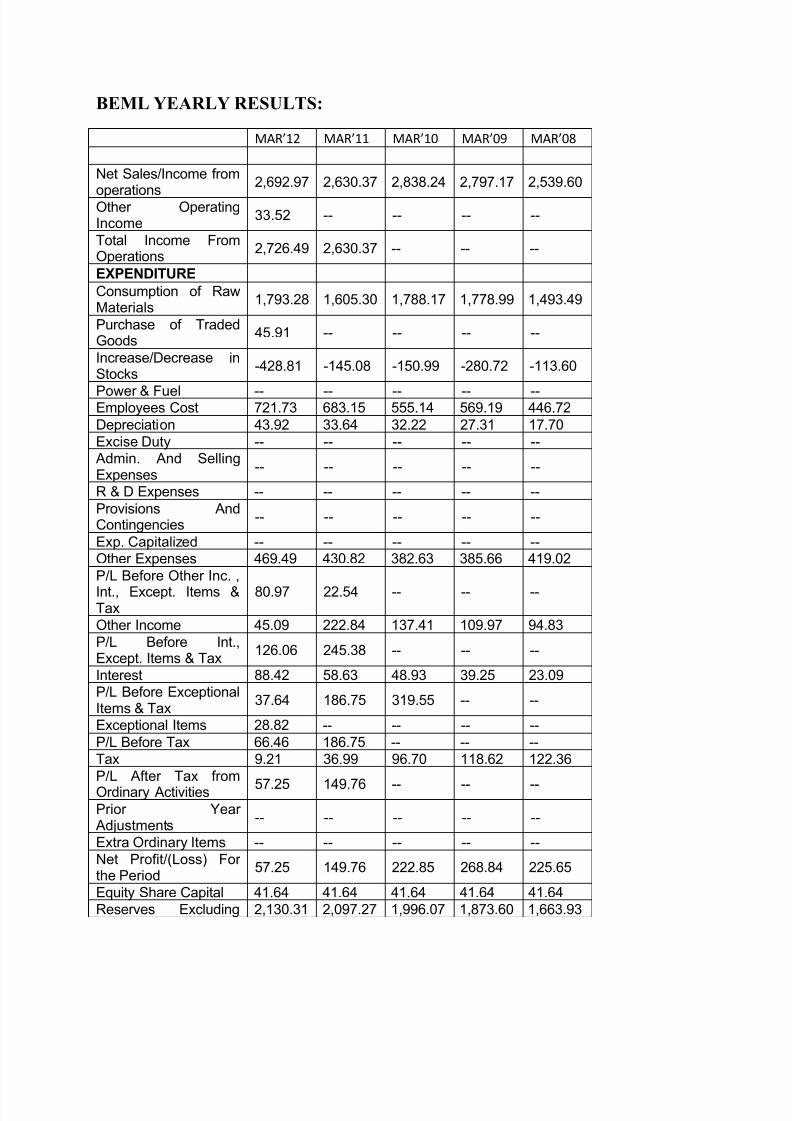
BEML YEARLY RESULTS:
MAR’12 MAR’11 MAR’10 MAR’09 MAR’08
Net Sales/Income from
operations
2,692.97 2,630.37 2,838.24 2,797.17 2,539.60
Other OperatingIncome
33.52 -- -- -- --
Total Income FromOperations
2,726.49 2,630.37 -- -- --
EXPENDITURE
Consumption of RawMaterials
1,793.28 1,605.30 1,788.17 1,778.99 1,493.49
Purchase of TradedGoods
45.91 -- -- -- --
Increase/Decrease inStocks
-428.81 -145.08 -150.99 -280.72 -113.60
Power & Fuel -- -- -- -- --Employees Cost 721.73 683.15 555.14 569.19 446.72
Depreciation 43.92 33.64 32.22 27.31 17.70
Excise Duty -- -- -- -- -- Admin. And SellingExpenses
-- -- -- -- --
R & D Expenses -- -- -- -- --
Provisions AndContingencies
-- -- -- -- --
Exp. Capitalized -- -- -- -- --Other Expenses 469.49 430.82 382.63 385.66 419.02
P/L Before Other Inc. ,
Int., Except. Items &Tax
80.97 22.54 -- -- --
Other Income 45.09 222.84 137.41 109.97 94.83
P/L Before Int.,Except. Items & Tax
126.06 245.38 -- -- --
Interest 88.42 58.63 48.93 39.25 23.09P/L Before ExceptionalItems & Tax
37.64 186.75 319.55 -- --
Exceptional Items 28.82 -- -- -- --
P/L Before Tax 66.46 186.75 -- -- --
Tax 9.21 36.99 96.70 118.62 122.36
P/L After Tax fromOrdinary Activities 57.25 149.76 -- -- --
Prior Year Adjustments
-- -- -- -- --
Extra Ordinary Items -- -- -- -- --
Net Profit/(Loss) For the Period
57.25 149.76 222.85 268.84 225.65
Equity Share Capital 41.64 41.64 41.64 41.64 41.64
Reserves Excluding 2,130.31 2,097.27 1,996.07 1,873.60 1,663.93

7/28/2019 fundamental analysis project on beml
http://slidepdf.com/reader/full/fundamental-analysis-project-on-beml 36/71
Revaluation Reserves
Equity Dividend Rate(%)
-- -- -- -- --
EPS Before ExtraOrdinary
Basic EPS 13.75 35.96 -- -- --
Diluted EPS 13.75 35.96 -- -- --EPS After ExtraOrdinary
Basic EPS 13.75 35.96 -- -- --Diluted EPS 13.75 35.96 -- -- --
Public Share Holding
No Of Shares (Crores) 1.91 1.91 1.91 1.91 1.91
Share Holding (%) 45.97 45.97 45.97 45.97 45.97Promoters andPromoter GroupShareholding
a)Pledged/Encumbered
- Number of shares(Crores)
-- -- -- -- --
- Per. of shares (as a% of the total sh. of prom. and promoter group)
-- -- -- -- --
- Per. of shares (as a% of the total ShareCap. of the company)
-- -- -- -- --
b) Non-encumbered
- Number of shares(Crores)
2.25 2.25 -- -- --
- Per. of shares (as a% of the total sh. of prom. and promoter group)
100.00 100.00 -- -- --
- Per. of shares (as a% of the total ShareCap. of the company)
54.03 54.03 ----
7/28/2019 fundamental analysis project on beml
http://slidepdf.com/reader/full/fundamental-analysis-project-on-beml 37/71
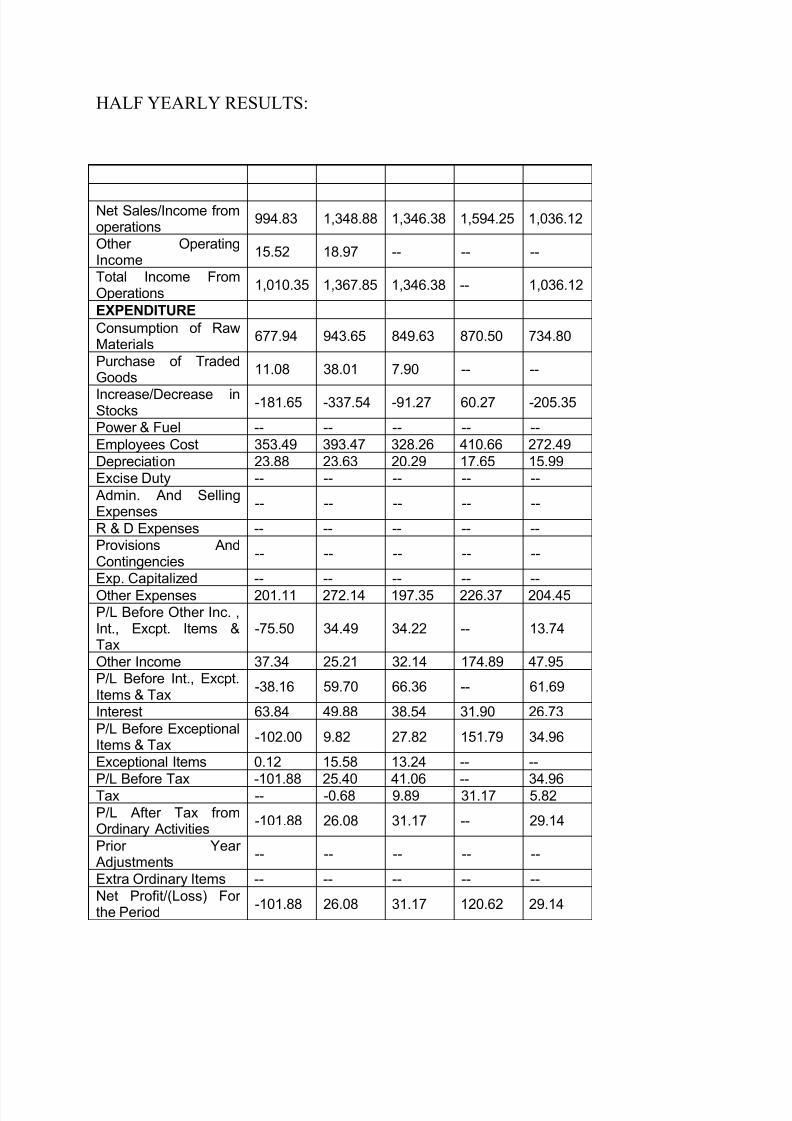
HALF YEARLY RESULTS:
Net Sales/Income fromoperations
994.83 1,348.88 1,346.38 1,594.25 1,036.12
Other OperatingIncome
15.52 18.97 -- -- --
Total Income FromOperations
1,010.35 1,367.85 1,346.38 -- 1,036.12
EXPENDITURE
Consumption of RawMaterials
677.94 943.65 849.63 870.50 734.80
Purchase of TradedGoods
11.08 38.01 7.90 -- --
Increase/Decrease inStocks
-181.65 -337.54 -91.27 60.27 -205.35
Power & Fuel -- -- -- -- --
Employees Cost 353.49 393.47 328.26 410.66 272.49
Depreciation 23.88 23.63 20.29 17.65 15.99Excise Duty -- -- -- -- --
Admin. And SellingExpenses
-- -- -- -- --
R & D Expenses -- -- -- -- --Provisions AndContingencies
-- -- -- -- --
Exp. Capitalized -- -- -- -- --
Other Expenses 201.11 272.14 197.35 226.37 204.45P/L Before Other Inc. ,Int., Excpt. Items &Tax
-75.50 34.49 34.22 -- 13.74
Other Income 37.34 25.21 32.14 174.89 47.95P/L Before Int., Excpt.Items & Tax
-38.16 59.70 66.36 -- 61.69
Interest 63.84 49.88 38.54 31.90 26.73
P/L Before ExceptionalItems & Tax
-102.00 9.82 27.82 151.79 34.96
Exceptional Items 0.12 15.58 13.24 -- --
P/L Before Tax -101.88 25.40 41.06 -- 34.96Tax -- -0.68 9.89 31.17 5.82
P/L After Tax fromOrdinary Activities
-101.88 26.08 31.17 -- 29.14
Prior Year Adjustments
-- -- -- -- --
Extra Ordinary Items -- -- -- -- --
Net Profit/(Loss) For the Period
-101.88 26.08 31.17 120.62 29.14

7/28/2019 fundamental analysis project on beml
http://slidepdf.com/reader/full/fundamental-analysis-project-on-beml 38/71
Equity Share Capital 41.64 41.64 41.64 41.64 41.64
Reserves ExcludingRevaluation Reserves
-- -- -- -- --
Equity Dividend Rate(%)
-- -- -- -- --
EPS Before Extra
OrdinaryBasic EPS -24.46 -- 7.48 -- 7.00
Diluted EPS -24.46 -- 7.48 -- 7.00EPS After ExtraOrdinary
Basic EPS -24.46 -- 7.48 -- 7.00
Diluted EPS -24.46 -- 7.48 -- 7.00
Public Share Holding
No Of Shares (Crores) 1.91 1.91 1.91 1.91 1.91
Share Holding (%) 45.97 45.97 45.97 45.97 45.97Promoters and
Promoter GroupShareholding
a)Pledged/Encumbered
- Number of shares(Crores)
-- -- -- -- --
- Per. of shares (as a% of the total sh. of prom. and promoter group)
-- -- -- -- --
- Per. of shares (as a% of the total Share
Cap. of the company)
-- -- -- -- --
b) Non-encumbered
- Number of shares(Crores)
2.25 2.25 2.25 -- 2.25
- Per. of shares (as a% of the total sh. of prom. and promoter group)
100.00 100.00 100.00 -- 100.00
- Per. of shares (as a% of the total ShareCap. of the company)
54.03 54.03 54.03 -- 54.03

7/28/2019 fundamental analysis project on beml
http://slidepdf.com/reader/full/fundamental-analysis-project-on-beml 39/71
KEY RATIOS:
MAR’12 MAR’11 MAR’10 MAR’09
Investment
ValuationRatios
Face Value 10.00 10.00 10.00 10.00
Dividend Per Share
5.00 10.00 10.00 12.00
OperatingProfit Per Share (Rs)
29.57 30.16 77.11 91.45
Net OperatingProfit Per Share (Rs)
654.71 630.93 685.77 677.73
Free
Reserves Per Share (Rs) -- 503.36 478.70 447.65
Bonus inEquity Capital
-- -- -- --
ProfitabilityRatios
OperatingProfitMargin(%)
4.51 4.78 11.24 13.49
Profit BeforeInterest AndTax
Margin(%)
2.85 3.41 9.89 12.31
Gross ProfitMargin(%)
2.90 3.50 10.11 12.52
Cash ProfitMargin(%)
2.54 2.67 7.67 8.81
AdjustedCashMargin(%)
2.54 2.67 7.67 8.81
Net ProfitMargin(%)
2.06 5.56 7.63 9.36
Adjusted NetProfit
Margin(%)
2.06 5.56 7.63 9.36
Return OnCapitalEmployed(%)
3.99 5.06 11.93 16.10
Return OnNet Worth(%)
2.63 7.00 10.94 14.09
AdjustedReturn on NetWorth(%)
1.22 1.46 9.42 11.70

7/28/2019 fundamental analysis project on beml
http://slidepdf.com/reader/full/fundamental-analysis-project-on-beml 40/71
Return on AssetsExcludingRevaluations
521.58 513.64 488.99 457.94
Return on Assets
IncludingRevaluations
521.58 513.64 488.99 457.94
Return onLong TermFunds(%)
5.13 6.99 17.25 20.87
LiquidityAndSolvencyRatios
Current Ratio 1.39 1.35 1.31 1.42
Quick Ratio 1.04 1.38 1.61 1.31
Debt EquityRatio 0.43 0.38 0.45 0.30Long TermDebt EquityRatio
0.11 -- -- --
DebtCoverageRatios
InterestCover
1.41 2.55 7.19 10.19
Total Debt toOwners Fund
0.43 0.38 0.45 0.30
FinancialChargesCoverageRatio
1.90 2.64 6.33 9.95
FinancialChargesCoverageRatio PostTax
2.14 3.64 5.21 7.91
ManagementEfficiencyRatios
InventoryTurnover Ratio
1.21 1.90 2.40 1.87
DebtorsTurnover Ratio
2.62 1.98 1.97 1.86
InvestmentsTurnover Ratio
1.21 1.90 2.40 1.87

7/28/2019 fundamental analysis project on beml
http://slidepdf.com/reader/full/fundamental-analysis-project-on-beml 41/71
Fixed AssetsTurnover Ratio
2.49 2.86 3.58 3.77
Total AssetsTurnover Ratio
0.89 0.90 0.97 1.14
AssetTurnover Ratio
0.90 0.89 1.05 1.26
Average RawMaterialHolding
-- 132.67 99.82 112.07
AverageFinishedGoods Held
-- 61.52 31.97 75.15
Number of Days InWorkingCapital
337.69 339.63 331.61 279.04
Profit & LossAccountRatios
Material CostComposition
68.31 63.65 64.07 66.44
ImportedCompositionof RawMaterialsConsumed
-- -- -- --
SellingDistributionCostComposition
-- 1.23 1.16 1.29
Expenses asCompositionof Total Sales
4.25 6.82 4.68 10.01
Cash FlowIndicator Ratios
DividendPayout RatioNet Profit
42.27 32.42 21.86 21.74
DividendPayout RatioCash Profit
23.92 25.52 19.10 19.58
EarningRetentionRatio
9.33 -54.74 74.61 73.82
Cash Earning 65.73 32.46 78.26 76.89

7/28/2019 fundamental analysis project on beml
http://slidepdf.com/reader/full/fundamental-analysis-project-on-beml 42/71
RetentionRatio
AdjustedCashFlow Times
13.36 11.37 4.05 2.24
Mar '12
Mar '11
Mar '10
Mar '09
Earnings Per Share
13.75 35.96 53.51 64.56
Book Value 521.58 513.64 489.34 459.93

7/28/2019 fundamental analysis project on beml
http://slidepdf.com/reader/full/fundamental-analysis-project-on-beml 43/71
ECONOMIC ANALYSIS
7/28/2019 fundamental analysis project on beml
http://slidepdf.com/reader/full/fundamental-analysis-project-on-beml 44/71
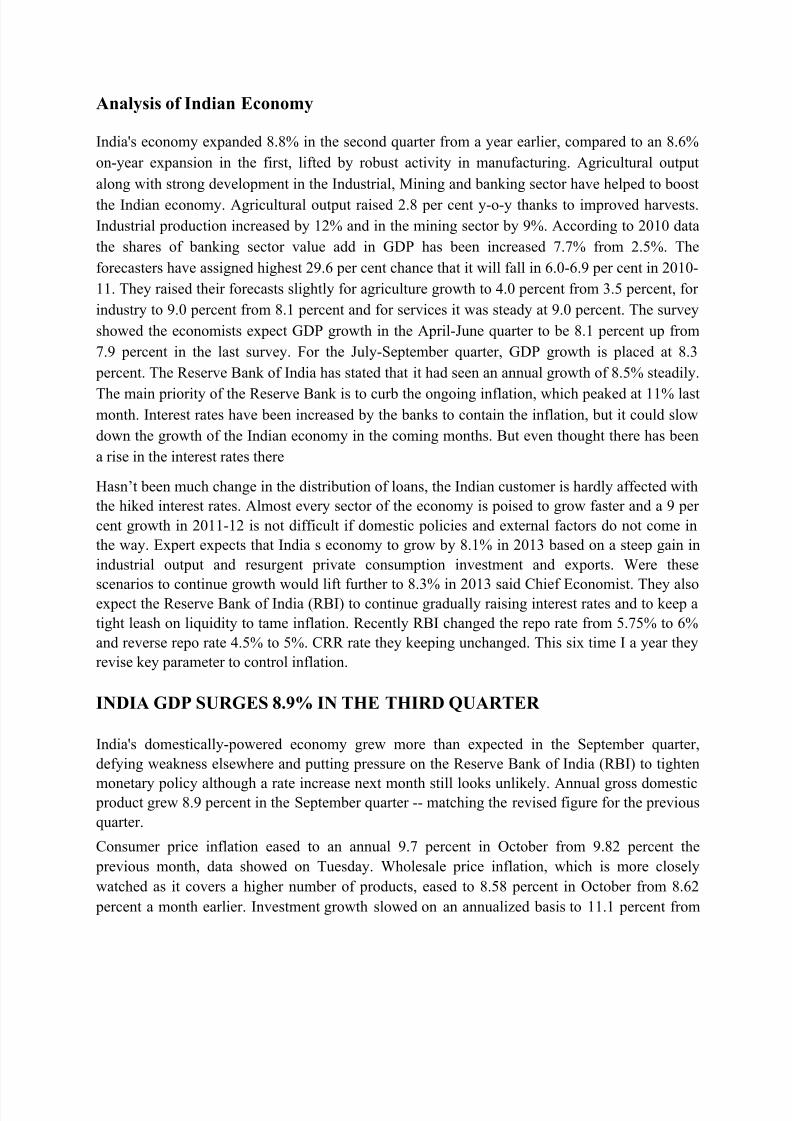
Analysis of Indian Economy
India's economy expanded 8.8% in the second quarter from a year earlier, compared to an 8.6%
on-year expansion in the first, lifted by robust activity in manufacturing. Agricultural output
along with strong development in the Industrial, Mining and banking sector have helped to boost
the Indian economy. Agricultural output raised 2.8 per cent y-o-y thanks to improved harvests.
Industrial production increased by 12% and in the mining sector by 9%. According to 2010 data
the shares of banking sector value add in GDP has been increased 7.7% from 2.5%. The
forecasters have assigned highest 29.6 per cent chance that it will fall in 6.0-6.9 per cent in 2010-
11. They raised their forecasts slightly for agriculture growth to 4.0 percent from 3.5 percent, for
industry to 9.0 percent from 8.1 percent and for services it was steady at 9.0 percent. The survey
showed the economists expect GDP growth in the April-June quarter to be 8.1 percent up from
7.9 percent in the last survey. For the July-September quarter, GDP growth is placed at 8.3
percent. The Reserve Bank of India has stated that it had seen an annual growth of 8.5% steadily.
The main priority of the Reserve Bank is to curb the ongoing inflation, which peaked at 11% lastmonth. Interest rates have been increased by the banks to contain the inflation, but it could slow
down the growth of the Indian economy in the coming months. But even thought there has been
a rise in the interest rates there
Hasn’t been much change in the distribution of loans, the Indian customer is hardly affected with
the hiked interest rates. Almost every sector of the economy is poised to grow faster and a 9 per
cent growth in 2011-12 is not difficult if domestic policies and external factors do not come in
the way. Expert expects that India s economy to grow by 8.1% in 2013 based on a steep gain in
industrial output and resurgent private consumption investment and exports. Were these
scenarios to continue growth would lift further to 8.3% in 2013 said Chief Economist. They alsoexpect the Reserve Bank of India (RBI) to continue gradually raising interest rates and to keep a
tight leash on liquidity to tame inflation. Recently RBI changed the repo rate from 5.75% to 6%
and reverse repo rate 4.5% to 5%. CRR rate they keeping unchanged. This six time I a year they
revise key parameter to control inflation.
INDIA GDP SURGES 8.9% IN THE THIRD QUARTER
India's domestically-powered economy grew more than expected in the September quarter,
defying weakness elsewhere and putting pressure on the Reserve Bank of India (RBI) to tighten
monetary policy although a rate increase next month still looks unlikely. Annual gross domestic product grew 8.9 percent in the September quarter -- matching the revised figure for the previous
quarter.
Consumer price inflation eased to an annual 9.7 percent in October from 9.82 percent the
previous month, data showed on Tuesday. Wholesale price inflation, which is more closely
watched as it covers a higher number of products, eased to 8.58 percent in October from 8.62
percent a month earlier. Investment growth slowed on an annualized basis to 11.1 percent from

7/28/2019 fundamental analysis project on beml
http://slidepdf.com/reader/full/fundamental-analysis-project-on-beml 45/71
19 percent in the previous quarter, while annualized private consumption accelerated to 9.3
percent from 7.8 percent in the previous quarter, pointing to inflationary risks. The services
sector, which accounts for over 50 percent of GDP, grew 9.8 percent in the September quarter,
higher than 9.3 percent in the previous quarter. Signs of easing inflation, a fragile global
economy and weaker industrial output in September were likely to forestall any rise in rates in
the near-term, some analysts said. "Unless the full year growth looks likely to cross 9 percent,
the central bank is unlikely to get aggressive again in raising rates," said Anjali Varma,
economist at MF Global in Mumbai. Industrial output growth -- a key indicator of growth
momentum -- in Asia's third-largest economy slowed unexpectedly in September to 4.4 percent
from a year earlier, down from the previous month's upwardly revised 6.92 percent growth
The Gross Domestic Product (GDP) in India was worth 1847.98 billion US dollars in 2011. The
GDP value of India represents 2.98 percent of the world economy. GDP in India is reported by
the The World Bank Group. Historically, from 1960 until 2011, India GDP averaged 368.8 USD
Billion reaching an all time high of 1848.0 USD Billion in December of 2011 and a record low
of 36.6 USD Billion in December of 1960. The gross domestic product (GDP) measures of
national income and output for a given country's economy. The gross domestic product (GDP) is
equal to the total expenditures for all final goods and services produced within the country in a
stipulated period of time. This page includes a chart with historical data for India GDP.
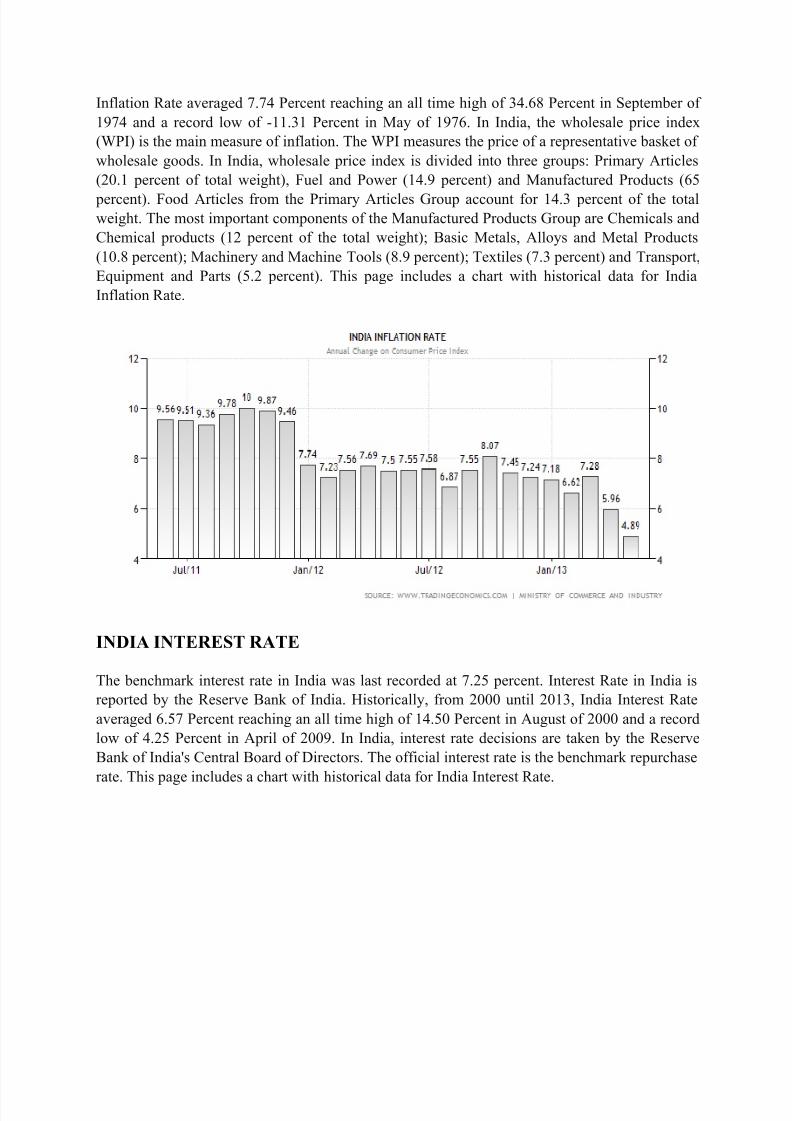
INDIA INFLATION RATE
The inflation rate in India was recorded at 4.89 percent in April of 2013. Inflation Rate in India is
reported by the Ministry of Commerce and Industry. Historically, from 1969 until 2013, India
7/28/2019 fundamental analysis project on beml
http://slidepdf.com/reader/full/fundamental-analysis-project-on-beml 46/71
Inflation Rate averaged 7.74 Percent reaching an all time high of 34.68 Percent in September of
1974 and a record low of -11.31 Percent in May of 1976. In India, the wholesale price index
(WPI) is the main measure of inflation. The WPI measures the price of a representative basket of
wholesale goods. In India, wholesale price index is divided into three groups: Primary Articles
(20.1 percent of total weight), Fuel and Power (14.9 percent) and Manufactured Products (65
percent). Food Articles from the Primary Articles Group account for 14.3 percent of the totalweight. The most important components of the Manufactured Products Group are Chemicals and
Chemical products (12 percent of the total weight); Basic Metals, Alloys and Metal Products
(10.8 percent); Machinery and Machine Tools (8.9 percent); Textiles (7.3 percent) and Transport,
Equipment and Parts (5.2 percent). This page includes a chart with historical data for India
Inflation Rate.
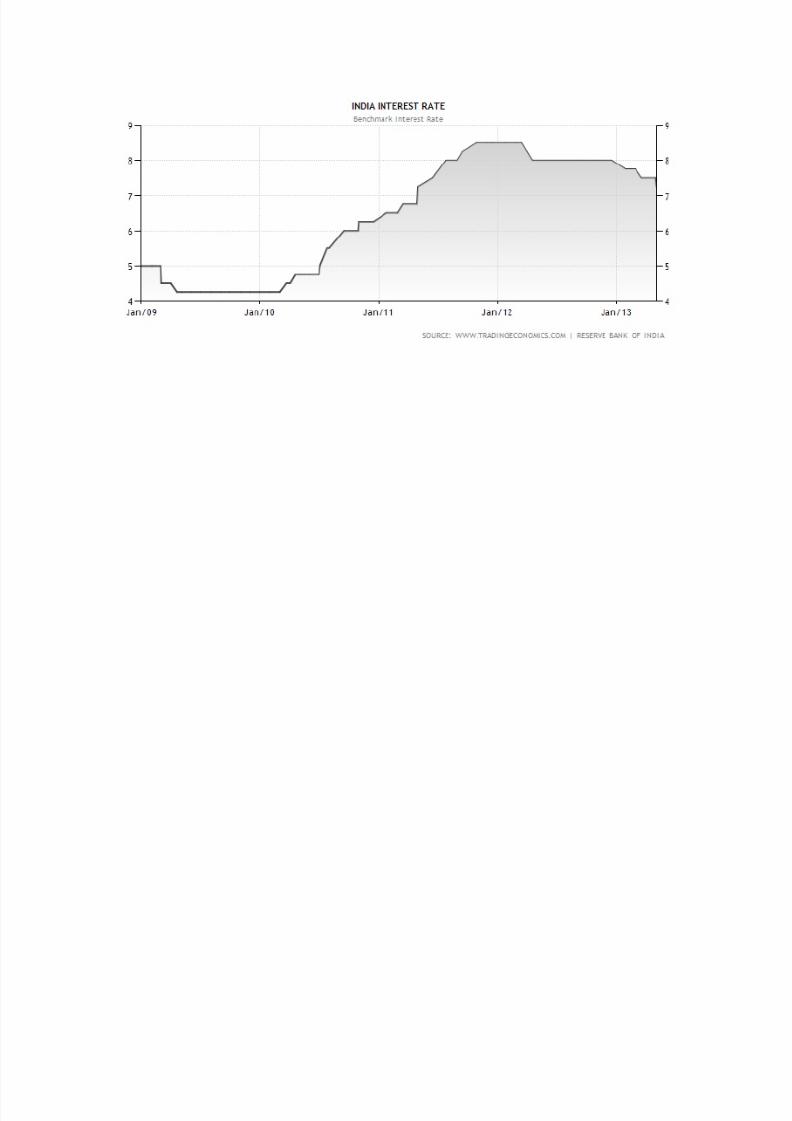
INDIA INTEREST RATE
The benchmark interest rate in India was last recorded at 7.25 percent. Interest Rate in India is
reported by the Reserve Bank of India. Historically, from 2000 until 2013, India Interest Rate
averaged 6.57 Percent reaching an all time high of 14.50 Percent in August of 2000 and a record
low of 4.25 Percent in April of 2009. In India, interest rate decisions are taken by the Reserve
Bank of India's Central Board of Directors. The official interest rate is the benchmark repurchase
rate. This page includes a chart with historical data for India Interest Rate.
7/28/2019 fundamental analysis project on beml
http://slidepdf.com/reader/full/fundamental-analysis-project-on-beml 47/71

7/28/2019 fundamental analysis project on beml
http://slidepdf.com/reader/full/fundamental-analysis-project-on-beml 48/71
RATIO ANALYSIS
7/28/2019 fundamental analysis project on beml
http://slidepdf.com/reader/full/fundamental-analysis-project-on-beml 49/71
MEANING OF RATIO:-
A ratio is only a comparison of the numerator with the denominator. The tern ratio
reefers to the numerical or quantitative relationship between two figures and obtained by
dividing the former by the latter.
Ratio analysis is an important and age old technique of financial analysis. The data given in
financial statements ratio are relative form of financial data and
v e r y u s e f u l t e c h n i q u e s t o c h e c k u p o n t h e e f f i c i e n c y o f a f i r m
. S o m e r a t i o indicates the trend or progress or downfall of the firm
IMPORTANCE OF RATIO: Ratio analysis of firm’s financial statement is of interest to a number of partiesmainly. Shareholders, creditor, financial executives etc. shareholders are interested withearning capacity of the firm: creditors are interested inknowingt h e a b i l i t y o f f i r m t o m e e t f i n a n c i a l o b l i g a t i o n a n d f i na n c i a l e x e c u t i v e s a r e conce rned wit h evol vi ng ana lyt ical t oo ls t ha t wi llmeasures and compare costs, efficiency liquidity and profitability with a view to makingintelligent decisions.
7/28/2019 fundamental analysis project on beml
http://slidepdf.com/reader/full/fundamental-analysis-project-on-beml 50/71
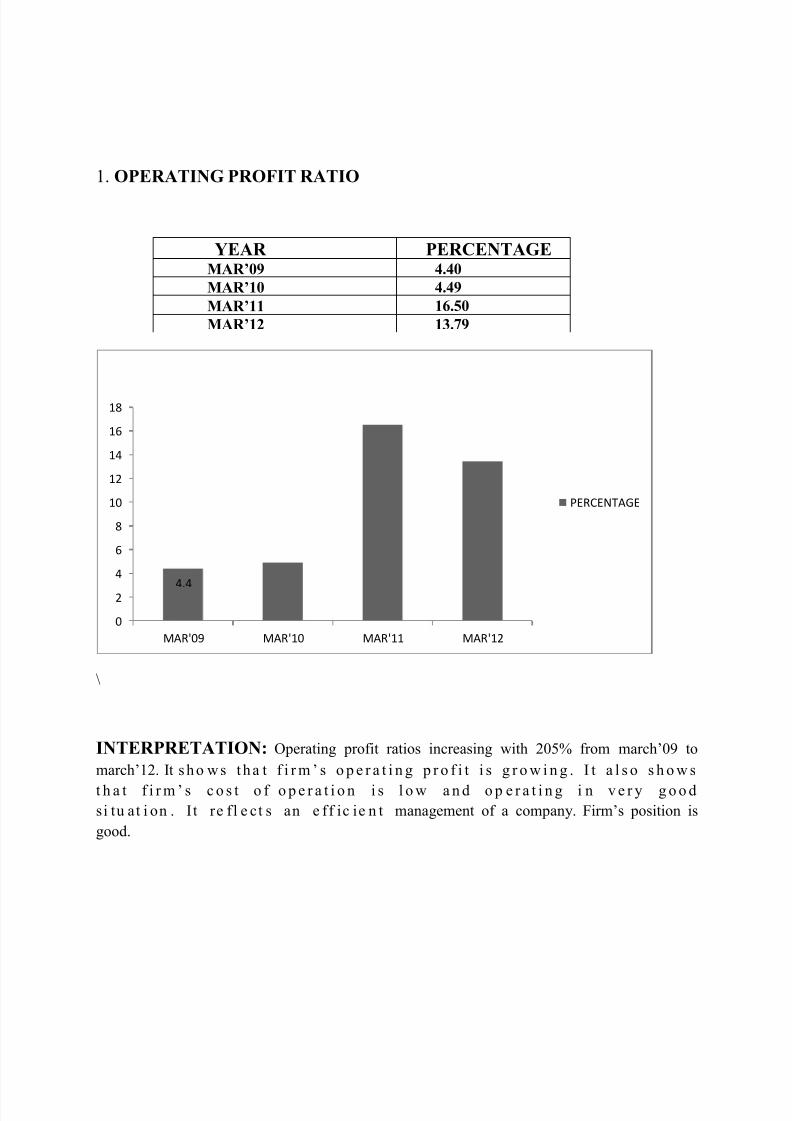
1. OPERATING PROFIT RATIO
YEAR PERCENTAGEMAR’09 4.40
MAR’10 4.49
MAR’11 16.50
MAR’12 13.79
\
INTERPRETATION: Operating profit ratios increasing with 205% from march’09 to
march’12. It s ho ws t ha t f i r m ’ s o p e r a t i n g p r o f i t i s g r o w i n g . I t a l s o s h o w s
t h a t f i r m ’ s c o s t o f o p e r a t i o n i s l o w a n d o p e r a t i n g i n v e r y g o o d
si tu at i on . I t re f l e ct s an e ff ic ie n t management of a company. Firm’s position is
good.
4.4
0
2
4
6
8
10
12
14
16
18
MAR'09 MAR'10 MAR'11 MAR'12
PERCENTAGE

7/28/2019 fundamental analysis project on beml
http://slidepdf.com/reader/full/fundamental-analysis-project-on-beml 51/71
2. GROSS PROFIT RATIO:
YEAR PERCENTAGE
MAR’09 3.16MAR’10 3.18
MAR’11 15.18
MAR’12 12.86
INTERPRETATION: Gross profit ratio shows the relationship between gross
profit and sales .Here gross profit ratio increasing with 306.96% from year 09 to 12.it
indicates that firm’s selling is increasing .it also may continue to grow in future.
It suggests that selling price is competitive and earning good profit by selling
larger vol ume . So it shows that firm’s position is good
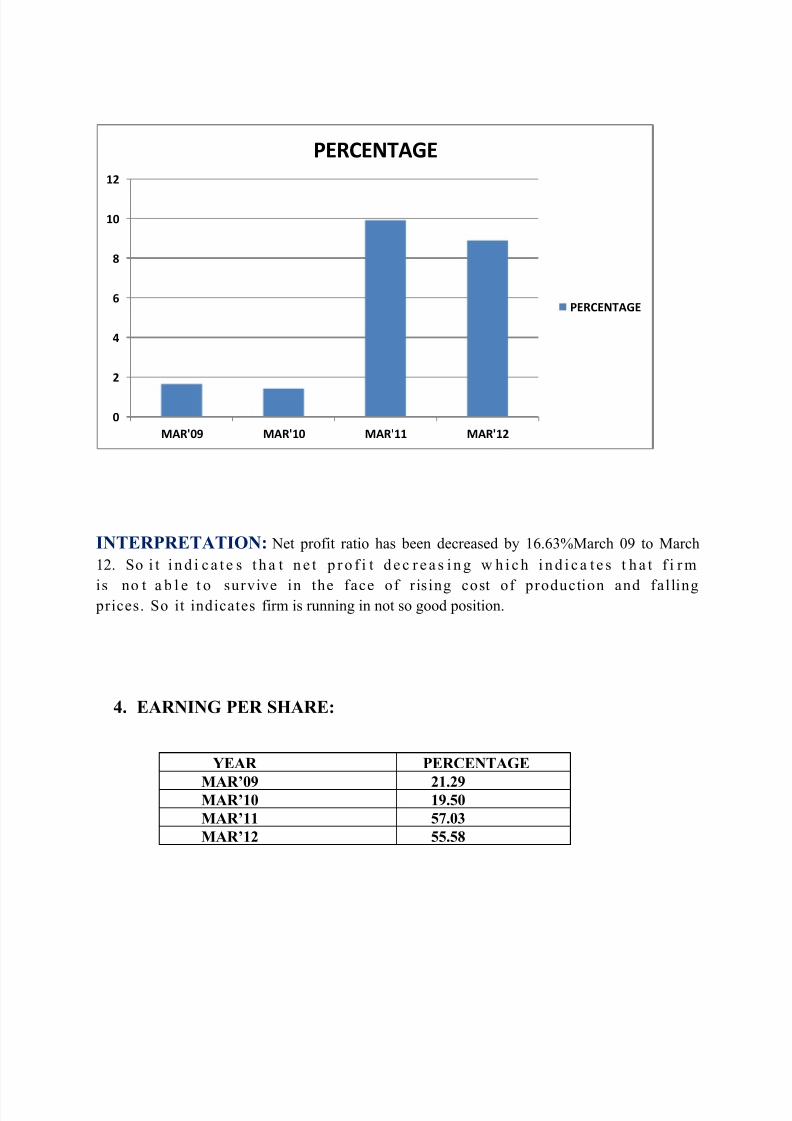
3. NET PROFIT:
YEAR PERCENTAGEMAR’09 1.65
MAR’10 1.42
MAR’11 9.92
MAR’12 8.90
0
2
4
6
8
10
12
14
16
MAR'09 MAR'10 MAR'11 MAR'12
PERCENTAGE
7/28/2019 fundamental analysis project on beml
http://slidepdf.com/reader/full/fundamental-analysis-project-on-beml 52/71
INTERPRETATION: Net profit ratio has been decreased by 16.63%March 09 to March
12. So i t i n d i c a t e s t h a t n e t p r o f i t d e c r e a s i n g w h i c h i n d i c a t e s t h a t f i r m
is no t a b l e t o survive in the face of r is ing cost of production and fal ling prices. So it indicates firm is running in not so good position.
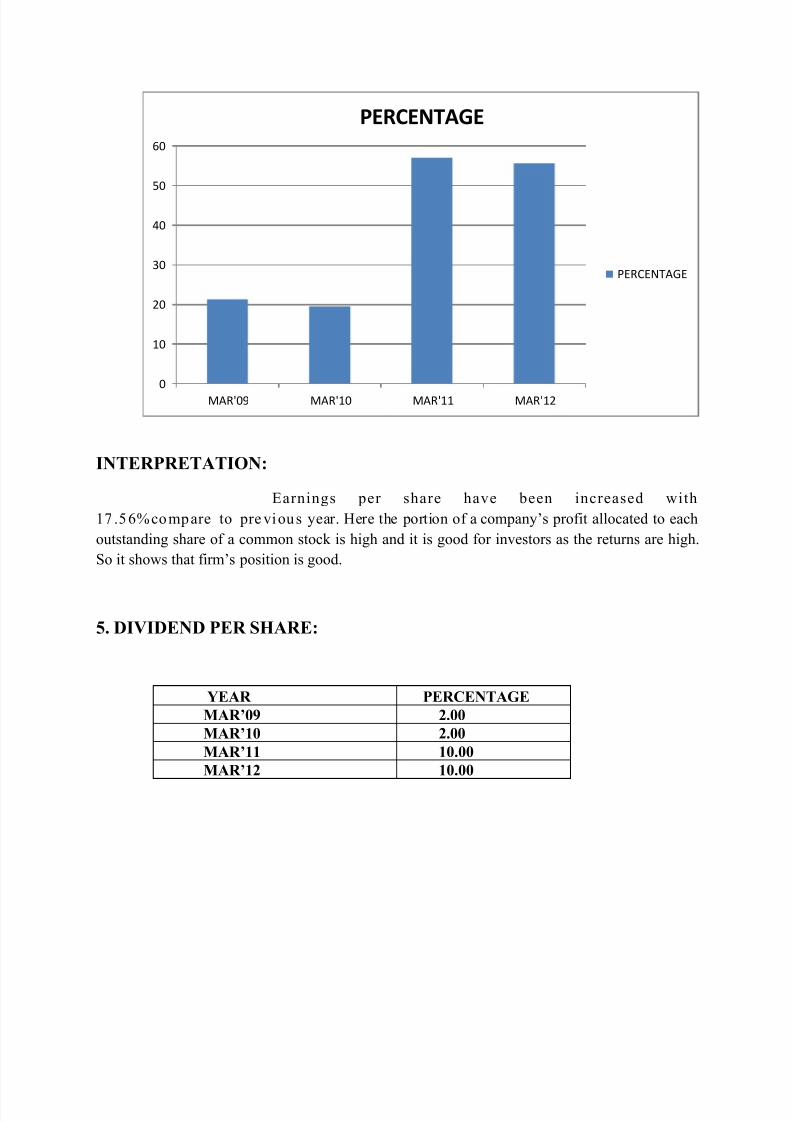
4. EARNING PER SHARE:
YEAR PERCENTAGE
MAR’09 21.29MAR’10 19.50
MAR’11 57.03
MAR’12 55.58
0
2
4
6
8
10
12
MAR'09 MAR'10 MAR'11 MAR'12
PERCENTAGE
PERCENTAGE
7/28/2019 fundamental analysis project on beml
http://slidepdf.com/reader/full/fundamental-analysis-project-on-beml 53/71
INTERPRETATION:
Earnings per share have been increased with
17 .56%compare to pre vious year. Here the portion of a company’s profit allocated to each
outstanding share of a common stock is high and it is good for investors as the returns are high.
So it shows that firm’s position is good.
5. DIVIDEND PER SHARE:
YEAR PERCENTAGE
MAR’09 2.00
MAR’10 2.00
MAR’11 10.00
MAR’12 10.00
0
10
20
30
40
50
60
MAR'09 MAR'10 MAR'11 MAR'12
PERCENTAGE
PERCENTAGE

7/28/2019 fundamental analysis project on beml
http://slidepdf.com/reader/full/fundamental-analysis-project-on-beml 54/71
INTERPRETATION: Dividend per share has been increased with 20% compare
to previous year. Here the portion of a company’s profit allocated to each outstanding share of
a common stock is high and it is good for investors as the returns are high. So it shows that
firm’s position is good.
6. BOOK VALUE PER SHARE:
YEAR PERCENTAGE
MAR’09 2.00
MAR’10 2.00
MAR’11 10.00
MAR’12 10.00
0
2
4
6
8
10
12
MAR'09 MAR'10 MAR'11 MAR'12
PERCENTAGE
PERCENTAGE

7/28/2019 fundamental analysis project on beml
http://slidepdf.com/reader/full/fundamental-analysis-project-on-beml 55/71
INTERPRETATION:
Book value per share has been increased 500% from March 09 to
March012and 20% from the previous year. So book value per share also increased. So it
indicates good sign for investors and shows good position of a firm.
7. CURRENT RATIO:
YEAR PERCENTAGE
MAR’09 1.33
MAR’10 1.39
MAR’11 1.48
MAR’12 1.59
0
2
4
6
8
10
12
MAR'09 MAR'10 MAR'11 MAR'12
PERCENTAGE
PERCENTAGE

7/28/2019 fundamental analysis project on beml
http://slidepdf.com/reader/full/fundamental-analysis-project-on-beml 56/71
INTERPRETATION: Current ratio is 1.71 which is near about ideal criteria 2:1.it reflects
that company can easily able to meet short term obligation as a measure of current financial
liquidity.
8. QUICK RATIO:
YEAR PERCENTAGEMAR’09 0.71
MAR’10 0.89
MAR’11 1.00
MAR’12 1.05
1.2
1.25
1.3
1.35
1.4
1.45
1.5
1.55
1.6
1.65
MAR'09 MAR'10 MAR'11 MAR'12
PERCENTAGE
PERCENTAGE

7/28/2019 fundamental analysis project on beml
http://slidepdf.com/reader/full/fundamental-analysis-project-on-beml 57/71
INTERPRETATION: An ideal criterion to test liquidity of a firm is 1:1 and here
quick ratio lies near about this ratio in 2012. So it indicates that liquidity position of a firm is
near about satisfactory.
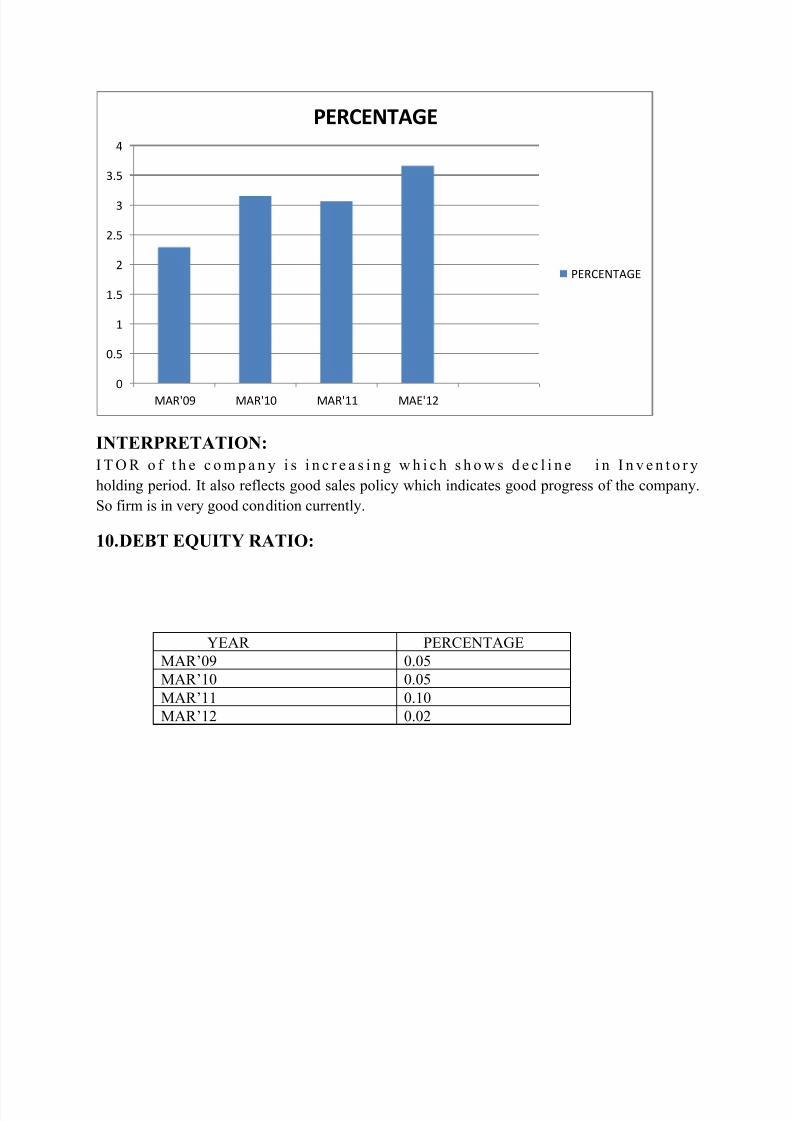
9. INVENTORY TURNOVER RATIO:
YEAR PERCENTAGE
MAR’09 2.29
MAR’10 3.15
MAR’11 3.06
MAR’12 3.49
0
0.2
0.4
0.6
0.8
1
1.2
MAR'09 MAR'10 MAR'11 MAR'12
PERCENTAGE
PERCENTAGE
7/28/2019 fundamental analysis project on beml
http://slidepdf.com/reader/full/fundamental-analysis-project-on-beml 58/71
INTERPRETATION:
I T O R o f t h e c o m p a n y i s i n c r e a s i n g w h i c h s h o w s d e c l i n e i n I n v e n t o r y
holding period. It also reflects good sales policy which indicates good progress of the company.
So firm is in very good condition currently.
10. DEBT EQUITY RATIO:
YEAR PERCENTAGE
MAR’09 0.05
MAR’10 0.05
MAR’11 0.10
MAR’12 0.02
0
0.5
1
1.5
2
2.5
3
3.5
4
MAR'09 MAR'10 MAR'11 MAE'12
PERCENTAGE
PERCENTAGE

7/28/2019 fundamental analysis project on beml
http://slidepdf.com/reader/full/fundamental-analysis-project-on-beml 59/71
INTERPRETATION: I t i s u s e d t o m e a s u r e l o n g - t e r m s o l v e n c y p o s i t i o n
o f a c o n c e r n . H e r e d e b t / e q u i t y r a t i o i s d e c l i n i n g w h i c h i s g o o d f o r a
c o m p a n y . I t a l s o s h o w s t h a t company’s policies are sound.
11. DIVIDEND PAYOUT RATIO:
YEAR PERCENTAGE
MAR’09 1.33
MAR’10 1.39
MAR’11 1.48
MAR’12 1.59
0
0.02
0.04
0.06
0.08
0.1
0.12
MAR'09 MAR'10 MAR'11 MAR'12
percentage
percentage

7/28/2019 fundamental analysis project on beml
http://slidepdf.com/reader/full/fundamental-analysis-project-on-beml 60/71
INTERPRETATION:
Divide nd payout ratio has been increase d b y 7.5 4% wh ich shows that percentage of
income has been issued to the owner at the end of the year. Here it has been increasing
with 7.5 4% tha t shows good retu rns for the investo rs. So firm is able to meet
investors expectation.
12. RETURN ON LONG TERM FUNDS:
YEAR PERCENTAGE
MAR’09 12.10
MAR’10 13.01
MAR’11 39.40
MAR’12 33.37
1.2
1.25
1.3
1.35
1.4
1.45
1.5
1.55
1.6
1.65
MAR'09 MAR'10 MAR'11 MAR'12
PERCENTAGE
PERCENTAGE

7/28/2019 fundamental analysis project on beml
http://slidepdf.com/reader/full/fundamental-analysis-project-on-beml 61/71
INTERPRETATION: Company’s return on long term funds has been increased
w i t h 1 2 6 . 3 0 % f r o m 0 3 t o 1 2 . i t s h o w s t h a t c o m p a n y i s g e t t i n g h i g h
r e t u r n o n t o t a l capital employed. It shows that firm is operating in very good condition.
13. P/E RATIO:
YEAR PERCENTAGEMAR’09 2.76
MAR’10 9.01
MAR’11 6.42
MAR’12 30.24
0
5
10
15
20
25
30
35
40
45
MAR'09 MAR'10 MAR'11 MAR'12
PERCENTAGE
PERCENTAGE

7/28/2019 fundamental analysis project on beml
http://slidepdf.com/reader/full/fundamental-analysis-project-on-beml 62/71
INTERPRETATION: Company’s price earnings ratio has been decreased from the
previous year so it shows that its market price compared to earnings per share is low so it is not
good sign for the firm. So firm is not operating in very good condition.
TREND ANALYSIS
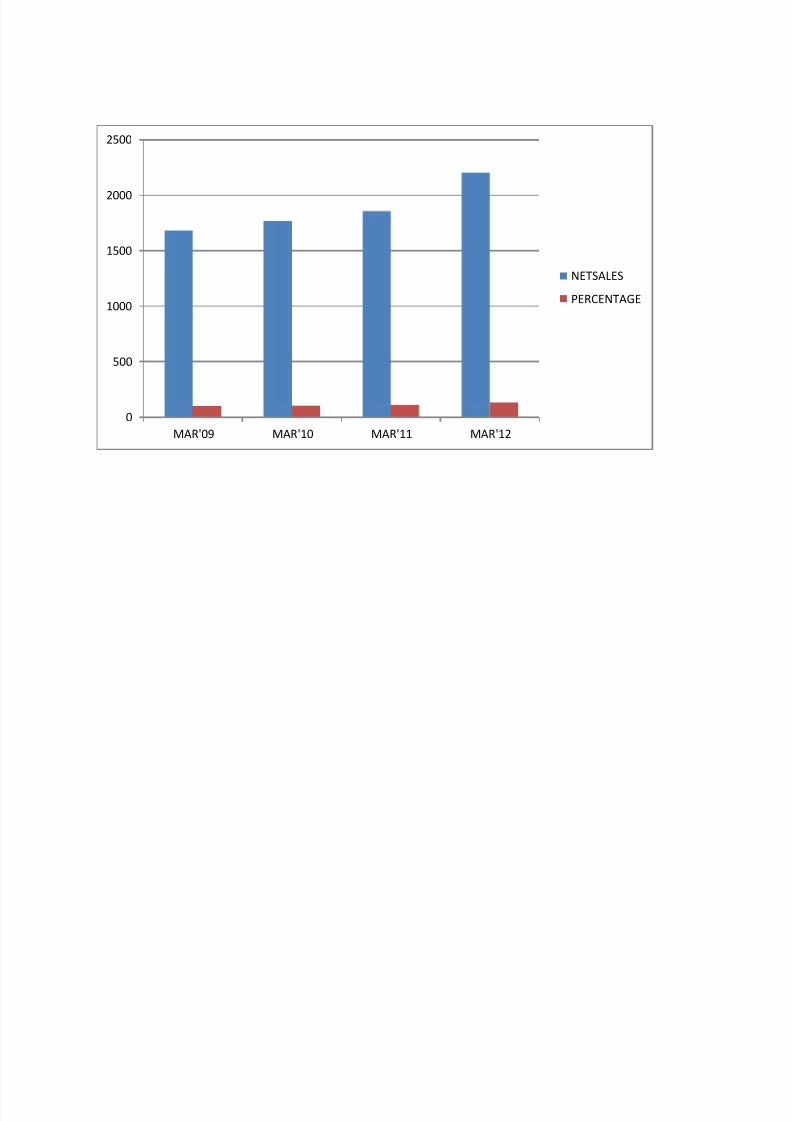
NET SALES:
YEAR NET SALES (RS. IN CR.) PERCENTAGE
MAR’09 1681.17 100
MAR’10 1765.75 105.03
MAR’11 1856.01 110.40
MAR’12 2201.65 130.96
0
5
10
15
20
25
30
35
MAR'09 MAR'10 MAR'11 MAR'12
PERCENTAGE
PERCENTAGE
7/28/2019 fundamental analysis project on beml
http://slidepdf.com/reader/full/fundamental-analysis-project-on-beml 63/71
0
500
1000
1500
2000
2500
MAR'09 MAR'10 MAR'11 MAR'12
NETSALES
PERCENTAGE

7/28/2019 fundamental analysis project on beml
http://slidepdf.com/reader/full/fundamental-analysis-project-on-beml 64/71
VALUATION OF SECURITIES:
YEAR DIVIDEND PER SHARE(RS) GROWTH RATE(%)
MAR’09 2 0%MAR’10 2 0%
MAR’11 10 400.00%
MAR’12 10 0.00
TOTAL 400.00%
AVERAGE ANNUAL GROWTH RATE (g) =420/4
=105%
D1=D0 (1+g)
=12(1+1.05)
=12(2.05)
=24.6 Rs.
P1= (273.45+114)/2
=193.73
Ke = (D1/P1) +g
= (5.86/193.73)+1.17
=1.20%
Po= D1/(Ke-g)
=5.86/(1.20-1.17)
=5.86/0.03
=195.33 Rs.
CURRENT MARKET PRICE (C0) = 185.85 Rs.
Where,

7/28/2019 fundamental analysis project on beml
http://slidepdf.com/reader/full/fundamental-analysis-project-on-beml 65/71
DI= Expected dividend of next year
P1= Average of 52 weeks high – low
Ke= investors required rate of return
Po= Expected price of share
C u r r e n t m a r k e t p r i c e ( C 0 ) o f t h e s h a r e i s l o w e r t h a n E x p e c t e d
p r i c e o f Share (P0).Here share price is undervalued so investors are advised to buy the share
of the company.

7/28/2019 fundamental analysis project on beml
http://slidepdf.com/reader/full/fundamental-analysis-project-on-beml 66/71
LIMITATIONS OF THE PROJECT:
1. As the data available to me has been taken from the secondary sources (like internet). It is
not sure that collected data are accurate and complete.
2. Because of the time limitations, it may be possible that some important data are left out.
3. As the time available was very less, so fundamental analysis has been done for four
years.
4. Today’s stock market is totally running on the investors perception so the conclusion
derived on the basis if fundamental analysis would not viable in long run.
5. The study was confined only to one particular sector.
6. The study was done for a short period of time, which might not hold true over a long
period of time.

7/28/2019 fundamental analysis project on beml
http://slidepdf.com/reader/full/fundamental-analysis-project-on-beml 67/71
FINDINGS:
1. BEML has good earnings per share so it indicates good sign for investors.
2. BEML has also very good condition so far as liquidity is concerned. So it reflects that the
firm position is good.
3. BEML has good financial liquidity. So it able to meet current financial requirement.
4. BEML’s P/E ratio is high so it shows good earnings and in very good position.

7/28/2019 fundamental analysis project on beml
http://slidepdf.com/reader/full/fundamental-analysis-project-on-beml 68/71
SUGGESTIONS:
SUGGESTIONS FOR INVESTORS

7/28/2019 fundamental analysis project on beml
http://slidepdf.com/reader/full/fundamental-analysis-project-on-beml 69/71
CONCLUSION:
1. BEML is acting as pioneer in the markets of the earth moving equipments. The company
has grown progressively and shown tremendous profit since its inception.
2. BEML has good earnings per share so it indicates good sign for investors.
3. BEML has also very good condition so far as liquidity is concerned. So it reflects that thefirm position is good.
4. BEML has good financial liquidity. So it able to meet current financial requirement.
5. BEML’s P/E ratio is high so it shows good earnings and in very good position
6 . C u r r e n t m a r k e t p r i c e ( C 0 ) o f t h e s h a r e i s l o w e r t h a n E x p e c t e d
p r i c e o f Share (P0).Here share price is undervalued so investors are advised to buy the share
of the company

7/28/2019 fundamental analysis project on beml
http://slidepdf.com/reader/full/fundamental-analysis-project-on-beml 70/71

7/28/2019 fundamental analysis project on beml
http://slidepdf.com/reader/full/fundamental-analysis-project-on-beml 71/71