fundamental and technical analysis of equities
Post on 22-Oct-2014
30.406 views
DESCRIPTION
TRANSCRIPT

1
2
Chapter- 1 EXECUTIVE SUMMERY
Why should I put my hard earned money into shares when I am not sure of a return?
If there’s a science to investing then why do we call investing a risk? And if it’s not a risk,
then why do people end up losing money from their investments in shares? In this project
report I have tried to answer the questions you might have about investing in shares. When is
investing in shares a risk and when does it become a science? How can you be assured that
your investment in shares is safe?
And more importantly, I’ve tried to explain some basic concepts that most investors take for
granted but that are crucial knowledge for a person just entering into the financial jungle. So
concepts like risk premium, dividend, stock split etc have been explained in a simple manner
for the benefit of the first-timers. Not only that this project report also seeks to educate the
would-be investors in the various aspects of share trading, both offline and online. I hope the
project report shall succeed in satisfying your desire for knowledge of the share market as
well as in lending investor a helping hand as they take your FIRST STEP into the world of
investing.
Main purpose of investment is returns and liquidity, share market is less preferred by
investors due to lack of awareness. The major findings of this study are that people are
interested to invest in stock market but they lack knowledge.
“CRITICAL SUCCESS FACTORS THAT COMES OUT OF THE
STUDY AS FOLLOWS” (1) Importance of information- timely and accurately.
(2) Responsiveness of the company.
(3) Implementation.
(4) Forecasting.
These all are helpful to increase the successive factors which find out during the working
positions.
The primary approach to study was exploratory research and descriptive research was
also carried out.

3
4
Chapter- 2
Company Profile
Share khan Ltd. is one of the leading retail brokerage of Citi Venture which is running
successfully since 1922 in the country. Earlier it was the retail broking arm of the Mumbai-
based SSKI Group, which has over eight decades of experience in the stock broking
business. Sharekhan offers its customers a wide range of equity related services including
trade execution on BSE, NSE, Derivatives, depository services, online trading, investment
advice etc.
MR.VARUN SHAH CEO- SHARE KHAN
The mission and vision of share khan Ltd. is to serve investor with the content-rich and
research oriented portal has stood out among its contemporaries because of its steadfast
dedication to offering customers best-of-breed technology and superior market information.
The objective has been to let customers make informed decisions and to simplify the process
of investing in stocks.
Business area : 1- Equity Trading Platform (Online/Offline).
2- Commodities Trading Platform (Online/Offline).
3- Portfolio Management Service.
4- Mutual Fund Advisory and Distribution.
5- Insurance Distribution. (Give details about the nature of the business)
5
History of share khan Ltd. Earlier with a legacy of more than 80 years in the stock markets, the SSKI group ventured
into institutional broking and corporate finance 18 years ago. SSKI is one of the leading
players in institutional broking and corporate finance activities.
SSKI holds a sizeable portion of the market in each of these segments. SSKI’s institutional
broking arm accounts for 7% of the market for Foreign Institutional portfolio investment and
5% of all Domestic Institutional portfolio investment in the country.
Major Competitors in market place
KARVY
Is a premier integrated financial services provider, and ranked among the top five in the
country in all its business segments, services over 16 million individual investors in various
capacities, and provides investor services to over 300 corporate, comprising the who is who
of Corporate India. Karvy has a professional management team and ranks among the best in
technology, operations and research of various industrial segments. The birth of Karvy was
on a modest scale in 1981. It began with the vision and enterprise of a small group of
practicing Chartered Accountants who founded the flagship company, Karvy Consultants
Limited. They started with consulting and financial accounting automation and carved
inroads into the field of registry and share accounting by 1985. Since then, karvy utilized its
experience and superlative expertise to go from strength to strength, to better their services, to
innovate, diversify and in the process, evolved as one of India’s premier integrated financial
service enterprise.
PRODUCT AND SERVICES OF KARVY GROUP
1. Karvy comtrade.
2. Karvy consultant ltd.
3. Karvy merchant banking.
4. Karvy global services ltd.
6
ICICI DIRECT
ICICI Web Trade Limited (IWTL) maintains www.icicidirect.com (herein after referred to as
the "Website") whereas IWTL is an affiliate of ICICI Bank Limited and the Website is owned
by ICICI Bank Limited. IWTL has launched and established an online trading service on the
Website.
PRODUCTS AND SERVICES OF ICICI DIRECT
1. Investing in Mutual funds
2. Personal Finance
3. Customer Service Features
4. IPO’s
5. Margin Trading
6. Margin PLUS Trading
7. Call Trade
8. Trading on NSE/BSE
9. Trade in derivative
INDIAINFOLINE SECURITY PRIVATE LTD.
India Infoline.com Securities Pvt. Ltd. is a wholly owned subsidiary of India Infoline.com
Ltd and is the stock broking arm of India Infoline.com. The subsidiary was formed to comply
with regulatory guidelines. www.5paisa.com is a focused website for online stock market
trading. 5paisa.com is a trade name owned by the India Infoline.com group. IILSPL has
applied for trading membership of the BSE under Securities and Exchange Board of India
(Stock Brokers and Sub-Brokers) Rules 1992. IILSPL is in the business of providing broking
services online via the Internet ("E-broking Services") and has been permitted by the NSE by
way of registration permission no: NSEIL/CMO/INET/1103/2000 dated 03/July/2000, and
7
will be applying for permission to the BSE, to provide E-broking Services to its clients.
IILSPL is a TRADING MEMBER of the National Stock Exchange of India.
PRODUCT OFFERED BY IILSPL
Stock market:-IILSPL deals in stock market by trading in equity and derivatives.
Personal finance:- It Deals In Mutual Fund And Insurance.
Online Trading :- It provides services in stock and commodity trading (through Internet).
HDFC SECURITY
HDFC security is the subsidiary of HDFC (Housing Development Financial Corporation).
www.hdfcsec.com would have an exclusive discretion to decide the customers who would be
entitled to its online investing services. www.hdfcsec.com also reserves the right to decide on
the criteria based on which customers would be chosen to participate in these services .The
present web site (www.hdfcsec.com) contains features of services that they offer/propose to
offer in due course. The launch of new services is subject to the clearance of the regulators.
i.e. SEBI, NSE and BSE.
PRODUCT OFFERED BY HDFC SECURITY
• Online trading for Resident & Non Resident Indians.
• Cash-n-Carry on both NSE and BSE.
• Day trading on both NSE and BSE.
• Trade on Futures & Options on the NSE.
• Online IPO's.
• Telephone-based Broking (Equity & Derivatives).
INDIABULLS SECURITIES LIMITED: Indiabulls Securities Limited was incorporated as GPF Securities Private Limited on June 9,
1995. The name of the company was changed to Orbis Securities Private Limited on
December 15, 1995 to change the profile of the company and subsequently due to the
8
conversion of the company into a public limited company; the name was further changed to
Orbis Securities Limited on January 5, 2004. The name of the company was again changed to
Indiabulls Securities Limited on February 16, 2004 so as to capitalize on the brand image of
the term “Indiabulls” in the company name. ISL is a corporate member of capital market &
derivative segment of The National Stock Exchange of India Ltd. At present, ISL accounts
for approximately 3% of the total daily turnover of the Exchange with 32,359 client
relationships and 70 branches spread across the country as of April 30, 2004.
PRODUCT OFFERED BY INDIA BULLS
Equity & Debt Stock Broking
Insurance
Commodity trading
Depository Services
Derivatives Broking Services
Equity Research Services
Mutual Fund Distribution
IPO Distribution
Staff Strength
Experience SSKI has more than eight decades of trust and credibility in the Indian stock market.
In the Asia Money broker's poll held recently, SSKI won the 'India's best broking
house for 2004' award. Ever since it launched Sharekhan as its retail broking division
in February 2000, it has been providing institutional-level research and broking
services to individual investors.
Technology With their online trading account one can buy and sell shares in an instant from any
PC with an internet connection. Customers get access to the powerful online trading
tools that will help them to take complete control over their investment in shares.
9
Accessibility Sharekhan provides ADVICE, EDUCATION, TOOLS AND EXECUTION services
for investors. These services are accessible through many centers across the country
(Over 650 locations in 150 cities), over the Internet (through the website
www.sharekhan.com) as well as over the Voice Tool.
Knowledge In a business where the right information at the right time can translate into direct
profits, investors get access to a wide range of information on the content-rich portal,
www.sharekhan.com. Investors will also get a useful set of knowledge-based tools
that will empower them to take informed decisions.
Convenience One can call Sharekhan’s Dial-N-Trade number to get investment advice and execute
his/her transactions. They have a dedicated call-center to provide this service via a
Toll Free Number 1800-22-7500 & 39707500 from anywhere in India.
Dedicated to Customer for Service Its customer service team assist their customer for any help that they need relating to
transactions, billing, demat and other queries. Their customer service can be contacted
via a toll-free number, email or live chat on www.sharekhan.com.
Analytical Investment Advice Sharekhan has dedicated research teams of more than 30 people for fundamental and
technical research. Their analysts constantly track the pulse of the market and provide
timely investment advice to customer in the form of daily research emails, online
chat, printed reports etc.
10
Turnover:
The sharekhan has placed over US$ 5 billion in private equity deals and It has 60 institutional
clients spread over India, Far East, UK and US. Foreign Institutional Investors generate about
65% of the organization’s revenue, with a daily turnover of over US$ 2 million.
In India 620 share shops across 280 cities, 3,68,000 customers & growing with 500 account
opening per day, online business is 47% and 3,000employees .At present entire company
processing 2, 30,000 transaction in a day and 3500 funds paying/payouts per day. And
company expecting 7, 50,000 transaction per day in future.

11

12
Chapter-3
Project Detail “This study suggest that people are reluctant while investing in stock market
due to lack of knowledge”
This is the project on the analyzing of equities to invest the money to future for get higher
return on investment. This project report to all investor who want to invest their money in
equities. But they should analysis the securities before to invest because the money has very
much value in our life. I chose this project to do because I want to analysis the equities for
investor point of view so they can get good return in future, want to do fundamental and
technical analysis of securities through the various theories, try to understand the movement
and performance of stocks and also try to know the factors that affect the movement of stock
prices in the Indian Stock Markets.
Through this project we were also able to understand, what are our Company’s (Sharekhan
Ltd.) positive and strong points, on the basis of which we come to know what can be the basis
of pitching to a potential client. We also gave suggestions to the company, what improvement
can be done to our product.

13
Fundamental analysis and technical analysis can co-exist in peace and complement each
other. Since all the investors in the stock market want to make the maximum profits possible,
they just cannot afford to ignore either fundamental or technical analysis
Team:
This my solo project assign by project guide and whole staff of that branch. I did my analysis
with relation manager.
Duration:
The time was very crucial factor in project report the training was for six week so I spent as
much as time to learn from the internship and prepare this report to share my golden time
with you.
Key Deliverables: The company was expecting to me to dedication for project, queries about project to fill the
tank as much as I can and discipline in branch office as they follow.
PROJECT- MY ROLE
I did my project on the basis of topic given by the project guide in this project I contribute my
best that I can do. I decide to choose some stock listed in NSE for fundamental and technical
analysis. I approach my project guide and whole staff person to get knowledge. I sought out
my queries with discussion with all staff members and my project guide. I note all important
figures and facts about financial market and update my project report Step by step
Achievements:
The main achievement during the entire project was the knowledge about the financial
market which was unseen for me. Successfully finishing project analysis by my self and the
compliment by project guide was best achievement for me in that entire project.

14
Key Learning's: A proper interaction with staff members and project guide to gain knowledge is require for a
good internship. I learn how to analysis the equities for investing money.
Challenges Faced:
• Busy schedule of project guide. I had to wait whole day to talk to him about project.
• There was no operational work in branch for me.
Reasons for Success: Success story of this project is my dedication, passion, good relationship with all staff
members and assistance of my project guide.

15
16
Chapter-4
Introduction
FUNDAMENTAL ANALYSIS
Fundamental analysis refers to the study of the core underlying elements that influence the
economy of a particular entity. It is a method of study that attempts to predict price action and
market trends by analyzing economic indicators, government policy and societal factors (to
name just a few elements) within a business cycle framework.
1. POLITICO-ECONOMIC ANALYSIS: No industry or company can exist in isolation. It may have splendid managers and a
tremendous product. However, its sales and its costs are affected by factors, some of which
are beyond its control - the world economy, price inflation, taxes and a host of others. It is
important, therefore, to have an appreciation of the politico-economic factors that affect an
industry and a company.
The political equation
A stable political environment is necessary for steady, balanced growth. If a country is ruled
by a stable government which takes decisions for the long-term development of the country,
industry and companies will prosper.
Foreign Exchange Reserves
A country needs foreign exchange reserves to meet its commitments, pay for its imports and
service foreign debts.
Foreign Exchange Risk
This is a real risk and one must be cognizant of the effect of a revaluation or devaluation of
the currency either in the home country or in the country the company deals in.
Restrictive Practices
Restrictive practices or cartels imposed by countries can affect companies and industries.
17
Crystallizing the exposure.
Foreign Debt and the Balance of Trade
Foreign debt, especially if it is very large, can be a tremendous burden on an economy. India
pays around $ 5 billion a year in principal repayments and interest payments.
Inflation
Inflation has an enormous effect in the economy. Within the country it erodes purchasing
power. As a consequence, demand falls. If the rate of inflation in the country from which a
company imports is high then the cost of production in that country will automatically go up.
The Threat of Nationalization
The threat of nationalization is a real threat in many countries – the fear that a company may
become nationalized.
Interest Rates
A low interest rate stimulates investment and industry. Conversely, high interest rates result
in higher cost of production and lower consumption.
Taxation
The level of taxation in a country has a direct effect on the economy. If tax rates are low,
people have more disposable income.
Government Policy
Government policy has a direct impact on the economy. A government that is perceived to be
pro-industry will attract investment.
2. INDUSTRY ANALYSIS The importance of industry analysis is now dawning on the Indian investor as never before.
BUSINESS CYCLE
18
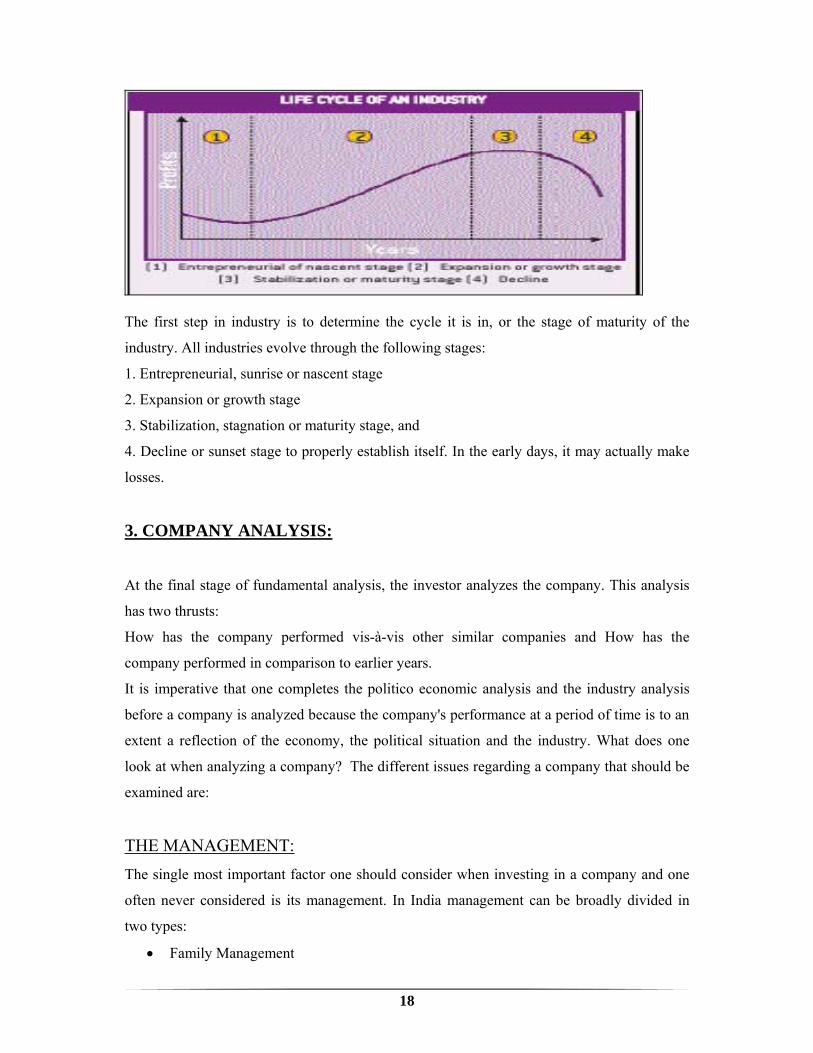
The first step in industry is to determine the cycle it is in, or the stage of maturity of the
industry. All industries evolve through the following stages:
1. Entrepreneurial, sunrise or nascent stage
2. Expansion or growth stage
3. Stabilization, stagnation or maturity stage, and
4. Decline or sunset stage to properly establish itself. In the early days, it may actually make
losses.
3. COMPANY ANALYSIS:
At the final stage of fundamental analysis, the investor analyzes the company. This analysis
has two thrusts:
How has the company performed vis-à-vis other similar companies and How has the
company performed in comparison to earlier years.
It is imperative that one completes the politico economic analysis and the industry analysis
before a company is analyzed because the company's performance at a period of time is to an
extent a reflection of the economy, the political situation and the industry. What does one
look at when analyzing a company? The different issues regarding a company that should be
examined are:
THE MANAGEMENT: The single most important factor one should consider when investing in a company and one
often never considered is its management. In India management can be broadly divided in
two types:
• Family Management
19
• Professional Management
THE COMPANY:
An aspect not necessarily examined during an analysis of fundamentals is the company. A
company may have made losses consecutively for two years or more and one may not wish to
touch its shares - yet it may be a good company and worth purchasing into. There are several
factors one should look at.
1. How a company is perceived by its competitors?
One of the key factors to ascertain is how a company is perceived by its competitors. It is
held in high regard. Its management may be known for its maturity, vision, competence and
aggressiveness. The investor must ascertain the reason and then determine whether the reason
will continue into the foreseeable future.
2. Whether the company is the market leader in its products or in its segment
Another aspect that should be ascertained is whether the company is the market leader in its
products or in its segment. When you invest in market leaders, the risk is less. The
Shares of market leaders do not fall as quickly as those of other companies. There is a magic
to their name that would make individuals prefer to buy their products as opposed to others.
3. Company Policies
The policy a company follows is also important. What are its plans for growth? What is its
vision? Every company has a life. If it is allowed to live a normal life it will grow up to a
point and then begin to level out and eventually die. It is at the point of leveling out that it
must be given new life. This can give it renewed vigor and a new lease of life.
4. Labour Relations
Labour relations are extremely important. A company that has motivated, industrious work
force has high productivity and practically no disruption of work. On the other hand, a
company that has bad industrial relations will lose several hundred man-day’s as a
consequence of strikes and go slows.
20
5. Where the company is located and where its factories are?
One must also consider where the companies Plants and Factories are located..
THE ANNUAL REPORT:
The primary and most important source of information about a company is its Annual Report.
By law, this is prepared every year and distributed to the shareholders. Annual Reports are
usually very well presented. A tremendous amount of data is given about the performance of
a company over a period of time.
The Annual Report is broken down into the following specific parts:
A) The Director's Report,
B) The Auditor's Report,
C) The Financial Statements, and
D) The Schedules and Notes to the Accounts.
A. The Director’s Report
The Director’s Report is a report submitted by the directors of a company to its shareholders,
advising them of the performance of the company under their stewardship.
1. It enunciates the opinion of the directors on the state of the economy and the political
situation vis-à-vis the company.
2. Explains the performance and the financial results of the company in the period under
review. This is an extremely important part. The results and operations of the various separate
divisions are usually detailed and investors can determine the reasons for their good or bad
performance.
3. The Director’s Report details the company's plans for modernization, expansion and
diversification. Without these, a company will remain static and eventually decline.
4. Discusses the profit earned in the period under review and the dividend. Recommended by
the directors. This paragraph should normally be read with some skepticism, as the directors
will always argue that the performance was satisfactory. If adverse economic conditions are
usually at fault.
5. Elaborates on the directors' views of the company's prospects in the future.
21
6. Discusses plans for new acquisition and investments. An investor must intelligently
evaluate the issues raised in a Director’s Report. Industry conditions and the management's
knowledge of the business must be considered.
B. The Auditor's Report
The auditor represents the shareholders and it is his duty to report to the shareholders and the
general public on the stewardship of the company by its directors. Auditors are required to
report whether the financial statements presented do, in fact, present a true and fair view of
the state of the company. Investors must remember that the auditors are their representatives
and that they are required by law to point out if the financial statements are not true and fair..
C. Financial Statements
The published financial statements of a company in an Annual Report consist of its Balance
Sheet as at the end of the accounting period detailing the financing condition of the company
at that date, and the Profit and Loss Account or Income Statement summarizing the activities
of the company for the accounting period.
BALANCE SHEET
The Balance Sheet details the financial position of a company on a particular date; of the
company's assets (that which the company owns), and liabilities (that which the company
owes), grouped logically under specific heads. It must however, be noted that the Balance
Sheet details the financial position on a particular day and that the position can be materially
different on the next day or the day after.
SOURCES OF FUNDS
SHAREHOLDERS FUNDS
SHARE CAPITAL
(i) Private Placement
(ii) Public Issue
iii) Rights issues
RESERVES
22
i) Capital Reserves
ii) Revenue Reserves
LOAN FUNDS
i) Secured loans:
ii) Unsecured loans
FIXED ASSETS
INVESTMENTS
STOCK OR INVENTORIES
i) Raw materials
ii) Work in progress
iii) Finished goods
CASH AND BANK BALANCES
LOANS AND ADVANCES
PROFIT AND LOSS ACCOUNT
The Profit and Loss account summarizes the activities of a company during an accounting
period which may be a month, a quarter, six months, a year or longer, and the result achieved
by the company. It details the income earned by the company, its cost and the resulting profit
or loss. It is, in effect, the performance appraisal not only of the company but also of its
management- its competence, foresight and ability to lead.
RATIOS:
Ratios express mathematically the relationship between performance figures and/or
assets/liabilities in a form that can be easily understood and interpreted.
No single ratio tells the complete story
Ratios can be broken down into four broad categories:
(A) Profit and Loss Ratios
(B) These show the relationship between two items or groups of items in a profit and loss
account or income statement. The more common of these ratios are:
23
1. Sales to cost of goods sold.
2. Selling expenses to sales.
3. Net profit to sales and
4. Gross profit to sales.
(B) Balance Sheet Ratios
These deal with the relationship in the balance sheet such as :
1. Shareholders equity to borrowed funds.
2. Current assets to current liabilities.
3. Liabilities to net worth.
4. Debt to assets and
5. Liabilities to assets.
(C) Balance Sheet and Profit and Loss Account Ratios.
These relate an item on the balance sheet to another in the profit and loss account such as:
1. Earnings to shareholder's funds.
2. Net income to assets employed.
3. Sales to stock.
4. Sales to debtors and
5. Cost of goods sold to creditors.
(D) Financial Statements and Market Ratios
These are normally known as market ratios and are arrived at by relative financial figures to
market prices:
1. Market value to earnings and
2. Book value to market value.
(a) Market value
(b) Earnings
(c) Profitability
(d) Liquidity
(e) Leverage
(f) Debt Service Capacity
(g) Asset Management/Efficiency
24
(h) Margins.
The major ratios that are considered:
(i) Market value
(ii) Price- earnings ratio
(iii) Market-to-book ratio
(iv) Earnings
(v) Earning per share
(vi) Dividend per share
(vii) Dividend payout ratio
(viii) Leverage ratios
(ix) Return on investments/total assets
CASH FLOW:
A statement of sources and uses begins with the profit for the year to which are added the
increases in liability accounts (sources) and from which are reduced the increases in asset
accounts (uses). The net result shows whether there has been an excess or deficit of funds and
how this was financed. Investors must examine a company's cash flow as it reveals exactly
where the money came from how it was utilized. Investors must be concerned if a company is
financing either its inventories or paying dividends from borrowings without real growth as
that shows deterioration.
25
TECHNICAL ANALYSIS
Technical analysis is concerned with predicting future price trends from historical price and
volume data. The underlying axiom of technical analysis is that all fundamentals (including
expectations) are factored into the market and are reflected in exchange rates.
It is also a method of predicting price movements and future market trends by studying charts
of past market action which take into account price of instruments, volume of trading and,
where applicable, open interest in the instruments.
Stock Charts Stock charts gained popularity in the late 19th Century from the writings of Charles H. Dow
in the Wall Street Journal. His comments, later known as "Dow Theory", alleged that markets
move in all kinds of measurable trends and that these trends could be deciphered and
predicted in the price movement seen on all charts.
A stock chart is a simple two-axis (x-y) plotted graph of price and time. Each individual
equity, market and index listed on a public exchange has a chart that illustrates this
movement of price over time. Individual data plots for charts can be made using the
CLOSING price for each day. The plots are connected together in a single line, creating the
graph. Also, a combination of the OPENING, CLOSING, HIGH and/or LOW prices for
that market session can be used for the data plots. This second type of data is called a PRICE
BAR. Individual price bars are then overlaid onto the graph, creating a dense visual display
of stock movement.
Stock charts can be created in many different time frames. Mutual fund holders use monthly
charts in which each individual data plot consists of a single month of activity. Day traders
use 1 minute and 5 minute stock charts to make quick buy and sell decisions. The most
common type of stock chart is the daily plot, showing a single complete market session for
each unit.
Stock charts can be drawn in two different ways. An ARITHMETIC chart has equal
vertical distances between each unit of price. A LOGARITHMIC chart is a percentage
growth chart. It has equal vertical distances between the same percentages of price growth.
For example, a price movement from 10 to 20 is a 100% move. A move from 20 to 40 is also
a 100% move. For this reason, the vertical distance from 10 to 20 and the vertical distance
from 20 to 40 will be identical on a logarithmic chart.
26
Stock chart analysis can be applied equally to individual stocks and major indices. Analysts
use their technical research on index charts to decide whether the current market is a BULL
MARKET or a BEAR MARKET. On individual charts, investors and traders can learn the
same thing about their favorite companies.
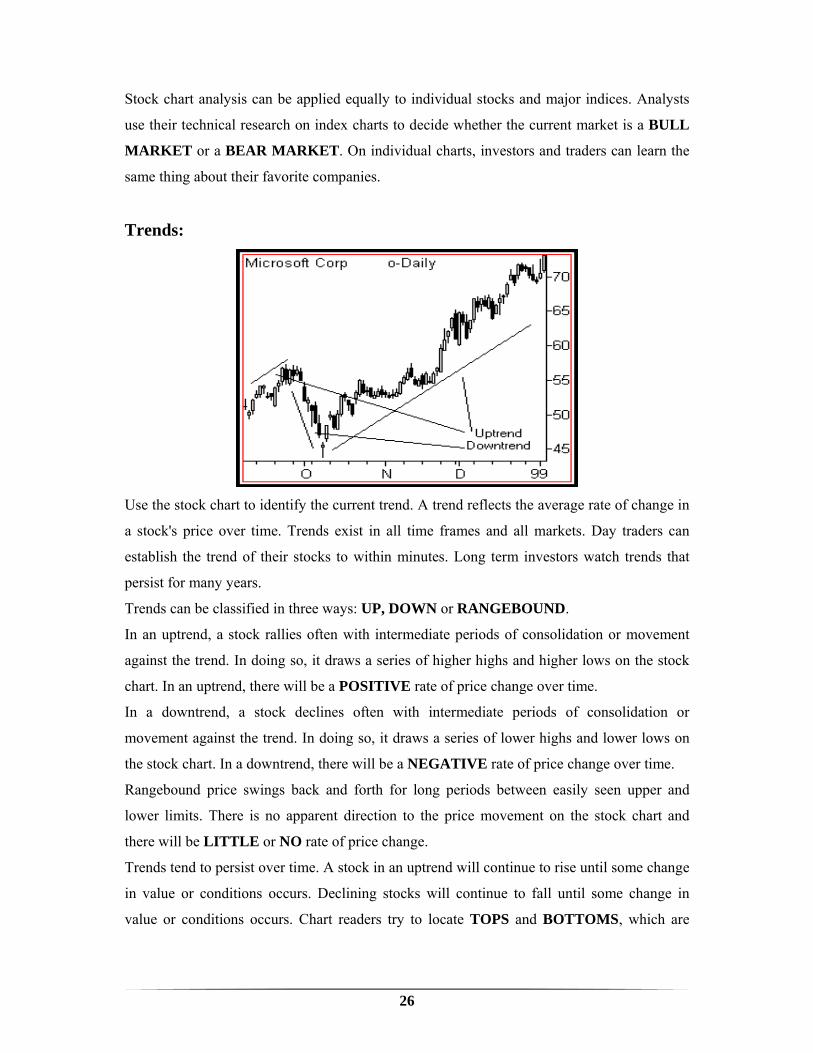
Trends:
Use the stock chart to identify the current trend. A trend reflects the average rate of change in
a stock's price over time. Trends exist in all time frames and all markets. Day traders can
establish the trend of their stocks to within minutes. Long term investors watch trends that
persist for many years.
Trends can be classified in three ways: UP, DOWN or RANGEBOUND.
In an uptrend, a stock rallies often with intermediate periods of consolidation or movement
against the trend. In doing so, it draws a series of higher highs and higher lows on the stock
chart. In an uptrend, there will be a POSITIVE rate of price change over time.
In a downtrend, a stock declines often with intermediate periods of consolidation or
movement against the trend. In doing so, it draws a series of lower highs and lower lows on
the stock chart. In a downtrend, there will be a NEGATIVE rate of price change over time.
Rangebound price swings back and forth for long periods between easily seen upper and
lower limits. There is no apparent direction to the price movement on the stock chart and
there will be LITTLE or NO rate of price change.
Trends tend to persist over time. A stock in an uptrend will continue to rise until some change
in value or conditions occurs. Declining stocks will continue to fall until some change in
value or conditions occurs. Chart readers try to locate TOPS and BOTTOMS, which are
27
those points where a rally or a decline ends. Taking a position near a top or a bottom can be
very profitable.
Trends can be measured using TRENDLINES. Very often a straight line can be drawn
UNDER three or more pullbacks from rallies or OVER pullbacks from declines. When price
bars then return to that trend line, they tend to find SUPPORT or RESISTANCE and
bounce off the line in the opposite direction.
A famous quote about trends advises that "The trend is your friend". For traders and
investors, this wisdom teaches that you will have more success taking stock positions in the
direction of the prevailing trend than against it.
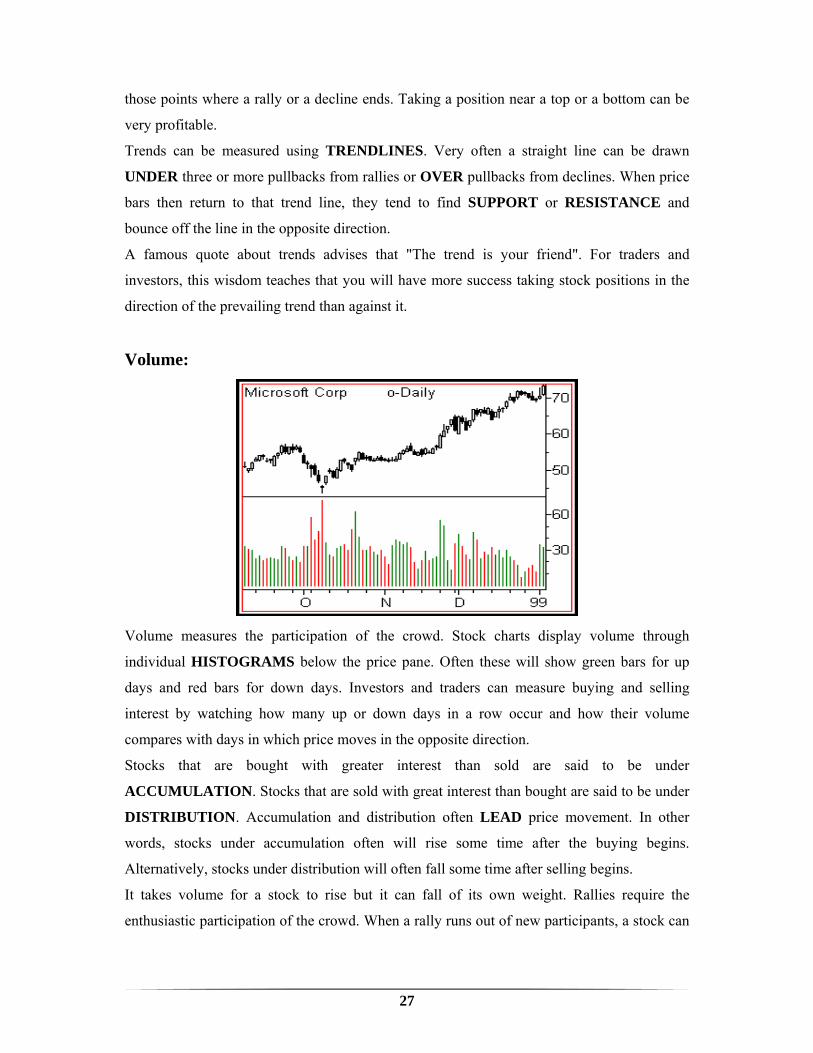
Volume:
Volume measures the participation of the crowd. Stock charts display volume through
individual HISTOGRAMS below the price pane. Often these will show green bars for up
days and red bars for down days. Investors and traders can measure buying and selling
interest by watching how many up or down days in a row occur and how their volume
compares with days in which price moves in the opposite direction.
Stocks that are bought with greater interest than sold are said to be under
ACCUMULATION. Stocks that are sold with great interest than bought are said to be under
DISTRIBUTION. Accumulation and distribution often LEAD price movement. In other
words, stocks under accumulation often will rise some time after the buying begins.
Alternatively, stocks under distribution will often fall some time after selling begins.
It takes volume for a stock to rise but it can fall of its own weight. Rallies require the
enthusiastic participation of the crowd. When a rally runs out of new participants, a stock can
28
easily fall. Investors and traders use indicators such as ON BALANCE VOLUME to see
whether participation is lagging (behind) or leading (ahead) the price action.
Stocks trade daily with an average volume that determines their LIQUIDITY. Liquid stocks
are very easy for traders to buy and sell. Illiquid stocks require very high SPREADS
(transaction costs) to buy or sell and often cannot be eliminated quickly from a portfolio.
Stock chart analysis does not work well on illiquid stocks.
Breakouts accompanied by volume much higher than the average for that stock are healthy
for the continuation of the price movement in that direction. But after long rallies or declines,
stocks often have a day of very high volume known as a CLIMAX. During these days, the
last of the buyers or sellers take positions. The stock then reverses as there are no longer
enough participants to cause price to move in that direction.
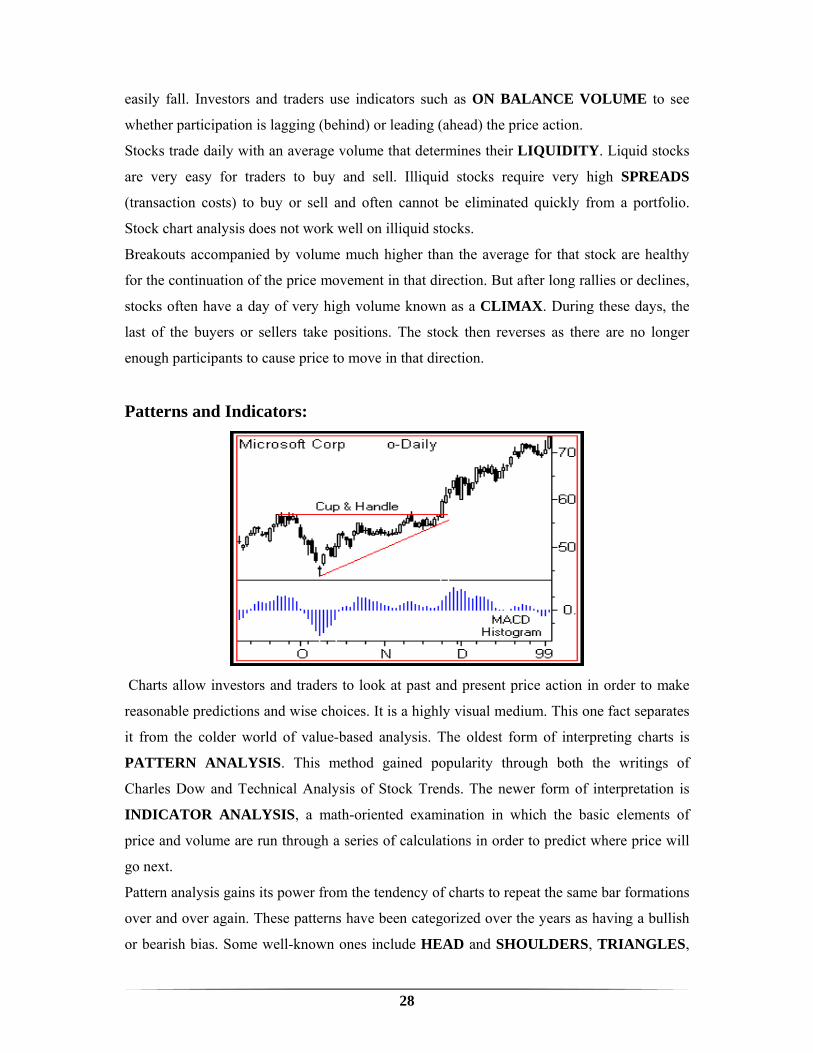
Patterns and Indicators:
Charts allow investors and traders to look at past and present price action in order to make
reasonable predictions and wise choices. It is a highly visual medium. This one fact separates
it from the colder world of value-based analysis. The oldest form of interpreting charts is
PATTERN ANALYSIS. This method gained popularity through both the writings of
Charles Dow and Technical Analysis of Stock Trends. The newer form of interpretation is
INDICATOR ANALYSIS, a math-oriented examination in which the basic elements of
price and volume are run through a series of calculations in order to predict where price will
go next. Pattern analysis gains its power from the tendency of charts to repeat the same bar formations
over and over again. These patterns have been categorized over the years as having a bullish
or bearish bias. Some well-known ones include HEAD and SHOULDERS, TRIANGLES,
29
RECTANGLES, DOUBLE TOPS, DOUBLE BOTTOMS and FLAGS. Also, chart
landscape features such as GAPS and TRENDLINES are said to have great significance on
the future course of price action.
Indicator analysis uses math calculations to measure the relationship of current price to past
price action. Almost all indicators can be categorized as TREND-FOLLOWING or
OSCILLATORS. Popular trend-following indicators include MOVING AVERAGES, ON
BALANCE VOLUME and MACD. Common oscillators include STOCHASTICS, RSI
and RATE OF CHANGE. Trend-following indicators react much more slowly than
oscillators. They look deeply into the rear view mirror to locate the future. Oscillators react
very quickly to short-term changes in price, flipping back and forth between
OVERBOUGHT and OVERSOLD levels.
Both patterns and indicators measure market psychology. The core of investors and traders
that make up the market each day tend to act with a herd mentality as price rises and falls.
This "crowd" tends to develop known characteristics that repeat themselves over and over
again. Chart interpretation using these two important analysis tools uncovers growing stress
within the crowd that should eventually translate into price change.
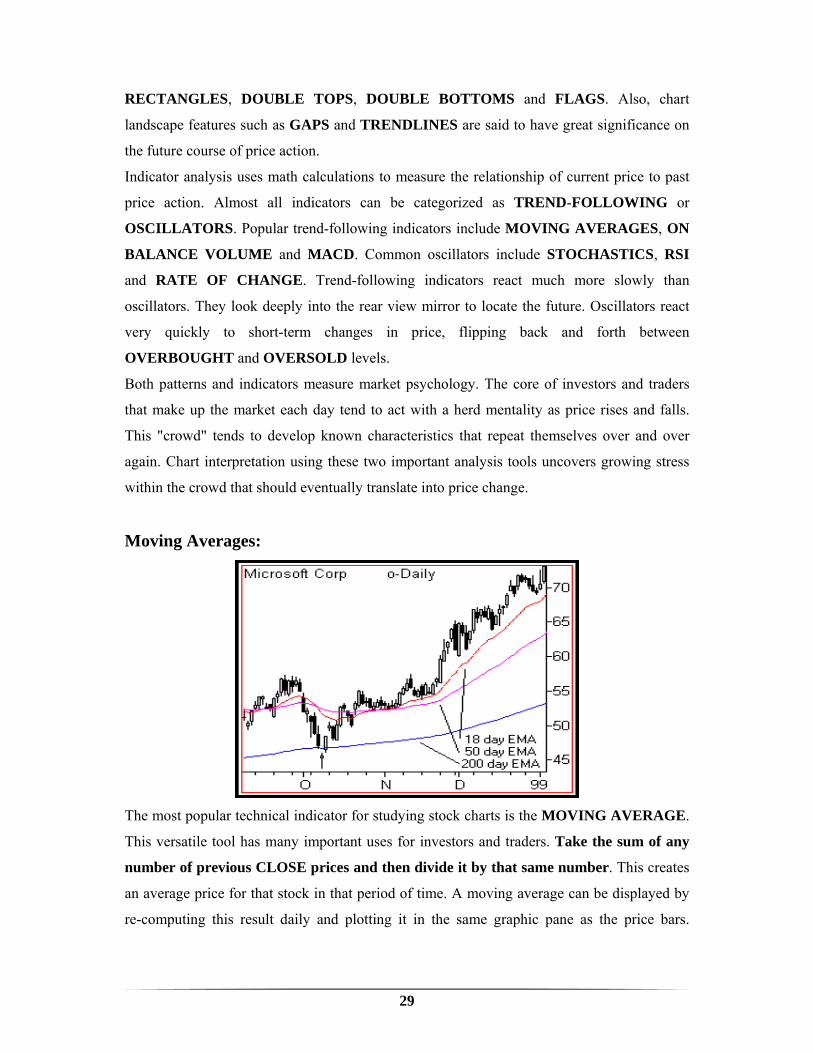
Moving Averages:
The most popular technical indicator for studying stock charts is the MOVING AVERAGE.
This versatile tool has many important uses for investors and traders. Take the sum of any
number of previous CLOSE prices and then divide it by that same number. This creates
an average price for that stock in that period of time. A moving average can be displayed by
re-computing this result daily and plotting it in the same graphic pane as the price bars.
30
Moving averages LAG price. In other words, if price starts to move sharply upward or
downward, it will take some time for the moving average to "catch up".
Plotting moving averages in stock charts reveals how well current price is behaving as
compared to the past. The power of the moving average line comes from its direct interaction
with the price bars. Current price will always be above or below any moving average
computation. When it is above, conditions are "bullish". When below, conditions are
"bearish". Additionally, moving averages will slope upward or downward over time. This
adds another visual dimension to a stock analysis.
Moving averages define STOCK TRENDS. They can be computed for any period of time.
Investors and traders find them most helpful when they provide input about the SHORT-
TERM, INTERMEDIATE and LONG-TERM trends. For this reason, using multiple
moving averages that reflect these characteristics assist important decision making. Common
moving average settings for daily stock charts are: 20 days for short-term, 50 days for
intermediate and 200 days for long-term.
One of the most common buy or sell signals in all chart analysis is the MOVING
AVERAGE CROSSOVER. These occur when two moving averages representing
different trends criss-cross. For example, when a short-term average crosses BELOW a
long-term one, a SELL signal is generated. Conversely, when a short-term crosses
ABOVE the long-term, a BUY signal is generated.
Moving averages can be "speeded up" through the application of further math calculations.
Common averages are known as SIMPLE or SMA. These tend to be very slow. By giving
more weight to the current changes in price rather than those many bars ago, a faster
EXPONENTIAL or EMA moving average can be created. Many technicians favor the EMA
over the SMA. Fortunately all common stock chart programs, online and offline do the
difficult moving average calculations for you and plot price perfectly
31
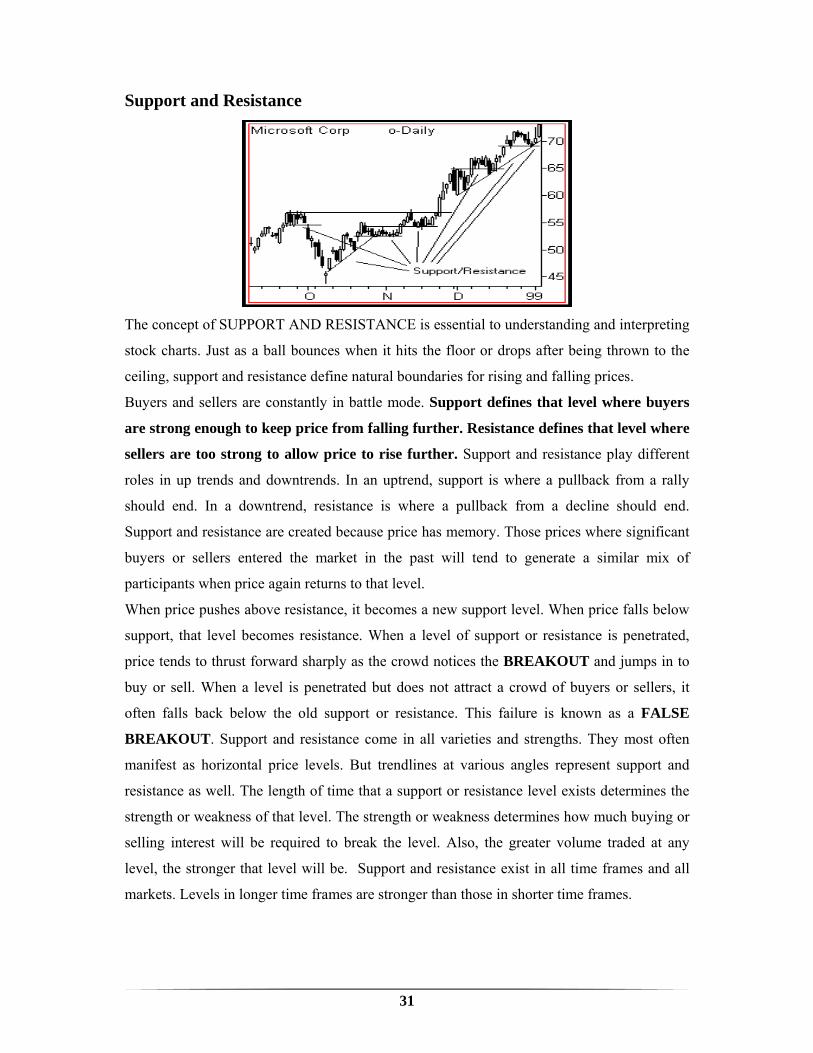
Support and Resistance
The concept of SUPPORT AND RESISTANCE is essential to understanding and interpreting
stock charts. Just as a ball bounces when it hits the floor or drops after being thrown to the
ceiling, support and resistance define natural boundaries for rising and falling prices.
Buyers and sellers are constantly in battle mode. Support defines that level where buyers
are strong enough to keep price from falling further. Resistance defines that level where
sellers are too strong to allow price to rise further. Support and resistance play different
roles in up trends and downtrends. In an uptrend, support is where a pullback from a rally
should end. In a downtrend, resistance is where a pullback from a decline should end.
Support and resistance are created because price has memory. Those prices where significant
buyers or sellers entered the market in the past will tend to generate a similar mix of
participants when price again returns to that level.
When price pushes above resistance, it becomes a new support level. When price falls below
support, that level becomes resistance. When a level of support or resistance is penetrated,
price tends to thrust forward sharply as the crowd notices the BREAKOUT and jumps in to
buy or sell. When a level is penetrated but does not attract a crowd of buyers or sellers, it
often falls back below the old support or resistance. This failure is known as a FALSE
BREAKOUT. Support and resistance come in all varieties and strengths. They most often
manifest as horizontal price levels. But trendlines at various angles represent support and
resistance as well. The length of time that a support or resistance level exists determines the
strength or weakness of that level. The strength or weakness determines how much buying or
selling interest will be required to break the level. Also, the greater volume traded at any
level, the stronger that level will be. Support and resistance exist in all time frames and all
markets. Levels in longer time frames are stronger than those in shorter time frames.

32

33
Chapter-5
Literature review
“Only buy something that you’d be perfectly happy to hold if the market shut down for
10 years”
- Warren Buffet
Investment Guru
“Prevailing wisdom is that markets are always right, I assume they are always wrong”
- George Soros,
Chairman, Soros Fund Management
According to Michal Parness, Founder & CEO
Investors don’t Make Money in the Stock Market. One reason the institutions make so much
money is that they are trading. They make money every time you buy or sell. They make
money whether you win or lose. That means that when you’re investing, you’re basically just
sitting there. You’re not going anywhere. You’re not making money as an investor.
Trading the Trend: The Only Way to Make Money in the Market
If you don’t know this already, “Trend Trading” means trading trends based on human
emotions. Not lagging indicators. Not complex statistical analysis and not Ph.D. level
mathematical equations. With trend trading, you look for market movement. That could mean
stocks that are going to move up or down during the course of a day (intraday). You’ll play
the gaps up and down, often several days a week.
The “Trend trading” means being aware and taking advantage of trends like the run-ups that
happen around earning sessions. These are trends that have worked time and time again in the
market. They consistently yield results
Fundamental and Technical Analysis: Substitutes or Compliments?
Jenni L. Bettman
34
Australian National University
Stephen Sault
Australian National University - Faculty of Economics & Commerce
March 28, 2006
While the fundamental and technical analysis literatures invest considerable effort in
assessing their respective ability to explain share prices, they invariably do so without
reference to each other. In this context, we propose an equity valuation model integrating
both fundamental and technical analysis and, in doing so, recognize their potential as
complements rather than as substitutes. Testing confirms the complementary nature of
fundamental and technical analysis by showing that, while each performs well in isolation,
models integrating both have superior explanatory power. While our findings relate to the
valuation of shares, they also have implications for other valuation exercises.
Keywords: Equity valuation models, Fundamental information, Technical information
JEL Classifications: G12, G14, M41
Although the fundamental and technical analysis literatures invest considerable effort in
assessing their respective ability to explain share prices, they invariably do so without
reference to each other. In this context, we propose an equity valuation model integrating
both fundamental and technical analysis and, in doing so, recognize their potential as
complements rather than as substitutes. Testing confirms the complementary nature of
fundamental and technical analysis by showing that, although each performs well in isolation,
models integrating both have superior explanatory power. While our findings relate to the
valuation of shares, they also have implications for other valuation exercises.
Accepted Paper Series
Accounting & Finance, Vol. 49, No. 1, pp. 21-36, March 2009
ISSN 1822-6515 ISSN 1822-6515 EKONOMIKA IR VADYBA: 2009. 14 ECONOMICS &
MANAGEMENT: 2009. 14
35
• RELEVANCE OF FUNDAMENTAL ANALYSIS ON THE BALTIC EQUITY
MARKET
Julia Bistrova, Natalja Lace
Riga Technical University, Latvia,
The main target of the present research was to discover the importance of fundamental
analysis on the Baltic equity markets. The hypothesis that fundamental analysis is not able to
generate substantial additional value to the performance of the portfolio comprised of Baltic
enterprises stocks was proved.
The relevance and need of fundamental analysis was checked by analyzing the performances
of portfolios, which were created on the basis of key fundamental ratios: ROE, equity ratio,
ROIC, net debt to assets as well as PE and PB. Naturally, the companies with better than
average ratios were selected to form stock portfolios. The findings of the conducted study
demonstrate that neither of the mentioned ratios helped in the creating portfolio, performance
of which would beat market’s performance. The only exception was price to earnings ratio,
which proved that cheap companies seem to be attractive to the investors.
It was decided to look closer at the major performers and to find out whether there are any
common patterns among the winners and the losers of the Baltic equity markets. Basically,
equity investors ignored financial situation of the companies (profitability, stability of
balance sheets) and focused mainly on assessing their growth opportunities and attractiveness
of business model. So, investors were mainly forward-looking when making company
selection. As a result, major sufferers performance-wise were the companies with limited
growth potential or total business model erosion.
The authors of the research have also checked whether the trading volumes of the stock have
any impact on the performance. The study results show that in the phase of the major capital
inflows (2001-2006), indeed, most liquid companies tended to reward investors with higher
performances. However, the shareholders of these companies suffered the most in financial
years 2007 and 2008, when there was a major selling across stock market all over the world.
36
By Sandy Jadeja 9- Oct -2004
Should you use Technical or Fundamental analysis to make your decisions?
Volumes have been written about the different ways to forecast or predict market movement.
Traditionally, there are two distinct schools of thought that an individual may choose from,
and that being Fundamental analysis or Technical analysis.
By choosing fundamental analysis, your decisions are based upon underlying economic
factors, cash flows, and price earnings. This information will aim to tell you why a stock will
move.
Technical analysis aims to show you how and when a stock will move. This method
discounts all news and information regarding the value of the stock. In other words, you only
pay attention to a chart. The saying “a picture is worth a thousand words” truly summarizes
this concept nicely.
You can of course choose to use a combination of both if you prefer. This would imply that
when the stock you are looking at becomes undervalued fundamentally, you would wait for a
technical setup to get you in to the market.
Deciding on which method is appropriate and gives bigger returns is truly a matter of
opinion. Respectively, both methods have the same goal; to determine market direction. I
know of a number of individuals who only use one or the other and is equally successful with
phenomenal returns.
It becomes interesting when one speaks to traders from each school. The fundamental traders
believe that charts are a waste of time and provide no real sense as to why one would make
trading decisions based on indicators and repetitive patterns. This group are essentially
bargain hunters. They want to buy stocks which they feel are under priced and will return to a
normal value at a later stage. Fundamental traders often hold stocks for longer periods of time
compared to technical traders.
On the other hand, the technical traders believe that numbers do not lie and that information
based on value, supply and demand are already factored into the price. They also argue that
people can be predictable and that these behaviors’ occur in the form of price patterns. These
37
patterns repeat with a degree of predictability and therefore can be used to forecast future
price movements. Technical traders generally hold positions for shorter periods of time
compared to fundamental traders.
Clearly both avenues are important, and one must make careful decisions before jumping into
trading without having an objective. I have always said that finding a method, style or
strategy depends on ones personality. If you are thinking of long term investing then the
fundamental approach may suit your needs whereas if you are looking for short term market
moves, then technical analysis can provide a myriad of systems to accommodate your
personal style. Some of which we shall take a look at further into the course.
WHERE TO FIND THE NUMBERS.
Richard Seddon, head of Online Share
Trading at the Standard
Online Share Trading is operated by Standard Financial Markets (Pty) Ltd
IT’S CLEAR THAT analysis – whether fundamental or technical – requires a suite of tools.
And though those tools are specialized, the good news is that most are readily available to the
novice investor. Richard Seddon, head of Online Share Trading at the Standard, says that the
discount broking website www.securities.co.za provides many of those tools to its broking
customers as part of its product offering. On the fundamental analysis side the website carries
top-down insights from Standard Bank’s economic research division, plus notes on individual
companies from its rated research team. For bottom-up fundamental analysis the website
contains the financial statements for the past 10 years of every single company listed on the
JSE. Over and above that raw data it also provides key ratios, such as price: earnings (p:e)
multiples, beta, return on equity (ROE) and many others. We’ll deal with those more fully in
two weeks’ time when we work with bottom-up fundamental analysis. But the website isn’t
the only place where investors can find some of those key ratios: the share price pages of the
daily and weekly press (including Fin week) publish information in addition to share prices,
including p:e ratios, dividend yields, market capitalization and share price changes over
specific time periods. The website can also provide more complex bottom-up analysis tools
38
by filtering shares that meet certain criteria. Those could include searching for shares that fall
within a prescribed p:e ratio or dividend yield range. In addition, it provides a database of
share movements for specified time periods, such as the past month, past three months, past
year and past 10 years. The website also provides forecast data. That’s provided by I-Net
Bridge, a company that collates analysts’ forecasts and recommendations to determine the
average (or consensus) projected earnings per share and market view of the share: whether
analysts recommend it as a buy, sell or hold. On the technical analysis side, the Online Share
Trading website provides full interactive charting tools with 10 years’ worth of data. In
addition, customers receive a discount when downloading third-party technical analysis data,
paying as little as R90/month. Over and above all that, the website provides other interesting
information, such as directors’ dealings, 52-week highs and lows, exchange rates,
international indices, news from both Reuters and the JSE, key shareholders of each
company, dividends that are payable, as well as the biggest gainers and losers and the most
active shares on the JSE in any one trading day. It’s everything that a full-service broker
would provide – plus more

39
40
Chapter-6
Research Methodology
Every project is started with the objective of getting results either positive or negative. And
each and every project reaches to the stage of completion through the way of some research
either with the help of primary data or secondary data. And getting of any project and getting
genuine results from that depends on the research method used by researcher.
“Research is a common parlance refers to a search for knowledge. According to
REDMEN “Research is a systematized effort to gain knowledge.”
TYPE OF RESEARCH STUDY The research has been based on secondary data analysis. The study has been exploratory as it
aims at examining the secondary data for analyzing the previous researches that have been
done in the area of technical and fundamental analysis of stocks. The knowledge thus gained
from this preliminary study forms the basis for the further detailed Descriptive research. In
the exploratory study, the various technical indicators that are important for analyzing stock
were actually identified and important ones short listed.
OBJECTIVES OF THE STUDY
Primary Objective:
1.) To do technical and fundamental analysis of chosen securities
Sub-Objectives:
41
1.) To study the various theories of technical analysis and fundamental analysis for various
stocks that chosen.
2.) To understand the movement and performance of stocks to take decision to invest.
3.) To understanding and analyzing the factors that affect the movement of stock prices in the
Indian Stock Markets
SAMPLE DESIGN
Data collection methods include the various methods used by the researcher in his project.
The application of method for collecting the data mainly depends upon the type of project
researcher is going to undertake.
In case the survey project questionnaire is the best tool for collecting data. But in case of
projects other than surveys like this project all the data is collected already prepared or
published in the form of annual reports.
SAMPLE SIZE
The sample size for the number of stocks is taken as 8 for technical analysis and 3 for
fundamental analysis of stocks as fundamental analysis is very exhaustive and requires
detailed study
DATA COLLECTION METHOD
The sample of the stocks for the purpose of collecting secondary data has been selected on
the basis of Random Sampling. The stocks are chosen in an unbiased manner and each stock
is chosen independent of the other stocks chosen.
SOURCES OF DATA
Data can be classified into –
42
Primary source Through conversation with the Relationship, Head and the staff of the branch of SHARE
KHAN Ltd.
Secondary source
- Annual Reports of selected stocks
- Financial Statements
- Internet
Steps for Analysis
Selection - It involves selection of information relevant to the purpose of analysis.
Classification – It involves methodological classification of the data.
Interpretation – It includes drawing of inferences and conclusion.
PROCEDURE
1. Acquaint with the Principles and postulates of analyzing.
2. Determining the extent of analysis so that the sphere of working may be decided.
3. Re-arranging the data.
4. Reducing data to a standardized form.
5. Establishing relationship with the help of tools of analyzing.
6 Interpreting information in a simple and understandable form.
7. Drawing the conclusion.
43
LIMITATIONS OF STUDY
The scope of study was limited due to some constraints given below:-
1. Analysis is only a means not an end. The analysis has been done on the basis of my own
interpretations and up to my best knowledge but every analyst have his or her own
interpretations and suggestions.
2. It does not take into consideration the time taken for the completion of the jobs.
4. The non-monetary factors are not taken into consideration for the analysis
5. No personal contacts with stakeholders of companies also a limitation for analyzing the
project.
6. Error due to some oversight or misinterpretation.
44
45
Chapter-7
Findings and Analysis
FUNDAMENTAL ANALYSIS OF STOCKS
Basically fundamental analysis covers three parts:
1. Market/economical analysis
2. Industry analysis
3. Company analysis
HDFC BANK LTD.
Company detail: Description Details
Industry Finance - Housing House Private BSE Code 500010 NSE Code HDFC Incorporation Year 1977 Registered Office Ramon House H T Parekh Marg,169 Backbay Reclamation , Churchgate Mumbai, Maharashtra-400020 . ISINNO INE001A01028 Phone 022-2283 6255 / 2282 0282 E-mail [email protected] URL www.hdfc.com Industry Finance - Housing Chairman Deepak S Parekh Managing Director Keki M Mistry Company Secretary Girish V Koliyote Listing BSE,NSE
The Housing Development Finance Corporation Limited (HDFC) was amongst the first to
receive an 'in principle' approval from the Reserve Bank of India (RBI) to set up a bank in the
private sector, as part of the RBI's liberalization of the Indian Banking Industry in 1994. The
46
bank was incorporated in August 1994 in the name of 'HDFC Bank Limited', with its
registered office in Mumbai, India. HDFC Bank commenced operations as a Scheduled
Commercial Bank in January 1995.
As on 31st March, 2009 the authorized share capital of HDFC Bank is Rs. 550 crore. The
paid-up capital as on the said date is Rs. 425,38,41,090/- ( 42,53,84,109 equity shares of Rs
10/- each). The HDFC Group holds 19.38% of the Bank's equity and about 17.70 % of the
equity is held by the ADS Depository (in respect of the bank's American Depository Shares
(ADS) Issue). 27.69 % of the equity is held by Foreign Institutional Investors (FIIs) and the
Bank has about 5,48,774 shareholders.
The shares are listed on the Bombay Stock Exchange Limited and The National Stock
Exchange of India Limited. The Bank's American Depository Shares ( ADS ) are listed on the
New York Stock Exchange (NYSE) under the symbol 'HDB' and the Bank's Global
Depository Receipts (GDRs) are listed on Luxembourg Stock Exchange under ISIN No
US40415F2002.
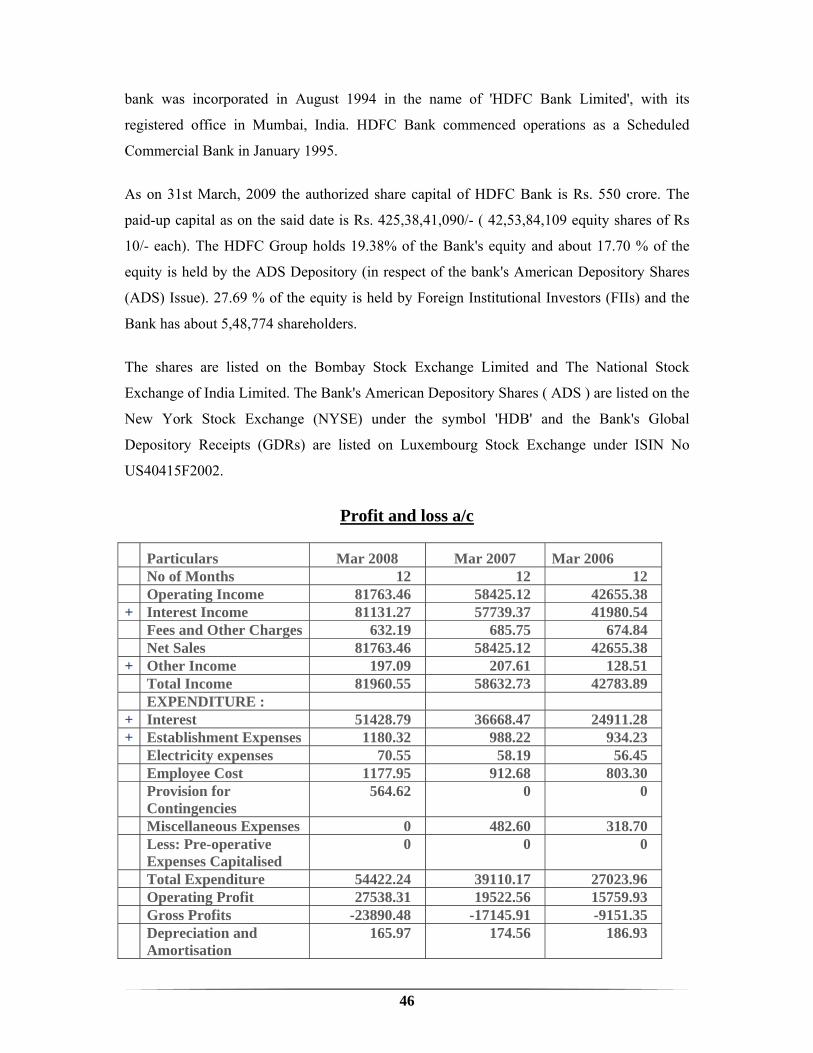
Profit and loss a/c
Particulars Mar 2008 Mar 2007 Mar 2006 No of Months 12 12 12 Operating Income 81763.46 58425.12 42655.38 + Interest Income 81131.27 57739.37 41980.54 Fees and Other Charges 632.19 685.75 674.84 Net Sales 81763.46 58425.12 42655.38 + Other Income 197.09 207.61 128.51 Total Income 81960.55 58632.73 42783.89 EXPENDITURE : + Interest 51428.79 36668.47 24911.28 + Establishment Expenses 1180.32 988.22 934.23 Electricity expenses 70.55 58.19 56.45 Employee Cost 1177.95 912.68 803.30 Provision for
Contingencies 564.62 0 0
Miscellaneous Expenses 0 482.60 318.70 Less: Pre-operative
Expenses Capitalised 0 0 0
Total Expenditure 54422.24 39110.17 27023.96 Operating Profit 27538.31 19522.56 15759.93 Gross Profits -23890.48 -17145.91 -9151.35 Depreciation and
Amortisation 165.97 174.56 186.93
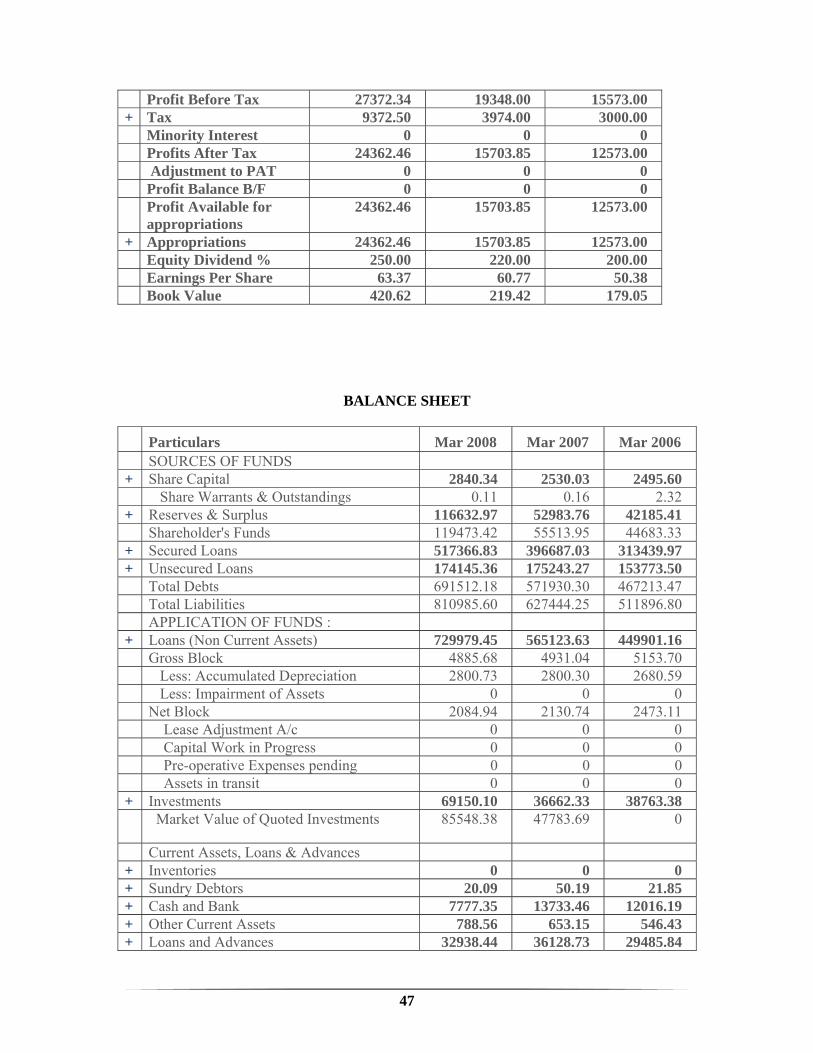
47
Profit Before Tax 27372.34 19348.00 15573.00 + Tax 9372.50 3974.00 3000.00 Minority Interest 0 0 0 Profits After Tax 24362.46 15703.85 12573.00 Adjustment to PAT 0 0 0 Profit Balance B/F 0 0 0 Profit Available for
appropriations 24362.46 15703.85 12573.00
+ Appropriations 24362.46 15703.85 12573.00 Equity Dividend % 250.00 220.00 200.00 Earnings Per Share 63.37 60.77 50.38 Book Value 420.62 219.42 179.05
BALANCE SHEET
Particulars Mar 2008 Mar 2007 Mar 2006 SOURCES OF FUNDS + Share Capital 2840.34 2530.03 2495.60 Share Warrants & Outstandings 0.11 0.16 2.32 + Reserves & Surplus 116632.97 52983.76 42185.41 Shareholder's Funds 119473.42 55513.95 44683.33 + Secured Loans 517366.83 396687.03 313439.97 + Unsecured Loans 174145.36 175243.27 153773.50 Total Debts 691512.18 571930.30 467213.47 Total Liabilities 810985.60 627444.25 511896.80 APPLICATION OF FUNDS : + Loans (Non Current Assets) 729979.45 565123.63 449901.16 Gross Block 4885.68 4931.04 5153.70 Less: Accumulated Depreciation 2800.73 2800.30 2680.59 Less: Impairment of Assets 0 0 0 Net Block 2084.94 2130.74 2473.11 Lease Adjustment A/c 0 0 0 Capital Work in Progress 0 0 0 Pre-operative Expenses pending 0 0 0 Assets in transit 0 0 0 + Investments 69150.10 36662.33 38763.38 Market Value of Quoted Investments 85548.38 47783.69 0
Current Assets, Loans & Advances + Inventories 0 0 0 + Sundry Debtors 20.09 50.19 21.85 + Cash and Bank 7777.35 13733.46 12016.19 + Other Current Assets 788.56 653.15 546.43 + Loans and Advances 32938.44 36128.73 29485.84
48
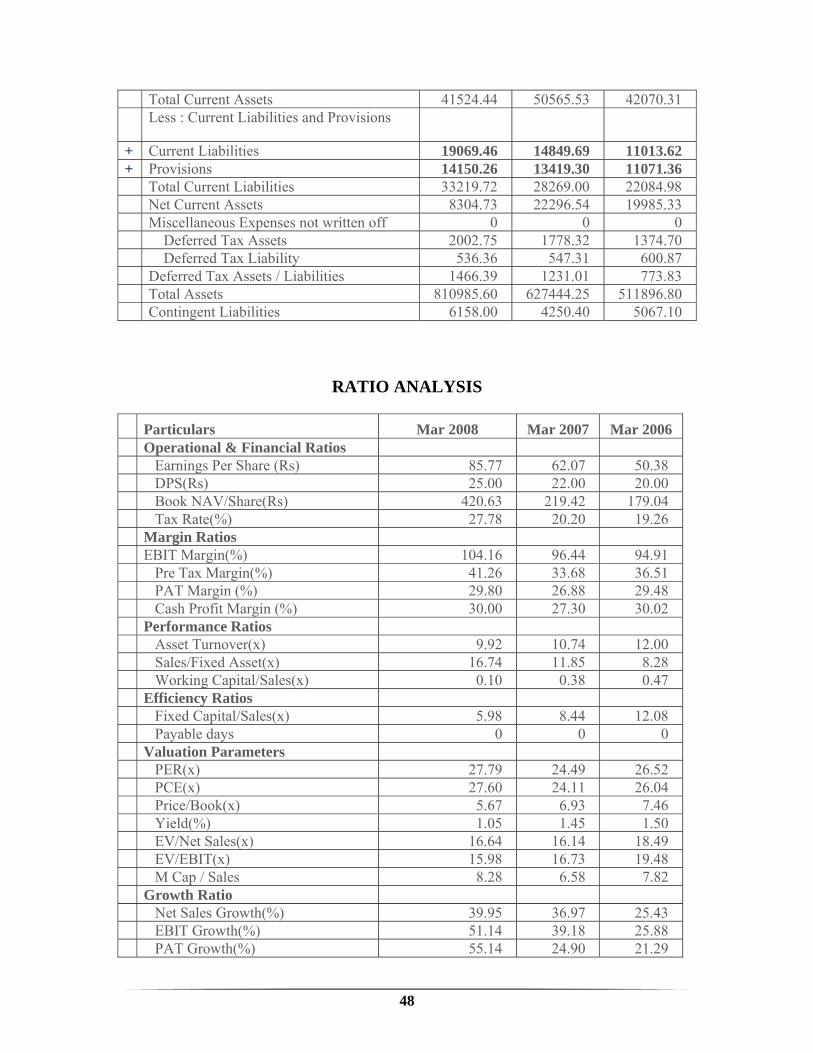
Total Current Assets 41524.44 50565.53 42070.31 Less : Current Liabilities and Provisions
+ Current Liabilities 19069.46 14849.69 11013.62 + Provisions 14150.26 13419.30 11071.36 Total Current Liabilities 33219.72 28269.00 22084.98 Net Current Assets 8304.73 22296.54 19985.33 Miscellaneous Expenses not written off 0 0 0 Deferred Tax Assets 2002.75 1778.32 1374.70 Deferred Tax Liability 536.36 547.31 600.87 Deferred Tax Assets / Liabilities 1466.39 1231.01 773.83 Total Assets 810985.60 627444.25 511896.80 Contingent Liabilities 6158.00 4250.40 5067.10
RATIO ANALYSIS
Particulars Mar 2008 Mar 2007 Mar 2006 Operational & Financial Ratios Earnings Per Share (Rs) 85.77 62.07 50.38 DPS(Rs) 25.00 22.00 20.00 Book NAV/Share(Rs) 420.63 219.42 179.04 Tax Rate(%) 27.78 20.20 19.26 Margin Ratios EBIT Margin(%) 104.16 96.44 94.91 Pre Tax Margin(%) 41.26 33.68 36.51 PAT Margin (%) 29.80 26.88 29.48 Cash Profit Margin (%) 30.00 27.30 30.02 Performance Ratios Asset Turnover(x) 9.92 10.74 12.00 Sales/Fixed Asset(x) 16.74 11.85 8.28 Working Capital/Sales(x) 0.10 0.38 0.47 Efficiency Ratios Fixed Capital/Sales(x) 5.98 8.44 12.08 Payable days 0 0 0 Valuation Parameters PER(x) 27.79 24.49 26.52 PCE(x) 27.60 24.11 26.04 Price/Book(x) 5.67 6.93 7.46 Yield(%) 1.05 1.45 1.50 EV/Net Sales(x) 16.64 16.14 18.49 EV/EBIT(x) 15.98 16.73 19.48 M Cap / Sales 8.28 6.58 7.82 Growth Ratio Net Sales Growth(%) 39.95 36.97 25.43 EBIT Growth(%) 51.14 39.18 25.88 PAT Growth(%) 55.14 24.90 21.29
49
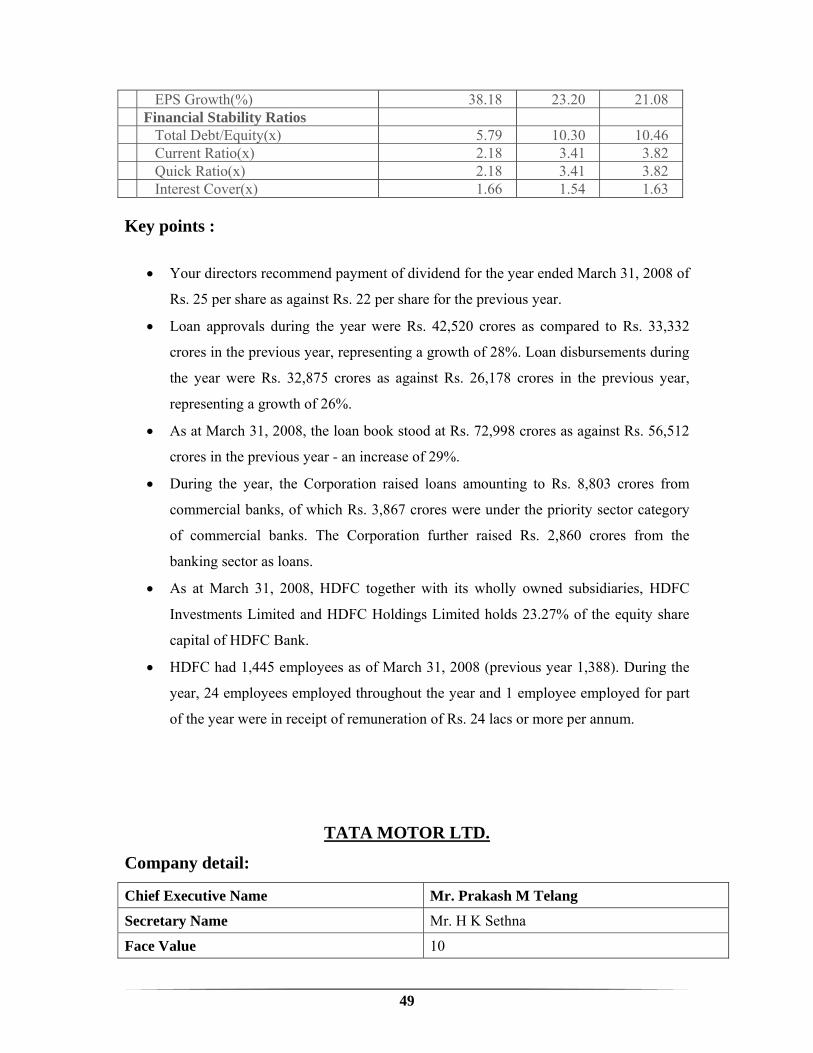
EPS Growth(%) 38.18 23.20 21.08 Financial Stability Ratios Total Debt/Equity(x) 5.79 10.30 10.46 Current Ratio(x) 2.18 3.41 3.82 Quick Ratio(x) 2.18 3.41 3.82 Interest Cover(x) 1.66 1.54 1.63
Key points :
• Your directors recommend payment of dividend for the year ended March 31, 2008 of
Rs. 25 per share as against Rs. 22 per share for the previous year.
• Loan approvals during the year were Rs. 42,520 crores as compared to Rs. 33,332
crores in the previous year, representing a growth of 28%. Loan disbursements during
the year were Rs. 32,875 crores as against Rs. 26,178 crores in the previous year,
representing a growth of 26%.
• As at March 31, 2008, the loan book stood at Rs. 72,998 crores as against Rs. 56,512
crores in the previous year - an increase of 29%.
• During the year, the Corporation raised loans amounting to Rs. 8,803 crores from
commercial banks, of which Rs. 3,867 crores were under the priority sector category
of commercial banks. The Corporation further raised Rs. 2,860 crores from the
banking sector as loans.
• As at March 31, 2008, HDFC together with its wholly owned subsidiaries, HDFC
Investments Limited and HDFC Holdings Limited holds 23.27% of the equity share
capital of HDFC Bank.
• HDFC had 1,445 employees as of March 31, 2008 (previous year 1,388). During the
year, 24 employees employed throughout the year and 1 employee employed for part
of the year were in receipt of remuneration of Rs. 24 lacs or more per annum.
TATA MOTOR LTD.
Company detail:
Chief Executive Name Mr. Prakash M Telang
Secretary Name Mr. H K Sethna
Face Value 10
50
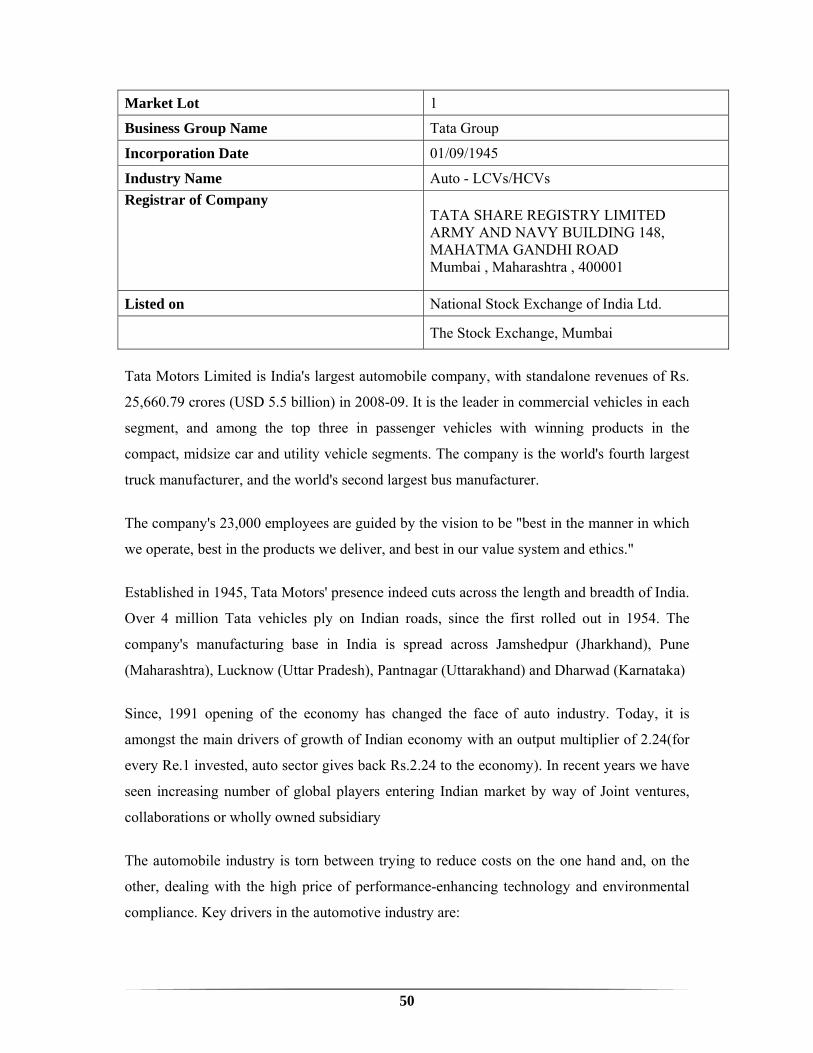
Market Lot 1
Business Group Name Tata Group
Incorporation Date 01/09/1945
Industry Name Auto - LCVs/HCVs Registrar of Company
TATA SHARE REGISTRY LIMITED ARMY AND NAVY BUILDING 148, MAHATMA GANDHI ROAD Mumbai , Maharashtra , 400001
Listed on National Stock Exchange of India Ltd.
The Stock Exchange, Mumbai
Tata Motors Limited is India's largest automobile company, with standalone revenues of Rs.
25,660.79 crores (USD 5.5 billion) in 2008-09. It is the leader in commercial vehicles in each
segment, and among the top three in passenger vehicles with winning products in the
compact, midsize car and utility vehicle segments. The company is the world's fourth largest
truck manufacturer, and the world's second largest bus manufacturer.
The company's 23,000 employees are guided by the vision to be "best in the manner in which
we operate, best in the products we deliver, and best in our value system and ethics."
Established in 1945, Tata Motors' presence indeed cuts across the length and breadth of India.
Over 4 million Tata vehicles ply on Indian roads, since the first rolled out in 1954. The
company's manufacturing base in India is spread across Jamshedpur (Jharkhand), Pune
(Maharashtra), Lucknow (Uttar Pradesh), Pantnagar (Uttarakhand) and Dharwad (Karnataka)
Since, 1991 opening of the economy has changed the face of auto industry. Today, it is
amongst the main drivers of growth of Indian economy with an output multiplier of 2.24(for
every Re.1 invested, auto sector gives back Rs.2.24 to the economy). In recent years we have
seen increasing number of global players entering Indian market by way of Joint ventures,
collaborations or wholly owned subsidiary
The automobile industry is torn between trying to reduce costs on the one hand and, on the
other, dealing with the high price of performance-enhancing technology and environmental
compliance. Key drivers in the automotive industry are:
51
• Reducing air pollution
• Reduction of weight
• Recyclability
• Safety
• Better performance and engine efficiency
• Aesthetics
• Longer service Life
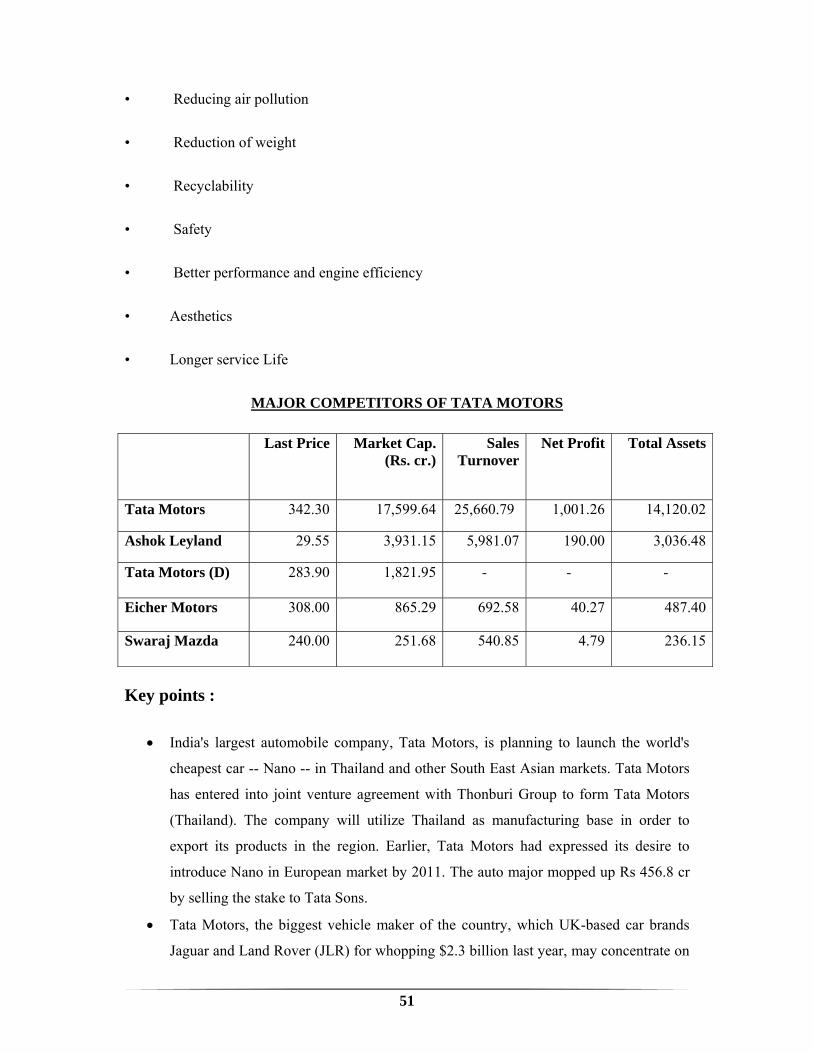
MAJOR COMPETITORS OF TATA MOTORS Last Price Market Cap.
(Rs. cr.)Sales
TurnoverNet Profit Total Assets
Tata Motors 342.30 17,599.64 25,660.79 1,001.26 14,120.02
Ashok Leyland 29.55 3,931.15 5,981.07 190.00 3,036.48
Tata Motors (D) 283.90 1,821.95 -
- -
Eicher Motors 308.00 865.29 692.58 40.27 487.40
Swaraj Mazda 240.00 251.68 540.85 4.79 236.15
Key points :
• India's largest automobile company, Tata Motors, is planning to launch the world's
cheapest car -- Nano -- in Thailand and other South East Asian markets. Tata Motors
has entered into joint venture agreement with Thonburi Group to form Tata Motors
(Thailand). The company will utilize Thailand as manufacturing base in order to
export its products in the region. Earlier, Tata Motors had expressed its desire to
introduce Nano in European market by 2011. The auto major mopped up Rs 456.8 cr
by selling the stake to Tata Sons.
• Tata Motors, the biggest vehicle maker of the country, which UK-based car brands
Jaguar and Land Rover (JLR) for whopping $2.3 billion last year, may concentrate on
52
smaller towns of the country like Ludhiana, apart from the major cities to market
these brands by setting up exclusive showrooms.
• Automobile manufacturer Tata Motors has posted a 13.26% dip in total sales in month
of May 2009. The company sold 40,916 units in May of this fiscal year as compared
to 46,339 units in May 2008.
Profit and loss a/c
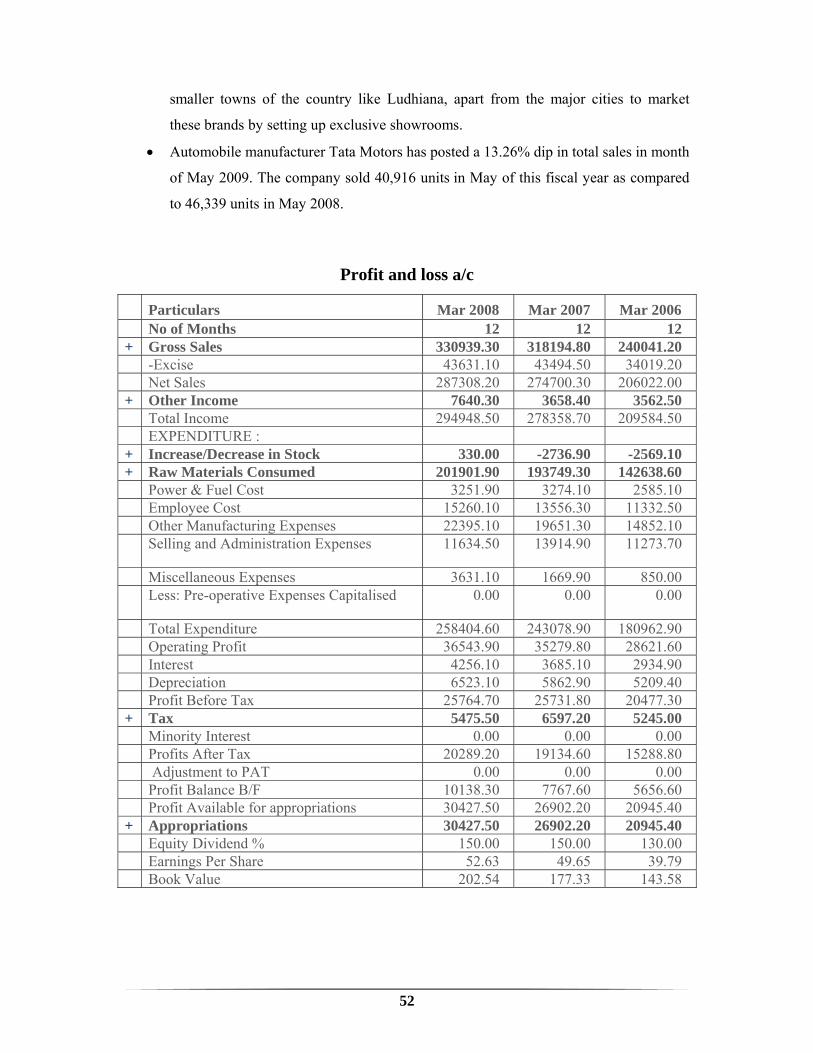
Particulars Mar 2008 Mar 2007 Mar 2006 No of Months 12 12 12 + Gross Sales 330939.30 318194.80 240041.20 -Excise 43631.10 43494.50 34019.20 Net Sales 287308.20 274700.30 206022.00 + Other Income 7640.30 3658.40 3562.50 Total Income 294948.50 278358.70 209584.50 EXPENDITURE : + Increase/Decrease in Stock 330.00 -2736.90 -2569.10 + Raw Materials Consumed 201901.90 193749.30 142638.60 Power & Fuel Cost 3251.90 3274.10 2585.10 Employee Cost 15260.10 13556.30 11332.50 Other Manufacturing Expenses 22395.10 19651.30 14852.10 Selling and Administration Expenses 11634.50 13914.90 11273.70
Miscellaneous Expenses 3631.10 1669.90 850.00 Less: Pre-operative Expenses Capitalised 0.00 0.00 0.00
Total Expenditure 258404.60 243078.90 180962.90 Operating Profit 36543.90 35279.80 28621.60 Interest 4256.10 3685.10 2934.90 Depreciation 6523.10 5862.90 5209.40 Profit Before Tax 25764.70 25731.80 20477.30 + Tax 5475.50 6597.20 5245.00 Minority Interest 0.00 0.00 0.00 Profits After Tax 20289.20 19134.60 15288.80 Adjustment to PAT 0.00 0.00 0.00 Profit Balance B/F 10138.30 7767.60 5656.60 Profit Available for appropriations 30427.50 26902.20 20945.40 + Appropriations 30427.50 26902.20 20945.40 Equity Dividend % 150.00 150.00 130.00 Earnings Per Share 52.63 49.65 39.79 Book Value 202.54 177.33 143.58
53
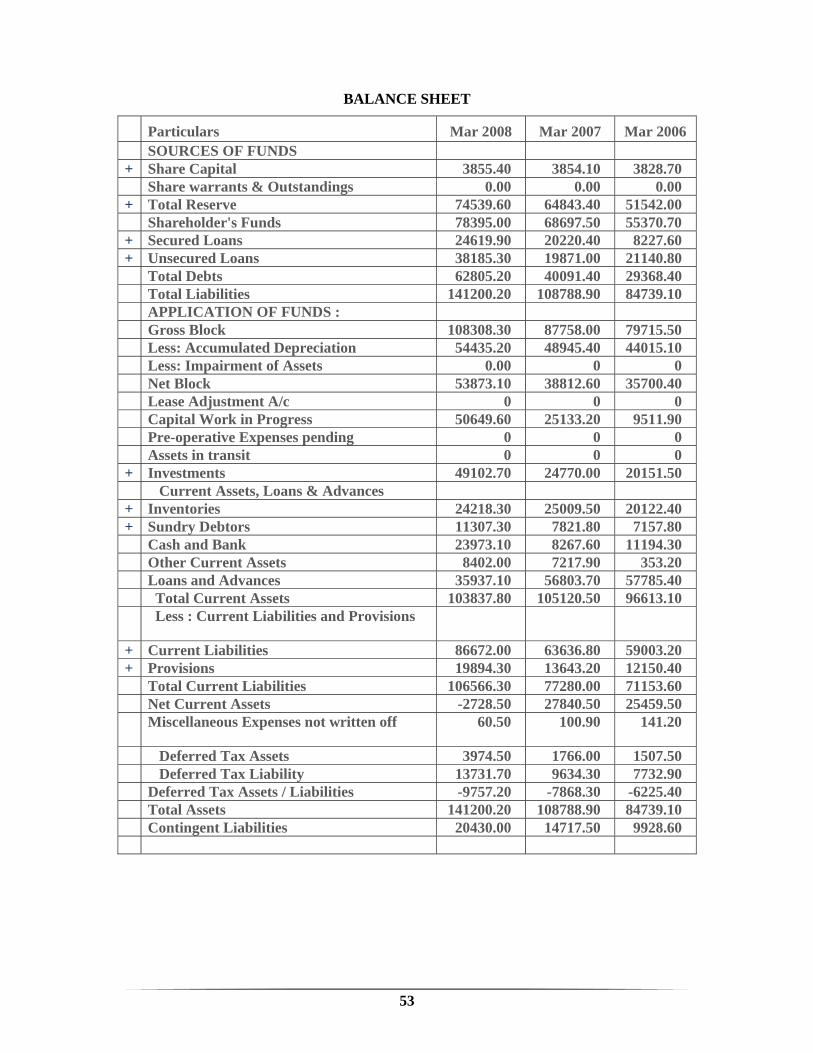
BALANCE SHEET
Particulars Mar 2008 Mar 2007 Mar 2006 SOURCES OF FUNDS + Share Capital 3855.40 3854.10 3828.70 Share warrants & Outstandings 0.00 0.00 0.00 + Total Reserve 74539.60 64843.40 51542.00 Shareholder's Funds 78395.00 68697.50 55370.70 + Secured Loans 24619.90 20220.40 8227.60 + Unsecured Loans 38185.30 19871.00 21140.80 Total Debts 62805.20 40091.40 29368.40 Total Liabilities 141200.20 108788.90 84739.10 APPLICATION OF FUNDS : Gross Block 108308.30 87758.00 79715.50 Less: Accumulated Depreciation 54435.20 48945.40 44015.10 Less: Impairment of Assets 0.00 0 0 Net Block 53873.10 38812.60 35700.40 Lease Adjustment A/c 0 0 0 Capital Work in Progress 50649.60 25133.20 9511.90 Pre-operative Expenses pending 0 0 0 Assets in transit 0 0 0 + Investments 49102.70 24770.00 20151.50 Current Assets, Loans & Advances + Inventories 24218.30 25009.50 20122.40 + Sundry Debtors 11307.30 7821.80 7157.80 Cash and Bank 23973.10 8267.60 11194.30 Other Current Assets 8402.00 7217.90 353.20 Loans and Advances 35937.10 56803.70 57785.40 Total Current Assets 103837.80 105120.50 96613.10 Less : Current Liabilities and Provisions
+ Current Liabilities 86672.00 63636.80 59003.20 + Provisions 19894.30 13643.20 12150.40 Total Current Liabilities 106566.30 77280.00 71153.60 Net Current Assets -2728.50 27840.50 25459.50 Miscellaneous Expenses not written off 60.50 100.90 141.20
Deferred Tax Assets 3974.50 1766.00 1507.50 Deferred Tax Liability 13731.70 9634.30 7732.90 Deferred Tax Assets / Liabilities -9757.20 -7868.30 -6225.40 Total Assets 141200.20 108788.90 84739.10 Contingent Liabilities 20430.00 14717.50 9928.60
54
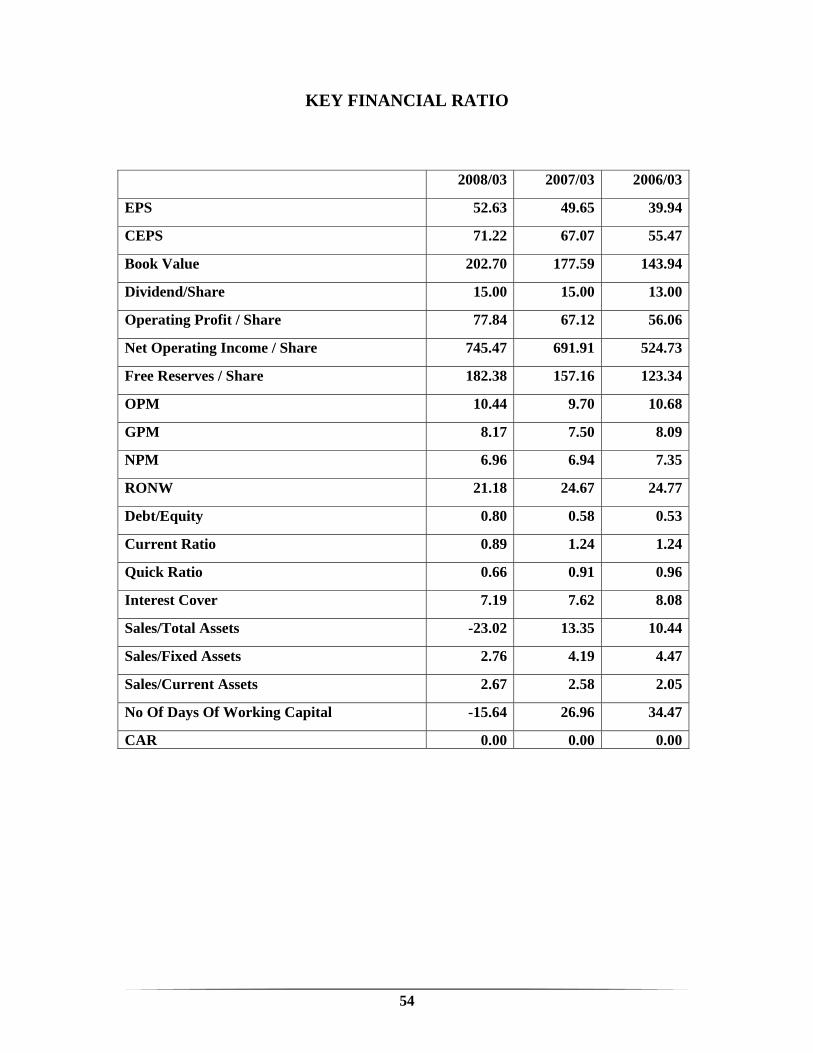
KEY FINANCIAL RATIO
2008/03 2007/03 2006/03
EPS 52.63 49.65 39.94
CEPS 71.22 67.07 55.47
Book Value 202.70 177.59 143.94
Dividend/Share 15.00 15.00 13.00
Operating Profit / Share 77.84 67.12 56.06
Net Operating Income / Share 745.47 691.91 524.73
Free Reserves / Share 182.38 157.16 123.34
OPM 10.44 9.70 10.68
GPM 8.17 7.50 8.09
NPM 6.96 6.94 7.35
RONW 21.18 24.67 24.77
Debt/Equity 0.80 0.58 0.53
Current Ratio 0.89 1.24 1.24
Quick Ratio 0.66 0.91 0.96
Interest Cover 7.19 7.62 8.08
Sales/Total Assets -23.02 13.35 10.44
Sales/Fixed Assets 2.76 4.19 4.47
Sales/Current Assets 2.67 2.58 2.05
No Of Days Of Working Capital -15.64 26.96 34.47
CAR 0.00 0.00 0.00
55
Opportunities and Threats a) Opportunities
● Road Development: The ongoing road development program would improve connectivity
to ports, cities and villages through a network of highways and interconnecting roads by
2010-11. Improved road network would help in faster movement of goods between various
cities and towns. The Company launched TATA Novus range of vehicles in the heavy
segment and TATA ACE for last mile distribution.
● Car penetration in India: Car penetration in India is 7 cars per 1,000 persons.
● International: In FY 2006-07, the Company increased share of its overseas vehicle sales
from 7.6% last year to record high of 11.1% (as % of its total sales) and has planned further
increase in this year.
b) Threats
● Global Competition: India is increasingly attracting global players to set up manufacturing
facility for producing cars, especially small cars. Global automobile manufacturers are also
entering India in commercial vehicle segment to leverage India’s low cost production
advantage to their favor.
● Fuel Prices: The continuing fuel price increase in the domestic market could significantly
impact demand of commercial and passenger vehicles.
● Input costs: Commodity items particularly steel, non-ferrous metals, rubber and
engineering plastics have witnessed huge price increases in the past. These prices are
expected to increase further affecting the Company’s profitability.
● Interest rate hardening and other inflationary trends: With interest rates hardening and
liquidity crunch in the system, growth in sales may be adversely impacted.
● Government Regulations: Stringent emission and safety requirements could bring new
complexities for automotive and component manufacturers impacting the Company’s
business.
56
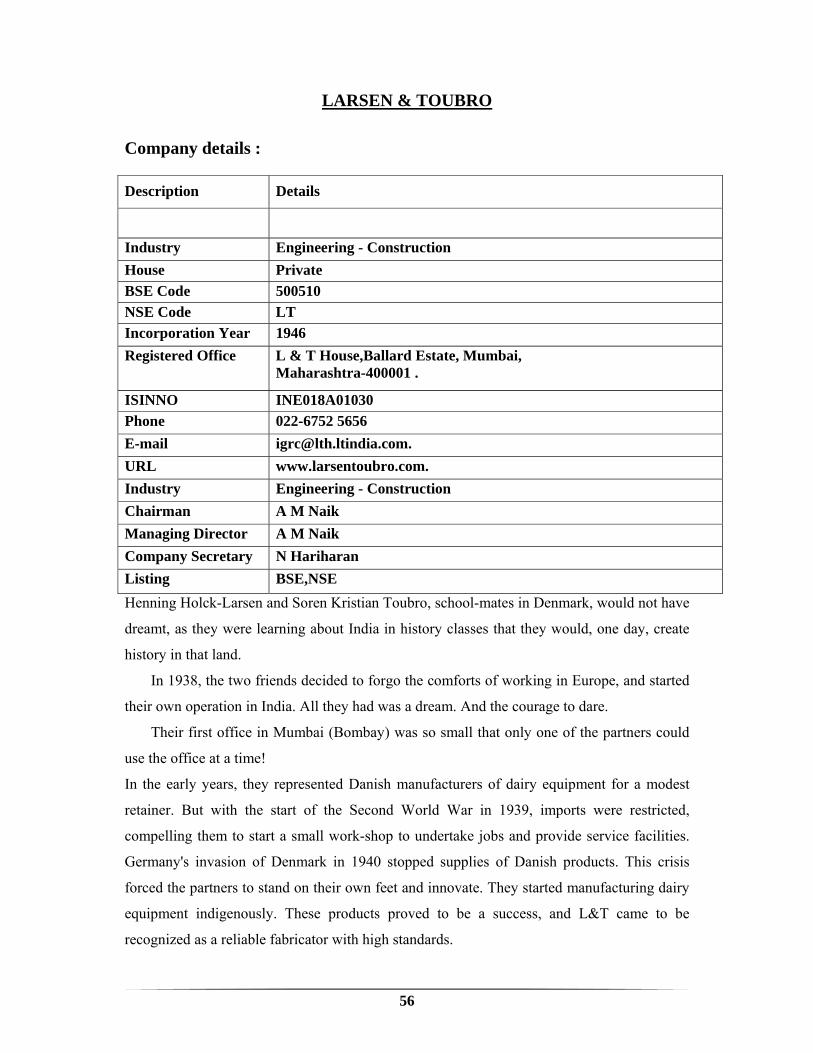
LARSEN & TOUBRO
Company details :
Description Details
Industry Engineering - Construction House Private BSE Code 500510 NSE Code LT Incorporation Year 1946 Registered Office L & T House,Ballard Estate, Mumbai,
Maharashtra-400001 .
ISINNO INE018A01030 Phone 022-6752 5656 E-mail [email protected]. URL www.larsentoubro.com. Industry Engineering - Construction Chairman A M Naik Managing Director A M Naik Company Secretary N Hariharan Listing BSE,NSE Henning Holck-Larsen and Soren Kristian Toubro, school-mates in Denmark, would not have
dreamt, as they were learning about India in history classes that they would, one day, create
history in that land.
In 1938, the two friends decided to forgo the comforts of working in Europe, and started
their own operation in India. All they had was a dream. And the courage to dare.
Their first office in Mumbai (Bombay) was so small that only one of the partners could
use the office at a time!
In the early years, they represented Danish manufacturers of dairy equipment for a modest
retainer. But with the start of the Second World War in 1939, imports were restricted,
compelling them to start a small work-shop to undertake jobs and provide service facilities.
Germany's invasion of Denmark in 1940 stopped supplies of Danish products. This crisis
forced the partners to stand on their own feet and innovate. They started manufacturing dairy
equipment indigenously. These products proved to be a success, and L&T came to be
recognized as a reliable fabricator with high standards.
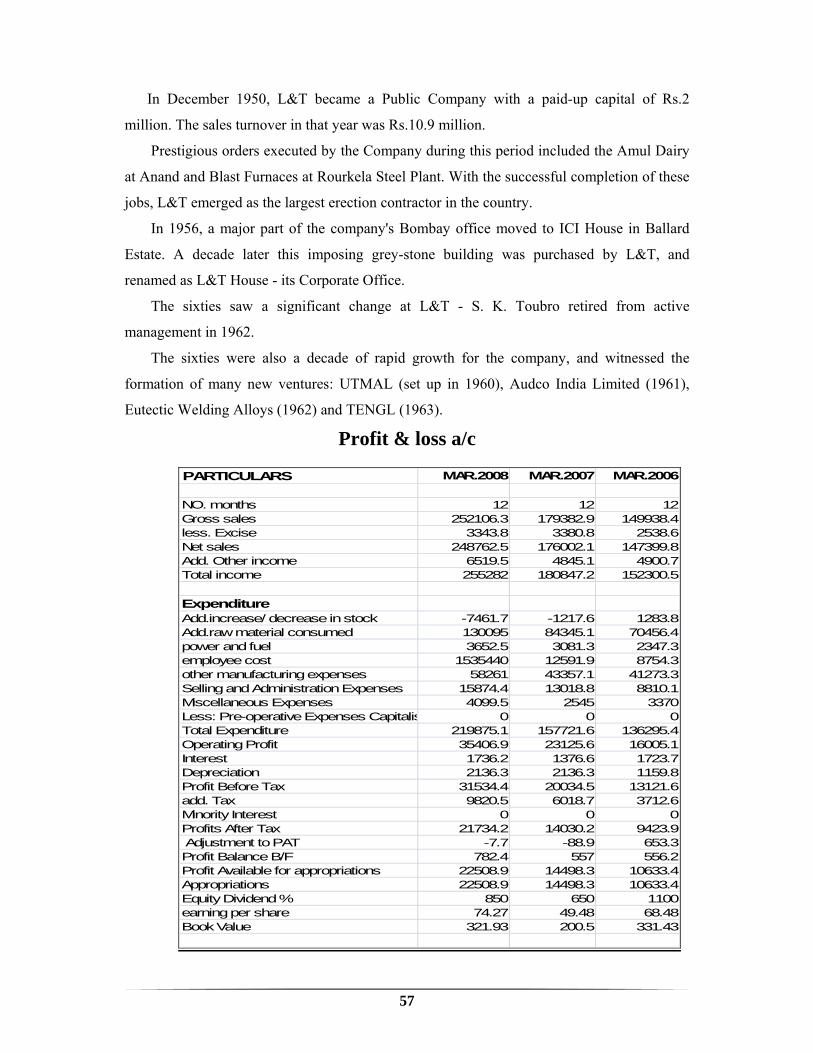
57
In December 1950, L&T became a Public Company with a paid-up capital of Rs.2
million. The sales turnover in that year was Rs.10.9 million.
Prestigious orders executed by the Company during this period included the Amul Dairy
at Anand and Blast Furnaces at Rourkela Steel Plant. With the successful completion of these
jobs, L&T emerged as the largest erection contractor in the country.
In 1956, a major part of the company's Bombay office moved to ICI House in Ballard
Estate. A decade later this imposing grey-stone building was purchased by L&T, and
renamed as L&T House - its Corporate Office.
The sixties saw a significant change at L&T - S. K. Toubro retired from active
management in 1962.
The sixties were also a decade of rapid growth for the company, and witnessed the
formation of many new ventures: UTMAL (set up in 1960), Audco India Limited (1961),
Eutectic Welding Alloys (1962) and TENGL (1963).
Profit & loss a/c
PARTICULARS MAR.2008 MAR.2007 MAR.2006
NO. months 12 12 12Gross sales 252106.3 179382.9 149938.4less. Excise 3343.8 3380.8 2538.6Net sales 248762.5 176002.1 147399.8Add. Other income 6519.5 4845.1 4900.7Total income 255282 180847.2 152300.5
Expenditure Add.increase/ decrease in stock -7461.7 -1217.6 1283.8Add.raw material consumed 130095 84345.1 70456.4power and fuel 3652.5 3081.3 2347.3employee cost 1535440 12591.9 8754.3other manufacturing expenses 58261 43357.1 41273.3Selling and Administration Expenses 15874.4 13018.8 8810.1Miscellaneous Expenses 4099.5 2545 3370Less: Pre-operative Expenses Capitalis 0 0 0Total Expenditure 219875.1 157721.6 136295.4Operating Profit 35406.9 23125.6 16005.1Interest 1736.2 1376.6 1723.7Depreciation 2136.3 2136.3 1159.8Profit Before Tax 31534.4 20034.5 13121.6add. Tax 9820.5 6018.7 3712.6Minority Interest 0 0 0Profits After Tax 21734.2 14030.2 9423.9 Adjustment to PAT -7.7 -88.9 653.3Profit Balance B/F 782.4 557 556.2Profit Available for appropriations 22508.9 14498.3 10633.4Appropriations 22508.9 14498.3 10633.4Equity Dividend % 850 650 1100earning per share 74.27 49.48 68.48Book Value 321.93 200.5 331.43

58
BALANCE SHEET
Particulars Mar 2008 Mar 2007 Mar 2006 SOURCES OF FUNDS + Share Capital 584.70 566.50 274.80 Share warrants & Outstandings 1143.90 515.00 349.90 + Total Reserve 93822.20 56602.80 45777.00 Shareholder's Funds 94406.90 57169.30 46051.80 + Secured Loans 3085.30 2454.00 4657.90 + Unsecured Loans 32754.60 18323.50 9877.80 Total Debts 35839.90 20777.50 14535.70 Total Liabilities 131390.70 78461.80 60937.40 APPLICATION OF FUNDS : Gross Block 42057.50 28763.00 23007.80 Less: Accumulated Depreciation 12865.10 11197.60 9791.50 Less: Impairment of Assets 0 0 0 Net Block 29192.40 17565.40 13216.30 Lease Adjustment A/c -30.70 -30.70 -30.70 Capital Work in Progress 7292.70 4712.20 2860.60 Pre-operative Expenses pending 0 0 0 Assets in transit 0 0 0 + Investments 69222.60 31044.40 19195.20 Current Assets, Loans & Advances + Inventories 43059.10 30011.40 22102.70 + Sundry Debtors 73650.10 55046.40 48141.60 Cash and Bank 9644.60 10944.30 5832.00 Other Current Assets 143.20 265.20 172.60 Loans and Advances 36638.20 22771.00 19116.30 Total Current Assets 163135.20 119038.30 95365.20 Less : Current Liabilities and Provisions + Current Liabilities 116484.20 81763.00 58962.50 + Provisions 20354.20 11801.30 10153.70 Total Current Liabilities 136838.40 93564.30 69116.20 Net Current Assets 26296.80 25474.00 26249.00 Miscellaneous Expenses not written off 30.60 98.40 219.80 Deferred Tax Assets 1829.60 1646.90 1325.10 Deferred Tax Liability 2443.30 2048.80 2097.90 Deferred Tax Assets / Liabilities -613.70 -401.90 -772.80 Total Assets 131390.70 78461.80 60937.40 Contingent Liabilities 4053.50 2702.20 2247.30
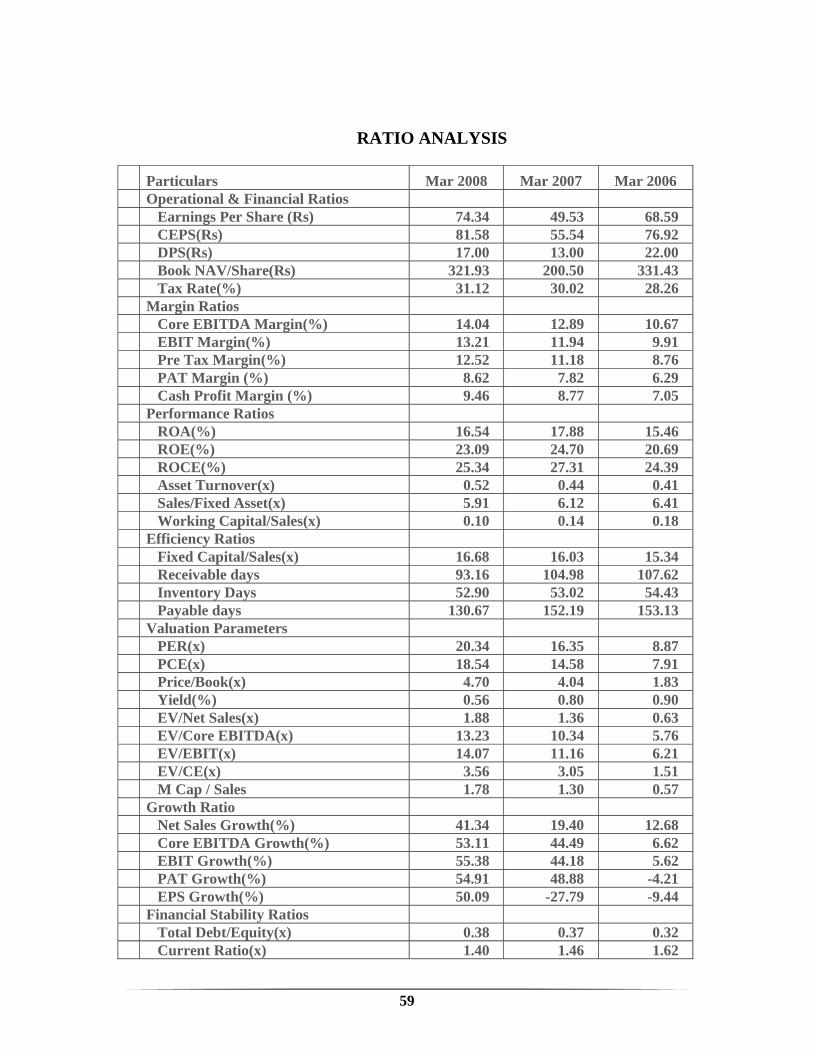
59
RATIO ANALYSIS
Particulars Mar 2008 Mar 2007 Mar 2006 Operational & Financial Ratios Earnings Per Share (Rs) 74.34 49.53 68.59 CEPS(Rs) 81.58 55.54 76.92 DPS(Rs) 17.00 13.00 22.00 Book NAV/Share(Rs) 321.93 200.50 331.43 Tax Rate(%) 31.12 30.02 28.26 Margin Ratios Core EBITDA Margin(%) 14.04 12.89 10.67 EBIT Margin(%) 13.21 11.94 9.91 Pre Tax Margin(%) 12.52 11.18 8.76 PAT Margin (%) 8.62 7.82 6.29 Cash Profit Margin (%) 9.46 8.77 7.05 Performance Ratios ROA(%) 16.54 17.88 15.46 ROE(%) 23.09 24.70 20.69 ROCE(%) 25.34 27.31 24.39 Asset Turnover(x) 0.52 0.44 0.41 Sales/Fixed Asset(x) 5.91 6.12 6.41 Working Capital/Sales(x) 0.10 0.14 0.18 Efficiency Ratios Fixed Capital/Sales(x) 16.68 16.03 15.34 Receivable days 93.16 104.98 107.62 Inventory Days 52.90 53.02 54.43 Payable days 130.67 152.19 153.13 Valuation Parameters PER(x) 20.34 16.35 8.87 PCE(x) 18.54 14.58 7.91 Price/Book(x) 4.70 4.04 1.83 Yield(%) 0.56 0.80 0.90 EV/Net Sales(x) 1.88 1.36 0.63 EV/Core EBITDA(x) 13.23 10.34 5.76 EV/EBIT(x) 14.07 11.16 6.21 EV/CE(x) 3.56 3.05 1.51 M Cap / Sales 1.78 1.30 0.57 Growth Ratio Net Sales Growth(%) 41.34 19.40 12.68 Core EBITDA Growth(%) 53.11 44.49 6.62 EBIT Growth(%) 55.38 44.18 5.62 PAT Growth(%) 54.91 48.88 -4.21 EPS Growth(%) 50.09 -27.79 -9.44 Financial Stability Ratios Total Debt/Equity(x) 0.38 0.37 0.32 Current Ratio(x) 1.40 1.46 1.62
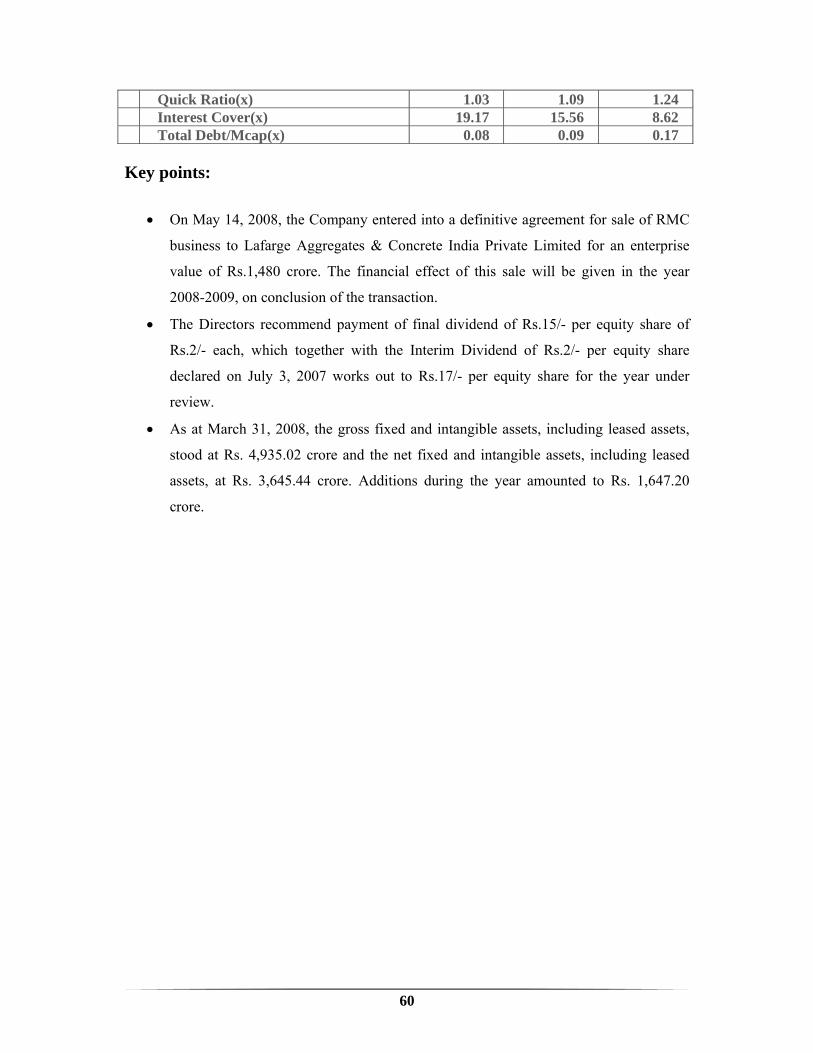
60
Quick Ratio(x) 1.03 1.09 1.24 Interest Cover(x) 19.17 15.56 8.62 Total Debt/Mcap(x) 0.08 0.09 0.17
Key points:
• On May 14, 2008, the Company entered into a definitive agreement for sale of RMC
business to Lafarge Aggregates & Concrete India Private Limited for an enterprise
value of Rs.1,480 crore. The financial effect of this sale will be given in the year
2008-2009, on conclusion of the transaction.
• The Directors recommend payment of final dividend of Rs.15/- per equity share of
Rs.2/- each, which together with the Interim Dividend of Rs.2/- per equity share
declared on July 3, 2007 works out to Rs.17/- per equity share for the year under
review.
• As at March 31, 2008, the gross fixed and intangible assets, including leased assets,
stood at Rs. 4,935.02 crore and the net fixed and intangible assets, including leased
assets, at Rs. 3,645.44 crore. Additions during the year amounted to Rs. 1,647.20
crore.
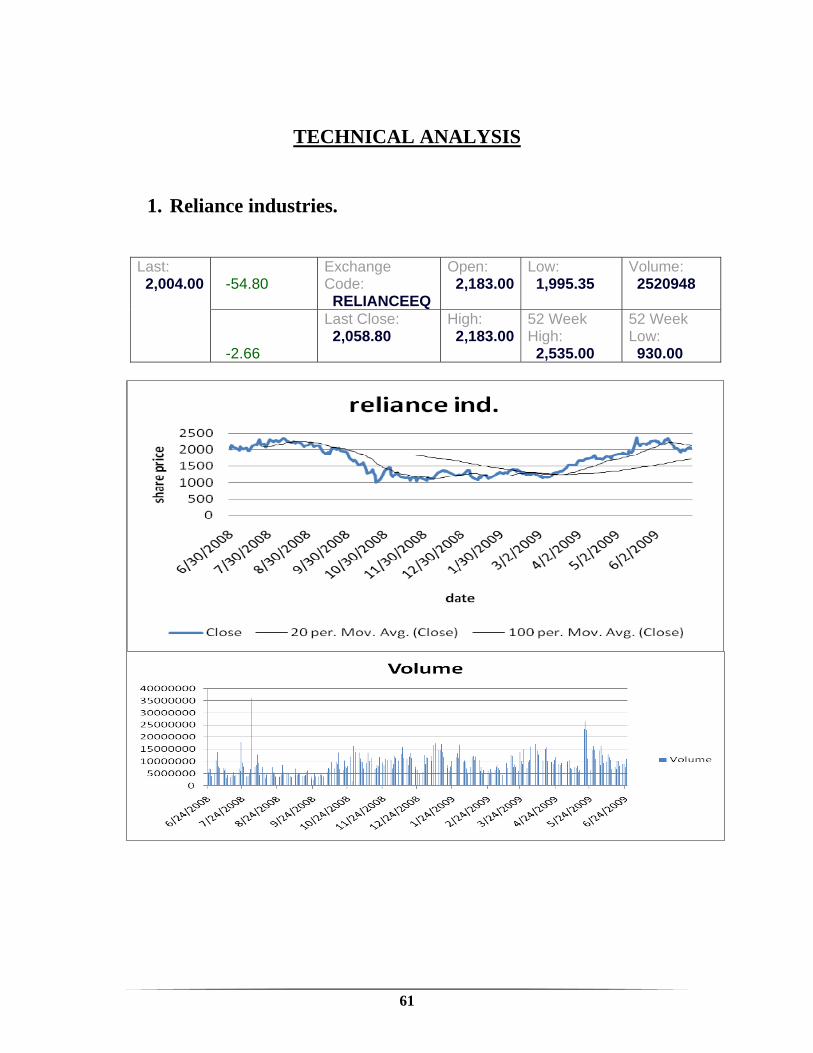
61
TECHNICAL ANALYSIS
1. Reliance industries.
Last: 2,004.00
Change: -54.80
Exchange Code: RELIANCEEQ
Open: 2,183.00
Low: 1,995.35
Volume: 2520948
Percent Change: -2.66
Last Close: 2,058.80
High: 2,183.00
52 Week High: 2,535.00
52 Week Low: 930.00
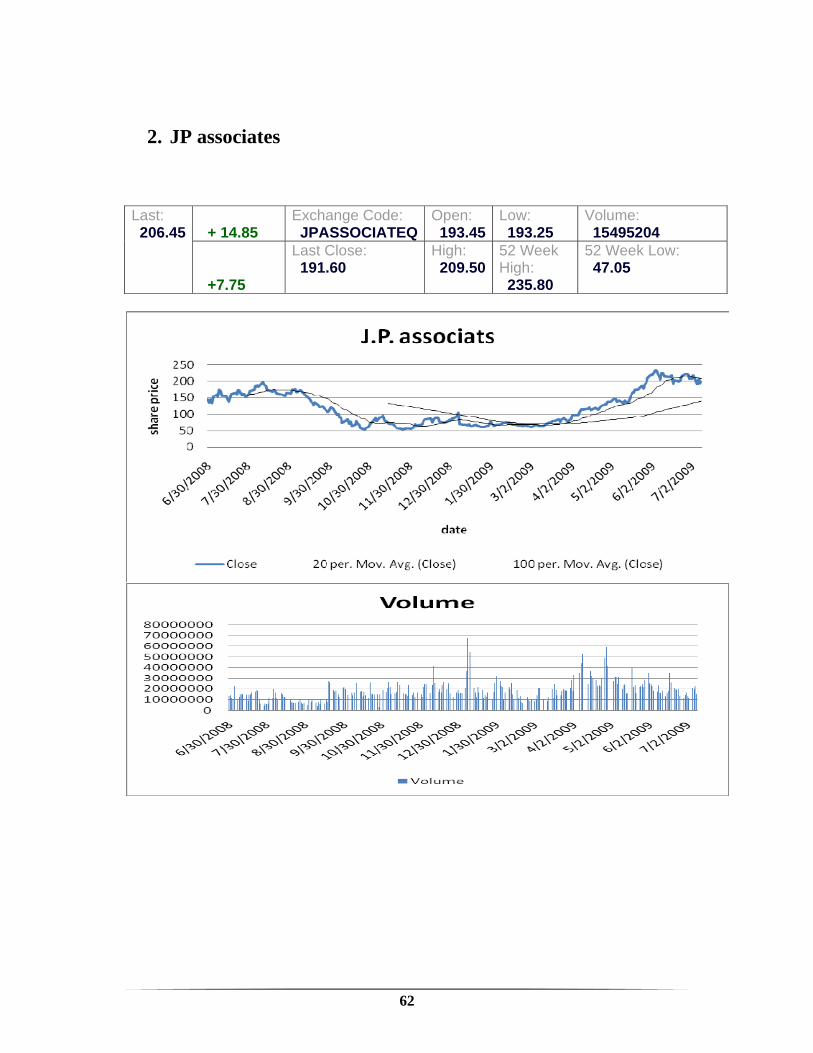
62
2. JP associates
Last: 206.45
Change: + 14.85
Exchange Code: JPASSOCIATEQ
Open: 193.45
Low: 193.25
Volume: 15495204
Percent Change: +7.75
Last Close: 191.60
High: 209.50
52 Week High: 235.80
52 Week Low: 47.05
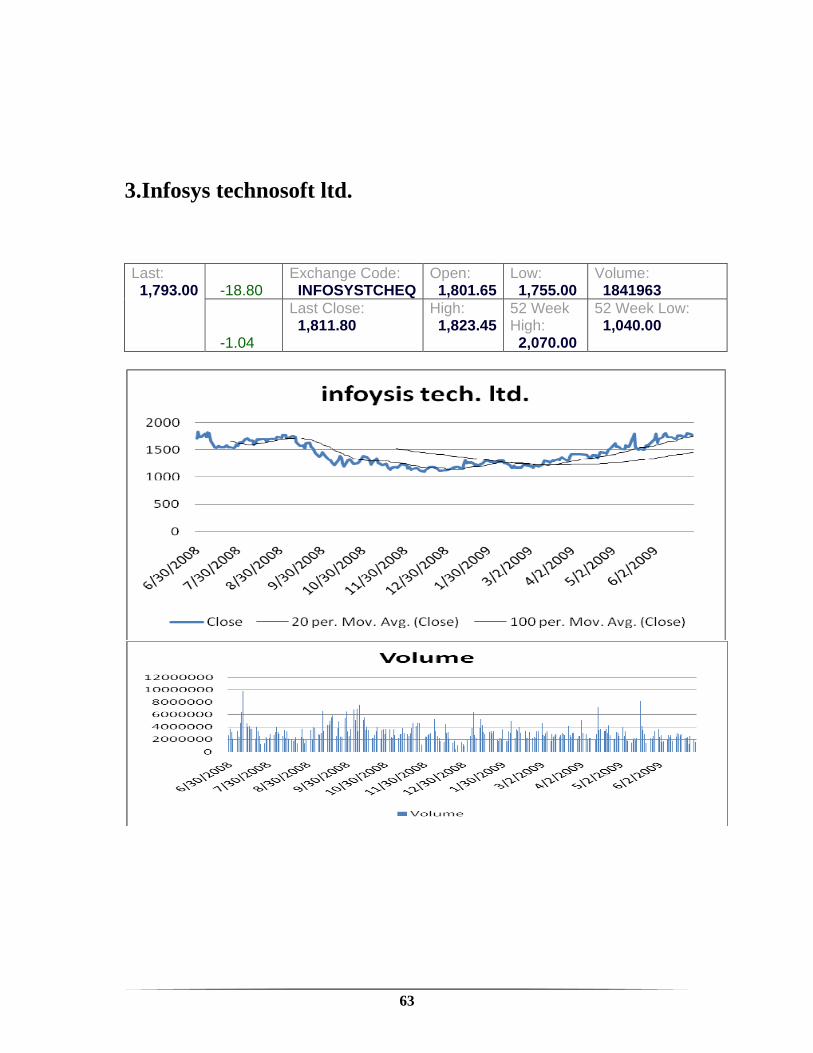
63
3.Infosys technosoft ltd.
Last: 1,793.00
Change: -18.80
Exchange Code: INFOSYSTCHEQ
Open: 1,801.65
Low: 1,755.00
Volume: 1841963
Percent Change: -1.04
Last Close: 1,811.80
High: 1,823.45
52 Week High: 2,070.00
52 Week Low: 1,040.00
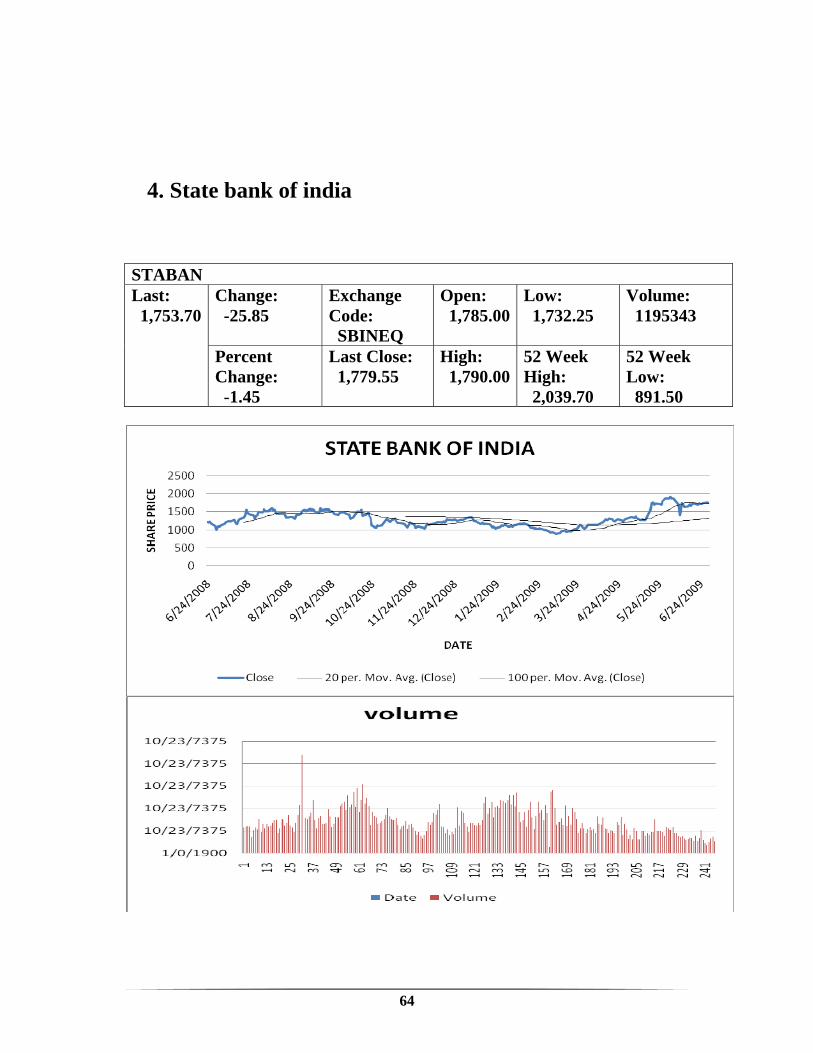
64
4. State bank of india
STABAN Last: 1,753.70
Change: -25.85
Exchange Code: SBINEQ
Open: 1,785.00
Low: 1,732.25
Volume: 1195343
Percent Change: -1.45
Last Close: 1,779.55
High: 1,790.00
52 Week High: 2,039.70
52 Week Low: 891.50
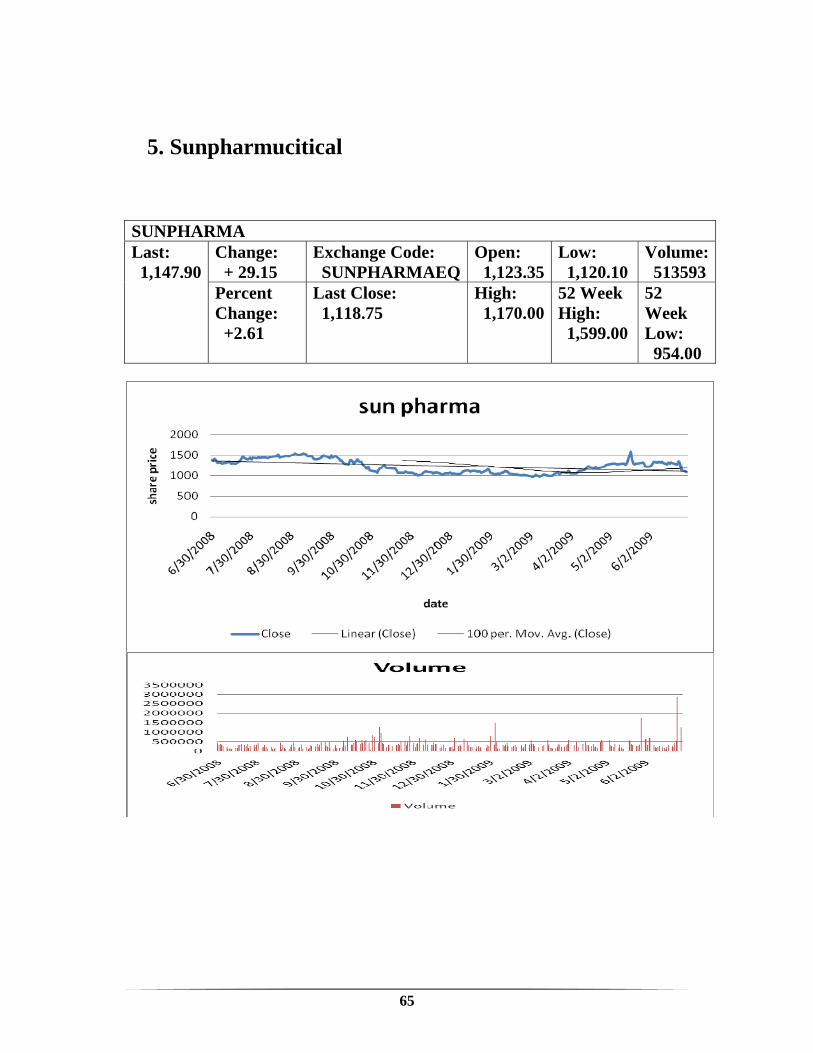
65
5. Sunpharmucitical
SUNPHARMA Last: 1,147.90
Change: + 29.15
Exchange Code: SUNPHARMAEQ
Open: 1,123.35
Low: 1,120.10
Volume: 513593
Percent Change: +2.61
Last Close: 1,118.75
High: 1,170.00
52 Week High: 1,599.00
52 Week Low: 954.00
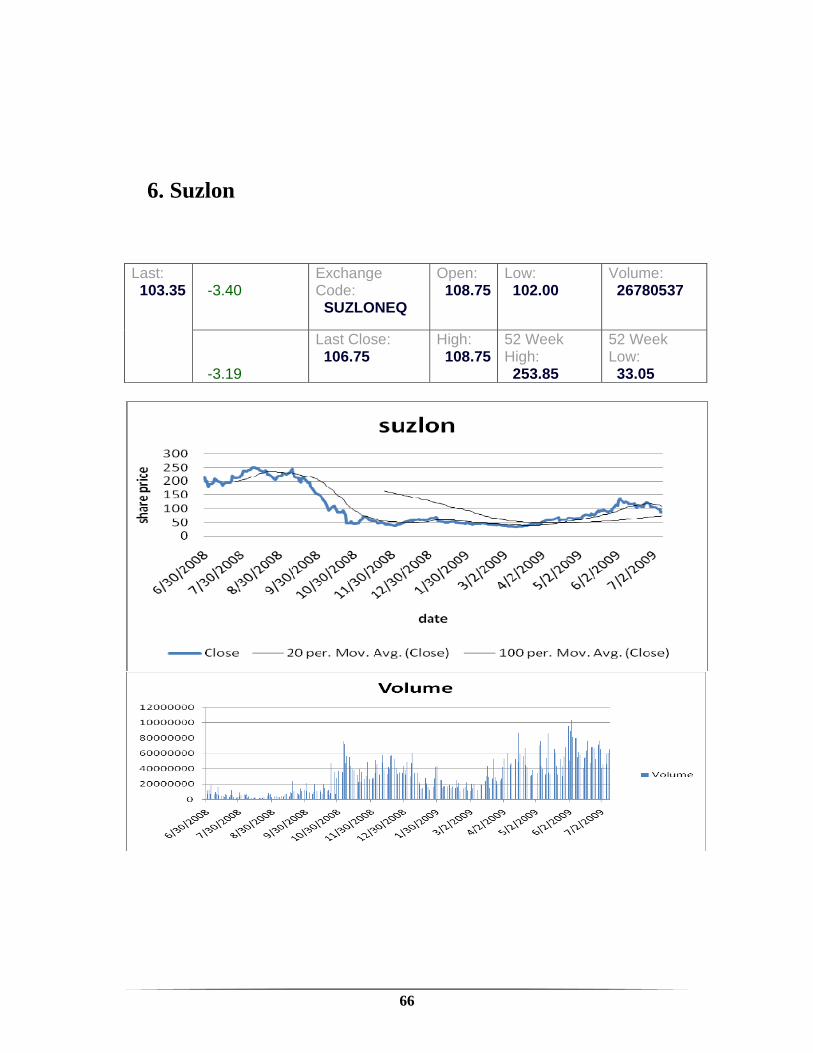
66
6. Suzlon
Last: 103.35
Change: -3.40
Exchange Code: SUZLONEQ
Open: 108.75
Low: 102.00
Volume: 26780537
Percent Change: -3.19
Last Close: 106.75
High: 108.75
52 Week High: 253.85
52 Week Low: 33.05
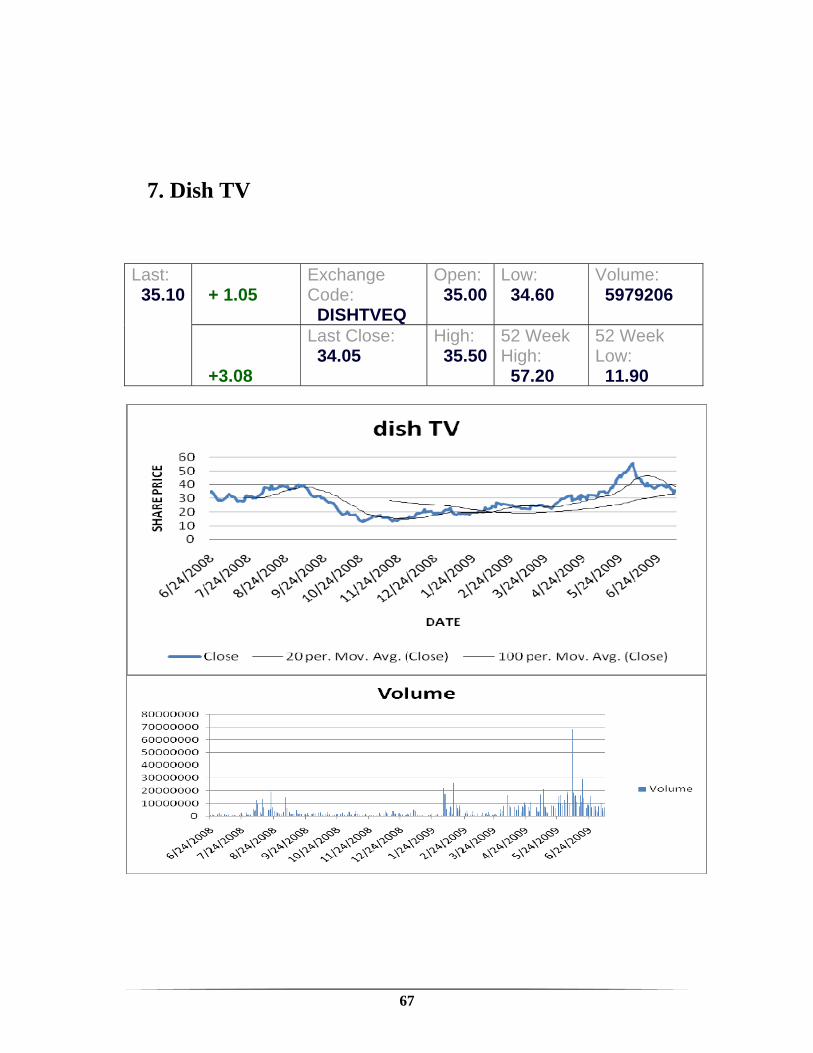
67
7. Dish TV
Last: 35.10
Change: + 1.05
Exchange Code: DISHTVEQ
Open: 35.00
Low: 34.60
Volume: 5979206
Percent Change: +3.08
Last Close: 34.05
High: 35.50
52 Week High: 57.20
52 Week Low: 11.90
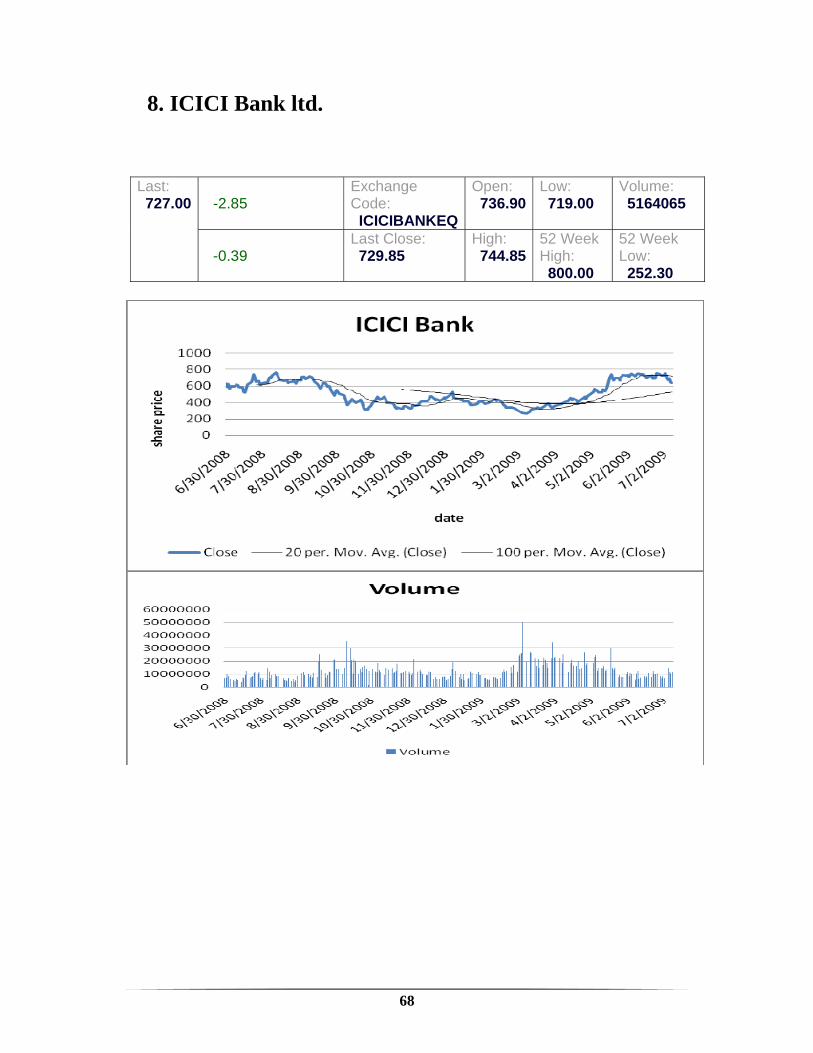
68
8. ICICI Bank ltd.
Last: 727.00
Change: -2.85
Exchange Code: ICICIBANKEQ
Open: 736.90
Low: 719.00
Volume: 5164065
Percent Change: -0.39
Last Close: 729.85
High: 744.85
52 Week High: 800.00
52 Week Low: 252.30

69
70
Chapter-8
CONCLUSION AND RECOMMENDATION
Fundamental analysis of stocks:
1.HDFC Bank Ltd. Recommend BUY HDFC Bank delivered a Net Profit growth of 45% yoy to Rs464cr (Rs321cr). However,
the numbers are not comparable as 1QFY2009 numbers are after accounting for the
merger with Centurion Bank of Punjab (CBoP). EPS growth was 13% yoy. While a
breakup of line items into HDFC Bank standalone and CBoP was not available, including
CBoP 1QFY2008 Net Profits, profits grew 31% yoy. The Bank absorbed the additional
Provisioning Expenses to bring CBoP’s accounting policies for NPAs in line with its own
stricter policies, by adjusting the same against Reserves, with an estimated impact of
roughly Rs15-20 per share. Management indicated Core NIMs of the merged entity stood
at about 4.1%, while the CASA ratio declined to 45%. At the same time, Operating
Expenses, excluding Staff Costs were down 1% sequentially, indicating substantial cost-
cutting measures implemented during the quarter, in line with peers. Asset quality
remained stable, with the Net NPA ratio remaining at 0.5%. MTM losses on Bond and
Equity books were manageable at around Rs78cr
2. TATA MOTOR. Recommend SELL OR HOLD. TAMO’s long term debt on a consolidated basis went up to Rs.163bn in FY09. In
addition to it the company has raised NCDs for Rs.42bn and it also raised ~$1bn for JL
for working capital requirements. TAMO has charged actuarial loss for JLR pension plan
of Rs.14.57bn to Reserves which along with losses incurred during FY09, impacted
consolidated net worth and book value at consolidated stood a Rs.113 per share compared
to current estimated debt levels of ~Rs.240bn. We believe the debt equity ratio for FY10E
to become >2x and apart from this the company is also likely to raise debt on JLR
71
books which would increase leverage risk going ahead. We believe CV industry would
continue to face pressures in FY10E mainly due to slowdown in overall economy, lower
industrial production and stringent financing norms. We also don’t expect any immediate
revival in JLR sales volume in FY10E. We estimate TAMO to report EPS of Rs.14 and
Rs.19 for FY10E and FY11E respectively. At current market price of Rs.314, the stock
trades at a PE multiple of 23x and 16x for FY10E and FY11E respectively. We value
TAMO at Rs.194 (10x FY11E) and other subsidiaries at Rs40 (including JLR). We
recommend a SELL on the stock with a target price of Rs.235.
3. LARSEN & TOUBRO
Recommend to hold and keep eyes on stock before BUY
Keeping in view the improving macroeconomic fundamentals and the UPAled
government at the Centre, we are optimistic about an increase in spending on
infrastructure in India over the next few years. L&T’s strategic initiatives to augment
business prospects in some of the most promising sectors such as Power, Railways,
Defence, and Nuclear Energy and excellent execution skills are likely to help the
Company exploit the full potential of emerging opportunities. Consequently, we have
upwardly revised the order book growth estimate for FY10 to 20%, as against the earlier
expectation of a 9% growth.
Technical analysis of stocks:
1. As on 30th June 2009 RELIANCE closed @ 2029 and we RECOMMEND
Buy for LONG-TERM with STOPLOSS of 1859.14 and Sell for SHORT-
TERM and we also expect STOCK to react on Following IMPORTANT
LEVELS .
Simple moving avg. 100 days : 1782.60
72
Resistance 2 1953.66
Resistance 1 1921.78
Support 1 1830.82
Support 2 1798.94
2. JPASSOCIAT closed @ 206.10 and we RECOMMEND Strong Buy for
LONG-TERM with STOPLOSS of 119.49 and Buy for SHORT-TERM with
STOPLOSS of 188.22 and we also expect STOCK to react on Following
100 days SMA : 142.05
IMPORTANT LEVELS. Resistance 2 221.16
Resistance 1 214.96
Support 1 197.24
Support 2 191.04
3. INFOSYSTCH closed @ 1777.65 and we RECOMMEND Strong Buy for
LONG-TERM with STOPLOSS of 1430.34 and Strong Buy for SHORT-TERM
with STOPLOSS of 1672.11 and we also expect STOCK to react on Following
IMPORTANT LEVELS
100 days SMA: 1505.91
Resistance 2 1855.1
Resistance 1 1828.96
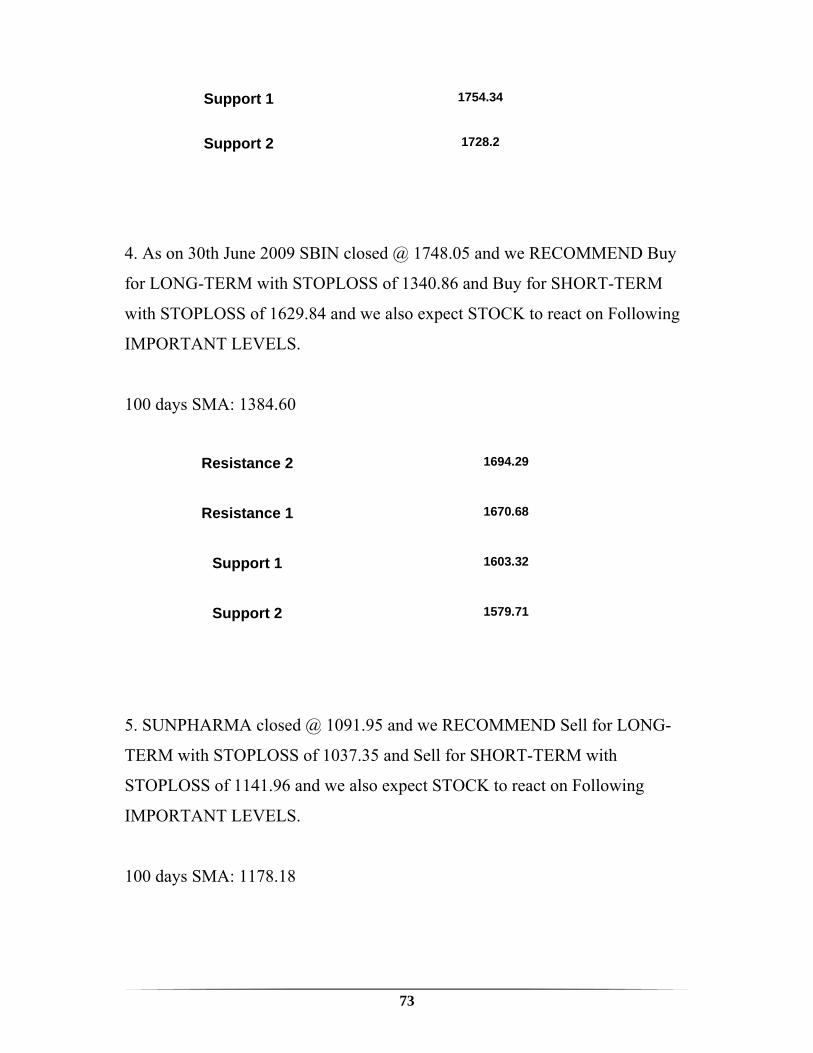
73
Support 1 1754.34
Support 2 1728.2
4. As on 30th June 2009 SBIN closed @ 1748.05 and we RECOMMEND Buy
for LONG-TERM with STOPLOSS of 1340.86 and Buy for SHORT-TERM
with STOPLOSS of 1629.84 and we also expect STOCK to react on Following
IMPORTANT LEVELS.
100 days SMA: 1384.60
Resistance 2 1694.29
Resistance 1 1670.68
Support 1 1603.32
Support 2 1579.71
5. SUNPHARMA closed @ 1091.95 and we RECOMMEND Sell for LONG-
TERM with STOPLOSS of 1037.35 and Sell for SHORT-TERM with
STOPLOSS of 1141.96 and we also expect STOCK to react on Following
IMPORTANT LEVELS.
100 days SMA: 1178.18
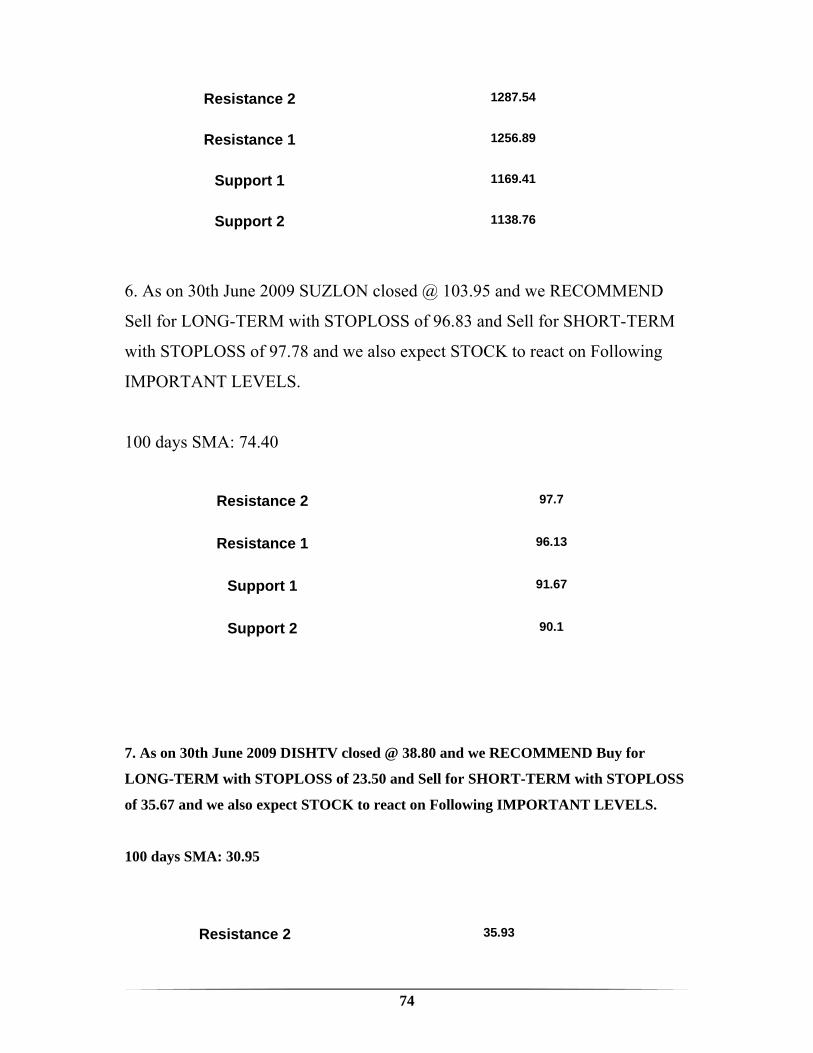
74
Resistance 2 1287.54
Resistance 1 1256.89
Support 1 1169.41
Support 2 1138.76
6. As on 30th June 2009 SUZLON closed @ 103.95 and we RECOMMEND
Sell for LONG-TERM with STOPLOSS of 96.83 and Sell for SHORT-TERM
with STOPLOSS of 97.78 and we also expect STOCK to react on Following
IMPORTANT LEVELS.
100 days SMA: 74.40
Resistance 2 97.7
Resistance 1 96.13
Support 1 91.67
Support 2 90.1
7. As on 30th June 2009 DISHTV closed @ 38.80 and we RECOMMEND Buy for
LONG-TERM with STOPLOSS of 23.50 and Sell for SHORT-TERM with STOPLOSS
of 35.67 and we also expect STOCK to react on Following IMPORTANT LEVELS.
100 days SMA: 30.95
Resistance 2 35.93
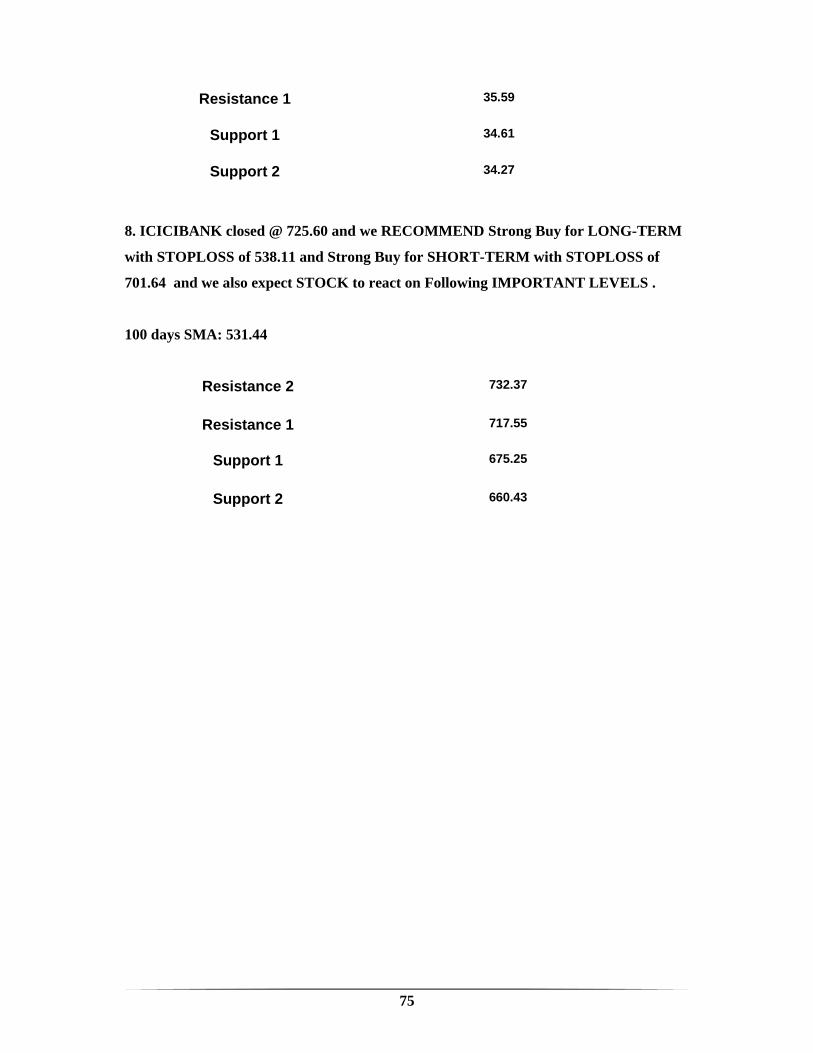
75
Resistance 1 35.59
Support 1 34.61
Support 2 34.27
8. ICICIBANK closed @ 725.60 and we RECOMMEND Strong Buy for LONG-TERM
with STOPLOSS of 538.11 and Strong Buy for SHORT-TERM with STOPLOSS of
701.64 and we also expect STOCK to react on Following IMPORTANT LEVELS .
100 days SMA: 531.44
Resistance 2 732.37
Resistance 1 717.55
Support 1 675.25
Support 2 660.43

76
77
A brief introduction to some terms you are likely to encounter as you start
investing...
• SECURITY ANALYSIS: stands for the proposition that a well-disciplined investor
can determine a rough value for a company from all of its financial statements, make
purchases when the market inevitably under-prices some of them, earn a satisfactory
return, and never be in real danger of permanent loss.
• FUNDAMENTAL ANALYSIS: is the analysis of a stock on the basis of core
financial and economic analysis to predict the movement of stocks price.
• TECHNICAL ANALYSIS: is the study of prices and volume, for forecasting of
future stock price or financial price movements.
• DOW JONES THEORY: The Dow theory is a method of interpreting and signaling
changes in the stock market direction based on the monitoring of the Dow Jones
Industrial and Transportation Averages.
• ELLIOT WAVES BASICS: Breaking through support or resistance levels results in a
change of traders’ expectations
• SUPPORT: Support is a level at which bulls (i.e., buyers) take control over the prices
and prevent them from falling lower.
• RESISTANCE: is the point at which sellers (bears) take control of prices and prevent
them from rising higher
• ROLE REVERSAL: When a resistance level is successfully broken through, that
level becomes a support level. Similarly, when a support level is successfully broken
through, that level becomes a resistance level.
• BULL TREND: The start of an up trend is signaled when price makes a higher low
(trough), followed by a rally above the previous high (peak)
• BEAR TREND: when a rally ends with a lower peak and then retreats below the
previous low. The end of a bear trend is identical to the start of a bull trend.
• LARGE CORRECTION: A large correction occurs when price falls below the
previous low (during a bull trend) or where price rises above the previous high (in a
bear trend).
• MOVING AVERAGE: A moving average is the average price of a financial
instrument over a given time.
78
• RELATIVE STRENGTH INDEX: The Relative Strength Index Technical Indicator
(RSI) is a price-following oscillator that ranges between 0 and 100
• ADVANCE/DECLINE LINE: The “advance/decline line” shows, for some period,
the cumulative difference between advancing and declining issues.
• CLOSING TICK: “Closing tick” is the difference between the number of shares that
closed on an uptick and those that closed on a downtick.
• CLOSING ARMS: “Closing arms” or “trin” (trading index) is the ratio of average
trading volume in declining issues to average trading volume in advancing issues.
• Z-BLOCK TRADES: “zBlock trades” are trades in excess of 10,000 shares.
• HI-LO-CLOSE CHART: A hi-lo-close chart is a bar chart showing, for each day, the
high price, low price, and closing price.
• CANDESTICK CHART: A candlestick chart is an extended version of the hi-lo-
close chart. It plots the high, low, open, and closing prices, and also shows whether
the closing price was above or below the opening price
• POINT AND FIGURE CHARTS: Point-and-figure charts are a way of showing only
major price moves and their direction. A “major” up move is marked with an “X,”
while a “major” down move is marked with an “O.” A new column starts every time
there is a change in direction
• HEAD AND SHOULDERS FORMATION: Once a chart is drawn, technical
analysts examine it for various formations or pattern types in an attempt to predict
stock price or market direction in the case of head-and-shoulders formation.
• ODD-LOT: The “odd-lot” indicator looks at whether odd-lot purchases are up or
down.
• HEMLINE: Followers of the “hemline” indicator claim that hemlines tend to rise in
good times.
• SUPER BOWL: The Super Bowl indicator forecasts the direction of the market
based on whether the National Football Conference or the American Football
Conference wins.
• BETA: Beta is a risk measure comparing the volatility of a stock's price movement
to the general market.
• MOMENTUM: Momentum measures the speed of price change and provides a
leading indicator of changes in trend.
79
• UPSIDE/DOWNSIDE: Measures of Upside/Downside separate the volumes for
rising markets from those in falling markets. Since volume is independent of price, it
makes a valuable tool for measuring the quality of a price trend.
• SWING INDEX: Is a swing or wave system used to capitalize on breakout patterns.
ASI is commonly used to confirm trend line breakouts on price charts.
• ARMS INDEX (TRIN): Short term breadth indicator showing whether volume is
flowing into advancing or declining issues.
•

80
81
BOOKS:
• Erich A. Helfert, D.B.A., “Financial Analysis: Tools and
Techniques” (2000)
• Sharekhan, “Fundamental Analysis: Which Company?” (October,
2004)
• Share khan “ first step to share market” by Tarun shah CEO of
share khan
• John L. Person, “A Complete Guide to Technical Trading Tactics”,
Ninth Edition (March 26, 2004)
• “VALUELINE” (share khan’s monthly magazine)
• Research methodology -C.R. Kothari, VIKASH PUBLICATION.
• “Financial management” Khan & Jain NEW DELHI, TATA
Mc GROW- HIL PUBLICATION.
WEB-SITES:
• http://www.nseindia.com/
• http://www.sharekhan.com/
82
• http://www.moneycontrol.com/
• http://www.indiainfoline.com/
• http://www.icicidirect.com/
• http://economictimes.indiatimes.com/
TV- CHANNELS:
• NDTV-PROFIT
• CNBC-AWAZ