fundamentals in biophotonics week8 - lben | epfl · fundamentals in biophotonics single molecule...
TRANSCRIPT

Fundamentals in Biophotonics
Single Molecule FRET with Total Internal Reflection Microscopy
Aleksandra [email protected]
EPFL – Ecole Polytechnique Federale de LausanneBioengineering Institute IBI
25.04. 2013

Single Molecule FRET with Total Internal Reflection Microscopy
• Outline
• Single molecule Forster resonance energy transfer physics background
• TIRF basic principle
• Dye choice labeling of nucleic acids and proteins
• Surface preparation and data acquisition

FRET‐Förster Resonance Energy Transfer
• First Identified in 1946 by Theodor Förster• Non‐radiative energy transfer between molecules with
overlapping emission‐excitation spectra Excitation energy of a donor molecule is nonradiativly transferred to an acceptor via interaction of two induced dipoles .
http://www.bphys.uni‐linz.ac.at/bioph/res/icg/fret.htm

FRET‐ The Quantum Theory
• Energy is transferred through the resonant coupling of the dipole moments of donor and acceptor
• Energy transition between a donor and acceptor with a finite probability based on proximity

FRET
• When two fluorophores are close together it is possible that one of them absorbs the light (donor), then transfers the energy to the neighboring fluorophore(acceptor), which then emits the light.
• The two conditions for this to happen are:• Transition dipole interaction between the two fluorophores (i.e., they need to be
close together and aligned). • Significant overlap of the emission spectrum of the donor with the absorption
spectrum of the acceptor.
Example: Fluorescein (donor) and Alexa‐546 (acceptor):

FRET efficiency and distance Example of pairs of fluorophores
Ro values (in Å) represent the distance at which fluorescence resonance energy transfer from the donor dye to the acceptor dye is 50% efficient.

Choosing a Fluorophore
• 1. Fluorophore pair with significant spectral overlap• 2. Pair should be compatible by chosen instrumentation
‐Ability to be excited‐Proper filters for detection‐Lifetime
• 3. Can I label the molecule accurately?• 4. Does fluorescent label interfere with molecule’s function?
• Dyes must bephotostable‐so that they emit millions of photons before photobleachingBright high extinction coefficient and quantum yield Showing little intensity fluctuations (on biological timescales) Excitable and emitting in visible wavelengthsRelatively small so that perturbation is minimal to the system Commercially available in a form that can be conjugated to biomolecules

FRET
Å 1/62
0 5 4
2
2
D
9000ln(10)128
wheredipole orientation factor range form 0 4 2 / 3 for randomly oriented donors and acceptors
'QY fluoresence quantum yield of donor i
D
A
A
QY JR
N n
N Avogadro s number
n the absence of the acceptor n refractive index
spectral overlap integral J
Basically, FRET is a great method to determine the distance between two fluorophores(molecules) in the range of ~1‐10 nm.
4 3 1
where
fluresence emission intensity of donor as a fraction of the totoal integrated intensity
D
D
J F d cm M
extinction coefficient of acceptorF
transfer 6
0
1Er1R
Efficiency of transfer:

FRET: measuring conformational changes of single biomolecules
The distance interactions between green and red light bulbs can be used to deduce the shape of the scissors during the function.
FRET useful for 20‐80Å

Primary Conditions for FRET
• DISTANCE : Donor and acceptor molecules must be in close proximity (10‐100 Å)
• SPECTRUM OVERLAP: The absorption spectrum of the acceptor must overlap the fluorescence emission spectrum of the donor
• DIPOLE‐DIPOLE ORIENTATION: Donor emission dipole and acceptor excitation dipole must be approximately parallel
• Free software for calculating R0 is available from
• http://www.photochemcad.com/

FRET: What is it Good For
Applications:Structure and conformation of proteinsSpatial distribution and assembly of protein complexesReceptor/ligand interactionsImmunoassaysProbing interactions of single moleculesStructure and conformation of nucleic acidsReal‐time PCR assays and SNP detectionDetection of nucleic acid hybridizationPrimer‐extension assays for detecting mutationsAutomated DNA sequencingDistribution and transport of lipidsMembrane fusion assaysMembrane potential sensingFluorogenic protease substratesIndicators for cyclic AMP and zinc

GOOD FRET pairs Appreciable overlap between donor emission and acceptor absorption
Large separation between donor and acceptor emission
Comparable emission quantum yield , which guarantees clearly anti corelated intensity changes
Cy 3 and Cy5 extremely popular
Spectral separation 100 nm
Photostable
Comparable quantum yield 0.25
Commercially available in thiol, amine and other reactive forms

Labeling
• FRET is insensitive to incomplete labeling of host molecules• Labeling RNA DNA • Companies that provide • IDT – 5’ end offers labeling 5‐100 nucleotides
3’ end 5 to 50 nucleotides
Dyes are inserted through phosphoramidite chemistry / Nucleoside phosphoramiditesare used to synthesize short nucleic acid chains
• Labeling proteinsthiol groups (SH) show very high specificity and Cystein is only amino acid that has the thiol group thiol group reacts with melanmide form of a dyevery simple mixing yields good labelingpreferably only one FRET pair per protein, unfortunately many proteins have more than one Cystein – fto remove few Cystein solutionsite directed mutagenesis

Sample labeling

Sample labeling general design RULES
• If the protein recognizes a certain chemical feature of DNA the fluorophore should be placed elsewhere
• For internal labeling keep the backbone continuity of DNA
• In the DNA the part that interacts with a protein may b placed away from the glass surface to avoid potential physical constraints
• If using 3 color FRET design pairs so that 2 acceptors are very well separated
• For studying DNA protein binding events attach donor to the protein and acceptor to the DNA –binding produces sudden increase in fluorescence
• Avoid to high protein concentration‐ to suppress back ground fluorescence

Surface immobilization strategies
• Two strategies • By using biotin neutravidin
glass or quartz ‐negative charge good for DNA RNA at neutral pH repels
DNA/RNA
• Or amine modifies glass surface with biotinylated PEG
• Better suited for proteins since BSA coated surfaces are to adhesive


smFRET advantages
• In comparison to other sm techniques smFREt is less prone to environmental noise
1. It is inherently ratio metric technique where we measure the ratio between two colors
2. It reports on the internal movements of molecules in their center of mass frame thus variations in excitation and detection efficiencies between molecules are mostly tolerable
3. it is relatively easy to acquire data for several thousands of molecules and therefore kinetic rates could be determined with the highest accuracy screening out intrinsic heterogeneity between single molecules
4. However photo physical properties of organic dyes limit its resolution to several milliseconds

Single molecule fluorescence FRET
• Like bulk fluorescence, except on a single fluorophores• Challenges:
– Photobleaching: Most fluorophores photobleach, i.e. after absorbing many photons ( usually a few million), they chemically rearrange and stop fluorescing (end
of experiment). – Signal to noise ratio (need to reduce noise and have sensitive detection)– Must have very, very clean sample. – Detecting weak signals requires very sensitive instrumentation
• Needed: – A strong fluorophore (high absorbance and Q‐yield).– Intense light source (often laser).– Very sensitive camera/detector– Eliminate all background light. – Illuminate a very small region only– Confocal microscopy (images only slices (stacks) of a sample)– Use TIR (total internal reflection).

Total Internal Reflection Fluoresence TIRF
• What is TIRF?• Why do we constantly use acronyms to describe everything?• Microscope Configurations
‐Prism vs Prismless• Biological Applications
‐Brief Aside• Unique attributes to our system
‐Calibrated TIRF planes‐TIRF‐FRET
• TIRF‐photoactivation

Index of refraction “bends” light
water 1.33
air 1.0003
glass 1.517
coverglass 1.523
immersion oil 1.516
cell cytosol 1.38
mount variable

Propagation of Light at a Solution‐Surface Interface
1. Refraction
2. Propagation along interface‐occurs at the “critical angle” c
3. Total Internal reflection ‐occurs when > c
sin sinquartz q water wn n

Total Internal Reflection Fluoresence TIRF
1. TIR occurs under two conditions
1 2
C
n n
22 2
1
2 sin
iP
i
dnnn

The Evanescent Wave
• An electromagnetic field extends into the medium of lower refractive index
• The evanescent depth d extends ~ λ• The intensity decreases exponentially
note: d is only the depth at which the intensity of the evanescent wave is 37% of the initial intensity. Thus, can empirically determine the experimental depth at which fluorophores are visible using fluorescent beads (Keyel, Watkins, and Traub 2004 JBC)
22 2
1
2 sin
iP
i
dnnn
/
0( ) z dI z I e
λ0 = 488; n2=1.52; n1=1.38 dempirical = 190 nmλ0 = 647; n2=1.52; n1=1.38 dempirical = 238 nmλ0 = 488; n2=1.78; n1=1.38 dempirical = 142 nm

Total Internal Reflection Fluoresence TIRF
• An evanescent field is generated into the solution phase• Fluorescent molecules that enter the field fluoresce• Maximum fluorescence at the surface

The basics of imaging cells by TIRF microscopy
• At a specific critical angle [θcritical = sin‐1(n1/n2)] light is totally reflected from the glass/water interface. The reflection generates a very thin electromagnetic field that has an identical frequency to that of the incident light, providing a means to selectively excite fluorophores within ≤ 100 nm of the coverslip.

Prism based TIRF
zd
0
2 2 21 1 2
I( z ) I epenetration depth:
d4 n sin n
n1 …index of refraction of glass sliden2 …index of refraction of water … incident angle … wavelength of light
TIRF No TIRF
Relative light intensity
0.125
0.25
0.5Only molecules close to surface will fluoresce
Distance above cover slip
44 nm
88 nm
132 nm
Laser
Prism and cover slip Microscope objective
No signal (background) from molecules far from surface.

Prism based TIRF
• Prism-based TIRF limit access to sample

TIRF Comparison
Prism Method
1. “Purer” evanescent wave
2. Limited access to sample
3. Few commercial manufactures
4. Open laser systems
5. Typically lower NA objectives
Prism‐less Method
1. Higher NA will allow confinement closer to surface
2. Not as pure an evanescent wave as prism
3. Commercial system readily available

Objective‐based TIRF illumination
Total reflection1: Objective, 2: Immersion oil n = 1.518, 3: Cover slip n = 1.518, 4: Evanescent field, 5: Mountant n = 1.33…1.38
Ray paths (schematic):
Angle of incidence smaller than the critical angle.

TIRF is commonly done inside the objective
• TIRF objectives are now starting to come with compensation collars for varying temperature and cover slip thickness
100X 1.65 NA objective:θc = sin -1(n1/n2) = 50.83º[calculated using n2 = 1.78 (RI coverglass and immersion liquid) and n1 = 1.38]
Maximum Angle θm from the optical axis that TIR will occur is:NA = n2 sin θm
60X 1.45 NA θm = 72.54º100X 1.65 NA θm = 67.97º
100X 1.45 NA objective:θc = sin-1(n1/n2) = 65.22º[calculated using n2 = 1.52 (RI coverglass and immersion liquid) and n1 = 1.38]

TIRF


TIRF setup

smFRET TIRF setup multicolor detection
• Build around Olymous IX 71 microscope
• Two color emission optics Collimated beam goes through a dichroic mirror and the donrand acceptor images are projected on one‐half of the CCD camera each
• Three color setupdonor color is separated first , same trick is employed to split acceptors signals

Typical DATA from smFRET
• FIRST find FRET efficiency apparent FRET efficiency through
What we actually measure are the raw intensities of the donor and acceptor channels IA0 and ID0 we need than to correct for leakage of donor signal to the acceptor channel
A
appA D
IEI I
0 0
0 0 0A D
appA D D
I IEI I I

Typical DATA from smFRET
FRET efficiency
Where is correction factor
Easy to notice two states Apply automated threshold analysis We fit the dwell time histogram to of each state to obtain lifetimes A and B
A
D D
IEI I

Typical DATA from smFRET
If the timescale of the fluctuations is very fast use cross correlations this type of analysis can tell us if donor and acceptor are fluctuating in anticorrelated manner
• Dwell time
( )
( ) ( ) ( )A B B A
D A
k k
CC I t I t dt
Ae

Typical DATA from smFRET
From the cross correlation curve fit we can obtain the sum of two rates and if FRET efficiency histogram is clean enough in combination we can determine both
( )A B B Ak kAe
A Bk B Ak and
For more than one state more evolved algorithms are need than just simple treshholdingAnd cross correlation analysis – USE HIDDEN MARKOV MODELING

Hidden Markov Modeling tools
• Rule inspect your traces if states are well separated no need for Hidden Markov modeling
• For multiple states or unclean data use it ! HaMMy is tool developed in Ha lab
• http://bio.physics.illinois.edu/HaMMy.html

Other types of traces
• Solution exchange
• Disappearance of signalWhen FRET signal drops to zero to be sure that this comes form the relative dye
positioning and not simply form photo bleaching of the donor direct acceptor excitation uses to confirm the data

Other types of traces
• FRET histograms

Fluorescence Techniques to measure molecular binding
• Fluorescence Resonance Energy Transfer – FRET• Good for showing interactions between tagged molecules. It can be used to
measure rearrangements within or between proteins or concentrations of ions such as H+ or Ca2+.
• Fluorescence Correlation Spectroscopy – FCS• This allows the measurement of diffusion rates and hence molecular/ complex size.
Multiple channels allow measurements of interactions.

Why colocalisation isn’t enough

What is Fluorescence Correlation Spectroscopy?

How do you do FCS?
• Look at the intensity of fluorescence from a small volume < 1 femto‐litre (10‐15l)• Calculate the auto‐correlation function :‐ how similar is the intensity now to some
time in the future?• Fit a theoretical model to measure various parameters ‐ concentration, diffusion
rate an flow
Typical FCS autocorrelation curve

What Does FCS tell us?
• Diffusion rate ‐ hence complex size – however only good for order of magnitude, D ∝m1/3.
• Tells us the number of fluorescent objects in volume and hence concentration.• Can be used to measure flow.
FCS curve amplitude but not shape depends on concentration

Limitations of FCS
• . Low sensitivity to changes in mass of diffusing particles, D ∝m1/3.
• Small range of useful concentrations, need ~1‐100 molecules in your volume, typically nM concentrations.
• Only works on diffusing particles.

Fluorescence Cross‐Correlation Spectroscopy FCCS

FCCS
• Like FCS, but with two different fluorescent labels at once. By looking at the cross‐correlation, does the redsignal go up when the green signal goes up etc…, we can measure interacting fractions.
The interacting fraction of each species with the other is the ratio of the auto‐to cross‐correlation curvesAlignment critical ‐max interaction < 1.

Photobleaching Techniques
• Illumination with bright light will lead to photobleaching of a fluorophore. Once photobleached the fluorophore is no longer fluorescent.
• Two related techniques of Fluorescence Recovery After Photobleaching (FRAP) and Fluorescence Loss in Photobleaching FLIP) use photobleaching to measure molecular dynamics.
• Laser Scanning Confocal microscopes are good for these photobleachingtechniques due to their high intensity laser light sources and their flexible illumination control. They allow selective bleaching of arbitrary regions within the filed of view and can then rapidly switch between bleaching and imaging. However, reduced sensitivity and slow speed make a widefield microscope better if it has the ability to photobleach Illumination with bright light will lead to photobleaching of a fluorophore. Once photobleached the fluorophore is no longerfluorescent.

Fluorescence Recovery After Photobleaching ‐FRAP
• A region is rapidly bleached and the rate at which fluorescence fills• the bleach region is determined by the diffusion of unbleached molecules.• Small objects – fast diffusion• Large objects – slow diffusion
FRAP
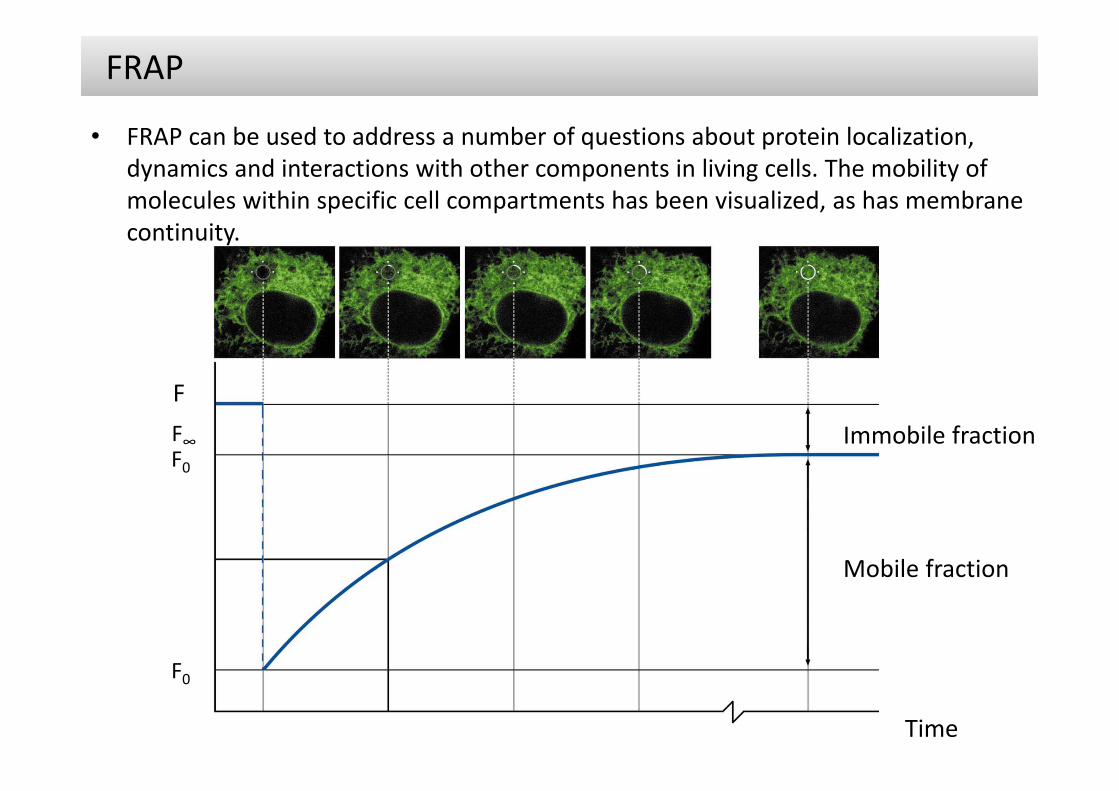
• FRAP can be used to address a number of questions about protein localization, dynamics and interactions with other components in living cells. The mobility of molecules within specific cell compartments has been visualized, as has membrane continuity.
Mobile fraction
Immobile fraction
Time
F
F0
F0F∞

FRAP
• When a region in the fluorescent area (here the endoplasmic reticulum) is bleached at time t0 the fluorescence decreases from the initial fluorescence Fi to F0. The fluorescence recovers over time by diffusion until it has fully recovered (F∞). The characteristic diffusion time tD indicates the time at which half of the fluorescence has recovered.
• The mobile fraction can be calculated by comparing the fluorescence in the bleached region after full recovery (F∞) with that before bleaching (Fi) and just after bleaching (F0).

Fluorescence Loss in Photobleaching (FLIP)
• Related to FRAP, a small region is repeatedly bleached and the loss of fluorescence in another region is measured.
• Useful to show connectivity of compartments or for measuring turnover between compartments.

Summary of FRAP and FLIP
• FRAP good for diffusion rates (complex formation).• FLIP good for connectivity studies.• But• Bleached molecules are lost to detection.• FRAP & FLIP are not good for following localisation of a• subpopulation.• Friday, 16

Fluorescence Localisation After Photobleaching (FLAP)
• Related to FRAP and FLIP, by having a single species labelled with two fluorophoresFLAP allows localisation of both the unbleached and the bleached molecules.

FLAP procedure
• If the images of the two fluorophores are accurately matched before bleaching, the difference signal (red) is everywhere zero.
• CFP – actin Yfp actin
but after bleaching it reveals the location of the bleached molecules.The FLAP signal is simply the image of this difference signalshown in pseudo‐colour.
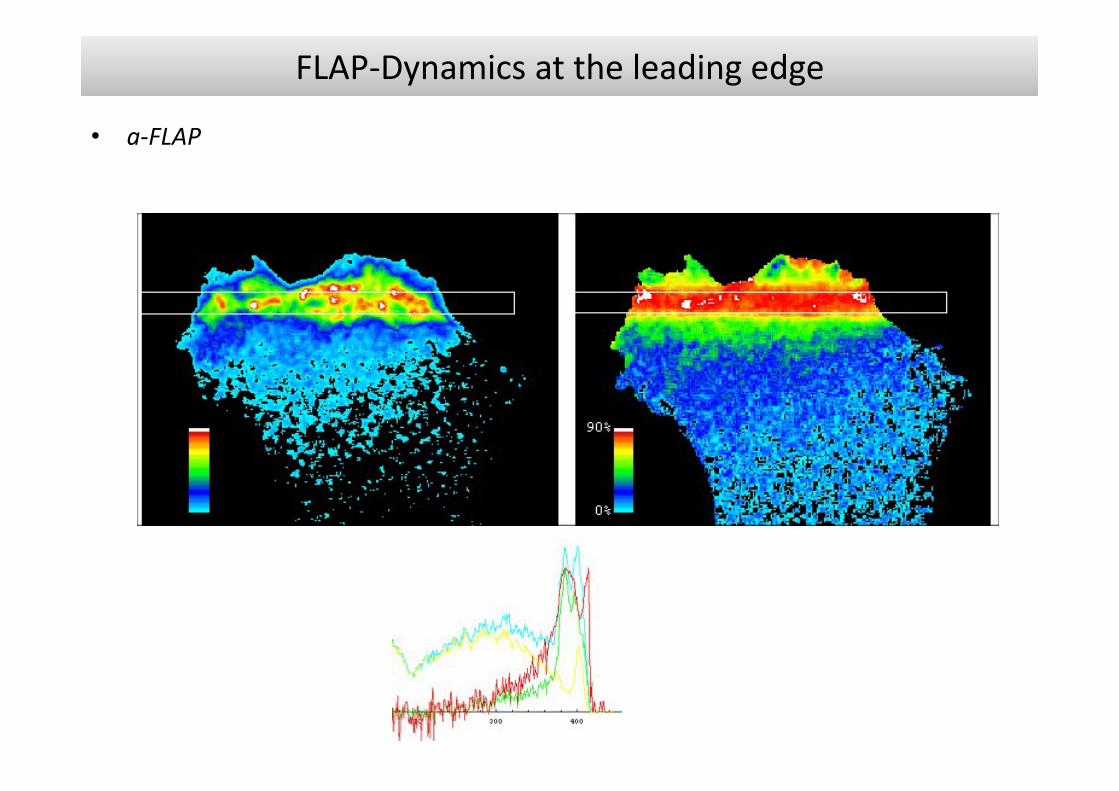
FLAP‐Dynamics at the leading edge
• a‐FLAP