fundamentals of acoustic beamforming educational notes/sto-en... · coustic sound sources, ... for...
TRANSCRIPT

Leandro de SantanaDepartment Thermal Fluid Engineering
University of TwenteP.O. Box 217
Enschede, 7500 AEThe Netherlands
ABSTRACT
The acoustic beamforming is an instrumental tool applied to the localization and quantification of acousticsources. This technique has been proven in a large range of academic and industrial applications along theyears showing to be very robust, efficient and accurate. This lecture note discusses the fundamentals of delay-and-sum and conventional beamforming and the deconvolution techniques DAMAS, DAMAS2, CLEAN-PSFand CLEAN-SC. Additionally, it is shown some application examples in simulated and experimental aeroa-coustic sound sources, followed by a discussion about some strengths and limitations of each algorithm.
Contents
1.0 Introduction 2
2.0 Fundamentals 32.1 Microphone data acquisition . . . . . . . . . . . . . . . . . . . . . . . . . . . . . . . . . . . 32.2 Acoustic waves . . . . . . . . . . . . . . . . . . . . . . . . . . . . . . . . . . . . . . . . . . 6
3.0 Delay-and-Sum beamforming 73.1 Time domain formulation . . . . . . . . . . . . . . . . . . . . . . . . . . . . . . . . . . . . . 73.2 Frequency domain formulation . . . . . . . . . . . . . . . . . . . . . . . . . . . . . . . . . . 83.3 Applications of the conventional beamforming technique . . . . . . . . . . . . . . . . . . . . 93.4 The Point-Spread-Function (PSF) . . . . . . . . . . . . . . . . . . . . . . . . . . . . . . . . 103.5 The convolution between the acoustic sources and the microphone array PSF . . . . . . . . . 113.6 Quantification of results . . . . . . . . . . . . . . . . . . . . . . . . . . . . . . . . . . . . . . 12
4.0 Deconvolution Techniques 134.1 DAMAS . . . . . . . . . . . . . . . . . . . . . . . . . . . . . . . . . . . . . . . . . . . . . . 134.2 DAMAS2 . . . . . . . . . . . . . . . . . . . . . . . . . . . . . . . . . . . . . . . . . . . . . 154.3 CLEAN-PSF . . . . . . . . . . . . . . . . . . . . . . . . . . . . . . . . . . . . . . . . . . . 174.4 CLEAN-SC . . . . . . . . . . . . . . . . . . . . . . . . . . . . . . . . . . . . . . . . . . . . 21
STO-EN-AVT-287 4 - 1
Fundamentals of Acoustic Beamforming

1.0 INTRODUCTION
Noise is a modern societal problem that, among other consequences, hinders the installation of large wind tur-bines close to residential areas and limits the number of take-offs and landings in large airports. In recent years,the academia and industry joined efforts to propose noise reduction solutions which significantly contributed tothe keep the noise issue under certain level of control.
The beamforming technique is one of the most successful noise localization and quantification approachesable to support designers and engineers to rank and quantify individual noise sources. This technique is veryrobust allowing to distinguish sources even in challenging situations when the source intensity is many decibelsbelow the background noise level. This capacity allows designers and engineers to more precisely evaluate(innovative) noise reduction solutions.
From an historical perspective, the beamforming technique is predeceased by elliptic acoustic mirrors [1–4](see Fig. 1). This approach assumes sound waves propagating as acoustic rays. Accordingly to the descriptionpresented in Fig. 1, assuming that the noise source is located in the acoustic far-field (in relation to the mea-surement position), it is possible to focus the acoustic mirror on any point where the noise source is expected tobe (acoustic focal point F2). Therefore, the microphone placed in the acoustic focal point F1 will measure thesource strictly located in the point F2. This signal can be Fourier-transformed allowing to quantify the soundsource intensity at specific frequency bands.
Figure 1: Schematic representation of the working principle of an acoustic mirror (left) and set-up with an acoustic mirror inDNW-LLF open jet facility (right). Source: left [4]; right [5].
The elliptic mirror performs “spatial filtering” allowing to efficiently distinguish closely located noisesources practically removing the background noise influence. This technique was largely applied until theearly 90’s in the localization of acoustic sources in academic and industrial wind tunnel environments such asthe DNW-LLF facility (Fig. 1 right). However, the elliptic mirror represents to be an expensive technique tobe applied in large industrial wind tunnel facilities. The large cost is related with the low-productivity of thistechnique since, for each measurement point, the mirror has to be mechanically moved with help of an accu-rate traverse system. After that, data should be sampled for some seconds or minutes (depending the requiredprecision), turning the process long and tedious.
After the middle 90’s, advances in digital computers, development of fast data acquisition system, largecapacity and fast data storage, turned the microphone array techniques highly attractive to perform acousticnoise source localization and quantification. Nowadays, the technological development of hardware and soft-ware allows experimental researchers to efficiently build (or purchase) very robust microphone arrays equippedwith more than a hundred of microphones. This large technological leap made possible performing very refinednoise source localization in full size wind turbines, scaled aircrafts placed in industrial wind tunnels and real
Fundamentals of Acoustic Beamforming
4 - 2 STO-EN-AVT-287

size aircrafts flying over microphone arrays placed on the ground (see Fig. 2).
Figure 2: Beamforming applied to wind turbine noise source localization (left); center and right: wind tunnel airframe noisetesting. Source: left [6]; center [7]; right [4].
The microphone array is the most complex instrumentation required in the application of the beamformingtechnique. Figure 3 shows an example of an airfoil noise measurement performed in the University of TwenteAeroacoustic Wind Tunnel. In Fig. 3 (left) the flow comes from the left to the right direction. Since this windtunnel has an open test section, the microphone array can be placed outside the flow reducing significantly theinfluence of the pressure fluctuation induced by the flow into the signal measured by the microphones. In thiscase the CAE Systems Bionic M-112 microphone array equipped with 112 digital MEMS microphones is used.This array uses digital microphones and a FPGA digital data acquisition system. With the fast developmentof the smart phones, nowadays we have increasingly high-quality miniaturized digital microphones. Due tothe massive production of those applied to the telecommunication, they are nowadays available in the marketfor purchase for a couple of Euros. Furthermore, digital data loggers have currently a more affordable priceper channel than analog data acquisition systems. Furthermore, digital protocols allows perform data multi-plexing which significantly reduces the number of physical channels required for data acquisition. This recenttechnological innovation allows to reduce the cost per channel of a microphone array by a factor of up to onehundred. Turning, therefore, the beamforming microphone array technique application in product developmentaffordable to small and medium size companies.
2.0 FUNDAMENTALS
2.1 Microphone data acquisition
The beamforming technique applied to noise source localization and quantification requires the frequency do-main interpretation of the pressure signal acquired by each microphone of the array. The acoustic pressure is aphysical continuous signal that has to be digitally interpreted in the beamforming processing. The beamform-ing technique considers an array of M spatially distributed microphones and the typical analog data acquisitionchain of each sensor is schematically represented in Fig. 4.
In this schematic representation, the acoustic wave excites the microphone membrane producing an smallAC voltage that is amplified in the microphone preamplifier in order to reduce the influence of the electronicnoise produced by the cables and connections that conduct the information to the amplifier. The amplified
Fundamentals of Acoustic Beamforming
STO-EN-AVT-287 4 - 3

Figure 3: Left: Example of application of a beamforming microphone array in the localization and quantification of acousticsources in a wind tunnel airfoil noise measurement. Test performed in the University of Twente Aeroacoustic Wind Tunnel.Right: example of the microphone distribution in the array. The sensors placement “seems” to be random, however they areoptimized such to improve the array performance. The left figure is published under authorization of LM Wind Power.
Microphone
transducer
Sound
waveMicrophone
preamplifier
Analog
amplifier
Low-pass
(anti alias) filter
Analot-to-digital
data converter
Figure 4: Schematic representation of the microphone data acquisition system.
signal is then low-pass filtered to avoid the alias effect in the analog-to-digital conversion. The reader is invitedto check the references [8, 9] for further details about the analog-to-digital conversion process and detailsabout critical problems, e.g. aliasing, in the digital data sampling. After this step, the continuous microphonesignal p(t) is stored in the computer memory as a discrete set of data p(n∆t) sampled at constant time steps∆t = 1/fs, where fs is the sampling frequency and n is an integer number.
The acquired data has to be Fourier-transformed in order to be represented in the frequency domain andallow the application of more complex post-processing beamforming techniques. The Fast-Fourier-Transformalgorithm is used for this propose. Considering a block with K samples the discrete Fourier-Transform relatesthe time domain pressure p(n∆t) with the complex valued (therefore representing the phase and amplitudeinformation) frequency domain pressure as:
p(f) =2
K
K∑n=1
p(t)e−2πi f n∆t . (1)
The Fast-Fourier-Transform algorithm requires the size of the Fourier-transformed data blockK be a powerof 2. Furthermore, the pressure p(f) is available at discrete frequencies:
0 ≤ nfsK≤ fs
2, (2)
where n is an integer number, the discrete Fourier-transform results that the frequency domain data is repre-sented now discrete frequencies in steps of an integer number multiplied by fs/K and the upper limit is fs/2
Fundamentals of Acoustic Beamforming
4 - 4 STO-EN-AVT-287

which is the Nyquist frequency which indicates that the digital data conversion process cannot represent datawith frequency higher than half of the sampling frequency. This happen because (roughly speaking) it is re-quired a minimum of two points to represent a sine or a cosine wave. Therefore, the energy content in thesignal relative to waves with more than half of the sampling frequency ”folds back” being interpreted by thedigital data converter as low-frequency waves contaminating, therefore, the acoustic spectrum. This justifiesthe mandatory presence of a analog low-pass filter in the data acquisition chain, represented in Fig. 4 which isable to remove from the signal the energy of the waves with frequency above fs/2.
The beamforming technique requires the estimation of the Cross-Spetral-Matrix (CSM) – which will bediscussed in detail later. The spectral estimator of the microphone cross-power pair is defined as:
Cmn = E(pm(f)p∗n(f)) , (3)
where m and n represents the microphone number.Considering that the stochastic process is ergodic, i.e. given enough time it can be represented in terms
of statical parameters, the ensemble average of the previous equation can be replaced by the time average,therefore the cross-power spectrum can be estimated as:
Cmn =1
N
N∑n=1
pm(f)p∗n(f) , (4)
however, in real-world, every measured signal is contaminated by noise, e.g. electronic interference, turbulentflow reaching the microphone inducing the so-called pseudo noise, etc. Therefore the cross-power estimatorcan be written considering the noise influence as:
Cmn = E [(pm(f) + ξm(f))(pn(f) + ξn(f))∗] , (5)
where ξ(f) corresponds to the noise here considered as a random phenomena. Considering that the noisecomponent of the signal has zero mean and variance σ. Assuming that the noise is statistically independentfrom the (acoustic) signal intended to be measured, the cross-correlation between noise signal measured by twodifferent channels should be equal to zero. Therefore, the cross-power estimator is represented as:
Cmn = E(pm(f)(pn(f))∗) + σ2I , (6)
where the term σ2I is the statistical variance of the noise. Due to the statistically independence of the noisemeasured by two different channels, if the sampling time is long enough, off-diagonal CSM elements haveuncorrelated noise and therefore they will be equal to zero. While the diagonal elements (auto-power) will beequal to the statistical variance of the noise. Therefore, an important result to keep in mind, in the applicationof the beamforming technique, is that the noise only influences the diagonal elements of the cross-spectralmatrix. In practical situations where the microphone is subjected to flow, e.g. closed test section wind tunnelmeasurements, the pseudo-noise induced by the turbulent flow interacting with the microphone surface cansignificantly contaminate the CSM diagonal elements. This consequently requires use of advanced techniquessuch as diagonal removal in order to minimize this effect [9].
The cross-spectral matrix Cmn represents therefore an statistical estimation of the measured signal. Amongthe methods to estatistically estimate the CSM, the Welch method [10] is the most broadly used. For those whoprogram in Matlab, this algorithm is already programmed in the function pwelch (for auto-spectra) and cpsd(for cross-power spectrum estimation). For completeness, the description of the Welch algorithm is presented:
Fundamentals of Acoustic Beamforming
STO-EN-AVT-287 4 - 5

1. The original data segment is split up into (typically 50%) overlapping segments of 2n samples each(integer n);
2. The segments are then windowed (rectangular, triangular, Hanning, Hamming, etc);
3. For each segment, compute the periodogram by computing the discrete Fourier transform;
4. For the chosen microphone pair, multiply the periodogram;
5. Average the periodogram (this reduces the variance);
6. The end result is an array of cross-power measurements versus the frequency “bin”.
2.2 Acoustic waves
For completeness, a brief discussion about points necessary to understand the beamforming technique are pre-sented. The reader is recommend to read books such as Pierce [11] for more complete and didactic explanationsabout acoustics and Dowling [12] for aeroacoustics.
The acoustic sources localization by the beamforming technique is only possible due to the fact that acousticwaves have finite propagation speed that only depends of the medium (air, water, etc...) and temperature. Inair at 27°, the sound propagates at 347 m/s. This property results that the sound wave produced by a givensource will present different phase depending on the propagation distance. Therefore, each microphone in thearray will “perceive” a different phase and, by knowing the sensors location, the source position consequentlyis found.
The source modeling in acoustic beamforming of fundamental importance. In acoustics and aeroacoustics,it is common practice to represent complex noise sources as a combination of monopole, dipole and quadrupoleelementary sources. For extra literature please check: [11–13]). Most of the standard beamforming techniquesalso assume that the distance between source and observer is large enough and the microphone array diameter issufficiently small to guarantee that the source directivity pattern does not play an important role and, therefore,complex acoustic sources can be well approximated by a distribution of monopole sources. Alternatively,when the microphone array is placed in the near-field of the acoustic source we have the Near-field AcousticHolography, however this technique is out of the scope of this discussion.
The acoustic wave propagation in a continuous medium can be exactly represented by the Navier-Stokesequations. However, for noise levels observed in most of the daily and industrial applications (let’s say below130 dB), the acoustic wave propagation can be considered as linear and isentropic phenomena (see Pierce [11]).Therefore, the complex Navier-Stokes equations can significantly simplified into the (Helmholtz) wave equationand still accurately represent the acoustic wave propagation phenomena:(
1
c20
∂2
∂t2−∇2
)p = q(t)δ(x− x0) , (7)
where c0 is the sound speed. In absence of sound sources, the right-hand side of the equation above is equalto zero. However, this equation becomes non-homogeneous in presence of an elementary monopole sourcedescribed by q(t). The Dirac Delta function δ(x−x0) provides the information about the geometrical locationof the sound source. The non-homogeneous wave equation has the free-field (absence of reflections or solidboundaries) solution:
p (x,x0, t) =1
4π
q(x0, t− |x− x0| /c0)
|x− x0|. (8)
Fundamentals of Acoustic Beamforming
4 - 6 STO-EN-AVT-287

This solution informs some important aspects about the propagation of acoustic waves. Firstly, that the am-plitude of the acoustic pressure decays inversely with the distance between source and observer (|x− x0|).Secondly, that the acoustic pressure observed at a moment t is related with the source characteristics at a previ-ous instant |x− x0| /c0. In order words, the information about the acoustic source propagates with finite speedc0 in the medium. Therefore, a key concept for acoustic beamforming is the retarded time (t0) formally definedas:
t0 =|x− x0|
c0. (9)
3.0 DELAY-AND-SUM BEAMFORMING
3.1 Time domain formulation
This section will introduce some fundamental concepts to the understanding of the beamforming technique.Those basic concepts are introduced together with the simplest and more robust beamforming approach, theDelay-and-Sum (DSB) technique [5, 14, 15]. This approach, schematically presented in Fig. 5, considers anarray of m microphones and a search grid located in the plane where the noise source(s) are expected to belocated. The noise localization procedure consists of:
1. define a plane where the noise source is expected to be located and divide this plane into a (rectangular)grid;
2. scan each grid node. For each node, the time signal measured by each microphone is delayed by therespective retarded time (t0 = |x− x0| /c0);
3. the signal of each microphone is then summed and divided by the number of microphones (M ) to generatethe beamformer output map.
Following this procedure, if a source is present in the searching grid node, a constructive interference willoccur and the final beamformer signal will be amplified. Otherwise, the phase mismatch will cancel the signalmaking the resulting amplitude will to be small, indicating the absence of sound source in that search gridposition.
Figure 5: Delay-and-Sum Beamforming.
The beamformer output (L(t)) is mathematically expressed as:
L(t,x0) =4π
M
M∑m=1
pm (x0, t+ t0) |x− x0| , (10)
Fundamentals of Acoustic Beamforming
STO-EN-AVT-287 4 - 7

where pm is the signal measured by each microphone, M is the number of microphones, x0 is the sourceposition and x is the microphone location.
3.2 Frequency domain formulation
The time domain is the simplest and computationally faster beamforming formulation. However, it cannotallow the application of complex post-processing and deconvolution techniques. The microphone data interpre-tation in the frequency domain allows the implementation complex calculation techniques and, consequently,improved results.
The frequency domain beamformer formulation starts with the free-field monopole solution (Eq. 8) Fourier-transform:
P (x,x0, ω) = F {(p (x0, t))} =
∫ ∞−∞
p (x0, t) eiω τd τ =Q(ω)e−iω t0
4π |x− x0|, (11)
where ω is the angular frequency. The time delay (t0) corresponding to the acoustic wave propagation distancebetween source and microphone is, now in the frequency domain, represented by the complex number e−iω t0 .
The Fourier-transform of the beamformer presented in Eq. 10 is:
L(ω,x0) = F {z(t)} =4π
M
M∑m=1
|x− x0|P (x,x0, ω)e−iω t0
=1
N
N∑m=1
s(x, ω)P (x,x0, ω) , (12)
where s(x,x0, ω) is the so-called steering function:
s(x,x0, ω) = 4π |x− x0| e−iω t0 . (13)
Considering an array with M microphones, the steering function can be summarized in the so-called steer-ing vector:
g(x, ω) =
4π |x1 − x0| e−iω t1
4π |x2 − x0| e−iω t2
...4π |xM − x0| e−iω tM
(14)
where (x1 . . .xM) represents the position of each microphone in the array and (t1 . . . tM ) is the propagationtime between the searching grid point x0 and the respective microphone. In some occasions, the analysesbecome more convenient if the steering vector is normalized by the distance between source and microphonearray center. Therefore, the normalized steering vector is defined as:
e(x, ω) =g(x, ω)
|xc − x0|=
1
|xc − x0|
|x1 − x0| e−iω t1
|x2 − x0| e−iω t2
...|xM − x0| e−iω tM
(15)
where xc is the microphone array center position.
Fundamentals of Acoustic Beamforming
4 - 8 STO-EN-AVT-287

The Fourier-transformed microphone signals can also be presented in the vector format:
Y (ω) =
P1(ω)P2(ω)
...PM (ω)
(16)
therefore the beamformer Z(ω) can be represented in the matricial form as:
Z(ω) =g(x, ω)†Y (ω)
M(17)
where (·)† notes the Hermite form of a vector (transpose and complex conjugated).The power of the output signal can be calculated with L(x) = |Z|2. Since Z is complex:
L(x) = Z Z∗ (18)
= (g†Y )(g†Y )∗ (19)
= g†(Y Y †)g (20)
This brings to another very important concept in the beamforming theory that is the Cross-Spectral Matrix(CSM).
Y (ω)Y (ω)† = CSM(ω) =
Y1Y∗
1 . . . Y1Y∗M
.... . .
...YMY
∗1 . . . YMY
∗M
(21)
with these concepts in mind, it is already possible to set a first application which allow us to analyze thestrengths and limitations of the conventional beamforming technique. The conventional beamforming analysiswill allow us to understand the importance of the deconvolution techniques.
3.3 Applications of the conventional beamforming technique
“Complicated sources” (nomenclature originally used by Brooks and Humphreys [16]) are used here to analyzethe conventional beamforming technique. Brooks and Humphreys recognizes that spatially distributed andstatistically correlated noise sources are more complex to be localized than statistically uncorrelated pointsources. In real life applications, the aerodynamically generated noise is produced by a combination of sourcesthat could be approximated to a point source, e.g. whistling a cavity(ies), which, in general are statisticallyuncorrelated sources, or a continuous source, e.g. the vortex-shedding noise produced by the flow passingby a sufficiently long cylinder, which has a relatively long spatial statistical correlation length, situation thatrepresents an extra challenge to beamforming source localization.
The University of Twente’s logo is adopted here to exemplify the beamforming technique application. Thisexample uses 847 statistically uncorrelated, closely spaced point sources, schematically shown in Fig. 6, toconstruct the letters of the UTwente logo. All sources produce noise with the similar frequency of 6 kHz andamplitude of 100 dB (sound pressure level). The acoustic sources are localized considering the microphonearray geometry shown in Fig. 3 facing the sources at 1.5 m distance. The acoustic sources localization isperformed considering a rectangular search grid of 0.5 by 0.5 m2 divided by 101 by 101 grid points withresolution of 0.01 by 0.01 m2.
Fundamentals of Acoustic Beamforming
STO-EN-AVT-287 4 - 9

Figure 6: Localization of the closely located point sources adopted to simulate a continous source and evaluate the beamformingtechnique.
Figure 7 shows the noise sources localized with the conventional beamforming algorithm. This figure showsthat within a dynamic range of 12 dB the conventional beamforming technique is able to localize the sources.However, it is noticed that the spatial resolution of this techniques is not optimal leading to many sources beseen as merged. Consequently, the amplitude of the located sources are significantly higher than the amplitudeof the simulated sources. The source merging effect is more pronounced in letters which presents union oflines, such as T, E and specially the letter W (close to the center). This result shows the spatial resolution playsan important role in the beamforming technique. Furthermore, it is seen that the microphone array respondsto the sound source “creating” pseudo sources of (relatively) small amplitude. In this case it is seen that thelogo, presented in red, has amplitude of approximately 112 dB, while the background, presented in blue hasamplitude of approximately 100 dB (the amplitude of the original sources). This effect of “creation” pseudosound sources due to the microphone array geometry and the microphone array resolution are discussed in thenext section where the microphone array point-spread-function is discussed.
3.4 The Point-Spread-Function (PSF)
The microphone array consists of a number of individual sensors having a certain spatial distribution. Consid-ering the practically impossibility of having a spatially continuous distribution of sensors, it is expected thatthe microphone array will work as a spatial filter bank. The properties of those filters are essential to determinethe microphone array performance interfering in the localizing and quantification of acoustic sources. In beam-forming theory, the Point-Spread-Function (PSF) determines how a given microphone array responds to a pointmonopole placed in front of the array.
An ideal microphone array would respond to a monopole point source showing a infinitesimally small pointsource output and without creating “pseudo” sound sources. However, the finite microphone array size and thediscontinuous distribution of microphones makes any real microphone array to spatially alias the point sourceand contaminate the beamforming output map with side lobes which are seen as “pseudo” sound sources.Underbrink [17] recommends that the minimum microphone array distance does not exceed half of the acousticwavelength to avoid significant spatial aliasing, furthermore a large number of studies are present in literatureproposing different array geometries which minimize the side-lobe formation.
Fundamentals of Acoustic Beamforming
4 - 10 STO-EN-AVT-287

Figure 7: UTwente logo beamformed with the conventional beamforming technique.
The PSF function provides insightful information regarding the array performance, providing the beamwidth and the main-to-side-lobe ratio (MSR). In real applications, the beamforming output map is alwaysconvolved with the microphone array response and therefore it is called dirty map.
The knowledge of array the PSF gives information about the the “transfer function” of the microphone arrayfor a given point source which is instrumental to the application of deconvolution techniques to be discussed inthe following sections.
3.5 The convolution between the acoustic sources and the microphone array PSF
The raw image taken by a photo camera, a microscope, a telescope or an acoustic camera brings the sensorresponse convolved with the actual image. Photo cameras, for example, can reduce the sensor influence byincreasing the number of pixels and reducing the spacing between them and by improving the lenses quality.By enhancing the hardware the camera PSF is enhanced resulting into a larger MSR and minimum bandwidth.
By turn, for an acoustic array – also known as acoustic camera –, it is possible to improve the microphonesdistribution up to a certain optimum or increase the number of microphone sensors up to the budget limitand/or the data acquisition and logging system capacity. Due to those practical constraints, researchers haveinvested large efforts to develop deconvolution algorithms which could solve these problems through a muchmore affordable and practical way. In signal and image processing, the concept of deconvolution is widelyused. The deconvolution principle assumes that a recorded signal or image (h) is a convolution of the actualimage (f ) and a certain transfer function (g) which represents the array response to a given source – in acousticbeamforming this is the array PSF:
h = f ? g (22)
Fundamentals of Acoustic Beamforming
STO-EN-AVT-287 4 - 11

Main-lobe
Side-lobeBeamwidth
3 dB
Resolution
Figure 8: Schematic representation of a typical Point-Spread-Function. The array resolution is defined by the beam width at aposition 3 dB lower compared to the peak. This indicates the maximum spatial resolution of a microphone array. The array mainto side-lobe ratio indicates the capacity of a array distinguish sources of different amplitudes.
where ? represent the convolution operator.Crystal clear images of planets and stars could be obtained through the application of deconvolution tech-
niques to the raw “dirty image” f . This example is more clearly seen by the “dirty image” acquired by theHubble telescope and the post-processed (through the knowledge of the telescope PSF function g of this tele-scope) image, see Fig. 9.
Before deconvolution After deconvolution
Figure 9: Hubble Space Telescope photos of Saturn taken before and after convolution. Source: [18]
3.6 Quantification of results
In the engineering analysis of noise reduction solutions the localization of acoustic sources can provide quali-tative indication of the most important noise sources, however the quantification will provide actual means toengineers perform complex design decisions.
Fundamentals of Acoustic Beamforming
4 - 12 STO-EN-AVT-287

From the theoretical point of view, the source quantification with conventional beamforming representsthe most complex task due to the fact that the sources distribution is intrinsically convoluted with the sourcemap L(x). Even with application of advanced deconvolution techniques, the precise quantification of sources,in complex environments, still challenge state-of-the-art researchers. However, reliable noise source quantifi-cation are possible if certain conditions are satisfied. Assuming a distribution of incoherent sources q(x0),Dougherty [19] proposed that the source map can be written as the sources and array PSF convolution:
L(x) =
∫x∈G
q(x0)PSF(x,x0)dx , (23)
therefore the absolute source pressure levels can be extracted from the “dirty map” (L(x)) if the constraints aresatisfied:
• the localized sources are incoherent point sources;
• in the array direction, the sources have uniform directivity
• the beamformer spatial resolution is high enough to distinguish different sources;
• the distance between sources are large enough to avoid the interference of side-lobes;
• the noise measured by all array microphones is coherent;
• there are absence of reflections;
Those are very difficulty conditions to be satisfied in actual (wind tunnel) tests. Therefore, Brooks andHumpphreys [20] propose a two steps procedure for quantitative determination of sound sources: First thesource map is integrated and later the integral is normalized to consider the width of the PSF of the beamformer:
Lf (x) =
(∫x∈G
L(x)dx)(
PSIM∫x∈G LSIM(x)dx
)(24)
where Lf (x) represents the normalized source pressure, LSIM(x) is the beamforming source map, PSIM is thesimulated beamforming source pressure and G represents the searching grid domain. This approach has beenextensively tested and proven of good accuracy provided that the full CSM matrix is used, i.e. no diagonalremoval is considered. The diagonal removal technique is shown to provide less reliable quantification results.
4.0 DECONVOLUTION TECHNIQUES
4.1 DAMAS
In 2004, Brooks and Humphrey [16] proposed the Deconvolution Approach for the Mapping of AcousticSources (DAMAS) method aiming “demystify the 2D and 3D arrays results, to reduce misinterpretation, andto more accurately quantify position and strength of aeroacoustic sources”.
The key idea behind DAMAS is to model the CSM considering a distribution of statistically independentsources placed in the search grid. The modeled CSM is then compared to the measured CSM and a linear systemof equations is formed. The solution to this system of equations provides the source intensity and location.
Fundamentals of Acoustic Beamforming
STO-EN-AVT-287 4 - 13

DAMAS initially proposes to consider the source amplitude Qn normalized by a “virtual” microphoneplaced a given reference position (e.g. the center of the microphone array) due to a source placed in a positionn of the searching grid:
P (ω) = Qn(ω)e−1m:n(x, ω) , (25)
where em:n is one element of the normalized steering vector, defined in Eq. 15, linking the microphone m to aposition n in the searching grid. The pressure cross-power is then written as:
Pm:n(ω)P ∗m:n(ω) = (Qn(ω)e−1m:n(x, ω))∗(Qn(ω)e−1
m:n(x, ω)) = Qn(ω)Q∗n(ω)(e−1m:n(x, ω))∗(e−1
m:n(x, ω)),(26)
therefore the modeled CSM considering a single source placed in a position of the searching grid n is:
CSMmodn (ω) = Xn
(e−11 )∗(e−1
1 ) . . . (e−11 )∗(e−1
M )...
. . ....
(e−1M )∗(e−1
1 ) . . . (e−1M )∗(e−1
M )
n
, (27)
where Xn = P (ω)P ∗(ω) is the microphone power-spectral density contribution of a source located at thegrid position n normalized to the level of a microphone localized in rm = rc. Now considering that allsources placed in the search grid are statistically incoherent, the modeled CSM can be written as the sum of allcontributions:
CSMmod(ω) =N∑n=1
CSMmodn (ω) (28)
where N is the total number of points in the searching grid. Similarly to Eq. 20, with the CSMmod(ω) it ispossible to compute the modeled beamforming output power for a given position n in the searching grid as:
Lmod(x) =
[eTCSMmod(ω)e
M2
]n
(29)
and
Lmod(x) =eTn∑N
k=1Xk [ ]k enM2
=
N∑k=1
eTn [ ]k enM2
Xk (30)
where the bracketed term is that of Eq. 27 therefore the beamforming output map is summarized as:
Lmod(x) =N∑k=1
AnkXk (31)
where
Ank =eTn [ ]k enM2
(32)
By equating an Lmod(x) with the conventional beamforming processed L(x) from measured data, we have alinear system of equations:
Y = AX (33)
where A, X and Y have components Ank, Xk and L(x), respectively.
Fundamentals of Acoustic Beamforming
4 - 14 STO-EN-AVT-287

The matrix A is square of size N × N and if it was a non-singular matrix, it could be simply invertedproviding the source strengths asX = A−1Y . However, for practical applications, the matrix A is non-singularwith very low rank (number of independent equations). Classical techniques for inversion of low rank matricessuch as Single Value Decomposition (SVD) and Conjugate Gradient Methods (CGM) produce nonsensicalresults even for very simple sources. Therefore Brooks and Humphrey proposed a tailored iterative method tosolve the problem. Considering a single equation of the linear system:
An1X1 + · · ·+AnkXn + · · ·+AnNXN = Yn (34)
where n and k are grid point index numbers of the search grid. With Ann=1, Eq 34 is written as:
Xn = Yn −
[n−1∑k=1
AnkXk +
N∑k=n+1
AnkXk
](35)
this equation is implemented in an iterative algorithm to find the source strength distribution Xn in the searchgrid points:
X(i)1 = Y1 −
[0 +
N∑k=1+1
A1kX(i−1)k
]
X(i)n = Yn −
[n−1∑k=1
AnkX(i)k +
N∑k=n+1
AnkX(i−1)k
](36)
X(i)N = YN −
[N−1∑k=1
ANkX(i)k + 0
]Brooks and Humphrey propose that, for the first iteration, the values of Xn should be taken as zero. Further-more, since the source strengths are always larger than zero, a positive constraint on Xn is enforced to ensurestability of the system. After all grid points have been completed in an iteration, the calculation is reversedmoving from n = N back to n = 1 to smooth the iteration steps.
The DAMAS algorithm requires a high number of calculations that makes this a very time consumingalgorithm. In general, the computational time for each iteration depends only on the number of grid points.Accordingly to Brooks and Humphrey, the time per iteration can be expressed by time = C(2N)2, in which Cis a hardware dependent constant. Figure 10 shows the UTwente logo beamformed with 500 iterations of theDAMAS algorithm. This figure shows that the DAMAS algorithm clearly finds the sources in the logo and itmuch less subject to the influence of the side-lobes when compared with results calculated by the conventionalbeamforming algorithm. The source amplitude is much closer to the original 100 dB imposed in the simu-lations, indicating that the spatial resolution of this algorithm is also much better, compared to conventionalbeamforming. Few pseudo-sources due to the influence of the array side-lobes are located.
4.2 DAMAS2
The DAMAS algorithm represented a remarkable advance in the application of microphone array techniques.However, this approach requires the PSF computation for each point of the searching grid that significantly addscomputational cost limiting, therefore, its use in engineering applications. Aiming accelerate the computationalprocess and present improved results, relative to the conventional beamforming technique, Dougherty proposedin 2005 the DAMAS2 [19] algorithm.
Fundamentals of Acoustic Beamforming
STO-EN-AVT-287 4 - 15

Figure 10: UTwente logo beamformed with 500 iterations of the DAMAS algorithm.
The DAMAS2 algorithm computes the convolution between the microphone array PSF and the sources inthe Fourier domain. This significantly improves the calculation speed and contributes to solve a limitation ofthe DAMAS algorithm. The algorithm DAMAS does allow the implementation of a regularization technique tocontrol the amplification of high-frequency noise, which may eventually happen in case of excessively refinedgrids. DAMAS2, by turn, adds regularization by proposing the application of a low-pass filter preventing theacoustic image become too noisy in the eventual situation where the searching grid is finer than the arrayresolution can support.
Similarly to DAMAS, DAMAS2 considers that the “dirty map” L(x) is written as a convolution of the arrayPSF and the source. This formulation is repeated here for clarity as:
L(x) =
∫x∈G
PSF(x,x0)q(x0)dx0 (37)
Similarly to DAMAS, the calculation of the deconvolution requires the assumption of incoherent distributionof sources. In the DAMAS algorithm, the computation of the PSF is the most time consuming step. ThereforeDougherty proposes the use of a shift-invariant PSF to simplify the calculations. The shift-invariant PSF de-pends only of the distance x − x0 between the search grid point and the source. Therefore, the shift-invariantPSF can be written as:
PSF(x,x0) = PSF(x− x0). (38)
No PSF fulfills the shift-invariant conditions, therefore Dougherty proposes to assume an approximate PSFwhich is representative of a source located in the center of the search grid. Using a shift-invariant PSF, Eq 37 iswritten as:
L(x) =
∫x∈G
PSF(x− x0)q(x0)dx0. (39)
Fundamentals of Acoustic Beamforming
4 - 16 STO-EN-AVT-287
Assume a shift-invariant PSF is generally a good approximation in situations where the source region is smallcompared to the distance between the sound source and array. The output map formulation of Eq. 39 canbe algebraically written as a linear system of equations Y = AX , where the solution X = A−1Y has thematrix inversion process facing the same singularity problems as DAMAS. Therefore, Dougherty proposes theDAMAS2 for noise source localization:
1. Compute the source map spatial Fourier transform: p(k) = FFT[PSF(x)], where k is the spatial PSFwavenumber;
2. Set the PSF normalization parameter a =∑
x |PSF |;
3. Initialize the solution q(x) = 0 for each point x in the searching grid;
4. Iterate until convergence:
(a) Apply the spatial Fourier transform to the sources distribution: q(k) = FFT[q];
(b) Apply the Gaussian spatial filter in order to remove eventual noise due to excessively fine searchinggrid: for each k, scale q(ω) by exp(−k2/(2k2
c )) (where kc is the spatial cut-off frequency for theGaussian regularization);
(c) In the Fourier domain, compute the convolution between the sources amplitude (q(~k)) and themicrophone array PSF (p(k)): r(k) = p(k)q(~k) for each k;
(d) Apply the inverse Fourier transform to calculate the “new” dirty map, which represents the convo-lution between the calculated sources and the microphone array PSF: r(x) = iFFT[r(~k)];
(e) Update the source amplitude: q(i+1)(x) = q(i)(x) + [L(x)− r(x)]/a for each x;
(f) Replace each negative value of q(x) by 0.
The DAMAS2 algorithm considerably reduces the execution time since, each iteration, requires the calculationof a single Fourier transform and its inverse. The cut-off frequency kc is a “tweaking” parameter chosen tooptimize the visual and quantitative representation of the acoustic image.
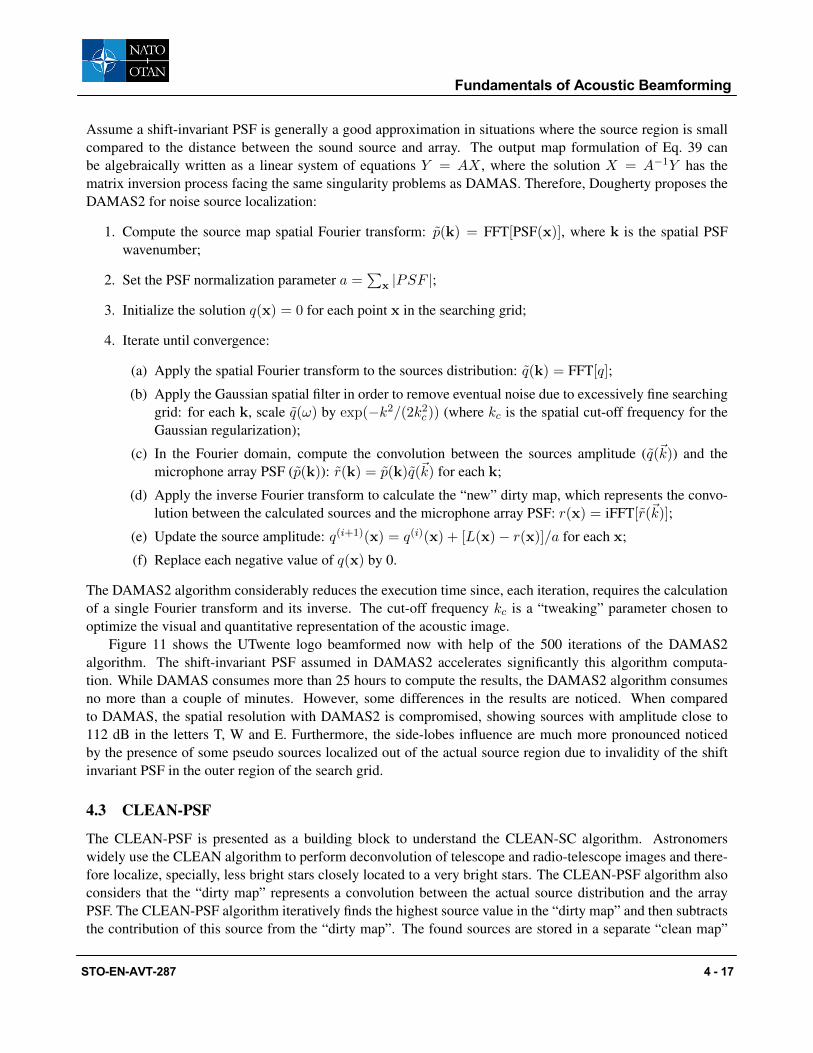
Figure 11 shows the UTwente logo beamformed now with help of the 500 iterations of the DAMAS2algorithm. The shift-invariant PSF assumed in DAMAS2 accelerates significantly this algorithm computa-tion. While DAMAS consumes more than 25 hours to compute the results, the DAMAS2 algorithm consumesno more than a couple of minutes. However, some differences in the results are noticed. When comparedto DAMAS, the spatial resolution with DAMAS2 is compromised, showing sources with amplitude close to112 dB in the letters T, W and E. Furthermore, the side-lobes influence are much more pronounced noticedby the presence of some pseudo sources localized out of the actual source region due to invalidity of the shiftinvariant PSF in the outer region of the search grid.
4.3 CLEAN-PSF
The CLEAN-PSF is presented as a building block to understand the CLEAN-SC algorithm. Astronomerswidely use the CLEAN algorithm to perform deconvolution of telescope and radio-telescope images and there-fore localize, specially, less bright stars closely located to a very bright stars. The CLEAN-PSF algorithm alsoconsiders that the “dirty map” represents a convolution between the actual source distribution and the arrayPSF. The CLEAN-PSF algorithm iteratively finds the highest source value in the “dirty map” and then subtractsthe contribution of this source from the “dirty map”. The found sources are stored in a separate “clean map”
Fundamentals of Acoustic Beamforming
STO-EN-AVT-287 4 - 17

Figure 11: UTwente logo beamformed with 500 iterations of the DAMAS2 algorithm.
and the source contribution is removed from the CSM, creating therefore a degraded CSM. The CLEAN-PSFmethod assumes that the source plot is composed of PSFs, e.g. each node in the searching grid has it’s ownPSF. In essence, the CLEAN-PSF algorithm iterates as following [21]:
1. obtain the “dirty map” with conventional beamforming;
2. search for the peak location in the dirty map;
3. subtract the appropriately scaled PSF from the dirty map;
4. replace this PSF by a “clean beam”.
The derivation of the CLEAN-PSF algorithm considers the space S composed by the indexes (m,n) usedto refer to the microphones m and n in the array. The approach defines the weight vector is defined as:
w =g(∑
(m,n)∈S |gm|2 |gn|2
)1/2, (40)
that represents the proportional contribution of each steering vector regarding the sum of the “length” of allsteering vectors. Following this definition, the output map is written as:
L = w†CSMw , (41)
using this notation, the CSM induced by a source of unitary amplitude placed in the searching grid position ofindex j is:
CSMj = gjg†j . (42)
Fundamentals of Acoustic Beamforming
4 - 18 STO-EN-AVT-287

The conventional beamforming technique finds the unitary source power as:
L = w†[gjg†j
]w , (43)
the Point Spread Function (PSF) definition is restated above to maintain clarity and keep the notation consistentwith the rest of this section.
The CLEAN-PSF method iteratively searches for the sources. In the first step, i = 0, the “degraded” CSM(D) is initialized by the measured CSM:
D(i) = D(0) = CSM . (44)
The “dirty map” is calculated by conventional beamforming and the peak source location ξ(i)max is determined.
The CSM induced by the peak source in ξ(i)max is given by
Gi = P(i−1)max g
(i)maxg
†(i)max , (45)
where g(i)max is the steering vector associated with the location ξ(i)
max.In the following step, the contribution of this peak source is removed from the “dirty map”:
P(i)j = P
(i−1)j −w†jG
(i)wj . (46)
Therefore equation is rewritten in terms of the steering vector as:
P(i)j = P
(i−1)j − P (i−1)
max w†j
[g
(i)maxg
†(i)max
]wj , (47)
and the “clean” beam associated with ξ(i)max is stored in the “clean” map is:
Q(i)j = P
(i−1)max Φ(~ξj − ~ξ(i)
max) (48)
where Φ is a normalized clean beam of maximum value Φ(0) = 1:
Φ
(~ξj −
~ξ
(i)max
)= 10
−λ∣∣∣∣~ξj− ~
ξ(i)max
∣∣∣∣. (49)
the clean beam shape determines the source appearance in the “clean map”. The Gaussian formulation willrepresent an spatially extended source as a single (concentrated) punctual source. In cases where the sourcehas long spatial correlation length, e.g. airfoil trailing edge noise or vortex shedding behind a cylinder, thismay lead to the source concentration into a point and eventual “visual” misinterpretation of the results. It isimportant to keep in mind that the clean beam shape is an source visualization artifact. The spatially distributedactual source will have its intensity concentrated in this “clean beam”, therefore the correct source amplitude isretrieved by integration of the “clean beam”.
To complete the iteration, the degraded CSM (D) is updated with the subtraction of the component Gi
corresponding to the contribution to the CSM of a source induced by the peak source localized in ξ(i)max :
D(i) = D(i−1) −Gi
= D(i−1) − P (i−1)max g
(i)maxg
†(i)max . (50)
Fundamentals of Acoustic Beamforming
STO-EN-AVT-287 4 - 19

The updated source power map is computed from the degraded CSM:
P(i)j = w†jD
(i)wj (51)
After all iterations are complete, the source map is written as the contribution of each clean beam plus theremaining degraded source map:
Aj =
I∑i=1
Q(i)j + P
(I)j (52)
A stop criterion is set when the degraded CSM contains more information than in the previous iteration:
‖ D(i+1) ‖≤‖ D(i) ‖ (53)
Figure 12 shows the UTwente logo beamforming map computed with CLEAN-PSF algorithm. Due tothe statistical uncorrelation between sources and the spatial high concentration, the CLEAN-PSF algorithm isunable to recreate the line source distribution. The finite spatial resolution of the microphone array inducesthis algorithm to merge closely spaced sources into single larger sources. Therefore, the found sources havelarger amplitude than those simulated. The large number of uncorrelated and spatially close sources leadsthis algorithm to create exaggerated large PSF’s, with side-lobe contributions, which summed, result into large“pseudo sources” noticed in the map.
Figure 12: UTwente logo beamformed with 500 iterations of the CLEAN-PSF algorithm.
The array resolution effect and the side-lobe influence can be noticed if the source frequency is increased.Since the microphone array main-lobe to side-lobe ratio is proportional to the frequency and array the reso-lution inversely decays with frequency, Fig. 13 shows that the CLEAN-PSF capacity to localize the sources
Fundamentals of Acoustic Beamforming
4 - 20 STO-EN-AVT-287

significantly improves when the source frequency grows from 6 kHz to 20 kHz. Noteworthy is that the arrayadopted in this example has minimum distance between microphones much larger than the acoustic wavelengthwhen the source frequency is 20 kHz. Therefore, the spatial alias results into a source with amplitude largelyunderestimated.
Figure 13: UTwente logo beamformed with CLEAN-PSF algorithm and source frequency of 20 kHz.
The number of incoherent sources and spatial concentration adopted in this simulation is much larger thanthe practical values found in experimental applications. Therefore, the situation discussed here represents avery complex case where the limits of this beamforming technique are tested.
4.4 CLEAN-SC
The deconvolution algorithms DAMAS, DAMAS2 and CLEAN-PSF assume that the source maps are com-posed by the convolution of PSFs and sources. Therefore, deconvolution is only possible in case of statisti-cally uncorrelated sources. However, actual sources observed in aeroacoustic applications are not necessarilyinfinitesimal length point sources. Furthermore, they typically present non-negligible level of spatial correla-tion. The deconvolution methods DAMAS, DAMAS2 and CLEAN-PSF assume that the sources behave asmonopoles with negligible directivity effects, at least, in the microphone array direction. This hypothesis isnot necessarily true in large scale wind tunnel tests, in wind turbine noise measurements or aircraft fly-overtests. To overcome these limitations Pieter Sijtsma [21] proposed in 2007 the CLEAN-SC method inspired inthe CLEAN-PSF methodology, broadly applied in astronomy. This approach assumes that the side lobes of asource map are coherent with the main lobe.
To overcome the requirement of spatially uncorrelated sources, the CLEAN-SC algorithm writes the source
Fundamentals of Acoustic Beamforming
STO-EN-AVT-287 4 - 21

cross-power of two spatially distinct sources localized in the grid points with indexes j and k as:
Bjk = w†jCSMwk . (54)
Following this formulation, the degraded CSM matrix D(i) is written in terms of the spatial correlation ofthe peak source, with location ~ξ(i)
max, contribution G(i) for every point of the search grid:
w†jD(i−1)w
(i)max = w†jG
(i)w(i)max, for all possible wj . (55)
This equation is satisfied when
D(i−1)w(i)j = G(i)w
(i)max . (56)
This analysis, when compared to CLEAN-PSF, remains identical. However a different definition of G(i) isused:
G(i) = P(i−1)max h(i)h†(i) , (57)
where:
h(i) =D(i−1)w
(i)max
P(i−1)max
, (58)
therefore the degraded source map is written as:
P(i)j = P
(i−1)j −w†jG
(i)wj
= P(i−1)j − P (i−1)
max w†jh(i)h†(i)wj
= P(i−1)j − P (i−1)
max w†jD(i−1)w
(i)max
P(i−1)max
w†(i)maxD
(i−1)
P(i−1)max
wj
= P(i−1)j
1−
∣∣∣w†jD(i−1)w†(i)max
∣∣∣2P
(i−1)j P
(i−1)max
= P
(i−1)j
1−
∣∣∣w†jD(i−1)w†(i)max
∣∣∣2(w†jD
(i−1)w(i)j
)(w†maxD(i−1)w
(i)max
) ,
(59)
where
γ =
1−
∣∣∣w†jD(i−1)w†(i)max
∣∣∣2(w†jD
(i−1)w(i)j
)(w†maxD(i−1)w
(i)max
) , (60)
can be interpreted as the source spatial correlation.Figure 14 shows the UTwente logo beamfomed now with the CLEAN-SC algorithm. Similar to CLEAN-
PSF, CLEAN-SC has difficulties to localize high number of spatially concentrated and statistically uncorrelatedsources. A problem like this, with such number of perfectly uncorrelated sources, e.g. negligible correlation
Fundamentals of Acoustic Beamforming
4 - 22 STO-EN-AVT-287

length, is quite unlikely to be found in real engineering applications. This simulation case pushes the algorithmto the limit. The CLEAN-SC is widely recognized as a state-of-the-art algorithm applied to the noise sourceslocalization and quantification.
Similarly to CLEAN-PSF, in this situation, all sources have exactly same amplitude and are physicallyspaced a distance much smaller than the array resolution. Therefore, the CLEAN-SC algorithm has difficultiesto find the source of largest amplitude. For instance, when the source is located, the algorithm tends to mergeclosely spaced sources into a single source of larger amplitude.
Figure 14: UTwente logo beamformed with CLEAN-SC algorithm.
Remembering that higher frequency results into positive effects to the source localization due to the en-hancement of the microphone array main to side lobe ratio and better spatial resolution. Therefore, Fig. 15show results when the source frequency is 20 kHz. In this case more sources are located, however letterssuch as N are almost completely missing. Similarly, the CLEAN-PSF case, the minimum distance betwenmicrophone pairs in the array imposes a spatial aliasing leading to remarkable reduction in the source levelsdetermination.
ACKNOWLEDGMENTS
Ir. Marijn Sanders is gratefully acknowledged for providing simulations results and discussing the lecture noteswith the author.
REFERENCES
[1] Herr, M. and Dobrzynski, W., “Experimental Investigations in Low Noise Trailing Edge Design,”10thAIAA/CEAS Aeroacoustics Conference, 2004.
Fundamentals of Acoustic Beamforming
STO-EN-AVT-287 4 - 23

Figure 15: UTwente logo beamformed with CLEAN-SC algorithm now with source of 20 kHz.
[2] Herr, M., “A Noise Reduction Study On Flow-permeable Trailing-edges,” Tech. rep., Deutsches Zentrumf?r Luft- und Raumfahrt (DLR), 2007.
[3] Herr, M., “On the Design of Silent Trailing-Edges,” New Results in Numerical and Experimental FluidMechanics VI, Vol. 96, 2008, pp. 430–437.
[4] Sijtsma, P., “Acoustic beamforming for the ranking of aircraft noise,” Tech. rep., National AerospaceLaboratory NLR, 2012.
[5] Krober, S., Comparability of Microphone Array Measurements in Open and Closed Wind Tunnels, Ph.D.thesis, TU Berlin, 2013.
[6] Oerlemans, S., Sijtsma, P., and Mendez-Lopez, B., “Location and quantification of noise sources on awind turbine,” Tech. Rep. NLR-TP-2007-798, National Aerospace Laboratory NLR, 2007.
Fundamentals of Acoustic Beamforming
4 - 24 STO-EN-AVT-287

[7] Oerlemans, S. and Sijtsma, P., “Acoustic array measurements of a 1:10.6 scaled Airbus A340 model,”Tech. rep., National Aerospace Laboratory NLR, 2004.
[8] Arts, T. and for Fluid Dynamics, V. K. I., Measurement Techniques in Fluid Dynamics: An Introduction,Von Karman Institute for Fluid Dynamics, 2001.
[9] Mueller, T. J., Aeroacoustic measurements, Springer, 2002.
[10] Welch, P. D., “The use of fast Fourier transform for the estimation of power spectra: A method based ontime averaging over short, modified periodograms,” Audio and Electroacoustics, IEEE Transactions on,Vol. 15, No. 2, 1967, pp. 70–73.
[11] Pierce, A. D., Acoustics: An Introduction to Its Physical Principles and Applications, Acoustical Societyof America, 1989.
[12] Ann P. Dowling, J. E. F. W., Sound and sources of sound, Ellis Horwood, 1983.
[13] Rienstra, S. and Hirschberg, A., An Introduction to Acoustics, Eindhoven University of Technology, 2012.
[14] Johnson, D. H. and Dudgeon, D. E., Array Signal Processing: Concepts and Techniques, Prentice Hall,1993.
[15] Oerlemans, S., Detection of aeroacoustic sound sources on aircraft and wind turbines, Ph.D. thesis, Uni-versity of Twente, 2009.
[16] Brooks, T. F. and Humphreys, W. M., “A deconvolution approach for the mapping of acoustic sources(DAMAS) determined from phased microphone arrays,” Journal of Sound and Vibration, Vol. 294, No.4-5, 2006, pp. 856 – 879.
[17] Underbrink, J. R., Aeroacoustic Measurements, chap. Aeroacoustic Phased Array, Springer Verlag, 2002,pp. 98 – 217.
[18] Lallo, M. D., “Experience with the Hubble Space Telescope: 20?years of an archetype,” Optical Engi-neering, Vol. 51, No. 1, 2012.
[19] Dougherty, R. P., “Extensions of DAMAS and benifits and limitations of deconvolution in beamforming,”11th AIAA/CEAS Aeroacoustics Conference, 2005.
[20] Brooks, T. F. and Humphreys, W. M., “Effect of directional array size on the measurement of airframenoise components,” 5th AIAA/CEAS Aeroacoustics Conference, No. AIAA-Paper 99-1958, 1999.
[21] Sijtsma, P., “CLEAN Based on Spatial Source Coherence,” 13th AIAA/CEAS Aeroacoustics Conference,No. AIAA 2007-3436, 2007.
Fundamentals of Acoustic Beamforming
STO-EN-AVT-287 4 - 25

Fundamentals of Acoustic Beamforming
4 - 26 STO-EN-AVT-287