fundamentals of complete crash and hang memory dump analysis
TRANSCRIPT
Complete Crash and Hang
Memory Dump Analysis
Presenter: Dmitry Vostokov Memory Dump Analysis Services
Prerequisites Working knowledge of: WinDbg (installation, symbols) Basic user process dump analysis Basic kernel memory dump analysis
To Be Discussed Later We use these boxes to introduce useful vocabulary to be discussed in later slides
© 2010 Memory Dump Analysis Services
Agenda (Summary) Basics Patterns Exercise Guide
© 2010 Memory Dump Analysis Services
Agenda (Basics) Dump generation Memory spaces Major challenges Common commands
© 2010 Memory Dump Analysis Services
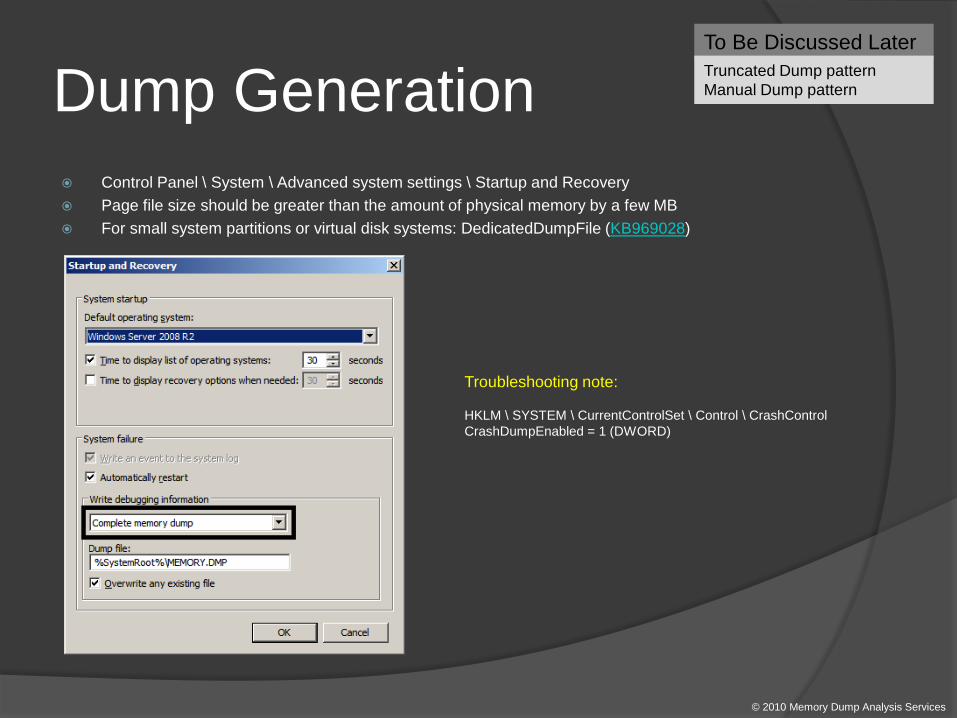
Dump Generation Control Panel \ System \ Advanced system settings \ Startup and Recovery Page file size should be greater than the amount of physical memory by a few MB For small system partitions or virtual disk systems: DedicatedDumpFile (KB969028)
To Be Discussed Later Truncated Dump pattern Manual Dump pattern
© 2010 Memory Dump Analysis Services
Troubleshooting note: HKLM \ SYSTEM \ CurrentControlSet \ Control \ CrashControl CrashDumpEnabled = 1 (DWORD)
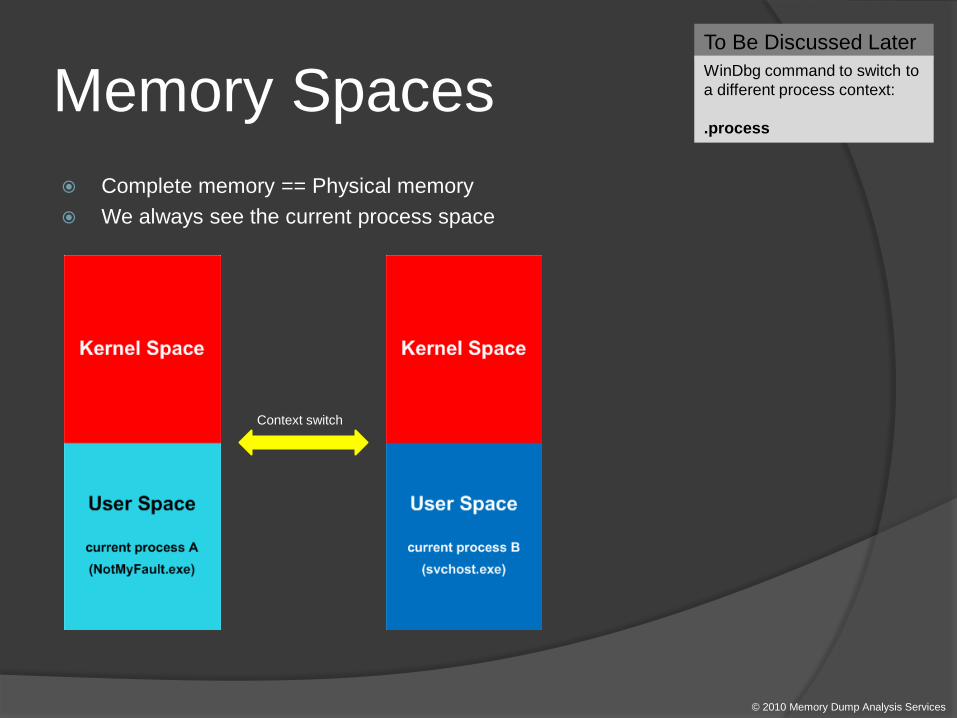
Memory Spaces Complete memory == Physical memory We always see the current process space
Context switch
To Be Discussed Later WinDbg command to switch to a different process context: .process
© 2010 Memory Dump Analysis Services
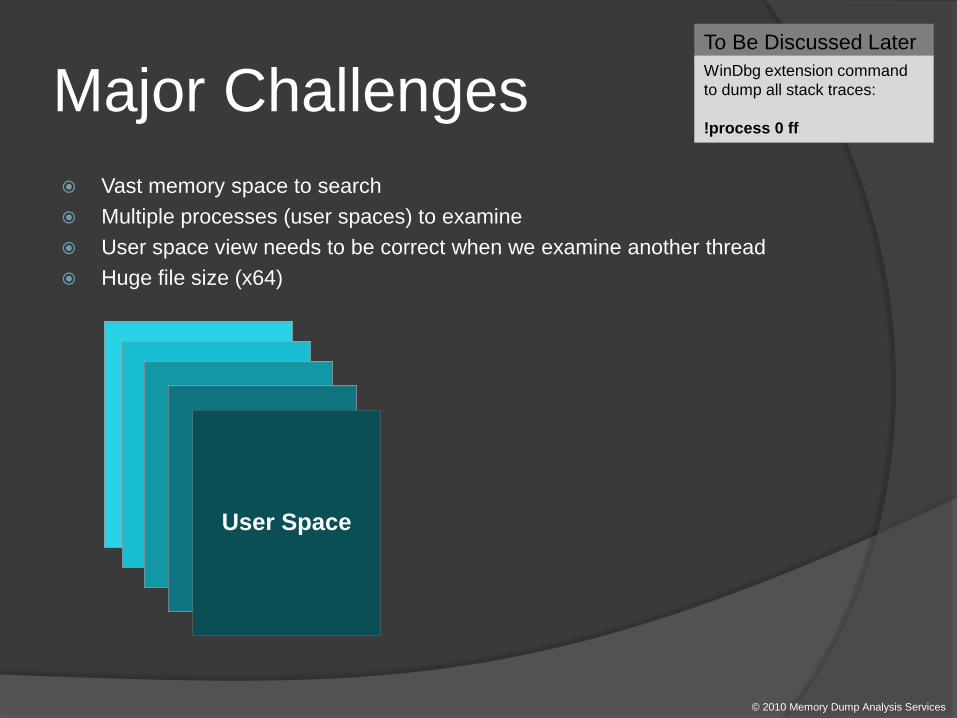
Major Challenges Vast memory space to search Multiple processes (user spaces) to examine User space view needs to be correct when we examine another thread Huge file size (x64)
© 2010 Memory Dump Analysis Services
User Space
To Be Discussed Later WinDbg extension command to dump all stack traces: !process 0 ff
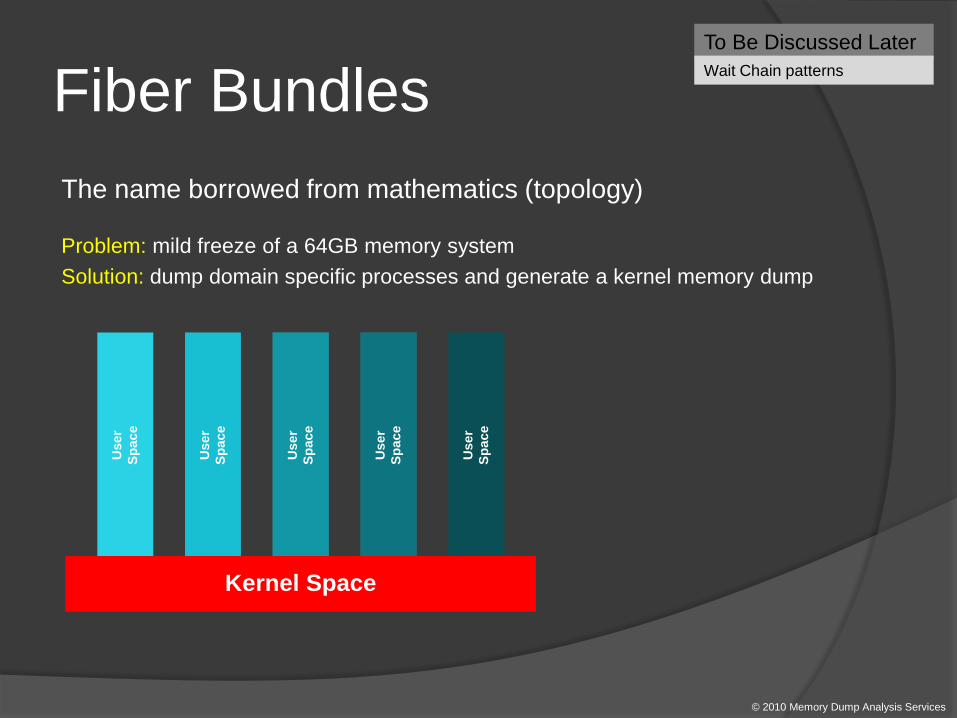
The name borrowed from mathematics (topology)
Problem: mild freeze of a 64GB memory system Solution: dump domain specific processes and generate a kernel memory dump
Fiber Bundles
© 2010 Memory Dump Analysis Services
Use
r Sp
ace
Use
r Sp
ace
Use
r Sp
ace
Use
r Sp
ace
Use
r Sp
ace
Kernel Space
To Be Discussed Later Wait Chain patterns
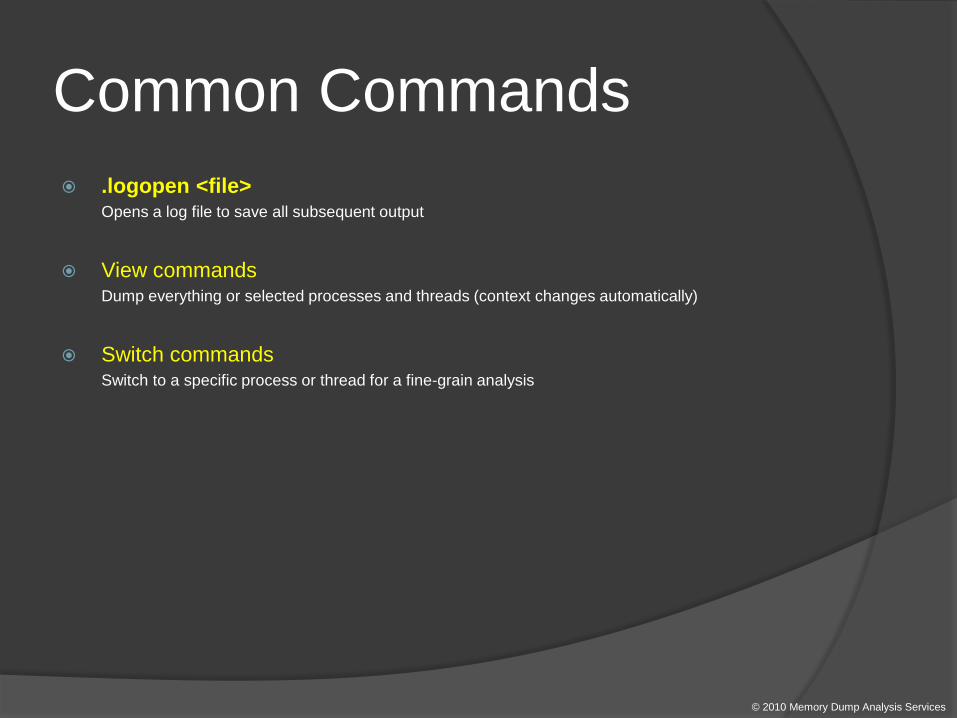
Common Commands .logopen <file> Opens a log file to save all subsequent output
View commands Dump everything or selected processes and threads (context changes automatically)
Switch commands Switch to a specific process or thread for a fine-grain analysis
© 2010 Memory Dump Analysis Services

View Commands !process 0 3f Lists all processes (including times, environment, modules) and their thread stack traces
!process 0 1f The same as the previous command but without PEB information (more secure)
!process <address> 3f or !process <address> 1f The same as the previous commands but only for an individual process
!thread <address> 1f Shows thread information and stack trace
!thread <address> 16 The same as the previous command but shows the first 3 parameters for every function
© 2010 Memory Dump Analysis Services
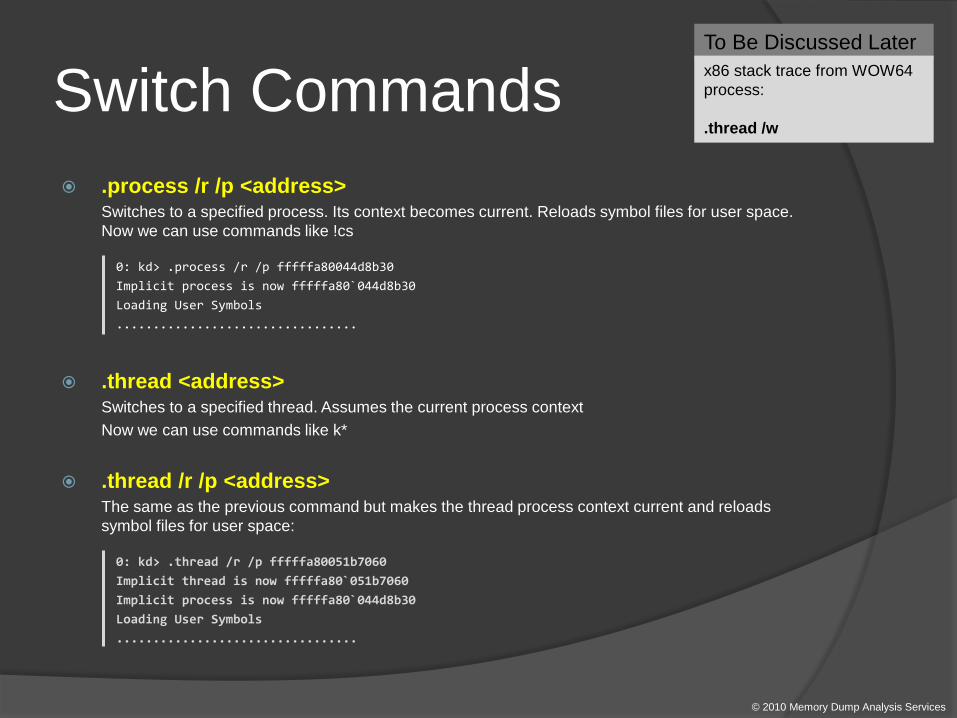
Switch Commands .process /r /p <address> Switches to a specified process. Its context becomes current. Reloads symbol files for user space.
Now we can use commands like !cs
0: kd> .process /r /p fffffa80044d8b30 Implicit process is now fffffa80`044d8b30 Loading User Symbols .................................
.thread <address> Switches to a specified thread. Assumes the current process context Now we can use commands like k*
.thread /r /p <address> The same as the previous command but makes the thread process context current and reloads
symbol files for user space:
0: kd> .thread /r /p fffffa80051b7060 Implicit thread is now fffffa80`051b7060 Implicit process is now fffffa80`044d8b30 Loading User Symbols .................................
© 2010 Memory Dump Analysis Services
To Be Discussed Later x86 stack trace from WOW64 process: .thread /w
Agenda (Patterns) Pattern-driven analysis Pattern classification Pattern examples Common mistakes
© 2010 Memory Dump Analysis Services
Pattern-driven Analysis
© 2010 Memory Dump Analysis Services
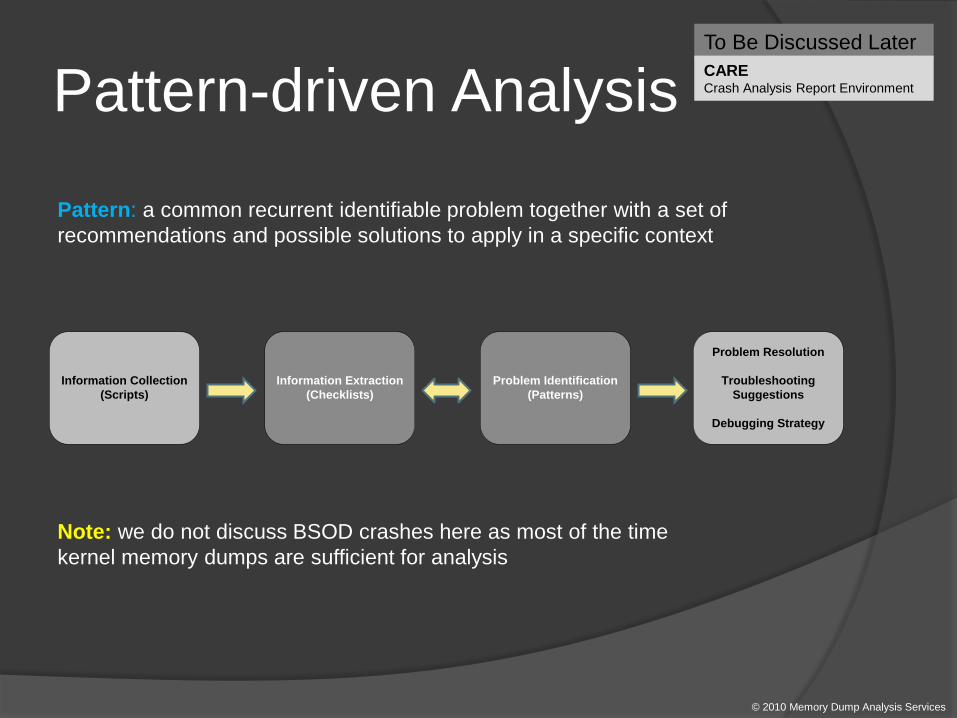
Information Collection (Scripts)
Information Extraction (Checklists)
Problem Identification (Patterns)
Problem Resolution
Troubleshooting Suggestions
Debugging Strategy
To Be Discussed Later CARE Crash Analysis Report Environment
Note: we do not discuss BSOD crashes here as most of the time kernel memory dumps are sufficient for analysis
Pattern: a common recurrent identifiable problem together with a set of recommendations and possible solutions to apply in a specific context
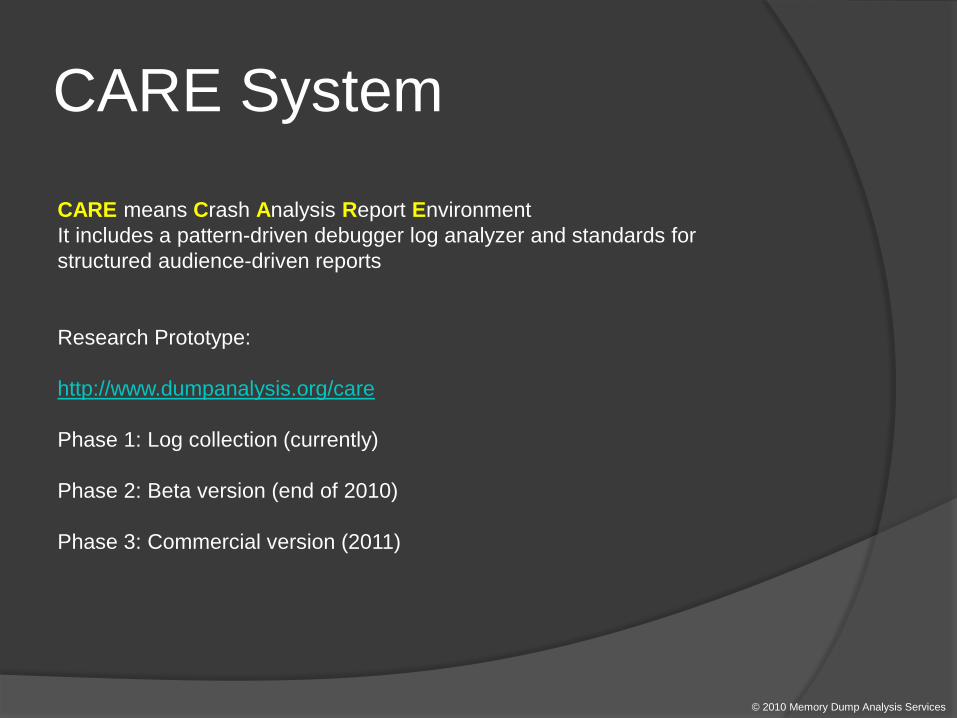
CARE System
© 2010 Memory Dump Analysis Services
CARE means Crash Analysis Report Environment It includes a pattern-driven debugger log analyzer and standards for structured audience-driven reports Research Prototype: http://www.dumpanalysis.org/care Phase 1: Log collection (currently) Phase 2: Beta version (end of 2010) Phase 3: Commercial version (2011)
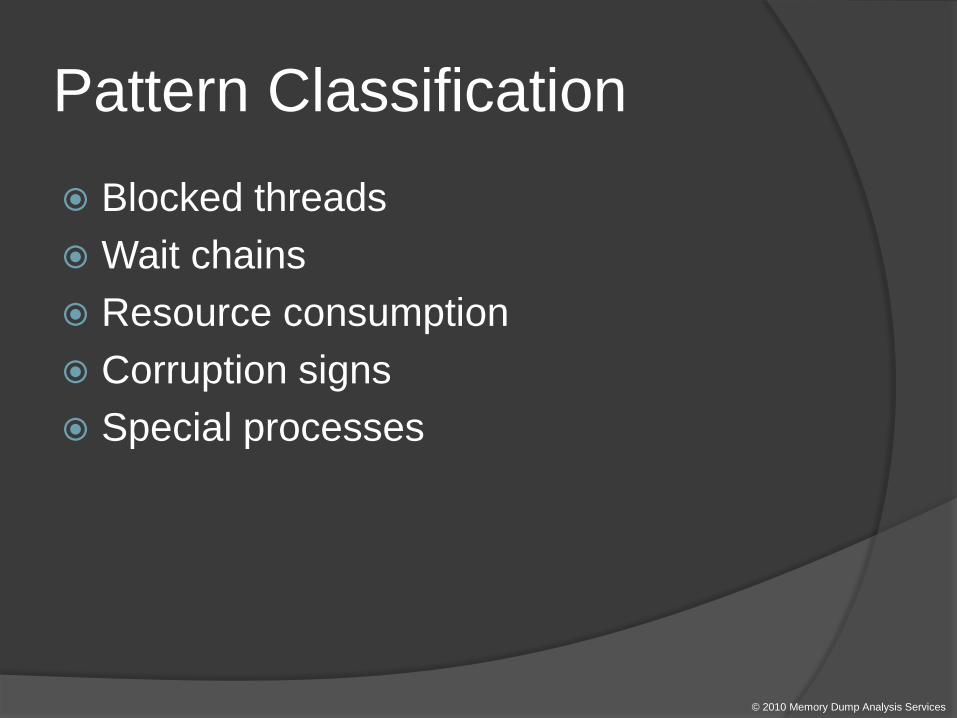
Pattern Classification Blocked threads Wait chains Resource consumption Corruption signs Special processes
© 2010 Memory Dump Analysis Services
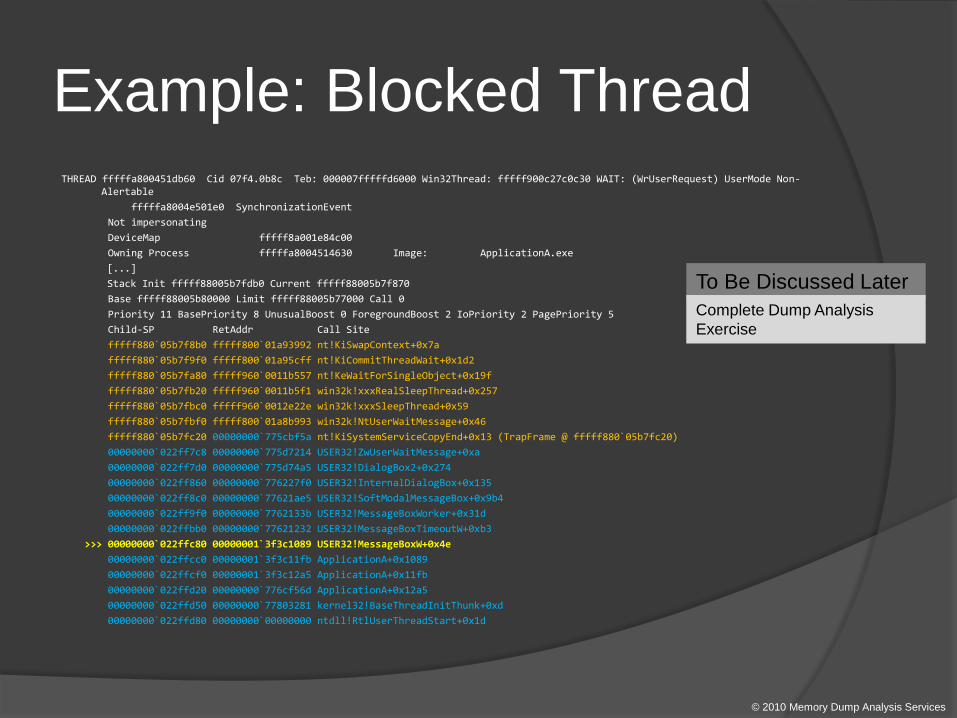
Example: Blocked Thread THREAD fffffa800451db60 Cid 07f4.0b8c Teb: 000007fffffd6000 Win32Thread: fffff900c27c0c30 WAIT: (WrUserRequest) UserMode Non-
Alertable fffffa8004e501e0 SynchronizationEvent Not impersonating DeviceMap fffff8a001e84c00 Owning Process fffffa8004514630 Image: ApplicationA.exe [...] Stack Init fffff88005b7fdb0 Current fffff88005b7f870 Base fffff88005b80000 Limit fffff88005b77000 Call 0 Priority 11 BasePriority 8 UnusualBoost 0 ForegroundBoost 2 IoPriority 2 PagePriority 5 Child-SP RetAddr Call Site fffff880`05b7f8b0 fffff800`01a93992 nt!KiSwapContext+0x7a fffff880`05b7f9f0 fffff800`01a95cff nt!KiCommitThreadWait+0x1d2 fffff880`05b7fa80 fffff960`0011b557 nt!KeWaitForSingleObject+0x19f fffff880`05b7fb20 fffff960`0011b5f1 win32k!xxxRealSleepThread+0x257 fffff880`05b7fbc0 fffff960`0012e22e win32k!xxxSleepThread+0x59 fffff880`05b7fbf0 fffff800`01a8b993 win32k!NtUserWaitMessage+0x46 fffff880`05b7fc20 00000000`775cbf5a nt!KiSystemServiceCopyEnd+0x13 (TrapFrame @ fffff880`05b7fc20) 00000000`022ff7c8 00000000`775d7214 USER32!ZwUserWaitMessage+0xa 00000000`022ff7d0 00000000`775d74a5 USER32!DialogBox2+0x274 00000000`022ff860 00000000`776227f0 USER32!InternalDialogBox+0x135 00000000`022ff8c0 00000000`77621ae5 USER32!SoftModalMessageBox+0x9b4 00000000`022ff9f0 00000000`7762133b USER32!MessageBoxWorker+0x31d 00000000`022ffbb0 00000000`77621232 USER32!MessageBoxTimeoutW+0xb3 >>> 00000000`022ffc80 00000001`3f3c1089 USER32!MessageBoxW+0x4e 00000000`022ffcc0 00000001`3f3c11fb ApplicationA+0x1089 00000000`022ffcf0 00000001`3f3c12a5 ApplicationA+0x11fb 00000000`022ffd20 00000000`776cf56d ApplicationA+0x12a5 00000000`022ffd50 00000000`77803281 kernel32!BaseThreadInitThunk+0xd 00000000`022ffd80 00000000`00000000 ntdll!RtlUserThreadStart+0x1d
© 2010 Memory Dump Analysis Services
To Be Discussed Later Complete Dump Analysis Exercise
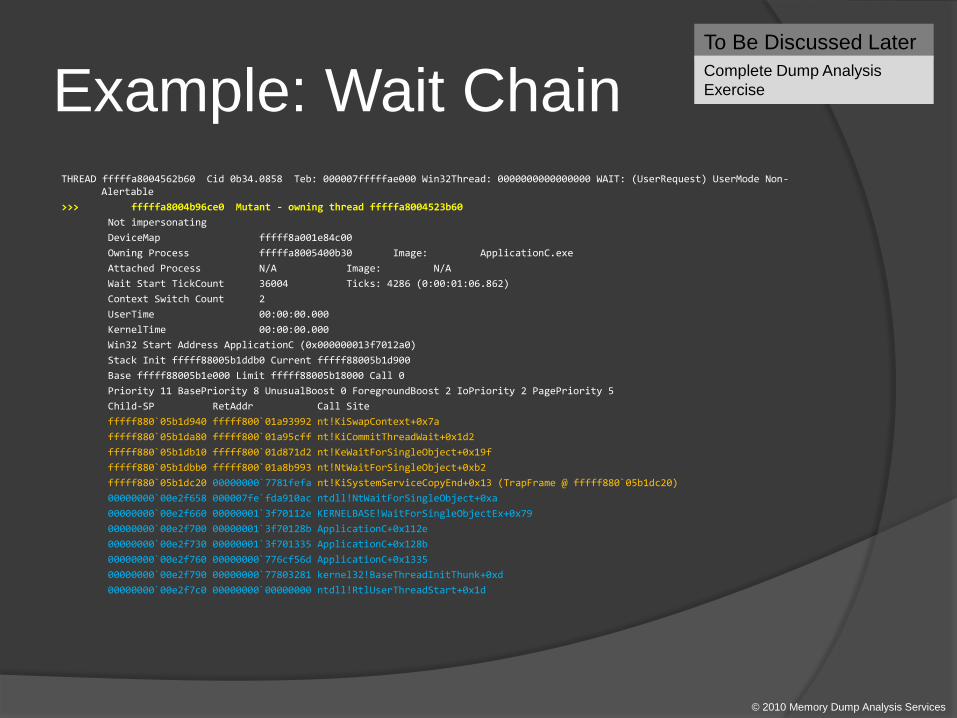
Example: Wait Chain THREAD fffffa8004562b60 Cid 0b34.0858 Teb: 000007fffffae000 Win32Thread: 0000000000000000 WAIT: (UserRequest) UserMode Non-
Alertable >>> fffffa8004b96ce0 Mutant - owning thread fffffa8004523b60 Not impersonating DeviceMap fffff8a001e84c00 Owning Process fffffa8005400b30 Image: ApplicationC.exe Attached Process N/A Image: N/A Wait Start TickCount 36004 Ticks: 4286 (0:00:01:06.862) Context Switch Count 2 UserTime 00:00:00.000 KernelTime 00:00:00.000 Win32 Start Address ApplicationC (0x000000013f7012a0) Stack Init fffff88005b1ddb0 Current fffff88005b1d900 Base fffff88005b1e000 Limit fffff88005b18000 Call 0 Priority 11 BasePriority 8 UnusualBoost 0 ForegroundBoost 2 IoPriority 2 PagePriority 5 Child-SP RetAddr Call Site fffff880`05b1d940 fffff800`01a93992 nt!KiSwapContext+0x7a fffff880`05b1da80 fffff800`01a95cff nt!KiCommitThreadWait+0x1d2 fffff880`05b1db10 fffff800`01d871d2 nt!KeWaitForSingleObject+0x19f fffff880`05b1dbb0 fffff800`01a8b993 nt!NtWaitForSingleObject+0xb2 fffff880`05b1dc20 00000000`7781fefa nt!KiSystemServiceCopyEnd+0x13 (TrapFrame @ fffff880`05b1dc20) 00000000`00e2f658 000007fe`fda910ac ntdll!NtWaitForSingleObject+0xa 00000000`00e2f660 00000001`3f70112e KERNELBASE!WaitForSingleObjectEx+0x79 00000000`00e2f700 00000001`3f70128b ApplicationC+0x112e 00000000`00e2f730 00000001`3f701335 ApplicationC+0x128b 00000000`00e2f760 00000000`776cf56d ApplicationC+0x1335 00000000`00e2f790 00000000`77803281 kernel32!BaseThreadInitThunk+0xd 00000000`00e2f7c0 00000000`00000000 ntdll!RtlUserThreadStart+0x1d
© 2010 Memory Dump Analysis Services
To Be Discussed Later Complete Dump Analysis Exercise
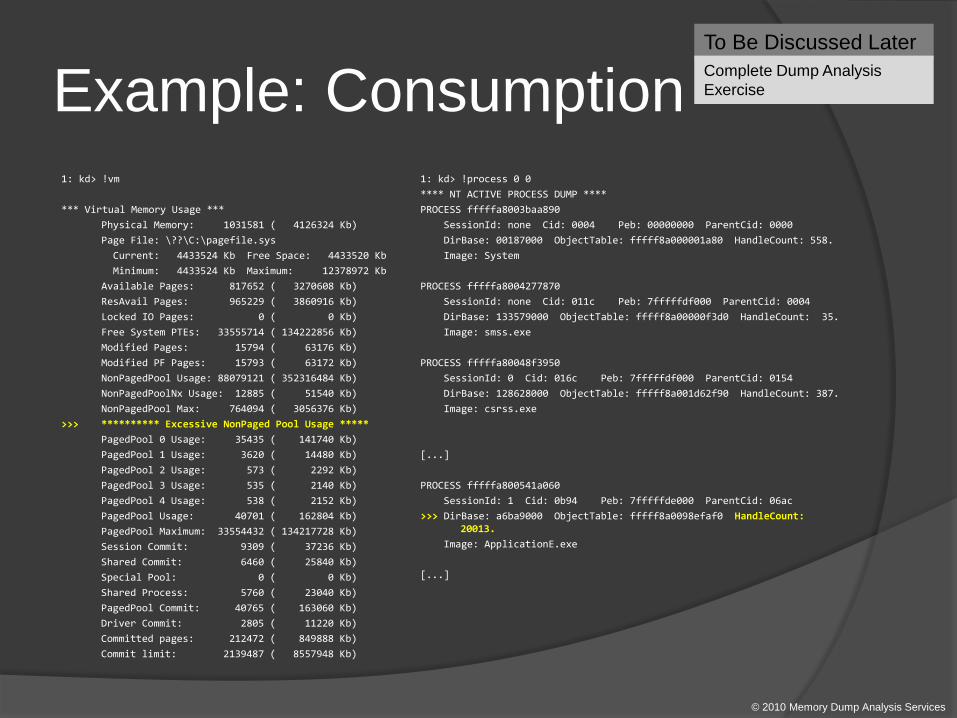
Example: Consumption 1: kd> !vm *** Virtual Memory Usage *** Physical Memory: 1031581 ( 4126324 Kb) Page File: \??\C:\pagefile.sys Current: 4433524 Kb Free Space: 4433520 Kb Minimum: 4433524 Kb Maximum: 12378972 Kb Available Pages: 817652 ( 3270608 Kb) ResAvail Pages: 965229 ( 3860916 Kb) Locked IO Pages: 0 ( 0 Kb) Free System PTEs: 33555714 ( 134222856 Kb) Modified Pages: 15794 ( 63176 Kb) Modified PF Pages: 15793 ( 63172 Kb) NonPagedPool Usage: 88079121 ( 352316484 Kb) NonPagedPoolNx Usage: 12885 ( 51540 Kb) NonPagedPool Max: 764094 ( 3056376 Kb) >>> ********** Excessive NonPaged Pool Usage ***** PagedPool 0 Usage: 35435 ( 141740 Kb) PagedPool 1 Usage: 3620 ( 14480 Kb) PagedPool 2 Usage: 573 ( 2292 Kb) PagedPool 3 Usage: 535 ( 2140 Kb) PagedPool 4 Usage: 538 ( 2152 Kb) PagedPool Usage: 40701 ( 162804 Kb) PagedPool Maximum: 33554432 ( 134217728 Kb) Session Commit: 9309 ( 37236 Kb) Shared Commit: 6460 ( 25840 Kb) Special Pool: 0 ( 0 Kb) Shared Process: 5760 ( 23040 Kb) PagedPool Commit: 40765 ( 163060 Kb) Driver Commit: 2805 ( 11220 Kb) Committed pages: 212472 ( 849888 Kb) Commit limit: 2139487 ( 8557948 Kb)
© 2010 Memory Dump Analysis Services
To Be Discussed Later Complete Dump Analysis Exercise
1: kd> !process 0 0 **** NT ACTIVE PROCESS DUMP **** PROCESS fffffa8003baa890 SessionId: none Cid: 0004 Peb: 00000000 ParentCid: 0000 DirBase: 00187000 ObjectTable: fffff8a000001a80 HandleCount: 558. Image: System PROCESS fffffa8004277870 SessionId: none Cid: 011c Peb: 7fffffdf000 ParentCid: 0004 DirBase: 133579000 ObjectTable: fffff8a00000f3d0 HandleCount: 35. Image: smss.exe PROCESS fffffa80048f3950 SessionId: 0 Cid: 016c Peb: 7fffffdf000 ParentCid: 0154 DirBase: 128628000 ObjectTable: fffff8a001d62f90 HandleCount: 387. Image: csrss.exe [...] PROCESS fffffa800541a060 SessionId: 1 Cid: 0b94 Peb: 7fffffde000 ParentCid: 06ac >>> DirBase: a6ba9000 ObjectTable: fffff8a0098efaf0 HandleCount:
20013. Image: ApplicationE.exe [...]
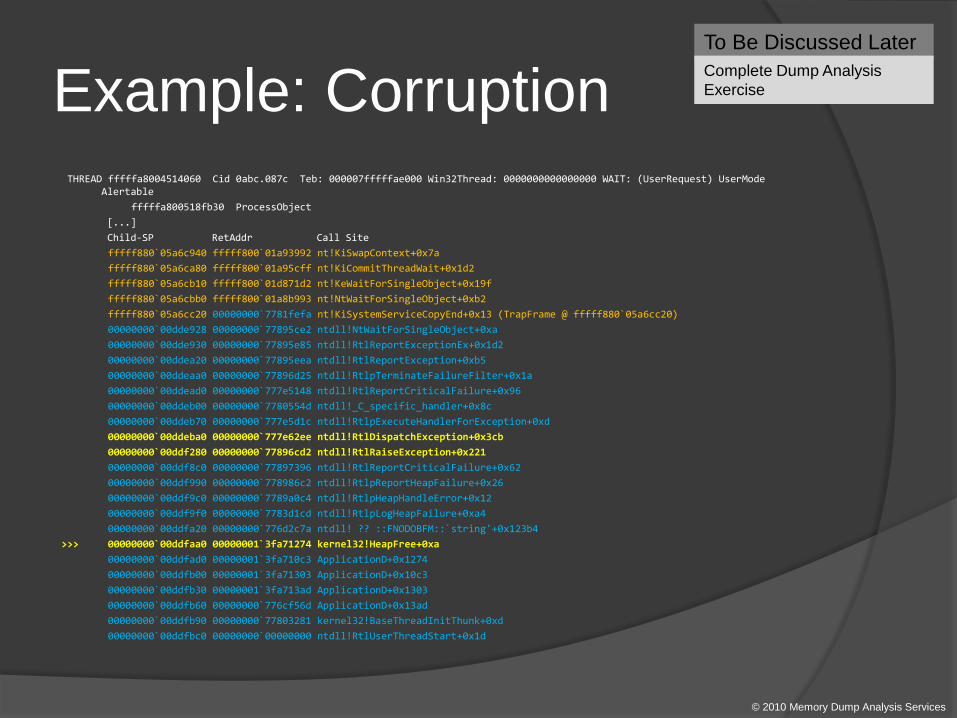
Example: Corruption THREAD fffffa8004514060 Cid 0abc.087c Teb: 000007fffffae000 Win32Thread: 0000000000000000 WAIT: (UserRequest) UserMode
Alertable fffffa800518fb30 ProcessObject [...] Child-SP RetAddr Call Site fffff880`05a6c940 fffff800`01a93992 nt!KiSwapContext+0x7a fffff880`05a6ca80 fffff800`01a95cff nt!KiCommitThreadWait+0x1d2 fffff880`05a6cb10 fffff800`01d871d2 nt!KeWaitForSingleObject+0x19f fffff880`05a6cbb0 fffff800`01a8b993 nt!NtWaitForSingleObject+0xb2 fffff880`05a6cc20 00000000`7781fefa nt!KiSystemServiceCopyEnd+0x13 (TrapFrame @ fffff880`05a6cc20) 00000000`00dde928 00000000`77895ce2 ntdll!NtWaitForSingleObject+0xa 00000000`00dde930 00000000`77895e85 ntdll!RtlReportExceptionEx+0x1d2 00000000`00ddea20 00000000`77895eea ntdll!RtlReportException+0xb5 00000000`00ddeaa0 00000000`77896d25 ntdll!RtlpTerminateFailureFilter+0x1a 00000000`00ddead0 00000000`777e5148 ntdll!RtlReportCriticalFailure+0x96 00000000`00ddeb00 00000000`7780554d ntdll!_C_specific_handler+0x8c 00000000`00ddeb70 00000000`777e5d1c ntdll!RtlpExecuteHandlerForException+0xd 00000000`00ddeba0 00000000`777e62ee ntdll!RtlDispatchException+0x3cb 00000000`00ddf280 00000000`77896cd2 ntdll!RtlRaiseException+0x221 00000000`00ddf8c0 00000000`77897396 ntdll!RtlReportCriticalFailure+0x62 00000000`00ddf990 00000000`778986c2 ntdll!RtlpReportHeapFailure+0x26 00000000`00ddf9c0 00000000`7789a0c4 ntdll!RtlpHeapHandleError+0x12 00000000`00ddf9f0 00000000`7783d1cd ntdll!RtlpLogHeapFailure+0xa4 00000000`00ddfa20 00000000`776d2c7a ntdll! ?? ::FNODOBFM::`string'+0x123b4 >>> 00000000`00ddfaa0 00000001`3fa71274 kernel32!HeapFree+0xa 00000000`00ddfad0 00000001`3fa710c3 ApplicationD+0x1274 00000000`00ddfb00 00000001`3fa71303 ApplicationD+0x10c3 00000000`00ddfb30 00000001`3fa713ad ApplicationD+0x1303 00000000`00ddfb60 00000000`776cf56d ApplicationD+0x13ad 00000000`00ddfb90 00000000`77803281 kernel32!BaseThreadInitThunk+0xd 00000000`00ddfbc0 00000000`00000000 ntdll!RtlUserThreadStart+0x1d
To Be Discussed Later Complete Dump Analysis Exercise
© 2010 Memory Dump Analysis Services
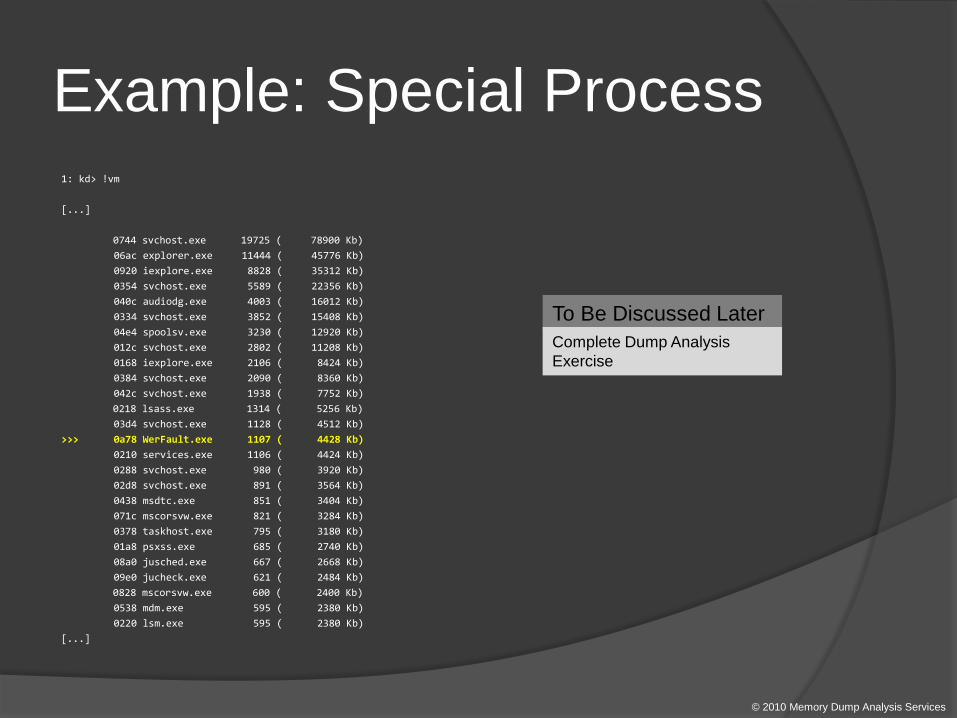
Example: Special Process 1: kd> !vm [...] 0744 svchost.exe 19725 ( 78900 Kb) 06ac explorer.exe 11444 ( 45776 Kb) 0920 iexplore.exe 8828 ( 35312 Kb) 0354 svchost.exe 5589 ( 22356 Kb) 040c audiodg.exe 4003 ( 16012 Kb) 0334 svchost.exe 3852 ( 15408 Kb) 04e4 spoolsv.exe 3230 ( 12920 Kb) 012c svchost.exe 2802 ( 11208 Kb) 0168 iexplore.exe 2106 ( 8424 Kb) 0384 svchost.exe 2090 ( 8360 Kb) 042c svchost.exe 1938 ( 7752 Kb) 0218 lsass.exe 1314 ( 5256 Kb) 03d4 svchost.exe 1128 ( 4512 Kb) >>> 0a78 WerFault.exe 1107 ( 4428 Kb) 0210 services.exe 1106 ( 4424 Kb) 0288 svchost.exe 980 ( 3920 Kb) 02d8 svchost.exe 891 ( 3564 Kb) 0438 msdtc.exe 851 ( 3404 Kb) 071c mscorsvw.exe 821 ( 3284 Kb) 0378 taskhost.exe 795 ( 3180 Kb) 01a8 psxss.exe 685 ( 2740 Kb) 08a0 jusched.exe 667 ( 2668 Kb) 09e0 jucheck.exe 621 ( 2484 Kb) 0828 mscorsvw.exe 600 ( 2400 Kb) 0538 mdm.exe 595 ( 2380 Kb) 0220 lsm.exe 595 ( 2380 Kb) [...]
To Be Discussed Later Complete Dump Analysis Exercise
© 2010 Memory Dump Analysis Services
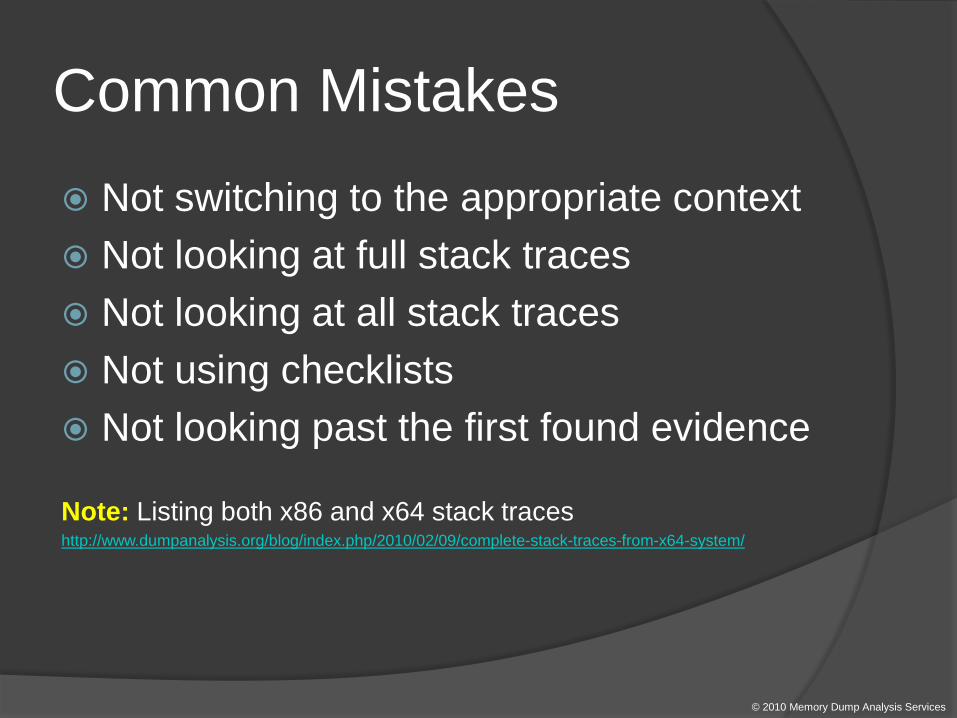
Common Mistakes Not switching to the appropriate context Not looking at full stack traces Not looking at all stack traces Not using checklists Not looking past the first found evidence Note: Listing both x86 and x64 stack traces http://www.dumpanalysis.org/blog/index.php/2010/02/09/complete-stack-traces-from-x64-system/
© 2010 Memory Dump Analysis Services
Agenda (Exercise) Run processes that model abnormal
behavior Generate a complete memory dump Analyze the memory dump
Note: Due to security concerns I’m not making a complete memory
dump downloadable. You can generate your own complete memory dump after downloading and running model applications
© 2010 Memory Dump Analysis Services
Exercise: Run Processes These processes model specific patterns: ApplicationA , ApplicationB, ApplicationC, ApplicationD, ApplicationE For demonstration I run x64 versions plus x86 version of ApplicationA
Note: Run applications in alphabetical order Can be downloaded from this location: www.DumpAnalysis.com/Training/FreeWebinars/CMDA-Examples.zip
There are x86 and x64 versions
© 2010 Memory Dump Analysis Services
Exercise: Force A Dump The system is x64 Windows Server R2 I used NotMyFault SysInternals tool Note: Wait at least 10 seconds after running model applications to
have them properly initialize their dependencies
© 2010 Memory Dump Analysis Services
Exercise: Dump Analysis
Now I switch to a WinDbg session...
© 2010 Memory Dump Analysis Services
Agenda (Guide) Patterns related to complete memory
dumps Pattern cooperation case studies from
complete memory dumps
© 2010 Memory Dump Analysis Services
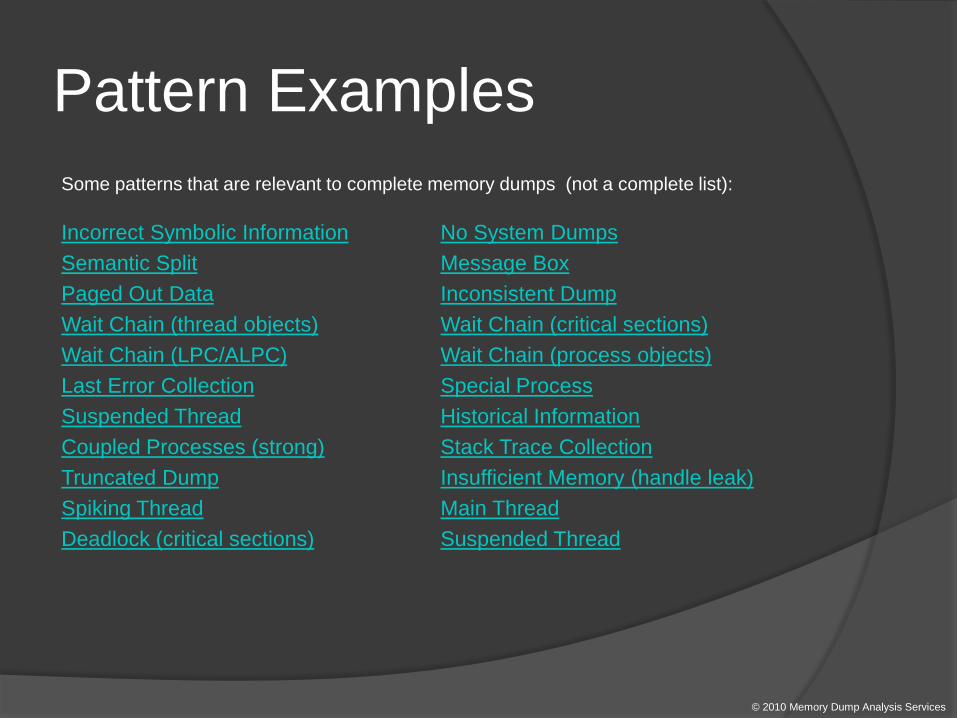
Pattern Examples Some patterns that are relevant to complete memory dumps (not a complete list):
Incorrect Symbolic Information No System Dumps Semantic Split Message Box Paged Out Data Inconsistent Dump Wait Chain (thread objects) Wait Chain (critical sections) Wait Chain (LPC/ALPC) Wait Chain (process objects) Last Error Collection Special Process Suspended Thread Historical Information Coupled Processes (strong) Stack Trace Collection Truncated Dump Insufficient Memory (handle leak) Spiking Thread Main Thread Deadlock (critical sections) Suspended Thread
© 2010 Memory Dump Analysis Services
Case Studies 17 pattern interaction case studies using complete
memory dumps: http://www.dumpanalysis.org/blog/index.php/category/complete-memory-dump-analysis/
© 2010 Memory Dump Analysis Services
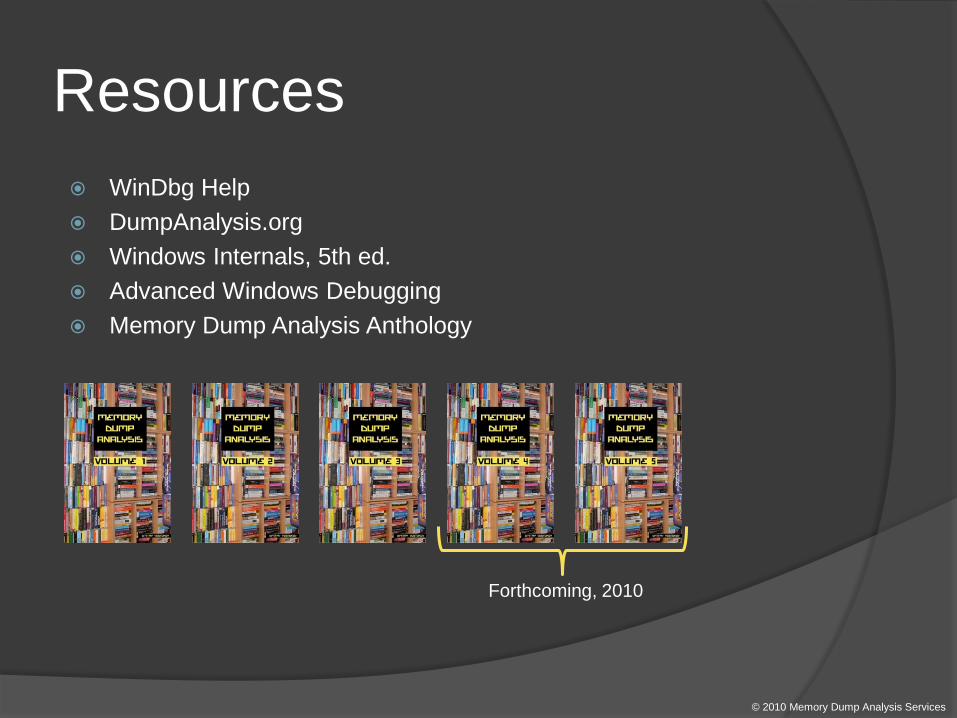
Resources WinDbg Help DumpAnalysis.org Windows Internals, 5th ed. Advanced Windows Debugging Memory Dump Analysis Anthology
Forthcoming, 2010
© 2010 Memory Dump Analysis Services
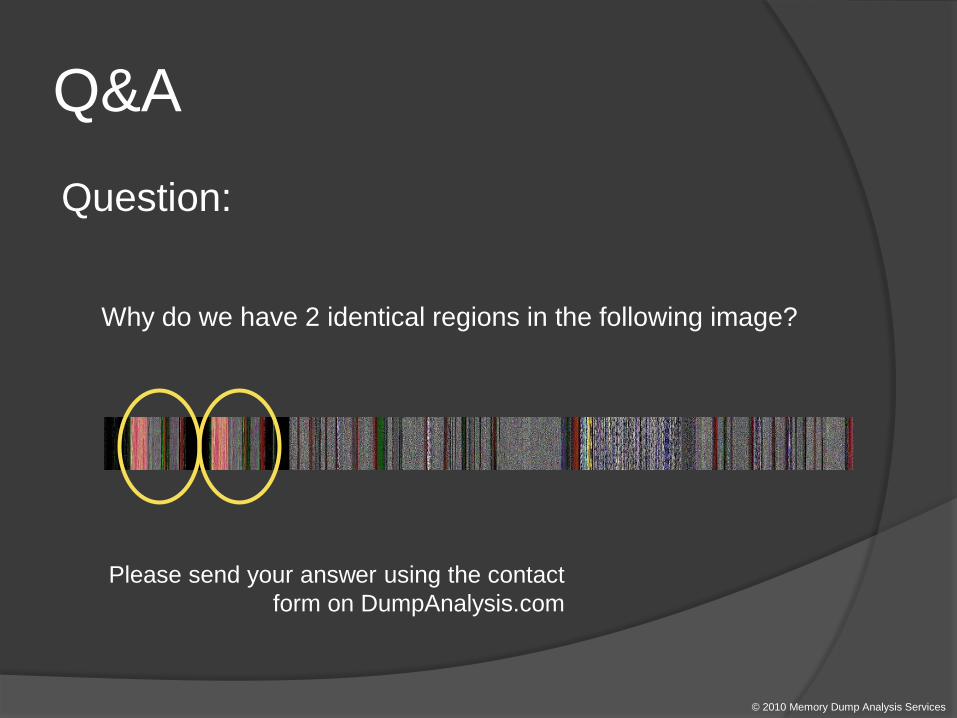
Q&A Question: Why do we have 2 identical regions in the following image?
Please send your answer using the contact form on DumpAnalysis.com
© 2010 Memory Dump Analysis Services

Q&A
Please send your feedback using the contact form on DumpAnalysis.com
© 2010 Memory Dump Analysis Services

Thank you for attendance!
© 2010 Memory Dump Analysis Services