funding africa’s oil & gas activities · pdf filefunding africa’s oil &...
TRANSCRIPT

Funding Africa’s Oil & Gasactivities
Panel discussion
www.pwc.com
December 2014
PwCDecember 2014
Introductions
Funding Africa’s Oil & Gas • Panel2
Partner, Capital MarketsHead of the International IPO Centre
Clifford Tompsett
E mail: [email protected].: +44 (0) 20 7804 4703Mob.: +44 (0) 7802 918877

PwCDecember 2014
Panel members
Funding Africa’s Oil & Gas • Panel3
Dmitri Tsvetkov
Chief Financial Officer
Mart Resources Inc.
Paul Eardley-Taylor
Head of Investment BankingCoverage for the Energy, Utilities andInfrastructure Sectors
Standard Bank, South Africa
Doug Rycroft
Asset General Manager
Ophir Energy plc
Joseph Carasso
Chief Executive Officer
Citibank, Tanzania
PwCDecember 2014
Global perspective
1
Funding Africa’s Oil & Gas • Panel

PwCDecember 2014
The last six months have seen oil prices fall to their lowest levels inalmost three years as a drop-off in demand has not been met by acorresponding decrease in supply
2Funding Africa’s Oil & Gas • Panel
-
20
40
60
80
100
120
140
160
2000 2001 2002 2003 2004 2005 2006 2007 2008 2009 2010 2011 2012 2013 2014
Historic real oil price (Brent $/bbl)Last 6 months
• Weaker than expected economicrecovery
• Abundance of US shale oil
• OPEC unwilling to act as marketstabiliser
• Prices may take time to recover orindeed go lower
Source: Federal Reserve Economic Data
60
70
80
90
100
110
120
5
PwCDecember 2014
-
10
20
30
40
50
60
70
80
0 5 10 15 20 25 30 35 40 45 50 55 60 65 70 75 80 85
Avera
ge
co
st
($/b
bl)
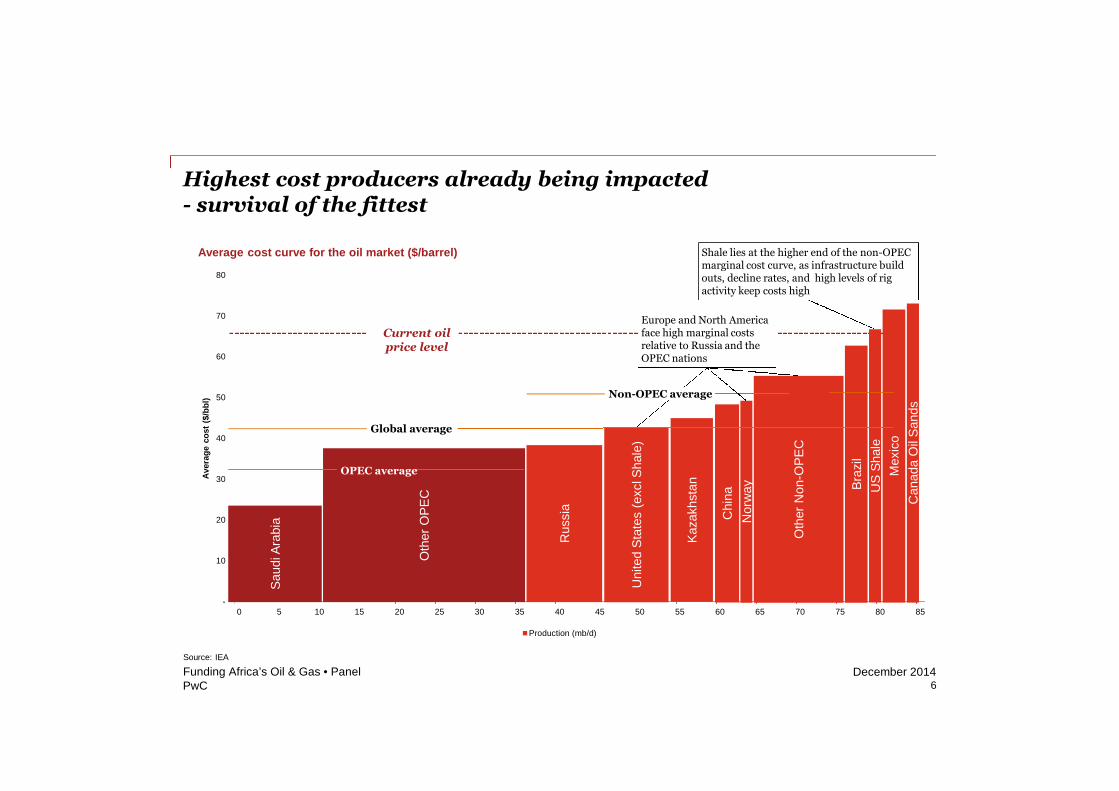
Average cost curve for the oil market ($/barrel)
Production (mb/d)
Highest cost producers already being impacted- survival of the fittest
3Funding Africa’s Oil & Gas • Panel
SaudiA
rabia
Oth
er
OP
EC
Russ
ia
Unite
dS
tate
s(e
xcl
Shale
)
Kaza
khst
an
Chin
a
Norw
ay
Oth
er
Non-O
PE
C
Bra
zil
US
Shale
Mexic
o
Canada
Oil
Sands
OPEC average
Global average
Shale lies at the higher end of the non-OPECmarginal cost curve, as infrastructure buildouts, decline rates, and high levels of rigactivity keep costs high
Non-OPEC average
Source: IEA
6
Current oilprice level
Europe and North Americaface high marginal costsrelative to Russia and theOPEC nations
PwCDecember 2014
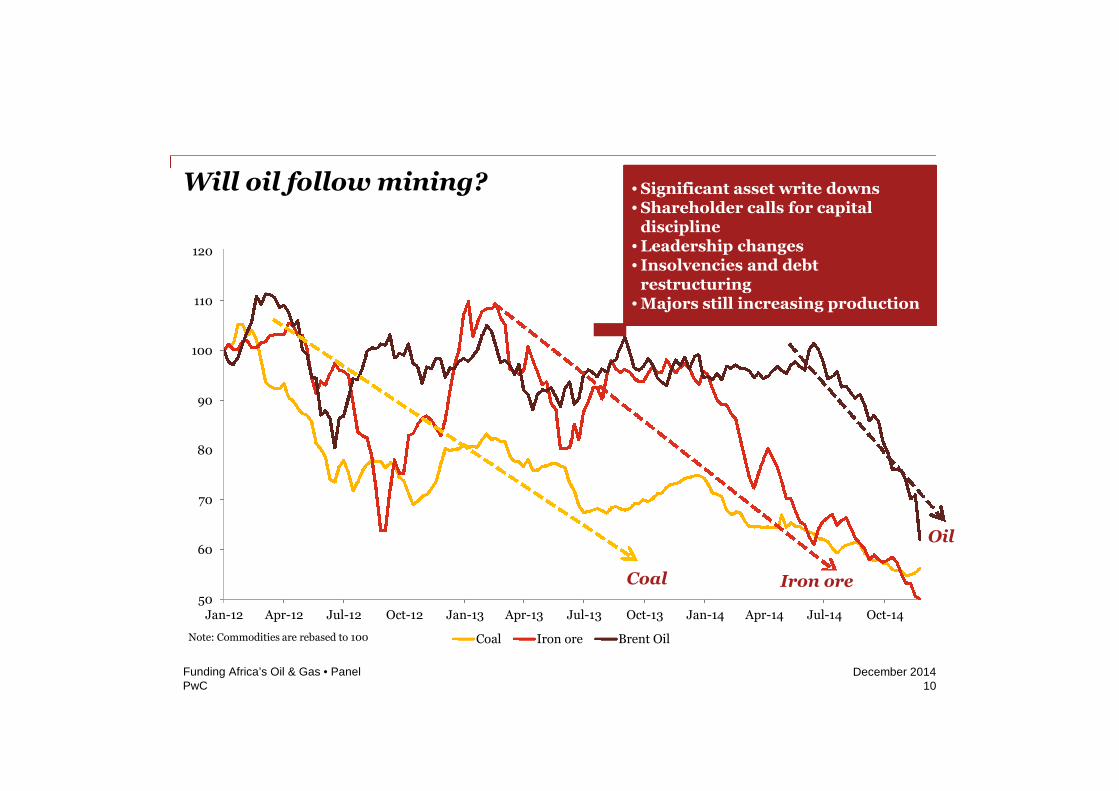
Will oil follow mining?
50
60
70
80
90
100
110
120
Jan-12 Apr-12 Jul-12 Oct-12 Jan-13 Apr-13 Jul-13 Oct-13 Jan-14 Apr-14 Jul-14 Oct-14
Coal Iron ore Brent Oil
10Funding Africa’s Oil & Gas • Panel
• Significant asset write downs• Shareholder calls for capital
discipline• Leadership changes• Insolvencies and debt
restructuring• Majors still increasing production
Coal Iron ore
Oil
Note: Commodities are rebased to 100
PwCDecember 2014
Recent oil price falls may have profound effects if notreversed soon
4Funding Africa’s Oil & Gas • Panel
8
• Some upstream companies are very exposed to even short-term price falls
• Previous experience suggests a three-year recovery period even ifprices recover
• A prolonged reduction in prices will have knock-on effects in larger E&Pcompanies, oil field services and even banks with financial exposure
• Over the last few weeks we have seen signs of more serious stress acrossthe sector
• Upstream oil is most exposed, whereas gas and downstream willprobably be slower to react
• Stress will spread across time and reach those companies not yetseriously affected
PwCDecember 2014
3
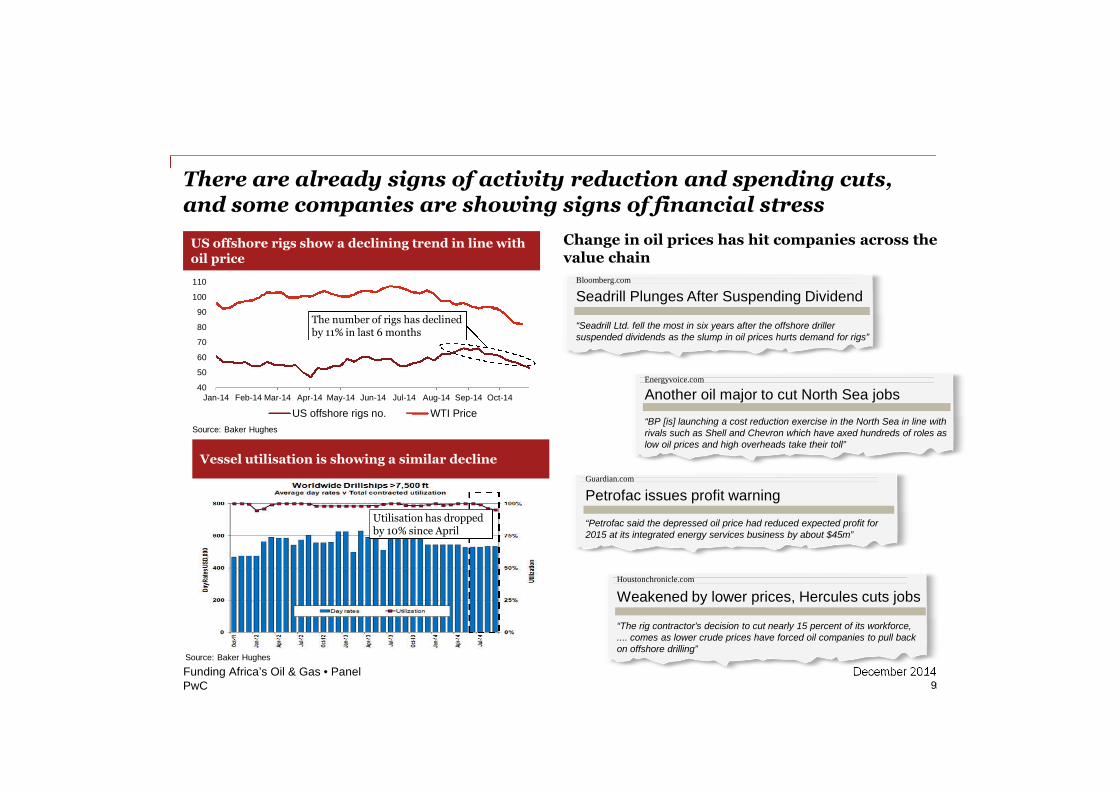
There are already signs of activity reduction and spending cuts,and some companies are showing signs of financial stress
5
Funding Africa’s Oil & Gas • Panel
40
50
60
70
80
90
100
110
120
Jan-14 Feb-14 Mar-14 Apr-14 May-14 Jun-14 Jul-14 Aug-14 Sep-14 Oct-14
US offshore rigs no. WTI Price
US offshore rigs show a declining trend in line withoil price
Vessel utilisation is showing a similar decline
Bloomberg.com
Seadrill Plunges After Suspending Dividend
“Seadrill Ltd. fell the most in six years after the offshore drillersuspended dividends as the slump in oil prices hurts demand for rigs”
Guardian.com
Petrofac issues profit warning
“Petrofac said the depressed oil price had reduced expected profit for2015 at its integrated energy services business by about $45m”
Energyvoice.com
Another oil major to cut North Sea jobs
“BP [is] launching a cost reduction exercise in the North Sea in line withrivals such as Shell and Chevron which have axed hundreds of roles aslow oil prices and high overheads take their toll”
Houstonchronicle.com
Weakened by lower prices, Hercules cuts jobs
“The rig contractor's decision to cut nearly 15 percent of its workforce,.... comes as lower crude prices have forced oil companies to pull backon offshore drilling”
Change in oil prices has hit companies across thevalue chain
Source: Baker Hughes
Source: Baker Hughes
The number of rigs has declinedby 11% in last 6 months
Utilisation has droppedby 10% since April
9
PwCDecember 2014
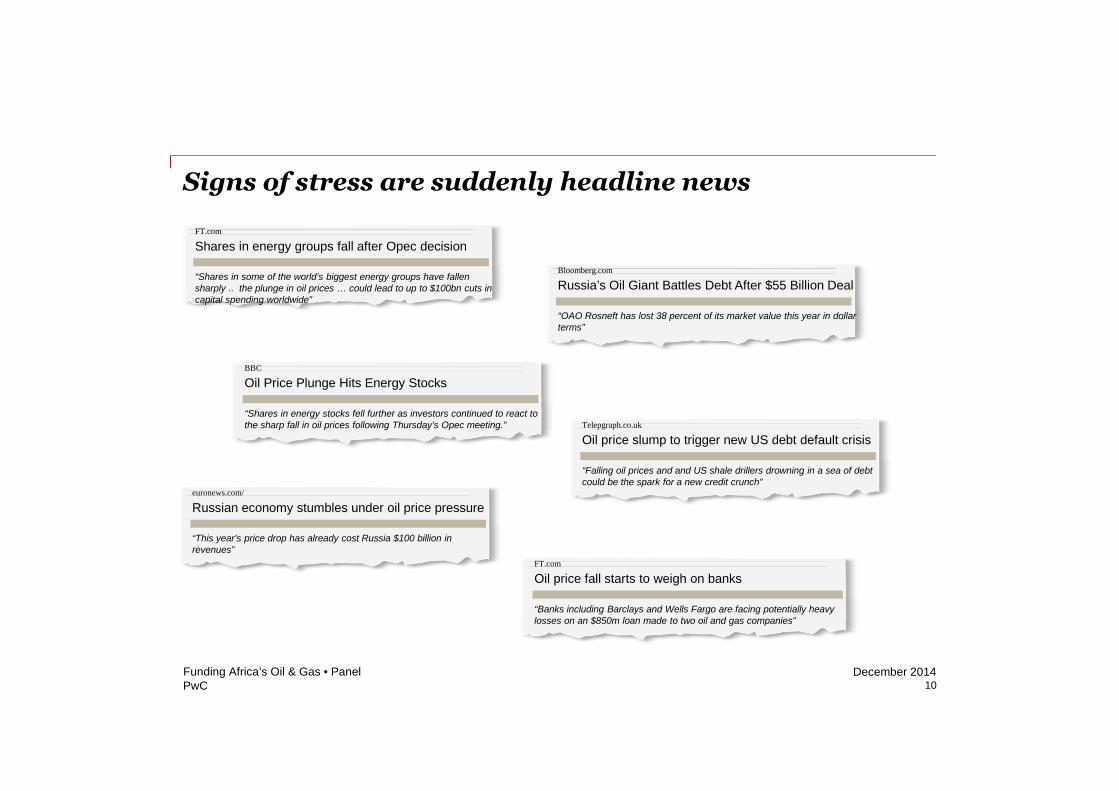
Signs of stress are suddenly headline news
8Funding Africa’s Oil & Gas • Panel
FT.com
Shares in energy groups fall after Opec decision
“Shares in some of the world’s biggest energy groups have fallensharply .. the plunge in oil prices … could lead to up to $100bn cuts incapital spending worldwide”
Bloomberg.com
Russia’s Oil Giant Battles Debt After $55 Billion Deal
“OAO Rosneft has lost 38 percent of its market value this year in dollarterms”
BBC
Oil Price Plunge Hits Energy Stocks
“Shares in energy stocks fell further as investors continued to react tothe sharp fall in oil prices following Thursday's Opec meeting.” Telepgraph.co.uk
Oil price slump to trigger new US debt default crisis
“Falling oil prices and and US shale drillers drowning in a sea of debtcould be the spark for a new credit crunch”
euronews.com/
Russian economy stumbles under oil price pressure
“This year’s price drop has already cost Russia $100 billion inrevenues”
FT.com
Oil price fall starts to weigh on banks
“Banks including Barclays and Wells Fargo are facing potentially heavylosses on an $850m loan made to two oil and gas companies”
10

PwCDecember 2014
Financing for oil & gas in 2014 likely to be down onprior years and the 2012 peak
Source: Thomson One
* Upstream and oilfield services2
Funding Africa Oil & Gas • Panel
Section 1 – Capital raising trends
7% 10%
23%
8% 7%6% 9%
2% 1%
2%
1% 1%1% 1%
16%
50%
26%
26%
36%
30%
17%
73%
38%
48%
64%
54%
62%
73%
$0bn
$100bn
$200bn
$300bn
$400bn
$500bn
$600bn
2008 2009 2010 2011 2012 2013 2014YTD
Oil & Gas* – money raised (US$ bn)
IPO Follow-On Convertible Bonds Loans
$357bn
$318bn
$476bn
$515bn
$460bn$458bn
* Upstream and oilfield services
$371bn
$25bn $32bn $38bn
$8bn
$31bn$47bn $35bn
$26bn
$58bn
$99bn
$63bn
$28bn
$0bn
$50bn
$100bn
$150bn
$200bn
2011 2012 2013 2014YTD
Investment grade High Yield
Emerging Market Investment Grade Emerging Market
Proceeds from public debt (US$ bn)
Issuerregion
Bank debt % oftotal
Africa $41bn 2%
USA $741bn 43%
Europe $245bn 14%
Rest of theworld
$712bn 41%
Total $1,739bn 100%
Funding African O&G Paul Eardley-Taylor
Oil and Gas, Southern Africa
11 December 2014
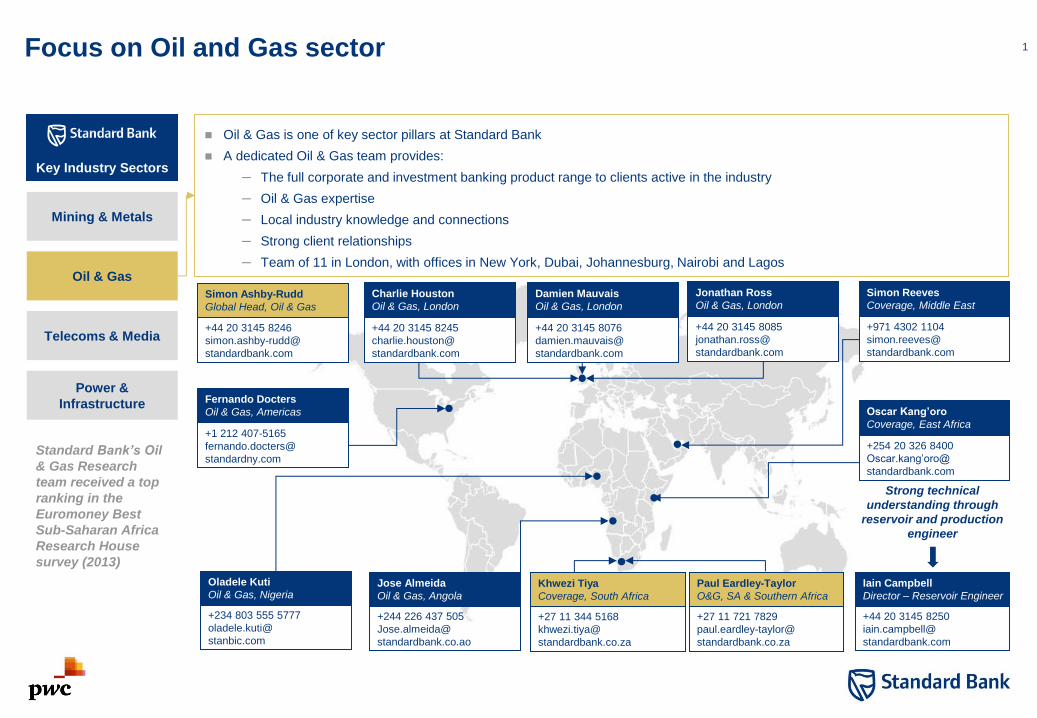
1 Focus on Oil and Gas sector
Oil & Gas is one of key sector pillars at Standard Bank
A dedicated Oil & Gas team provides:
– The full corporate and investment banking product range to clients active in the industry
– Oil & Gas expertise
– Local industry knowledge and connections
– Strong client relationships
– Team of 11 in London, with offices in New York, Dubai, Johannesburg, Nairobi and Lagos
Oladele Kuti
Oil & Gas, Nigeria
+234 803 555 5777
oladele.kuti@
stanbic.com
Jose Almeida
Oil & Gas, Angola
+244 226 437 505
Jose.almeida@
standardbank.co.ao
Fernando Docters
Oil & Gas, Americas
+1 212 407-5165
fernando.docters@
standardny.com
Jonathan Ross
Oil & Gas, London
+44 20 3145 8085
jonathan.ross@
standardbank.com
+44 20 3145 8246
simon.ashby-rudd@
standardbank.com
Simon Reeves
Coverage, Middle East
+971 4302 1104
simon.reeves@
standardbank.com
Power &
Infrastructure
Oil & Gas
Mining & Metals
Telecoms & Media
Key Industry Sectors
Iain Campbell
Director – Reservoir Engineer
+44 20 3145 8250
iain.campbell@
standardbank.com
Strong technical
understanding through
reservoir and production
engineer
Charlie Houston
Oil & Gas, London
+44 20 3145 8245
charlie.houston@
standardbank.com
Damien Mauvais
Oil & Gas, London
+44 20 3145 8076
damien.mauvais@
standardbank.com
Standard Bank’s Oil
& Gas Research
team received a top
ranking in the
Euromoney Best
Sub-Saharan Africa
Research House
survey (2013)
+27 11 721 7829
paul.eardley-taylor@
standardbank.co.za
Paul Eardley-Taylor
O&G, SA & Southern Africa
Simon Ashby-Rudd
Global Head, Oil & Gas
+27 11 344 5168
khwezi.tiya@
standardbank.co.za
Khwezi Tiya
Coverage, South Africa
Oscar Kang’oro
Coverage, East Africa
+254 20 326 8400
Oscar.kang’oro@
standardbank.com
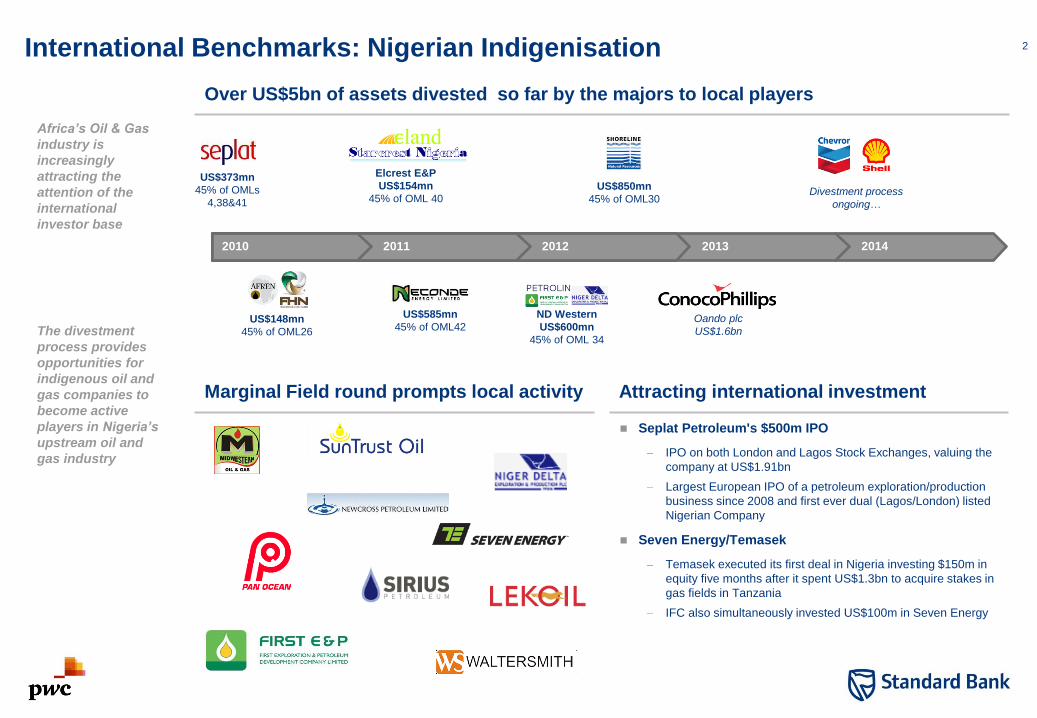
2 International Benchmarks: Nigerian Indigenisation
US$373mn
45% of OMLs
4,38&41
US$148mn
45% of OML26
US$850mn
45% of OML30
US$585mn
45% of OML42
Elcrest E&P
US$154mn
45% of OML 40
Oando plc
US$1.6bn
ND Western
US$600mn
45% of OML 34
Over US$5bn of assets divested so far by the majors to local players
Marginal Field round prompts local activity Attracting international investment
2010 2011 2012 2013 2014
Africa’s Oil & Gas
industry is
increasingly
attracting the
attention of the
international
investor base
Seplat Petroleum's $500m IPO
– IPO on both London and Lagos Stock Exchanges, valuing the
company at US$1.91bn
– Largest European IPO of a petroleum exploration/production
business since 2008 and first ever dual (Lagos/London) listed
Nigerian Company
Seven Energy/Temasek
– Temasek executed its first deal in Nigeria investing $150m in
equity five months after it spent US$1.3bn to acquire stakes in
gas fields in Tanzania
– IFC also simultaneously invested US$100m in Seven Energy
The divestment
process provides
opportunities for
indigenous oil and
gas companies to
become active
players in Nigeria’s
upstream oil and
gas industry
Divestment process
ongoing…
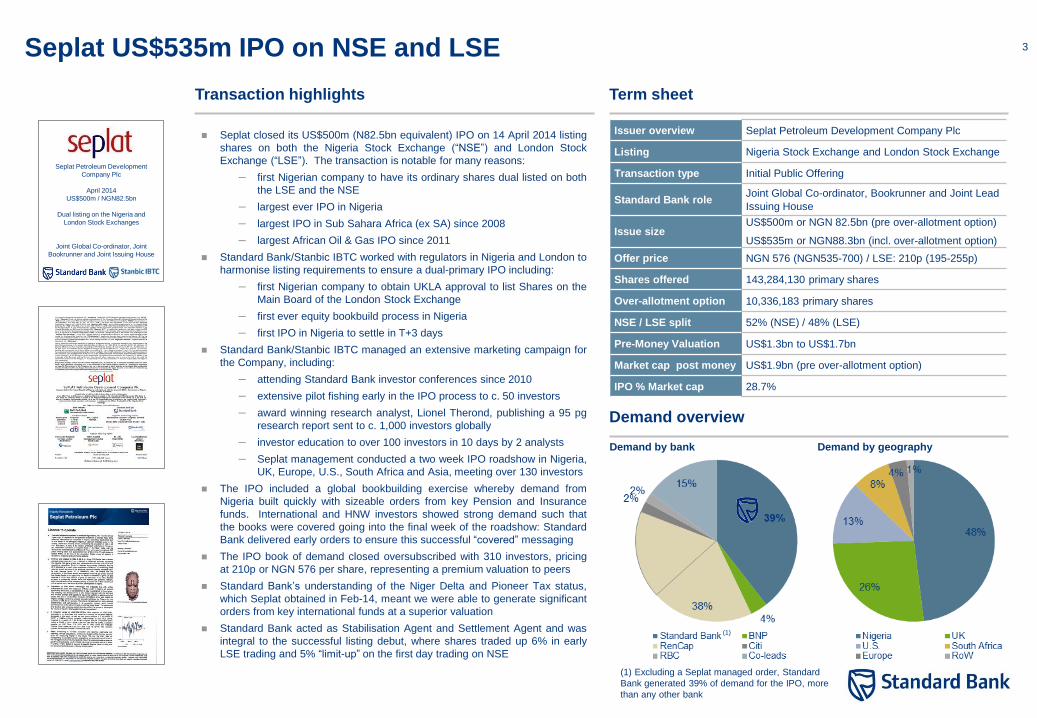
3 Seplat US$535m IPO on NSE and LSE
Seplat closed its US$500m (N82.5bn equivalent) IPO on 14 April 2014 listing
shares on both the Nigeria Stock Exchange (“NSE”) and London Stock
Exchange (“LSE”). The transaction is notable for many reasons:
– first Nigerian company to have its ordinary shares dual listed on both
the LSE and the NSE
– largest ever IPO in Nigeria
– largest IPO in Sub Sahara Africa (ex SA) since 2008
– largest African Oil & Gas IPO since 2011
Standard Bank/Stanbic IBTC worked with regulators in Nigeria and London to
harmonise listing requirements to ensure a dual-primary IPO including:
– first Nigerian company to obtain UKLA approval to list Shares on the
Main Board of the London Stock Exchange
– first ever equity bookbuild process in Nigeria
– first IPO in Nigeria to settle in T+3 days
Standard Bank/Stanbic IBTC managed an extensive marketing campaign for
the Company, including:
– attending Standard Bank investor conferences since 2010
– extensive pilot fishing early in the IPO process to c. 50 investors
– award winning research analyst, Lionel Therond, publishing a 95 pg
research report sent to c. 1,000 investors globally
– investor education to over 100 investors in 10 days by 2 analysts
– Seplat management conducted a two week IPO roadshow in Nigeria,
UK, Europe, U.S., South Africa and Asia, meeting over 130 investors
The IPO included a global bookbuilding exercise whereby demand from
Nigeria built quickly with sizeable orders from key Pension and Insurance
funds. International and HNW investors showed strong demand such that
the books were covered going into the final week of the roadshow: Standard
Bank delivered early orders to ensure this successful “covered” messaging
The IPO book of demand closed oversubscribed with 310 investors, pricing
at 210p or NGN 576 per share, representing a premium valuation to peers
Standard Bank’s understanding of the Niger Delta and Pioneer Tax status,
which Seplat obtained in Feb-14, meant we were able to generate significant
orders from key international funds at a superior valuation
Standard Bank acted as Stabilisation Agent and Settlement Agent and was
integral to the successful listing debut, where shares traded up 6% in early
LSE trading and 5% “limit-up” on the first day trading on NSE
Term sheet Transaction highlights
Issuer overview Seplat Petroleum Development Company Plc
Listing Nigeria Stock Exchange and London Stock Exchange
Transaction type Initial Public Offering
Standard Bank role Joint Global Co-ordinator, Bookrunner and Joint Lead
Issuing House
Issue size US$500m or NGN 82.5bn (pre over-allotment option)
US$535m or NGN88.3bn (incl. over-allotment option)
Offer price NGN 576 (NGN535-700) / LSE: 210p (195-255p)
Shares offered 143,284,130 primary shares
Over-allotment option 10,336,183 primary shares
NSE / LSE split 52% (NSE) / 48% (LSE)
Pre-Money Valuation US$1.3bn to US$1.7bn
Market cap post money US$1.9bn (pre over-allotment option)
IPO % Market cap 28.7%
Demand overview
Demand by bank Demand by geography
Seplat Petroleum Development
Company Plc
April 2014
US$500m / NGN82.5bn
Dual listing on the Nigeria and
London Stock Exchanges
Joint Global Co-ordinator, Joint
Bookrunner and Joint Issuing House
(1) Excluding a Seplat managed order, Standard
Bank generated 39% of demand for the IPO, more
than any other bank
(1)
Insert front cover of
prospectus
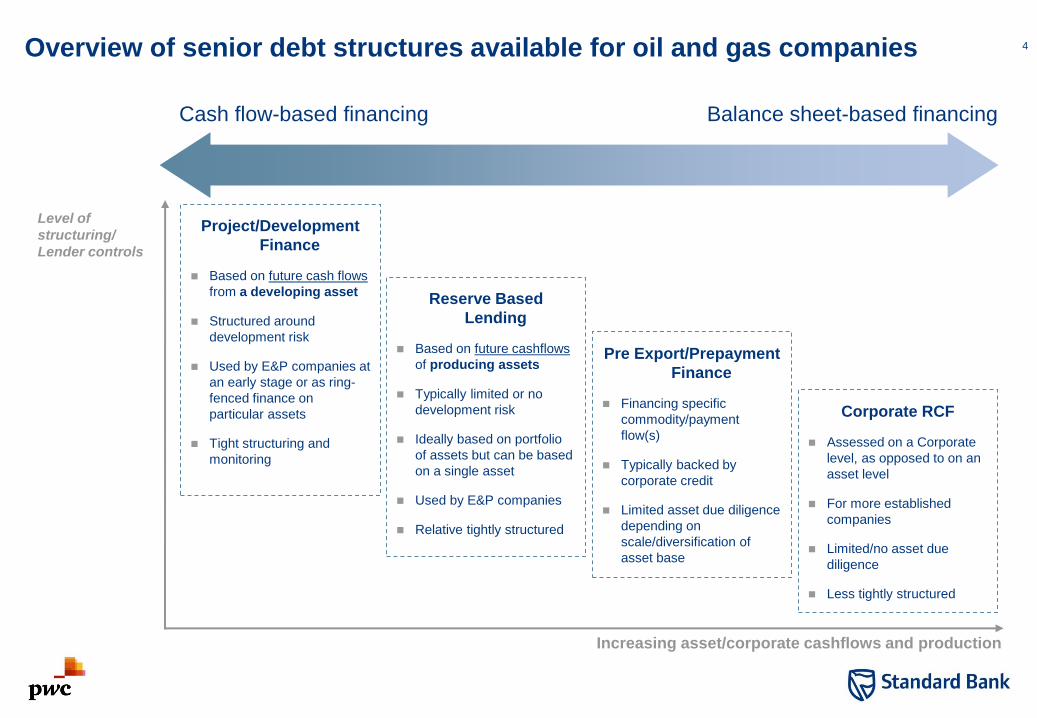
4 Overview of senior debt structures available for oil and gas companies
Project/Development
Finance
Based on future cash flows
from a developing asset
Structured around
development risk
Used by E&P companies at
an early stage or as ring-
fenced finance on
particular assets
Tight structuring and
monitoring
Cash flow-based financing Balance sheet-based financing
Reserve Based
Lending
Based on future cashflows
of producing assets
Typically limited or no
development risk
Ideally based on portfolio
of assets but can be based
on a single asset
Used by E&P companies
Relative tightly structured
Corporate RCF
Assessed on a Corporate
level, as opposed to on an
asset level
For more established
companies
Limited/no asset due
diligence
Less tightly structured
Pre Export/Prepayment
Finance
Financing specific
commodity/payment
flow(s)
Typically backed by
corporate credit
Limited asset due diligence
depending on
scale/diversification of
asset base
Increasing asset/corporate cashflows and production
Level of
structuring/
Lender controls
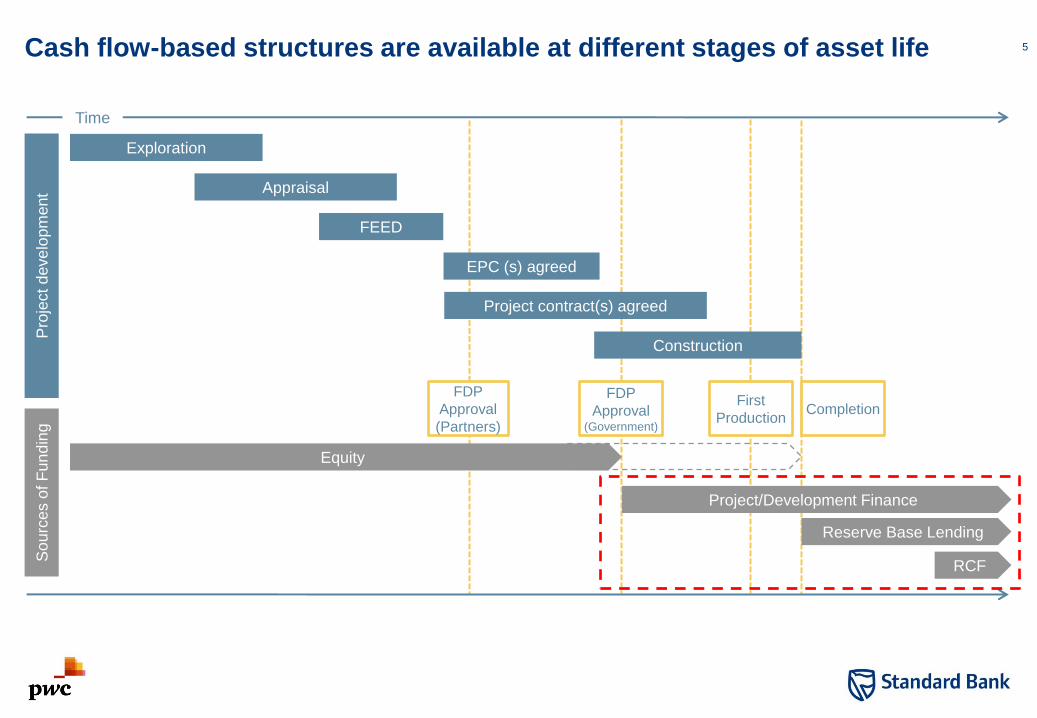
5 Cash flow-based structures are available at different stages of asset life
Exploration
Appraisal
FEED
EPC (s) agreed
Pro
ject d
eve
lopm
ent
So
urc
es o
f F
un
din
g
Project/Development Finance
Reserve Base Lending
FDP
Approval
(Partners)
FDP
Approval (Government)
First
Production Completion
Time
Equity
Construction
Project contract(s) agreed
RCF
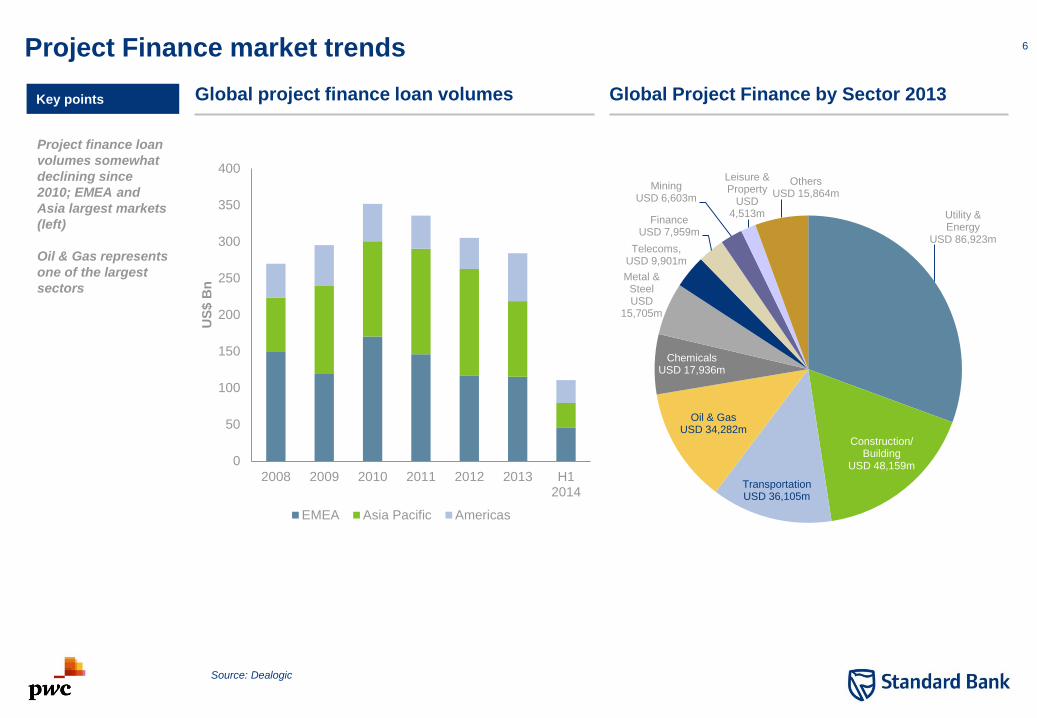
6 Project Finance market trends
Key points
Project finance loan
volumes somewhat
declining since
2010; EMEA and
Asia largest markets
(left)
Oil & Gas represents
one of the largest
sectors
Source: Dealogic
Utility & Energy
USD 86,923m
Construction/Building
USD 48,159m
TransportationUSD 36,105m
Oil & Gas USD 34,282m
Chemicals USD 17,936m
Metal & Steel USD
15,705m
Telecoms, USD 9,901m
Finance USD 7,959m
Mining USD 6,603m
Leisure & Property
USD 4,513m
Others USD 15,864m
0
50
100
150
200
250
300
350
400
2008 2009 2010 2011 2012 2013 H12014
US
$ B
n
EMEA Asia Pacific Americas
Global project finance loan volumes Global Project Finance by Sector 2013
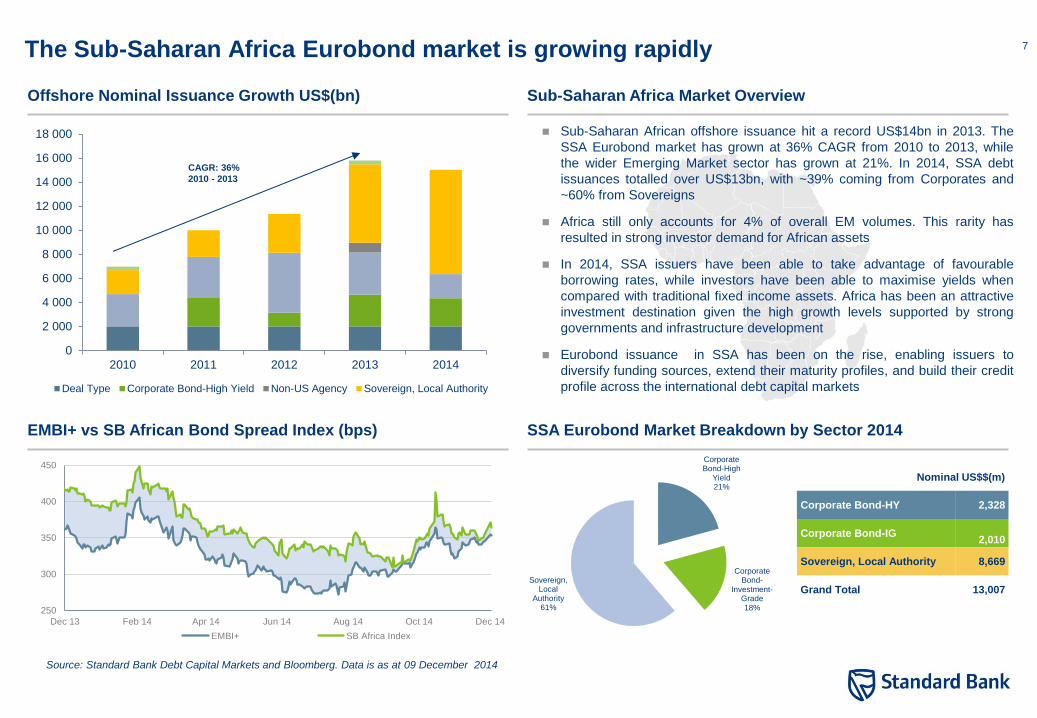
7 The Sub-Saharan Africa Eurobond market is growing rapidly
EMBI+ vs SB African Bond Spread Index (bps) SSA Eurobond Market Breakdown by Sector 2014
Sub-Saharan African offshore issuance hit a record US$14bn in 2013. The
SSA Eurobond market has grown at 36% CAGR from 2010 to 2013, while
the wider Emerging Market sector has grown at 21%. In 2014, SSA debt
issuances totalled over US$13bn, with ~39% coming from Corporates and
~60% from Sovereigns
Africa still only accounts for 4% of overall EM volumes. This rarity has
resulted in strong investor demand for African assets
In 2014, SSA issuers have been able to take advantage of favourable
borrowing rates, while investors have been able to maximise yields when
compared with traditional fixed income assets. Africa has been an attractive
investment destination given the high growth levels supported by strong
governments and infrastructure development
Eurobond issuance in SSA has been on the rise, enabling issuers to
diversify funding sources, extend their maturity profiles, and build their credit
profile across the international debt capital markets
CAGR: 36%
2010 - 2013
Source: Standard Bank Debt Capital Markets and Bloomberg. Data is as at 09 December 2014
Offshore Nominal Issuance Growth US$(bn)
Nominal US$$(m)
Corporate Bond-HY 2,328
Corporate Bond-IG
2,010
Sovereign, Local Authority 8,669
Grand Total 13,007
Sub-Saharan Africa Market Overview
Corporate Bond-High
Yield 21%
Corporate Bond-
Investment-Grade 18%
Sovereign, Local
Authority 61%
0
2 000
4 000
6 000
8 000
10 000
12 000
14 000
16 000
18 000
2010 2011 2012 2013 2014
Deal Type Corporate Bond-High Yield Non-US Agency Sovereign, Local Authority
250
300
350
400
450
Dec 13 Feb 14 Apr 14 Jun 14 Aug 14 Oct 14 Dec 14
EMBI+ SB Africa Index

8 O&G Megaprojects
LNG as key example – Mozambique and Tanzania
Large megaprojects will require multiple financing options from actors with different objectives
Fiscal and legal stability crucial element in unlocking financing solutions
Array of social, political, economic, financial interests leads to complexity
Key points
Megaprojects, such as
LNG, require multiple
financing solutions
from an array of
actors
Unlocking deals key
given complexity with
diverse interests and
impacts of such
projects
Multiple Funding Routes
Funding
ECA
Equity
DFI
Banks
National
Content
Shareholder
Returns
Return on
Capital
Additionality
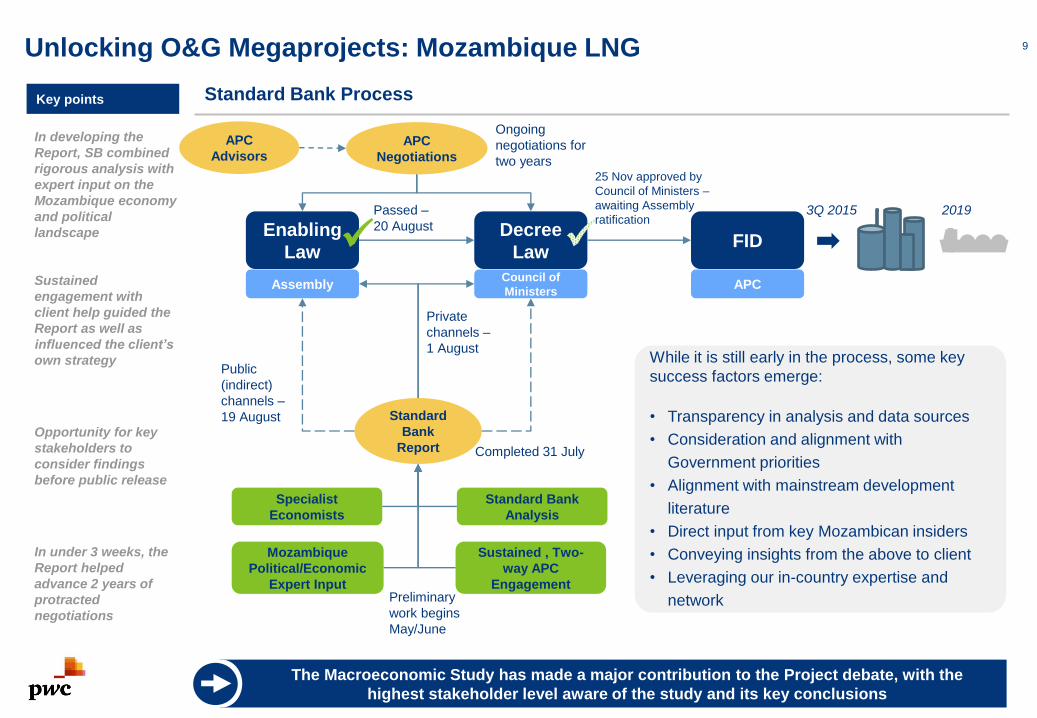
9 Unlocking O&G Megaprojects: Mozambique LNG
Standard Bank Process Key points
Preliminary
work begins
May/June
Enabling
Law
Assembly
Decree
Law
Council of
Ministers
FID
APC
Standard
Bank
Report
APC
Negotiations
APC
Advisors
Specialist
Economists
Mozambique
Political/Economic
Expert Input
Sustained , Two-
way APC
Engagement
Standard Bank
Analysis
Private
channels –
1 August
Public
(indirect)
channels –
19 August
3Q 2015 2019
Ongoing
negotiations for
two years
Passed –
20 August
Completed 31 July
While it is still early in the process, some key
success factors emerge:
• Transparency in analysis and data sources
• Consideration and alignment with
Government priorities
• Alignment with mainstream development
literature
• Direct input from key Mozambican insiders
• Conveying insights from the above to client
• Leveraging our in-country expertise and
network
The Macroeconomic Study has made a major contribution to the Project debate, with the
highest stakeholder level aware of the study and its key conclusions
In developing the
Report, SB combined
rigorous analysis with
expert input on the
Mozambique economy
and political
landscape
Sustained
engagement with
client help guided the
Report as well as
influenced the client’s
own strategy
Opportunity for key
stakeholders to
consider findings
before public release
In under 3 weeks, the
Report helped
advance 2 years of
protracted
negotiations
25 Nov approved by
Council of Ministers –
awaiting Assembly
ratification
10 Disclaimer
This presentation is provided for information purposes only on the express understanding that the information contained herein will be regarded as strictly confidential. It is not to be delivered
nor shall its contents be disclosed to anyone other than the entity to which it is being provided and its employees and shall not be reproduced or used, in whole or in part, for any purpose other
than for the consideration of the financing or transaction described herein, without the prior written consent of a member of the Standard Bank Group. The information contained in this
presentation does not purport to be complete and is subject to change. This is a commercial communication. This presentation may relate to derivative products and you should not deal in such
products unless you understand the nature and extent of your exposure to risk. The presentation does not include a personal recommendation and does not constitute an offer, or the
solicitation of an offer for the sale or purchase of any financial product, service, investment or security. The investments and strategies discussed here may not be suitable for all investors; if you
have any doubts you should consult your investment advisor. The investments discussed may fluctuate in price or value Whilst every care has been taken in preparing this presentation, no
member of the Standard Bank Group gives any representation, warranty or undertaking and accepts no responsibility or liability as to the accuracy, or completeness, of the information in this
presentation Past performance is not indicative of future results. For the avoidance of doubt, our duties and responsibilities shall not include tax advisory, legal, regulatory accounting or other
specialist or technical advice or services. You are to rely on your own independent appraisal of and investigations into all matters and things contemplated by this presentation. By accepting this
presentation, you agree to be bound by the foregoing limitations. Kindly note that this presentation does not represent an offer of funding since any facility to be granted in terms of this
presentation would be subject to the Standard Band Group obtaining the requisite internal and external approvals. Copyright 2010 Standard Bank Group. All rights reserved.
UK Residents
This presentation is not intended for the use of retail clients and must not be acted on or relied on by persons who are retail clients. Any investment or investment activity to which this
presentation relates is only available to persons other than retail clients and will be engaged in only with such persons. Standard Bank Plc (SB Plc) is authorised and regulated by the Financial
Services Authority (FSA), entered in the FSA’s register (register number 124823) and has approved this presentation for distribution in the UK only to persons other than retail clients. Persons
into whose possession this presentation comes are required by SB Plc to inform themselves about and to observe these restrictions. Telephone calls may be recorded for quality and regulatory
purposes. Standard Bank Plc, 20 Gresham Street, London, EC2V 7JE.
South African Residents
The Standard Bank of South Africa Limited (Reg.No.1962/000738/06) is regulated by the South African Reserve Bank and is an Authorised Financial Services Provider and Credit Provider.
United States Residents
In the US, Standard Bank Plc is acting through its agents, Standard Americas, Inc. and Standard New York Securities, Inc. Both are affiliates of Standard Bank Plc. Standard Americas, Inc is
registered as a commodity trading advisor and a commodity pool operator with the NFA. Standard New York Securities, Inc is a member of FINRA and SIPC. Neither are banks, regulated by
the United States Federal Reserve Board, nor insured by the FDIC.
Hong Kong Residents
Standard Bank Asia Limited is a fully licensed bank under the Banking Ordinance and is a registered institution under the Securities and Futures Ordinance in Hong Kong. Standard Securities
Asia Limited is a licensed corporation with the Securities and Futures Commission. Any investments and services contained or referred to in this presentation may not be suitable for you and it
is recommended that you consult an independent investment advisor if you are in doubt about such investments or investment services.
Dubai Residents
Standard Bank Plc, Dubai Branch, is regulated by the Dubai Financial Services Authority (‘DFSA) (register number F000028). Within the Dubai International Financial Centre, (‘DIFC’) the
financial products or services to which this marketing material relates will only be made available to Professional Clients, including a Market Counterparty, who meet the regulatory criteria of
being a Client.
Turkey Residents
Standard Unlu Menkul Degerler A.S. and Standard Unlu Portfoy Yonetimi A.S. are regulated by the Turkish Capital Markets Board “CMB”). According to CMB’s legislation, the information,
comments and recommendations contained in this presentation are not investment advisory services. Investment advisory services are provided under an investment advisory agreement
between a brokerage house, a portfolio management company, a bank that does not accept deposits or other capital markets professionals and the client. The comments and recommendations
contained in this presentation are based on the personal opinions of the authors. These opinions may not be appropriate for your financial situation and risk and return preferences. For that
reason, investment decisions relying solely on the information contained in this presentation may not meet your expectations.
www.martresources.com
MART RESOURCES:Funding Africa’s O&G activitiesDecember 11, 2014
Mr. Dmitri Tsvetkov (CFO & Director)
www.martresources.com
DisclaimerInformation Reserves Disclosures
Funding Africa’s O&G activities
December 11, 2014, Dar es Salam, Tanzania
Certain statements contained in thispresentation constitute “forward-lookingstatements” as such term is used inapplicable Canadian and US securitieslaws. These statements relate to analysesand other information that are basedupon forecasts of future results, estimatesof amounts not yet determinable andassumptions of management. Inparticular, statements concerning thetiming of the drilling of the upcomingwells, the future success of such wells,the ability of the Company to successfullycomplete and commercially produce,transport and sell oil from such well, themaintenance of current production levelsfrom existing wells and future wells, futurecrude oil pricing levels and the ability to ofthe Company to fund future drillingoperations from future cash flow, pipelineinterruptions on existing or futurepipelines, timing of completion of theUmugini pipeline, estimates of pipelinelosses and events or projectionsreferenced or implied herein should beviewed as forward-looking statements. Allreserves estimates and estimates offuture net revenue do not represent fairmarket value. Any statements thatexpress or involve discussions withrespect to predictions, expectations,beliefs, plans, projections, objectives,assumptions or future events or are notstatements of historical fact and shouldbe viewed as “forward-lookingstatements”. Such forward lookingstatements involve known and unknownrisks, uncertainties and other factorswhich may cause the actual results,performance or achievements of theCorporation to be materially different fromany future results, performance orachievements expressed or implied bysuch forward-looking statements. Inparticular, there is no assurance that theadditional export capacity allocated to theUmusadege field and other fields in thearea (collectively, the “Cluster”) will beavailable. Total export capacity allocatedto the Umusadege Field is subject tochange depending upon production levelsby other fields in the
Cluster. There us no assurance thatadditional pipeline export volumes will beavailable to the Umusadege field co-venturers within the timeframes indicatedor at the volumes indicated. Such risksand other factors include, among others,costs and timing of exploration andproduction development, availability ofcapital to fund exploration and productiondevelopment; political, social and otherrisks inherent in carrying on business in aforeign jurisdiction, the effects of arecessionary economy and such otherbusiness risks as discussed herein andother publicly filed disclosure documents.Although the Company has attempted toidentify important factors that could causeactual actions, events or results to differmaterially from those described inforward-looking statements, there may beother factors that cause actions, events orresults not to be as anticipated, estimatedor intended. Investors are cautioned thatsuch forward-looking statements involverisks and uncertainties. There can be noassurance that such statements will proveto be accurate as actual results and futureevents could vary or differ materially fromthose anticipated in such statements.Accordingly, readers should not placeundue reliance on forward-lookingstatements contained in this newsrelease. The forward-looking statementscontained herein are expressly qualifiedby this cautionary statement. Forward-looking statements are made based onmanagement’s beliefs, estimates andopinions on the date hereof and theCompany undertakes no obligation toupdate any forward-looking statementscontained herein whether as a result ofnew information, future events orotherwise, except as required byapplicable law. A detailed description ofrisks associated with forward lookingstatements and with the Company’sbusiness and operations are set out inMart’s most recent Annual InformationForm filed on SEDAR
All information contained in thispresentation regarding reserves and netpresent value of future net revenue hasbeen derived from the Company’s Form51-101 F1-Statement of Reserves Dataand Other Oil and Gas Information forthe year ended December 31, 2013(“Statement of Reserves Data”) whichreport, along with the Form 51-101F2-Report on Reserves Data and Form 51-101F3-Report of Management andDirectors on Reserves Data and OtherInformation are available for review inMart’s Annual Information Form for theyear ended December 31, 2013 andthe Company’s Form 51-101FI havingan effective date of March 31, 2013 atwww.sedar.com and on the Company’swebsite at www.martresources.com.
Reserves: Reserves are volumesof hydrocarbons and associatedsubstances estimated to becommercially recoverable from knownaccumulations from a given dateforward by established technologyunder specified economic conditionsand government regulations. Specifiedeconomic conditions may be currenteconomic conditions in the case ofconstant price and un-inflated costforecasts (as required by manyfinancial regulatory authorities) orthey may be reasonably anticipatedeconomic conditions in the caseof escalated price and inflated costforecasts.
Possible Reserves: Possible reservesare quantities of recoverablehydrocarbons estimated on the basis ofengineering and geological data thatare less complete and less conclusivethan the data used in estimates ofprobable reserves. Possible reservesare less certain to be recovered thanproved or probable reserves whichmeans for purposes of reservesclassification there is a 10% probabilitythat more than these reserves will berecovered, i.e. there is a 90%probability that less than these reserves
will be recovered. This categoryincludes those reserves that may berecovered by an enhanced recoveryscheme that is not in operation andwhere there is reasonable doubt as toits chance of success. RPS Energy onlydetermines possible reserves whenspecifically requested to do so.
Proved Reserves: Proved reserves arethose reserves that can be estimatedwith a high degree of certainty on thebasis of an analysis of drilling,geological, geophysical andengineering data. A high degree ofcertainty generally means, for thepurposes of reserve classification, that itis likely that the actual remainingquantities recovered will exceed theestimated proved reserves and there isa 90% confidence that at least thesereserves will be produced, i.e. there isonly a 10% probability that less thanthese reserves will be recovered. Ingeneral reserves are considered provedonly if supported by actual production orformation testing. In certain instancesproved reserves may be assigned onthe basis of log and/or core analysis ifanalogous reservoirs are known to beeconomically productive. Provedreserves are also assigned forenhanced recovery processes whichhave been demonstrated to beeconomicallyand technically successful in thereservoir either by pilot testing orby analogy to installed projects inanalogous reservoirs.
Mart’s reserves have been evaluated byRPS Energy Canada Ltd. (“RPSEnergy”), an independent reservesevaluator. The reserves definitions usedby RPS Energy conform to the reservesdefinitions set forth in CanadianNational Instrument 51-101, “Standardsof Disclosure for Oil and Gas Activities”and its companion policy, whichreserves definitions are set out below.
Probable Reserves: Probable reserves(also called Probable Additionalreserves) are quantities of recoverablehydrocarbons estimated on the basis ofengineering and geological data thatare similar to those used for provedreserves but that lack, for variousreasons, the certainty required toclassify the reserves are proved.Probable reserves are less certain to berecovered than proved reserves; whichmeans, for purposes of reservesclassification, that there is 50%probability that more than the Provedplus Probable Additional reserves willactually be recovered. These includereserves that would be recoverable if amore efficient recovery mechanismdevelops than was assumed inestimating proved reserves; reservesthat depend on successful work-over ormechanical changes for recovery;reserves that require infill drilling andreserves from an enhanced recoveryprocess which has yet to be establishedand pilot tested but appears to havefavorable conditions for successfulapplication.
The Information uses the terms “netback per barrel” and “operating net backper barrel” which do not have astandardized meaning underInternational Financial ReportingStandards (IFRS) and may not becomparable to similar measurespresented by other companies. Thesenon-IFRS measures are calculatedunder the heading “Net back per bbl”.The Company uses “operating net backper barrel” and “net back per barrel” tohelp evaluate its operatingperformance. Readers are cautionedthat these non-IFRS measure shouldnot be construed as an alternative toboth net income and net cash fromoperating activities, as indicators of theCompany’s performance, cash flows oras a measure of actual return. Readersshould refer to the Company’s financialstatements and management’sdiscussion and analysis available atwww.sedar.com.
2
www.martresources.com
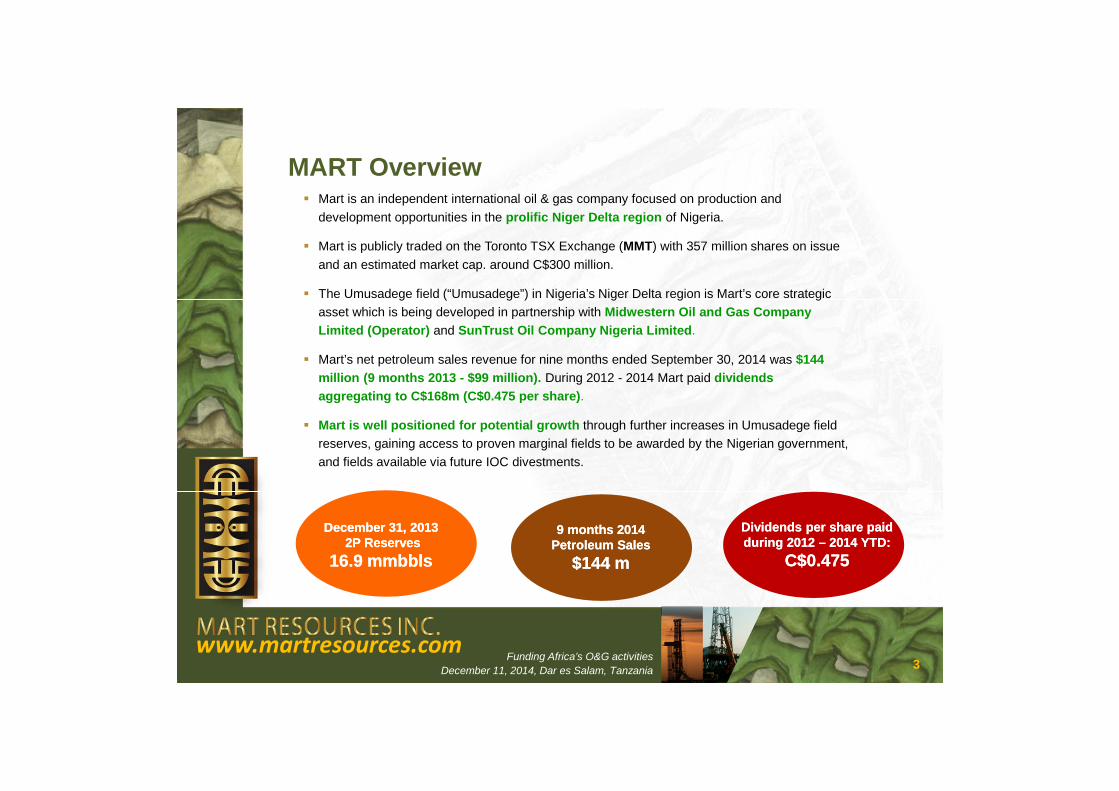
MART Overview Mart is an independent international oil & gas company focused on production and
development opportunities in the prolific Niger Delta region of Nigeria.
Mart is publicly traded on the Toronto TSX Exchange (MMT) with 357 million shares on issue
and an estimated market cap. around C$300 million.
The Umusadege field (“Umusadege”) in Nigeria’s Niger Delta region is Mart’s core strategic
asset which is being developed in partnership with Midwestern Oil and Gas Company
Limited (Operator) and SunTrust Oil Company Nigeria Limited.
Mart’s net petroleum sales revenue for nine months ended September 30, 2014 was $144
million (9 months 2013 - $99 million). During 2012 - 2014 Mart paid dividends
aggregating to C$168m (C$0.475 per share).
Mart is well positioned for potential growth through further increases in Umusadege field
reserves, gaining access to proven marginal fields to be awarded by the Nigerian government,
and fields available via future IOC divestments.
December 31, 20132P Reserves
16.9 mmbbls
December 31, 20132P Reserves
16.9 mmbbls
9 months 2014Petroleum Sales
$144 m
9 months 2014Petroleum Sales
$144 m
Dividends per share paidduring 2012 – 2014 YTD:
C$0.475
Dividends per share paidduring 2012 – 2014 YTD:
C$0.475
3Funding Africa’s O&G activities
December 11, 2014, Dar es Salam, Tanzania

www.martresources.com
2014 Highlights Reserves reported at December 31, 2013 – 16.9 MMbbls proved and probable
Quarterly dividends of C$0.05, C$0.015, and C$0.01 per share were paid in April2014, July 2014, and October 2014 respectively
Record Umusadege daily field production of 17,777 bbls on October 20, 2014
Moved to mainboard TSX listing on April 2, 2014
Secured term loan facility was increased to $232.5 million
2014 Developments UMU-3STH well, a horizontal side track well, was drilled in June - July
2014 and the testing of the VI sand yielded an oil rate of 4,893 bopd inJuly 2014
UMU-4STH well, a horizontal side track well, was drilled in August2014 and the testing of the VII sand yielded an oil rate of 4,700 bopd inSeptember 2014
UMU-12H well, a horizontal well, was drilled in September-October2014 and the testing of the VIII sand yielded an oil rate of 5,366 bopdin October 2014
Spudded UMU-13 on 28 October 2014 to appraise the East Prospect
the Umugini pipeline is completed and injections to Trans Forcadospipeline started at the beginning of December 2014
Mart participates in consortium to acquire 45% interest in OML 18
Record Daily FieldProduction in Oct 2014
17,777 bbls
Record Daily FieldProduction in Oct 2014
17,777 bbls
Qtrly Dividend
Q1- Q3 2014 - C$0.075Qtrly Dividend
Q1- Q3 2014 - C$0.075
4Funding Africa’s O&G activities
December 11, 2014, Dar es Salam, Tanzania

www.martresources.com
Umusadege Field History and Sources of FundingDevelopment drilling to increase
production to > 12,000 bopd(funded by debt from local
banks and cash flows from ops)
Fielddiscoveryin UMU-1
First CommercialOil Production
(Initial development funded byIssue of equity through
private placementsof shares listed at the
Toronto StockVenture Exchange)
Expansion of Central productionfacilities to 35,000 bpd
(Funded by cash flowsfrom operations)
Field Extension with UMU-9,UMU-10 & UMU-11 & 3 horizontal &1 appraisal wells were drilled in 2014
(funded by debt from a localbank and cash flows from ops)
2008-20112008-2011
2012-20142012-2014
2008200819741974 20032003
Umusadege’sSignificant Oil Reserves
5Funding Africa’s O&G activities
December 11, 2014, Dar es Salam,

www.martresources.com
Future productiongains will berealized by :
Increased pipelinecapacity
Production fromexisting wellsincreased significantlywhen pipelinecapacity wasincreased
Development drilling
Exploration potential
Future productiongains will berealized by :
Increased pipelinecapacity
Production fromexisting wellsincreased significantlywhen pipelinecapacity wasincreased
Development drilling
Exploration potential
AGIP ExportPipeline
Disruptions
AGIP ExportPipeline
Disruptions
Capacity constraint –AGIP export pipeline
Daily field productionrecord of 17,777 bblson 20 October 2014
Daily field productionrecord of 17,777 bblson 20 October 2014
UMU-7UMU-7
UMU-6UMU-6
UMU-1UMU-5UMU-1UMU-5
UMU-8UMU-8
UMU-10UMU-10
UMU-9UMU-9
Umusadege Field Production Profile
Note: Mart’s share of production is dependenton stages of cost recovery as prescribed underthe RSA (ranging from 50-82.5%)
BO
PD
6Funding Africa’s O&G activities
December 11, 2014, Dar es Salam, Tanzania
www.martresources.com
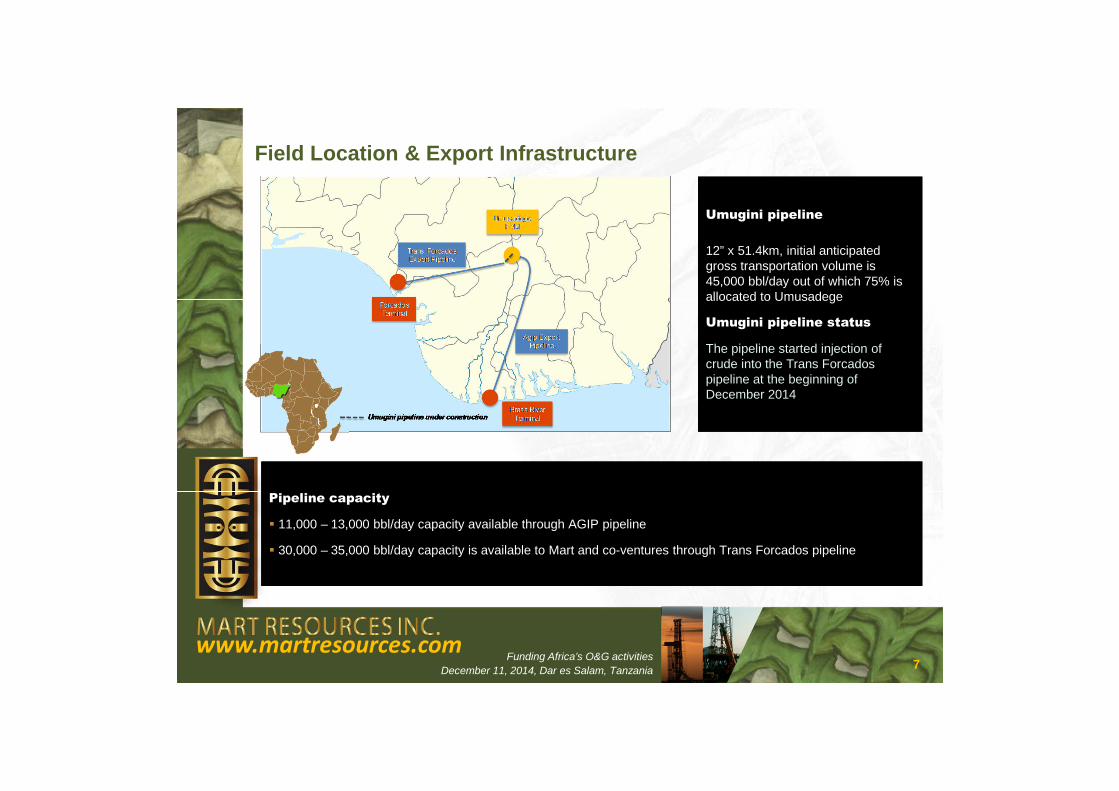
Umugini pipeline
12” x 51.4km, initial anticipatedgross transportation volume is45,000 bbl/day out of which 75% isallocated to Umusadege
Umugini pipeline status
The pipeline started injection ofcrude into the Trans Forcadospipeline at the beginning ofDecember 2014
Umugini pipeline
12” x 51.4km, initial anticipatedgross transportation volume is45,000 bbl/day out of which 75% isallocated to Umusadege
Umugini pipeline status
The pipeline started injection ofcrude into the Trans Forcadospipeline at the beginning ofDecember 2014
Field Location & Export Infrastructure
Pipeline capacity
11,000 – 13,000 bbl/day capacity available through AGIP pipeline
30,000 – 35,000 bbl/day capacity is available to Mart and co-ventures through Trans Forcados pipeline
Pipeline capacity
11,000 – 13,000 bbl/day capacity available through AGIP pipeline
30,000 – 35,000 bbl/day capacity is available to Mart and co-ventures through Trans Forcados pipeline
7Funding Africa’s O&G activities
December 11, 2014, Dar es Salam, Tanzania
www.martresources.com
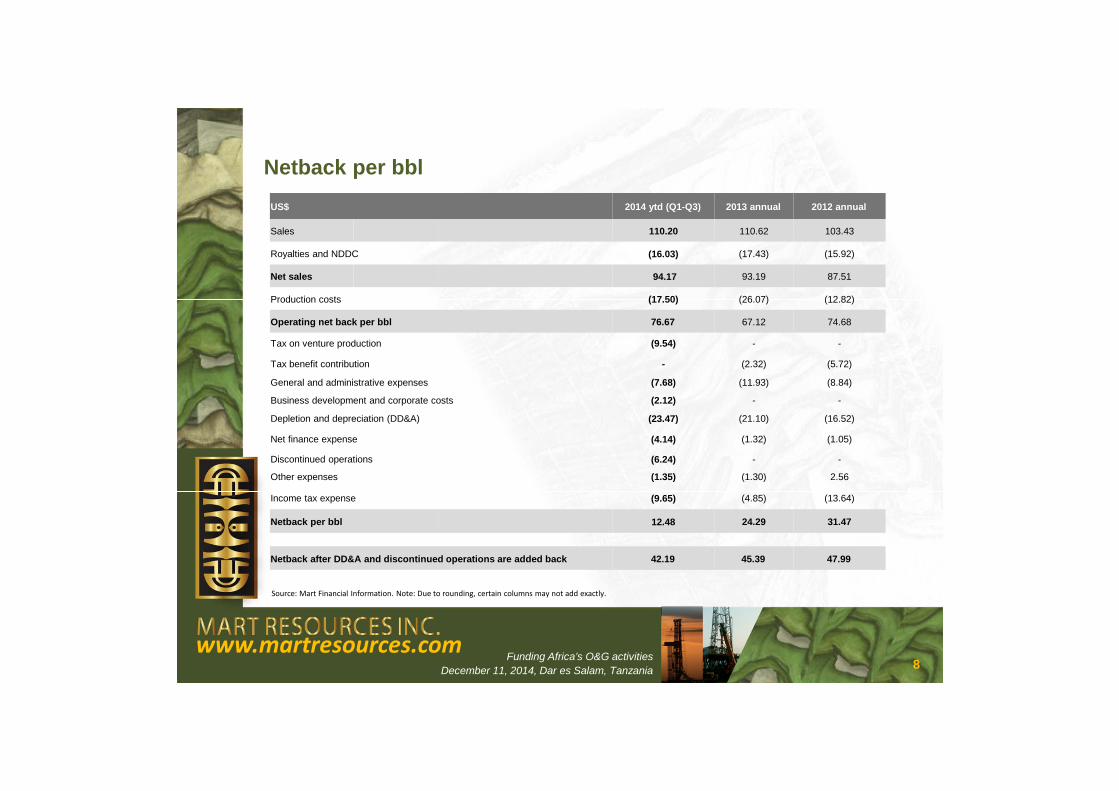
Netback per bbl
Source: Mart Financial Information. Note: Due to rounding, certain columns may not add exactly.
US$ 2014 ytd (Q1-Q3) 2013 annual 2012 annual
Sales 110.20 110.62 103.43
Royalties and NDDC (16.03) (17.43) (15.92)
Net sales 94.17 93.19 87.51
Production costs (17.50) (26.07) (12.82)
Operating net back per bbl 76.67 67.12 74.68
Tax on venture production (9.54) - -
Tax benefit contribution - (2.32) (5.72)
General and administrative expenses (7.68) (11.93) (8.84)
Business development and corporate costs (2.12) - -
Depletion and depreciation (DD&A) (23.47) (21.10) (16.52)
Net finance expense (4.14) (1.32) (1.05)
Discontinued operations (6.24) - -
Other expenses (1.35) (1.30) 2.56
Income tax expense (9.65) (4.85) (13.64)
Netback per bbl 12.48 24.29 31.47
Netback after DD&A and discontinued operations are added back 42.19 45.39 47.99
8Funding Africa’s O&G activities
December 11, 2014, Dar es Salam, Tanzania
www.martresources.com
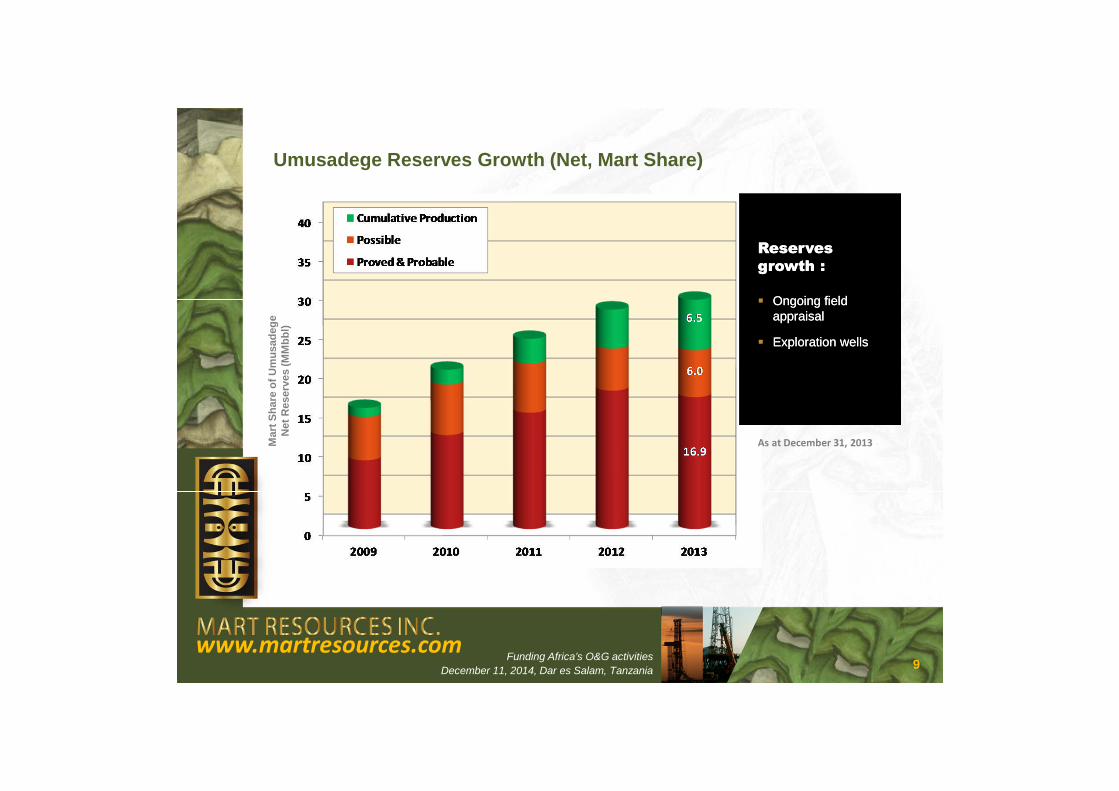
Umusadege Reserves Growth (Net, Mart Share)
Mart
Sh
are
of
Um
usad
eg
eN
et
Reserv
es
(MM
bb
l)
Reservesgrowth :
Ongoing fieldappraisal
Exploration wells
Reservesgrowth :
Ongoing fieldappraisal
Exploration wells
As at December 31, 2013
9Funding Africa’s O&G activities
December 11, 2014, Dar es Salam, Tanzania
www.martresources.com
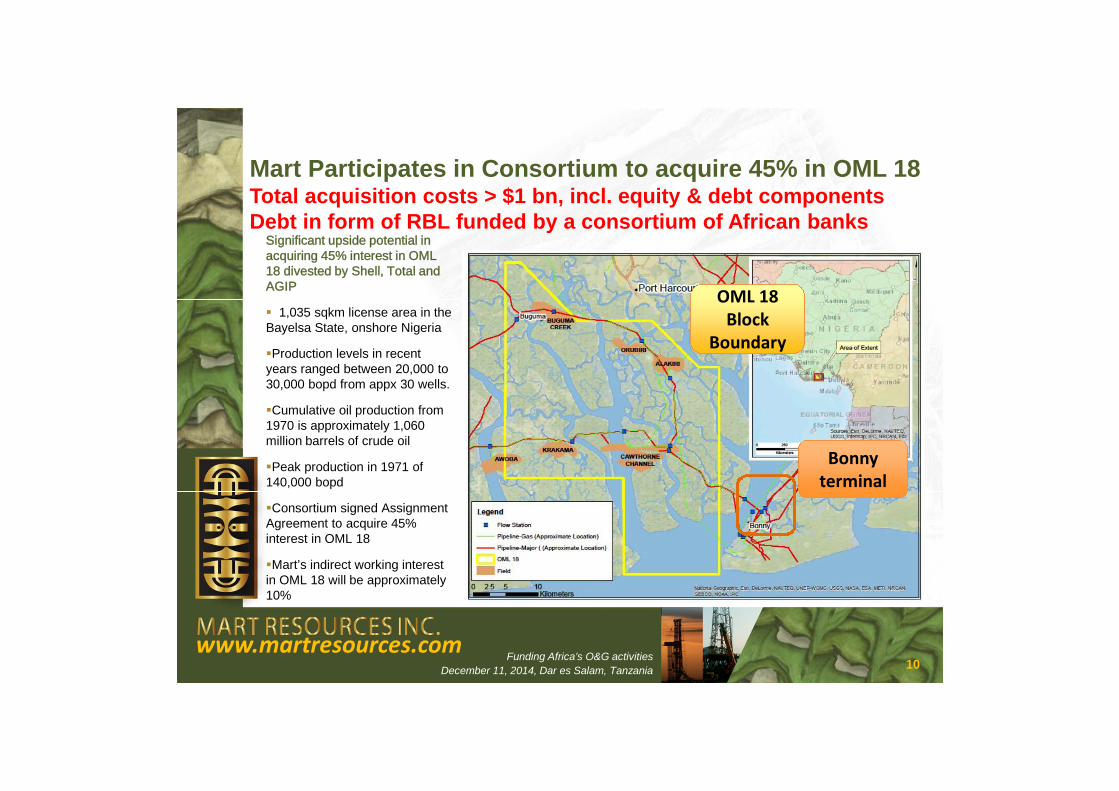
Mart Participates in Consortium to acquire 45% in OML 18Total acquisition costs > $1 bn, incl. equity & debt componentsDebt in form of RBL funded by a consortium of African banks
Significant upside potential inacquiring 45% interest in OML18 divested by Shell, Total andAGIP
1,035 sqkm license area in theBayelsa State, onshore Nigeria
Production levels in recentyears ranged between 20,000 to30,000 bopd from appx 30 wells.
Cumulative oil production from1970 is approximately 1,060million barrels of crude oil
Peak production in 1971 of140,000 bopd
Consortium signed AssignmentAgreement to acquire 45%interest in OML 18
Mart’s indirect working interestin OML 18 will be approximately10%
10
Bonnyterminal
OML 18OML 18Block
Boundary
Funding Africa’s O&G activities
December 11, 2014, Dar es Salam, Tanzania
www.martresources.com
CONTACT DETAILS :
Mr. Wade Cherwayko (CEO & Chairman) E: [email protected]
Mr. Dmitri Tsvetkov (CFO & Director) E: [email protected]
Calgary Office310, 1167 Kensington Cres. NWCalgary, Alberta T2N 1X7Tel: (403) 270-1841Fax: (403) 521-0443
Mart Energy ServicesPlot 1717, Mike Adenuga Close VictoriaIsland, Lagos, NigeriaTel: +234 (01) 271 1752Fax: +234 (01) 271 1751
UK Correspondence OfficeUnit 5 – Chelsea Wharf 15 Lots Road Dares Salam, Tanzania, England SW10 0QJTel: 011-44-207-351-7937Fax: 011-44-207-351-6935