funding agricultural innovation for the global south: does
TRANSCRIPT

Funding Agricultural Innovation for the Global South: Does it Promote Sustainable Agricultural Intensification?


Commission on Sustainable Agriculture Intensification
Funding Agricultural Innovation for the Global South: Does it Promote Sustainable Agricultural Intensification?
Dalberg Asia
August 2021

ii
This study was carried out by Dalberg Asia.
Dalberg Asia. 2021. Funding Agricultural Innovation for the Global South: Does it Promote Sustainable
Agricultural Intensification? Colombo, Sri Lanka: Commission on Sustainable Agriculture
Intensification. 57p.
Copyright © 2021, Commission on Sustainable Agriculture Intensification
Fair use:
Unless otherwise noted, you are free to copy, duplicate or reproduce, and distribute, display or
transmit any part of this report or portions thereof without permission, and to make translations,
adaptations or other derivative works under the following conditions:
ATTRIBUTION: The work must be referenced according to international citation standards,
while attribution should in no way suggest endorsement by WLE, IWMI or the author(s).
NON-COMMERCIAL: This work may not be used for commercial purposes.
SHARE ALIKE: If this work is altered, transformed or built upon, the resulting work must be
distributed only under the same or similar Creative Commons license to this one.
Disclaimer:
Final responsibility of report contents lies with the authors.
Note: This report uses proprietary datasets created through secondary research and extrapolations
made through consultation with various agricultural experts and investors. Hence, unless mentioned
otherwise, data and graphs in this report are derived from this database.

iii
Acknowledgements
The authors gratefully acknowledge the support and inputs provided by the Secretariat of the
Commission on Sustainable Agriculture Intensification (CoSAI) as well as all associated Commissioners
who played an extensive role in reviewing the analysis and various drafts of the report as well as their
support and inputs towards the approach for the study. The authors also thank Nienke Beintema for
her extensive support through the process and detailed review of the detailed datasets collated by
the study team. We also thank other anonymous reviewers who provided extensive feedback on the
analysis conducted and various versions of this report.
About the report
This report was commissioned by the Commission on Sustainable Agriculture Intensification (CoSAI).
CoSAI brings together agricultural and food systems experts and decision-makers from the Global
South and is collaborating with scientists, innovators and partner organizations from across the globe.
CoSAI was initiated and is supported by the CGIAR Research Program on Water, Land and Ecosystems
(WLE). WLE is funded by the CGIAR Trust Fund and other donors. CoSAI Commissioners are
independent.
The Oversight Committee for the study comprised CoSAI Commissioners P.V. Vara Prasad (KSU)
(Chair), David Simon (University of London), Jennifer Baarn (AGRA), Rodomiro Ortiz (SLU), Ruben
Echeverria (IFPRI), Sara Mbago-Bhunu (IFAD), Julia Compton and Shenggen Fan (IFPRI)
(design/inception phase). Study management and administration was provided by David Shearer and
Marah Al-Malalha from the CoSAI Secretariat. We also appreciate technical inputs from a CGIAR Expert
Group, with particular thanks to Chris Dickens, Claudia Ringler, Enrico Bonaiuti and Hector Tobon.
Sincere thanks to our external expert reviewers: Aline Mosnier, FABLE (Food, Agriculture, Biodiversity,
Land-Use, and Energy) Consortium; Carolyn Mutter, AgMIP (Agricultural Model Intercomparison and
Improvement Project), Columbia University Earth Institute; Holger Meinke, Independent Science for
Development Council, CGIAR, Keith Wiebe, IFPRI; Keith Fuglie, United States Department of
AgricultureSDA (USDA); and Ravi Khetarpal, Asia-Pacific Association of Agricultural Research
Institutions (APAARI).
Donors
This research was carried out as part of the CGIAR Research
Program on Water, Land and Ecosystems (WLE) and
supported by Funders contributing to the CGIAR Trust Fund
(https://www.cgiar.org/funders/)


v
Contents
List of Spotlights, Figures and Tables ..................................................................................................... vi
List of Acronyms and Abbreviations ..................................................................................................... viii
Executive Summary ................................................................................................................................ ix
1. Context and Key Objectives of this Report ......................................................................................... 1
2. State of Funding in Agricultural Innovation for the Global South .................................................... 10
3. State of Funding Targeting Innovation in Sustainable Agricultural Intensification .......................... 31
4. Observations on Improving Funding for Agricultural Innovations and SAI....................................... 38
5. Concluding Remarks .......................................................................................................................... 43
vi
List of Spotlights, Figures and Tables
Spotlights
Spotlight 1. More than half of the Kenyan government’s research funding goes to livestock,
fisheries and aquaculture. ......................................................................................... 18
Spotlight 2. China’s rise and influence in agriculture and innovation in the Global South. .. 19
Spotlight 3. USAID stands out with increasing agricultural innovation funding in the private
sector. ........................................................................................................................ 25
Spotlight 4. Private sector standards. .................................................................................... 36
Figures
Figure 1. Total Global Population Global, 2001-2050, billions ................................................ 1
Figure 2. Data availability and granularity across funding sources ......................................... 4
Figure 3. Broad and narrow definitions of SAI based on stated intentions of sustainability .. 7
Figure 4. Examples of stated intentions considered under each sustainability domain ......... 7
Figure 5. Average annual agricultural innovation funding in the Global South 2010- 2019, USD
billion (Constant 2019 prices) ................................................................................... 11
Figure 6. Flow of funds by source and recipient of innovation funding 2010-2019
(annualized), USD billion (Constant 2019 prices) ...................................................... 11
Figure 7. Total agricultural innovation funding in the Global South 2010, 2015 and 2019, USD
billion (Constant 2019 prices) ................................................................................... 13
Figure 8. Split by functional area 2010-2019 (annualized), USD billion (Constant 2019) prices)
................................................................................................................................... 14
Figure 9. Total government agricultural innovation funding in the Global South 2010-2019
(annualized), USD billion (Constant 2019 prices) ...................................................... 15
Figure 10. Total government agricultural innovation funding in the Global South 2010-2019,
USD billion (Constant 2019 prices) ............................................................................ 16
Figure 11. Technology related domestic agricultural innovation funding in the Global South
2010-2019, USD billion (Constant 2019 prices) ........................................................ 17
Figure 12. Agricultural innovation funding vs output value 2018, (Constant USD 2019 prices)
................................................................................................................................... 18
Figure 13. Value-chain wise split of government agricultural funding, agricultural innovation
funding, and agricultural R&D funding- USD billion (Constant 2019 prices), 2010-
2019........................................................................................................................... 18
Figure 14. Agricultural funding for countries in the Global South 2010-2019 ...................... 19
Figure 15. Total funding by Private Companies in agricultural innovation focused on the
Global South 2010-2019, USD billion (Constant 2019 prices) ................................... 21
Figure 16. Total funding by PE/VC investors in agriculture related companies based in the
Global South 2010-2019, USD billion (Constant 2019 prices) ................................... 22
Figure 17. Total funding by Development Partners in agricultural innovation in the Global
South 2010-2019, USD billion (Constant 2019 prices) .............................................. 23
Figure 18. Total funding by Development Partners in agricultural innovation focused on the
Global South 2010-2019, USD billion (Constant 2019 prices) ................................... 24

vii
Figure 19. Share of USAID’s Innovation Funding 2010-2019, USD billion (Constant 2019
prices) ........................................................................................................................ 25
Figure 20. Map of dominant area of innovation funding and financing needs ..................... 26
Figure 21. Agricultural innovation funding by the Indian government 2010-2019, USD billion
(Constant 2019 prices) .............................................................................................. 27
Figure 22. Percentage of total agricultural innovation funding by sub-layers in production
systems 2010 – 2019 (annualized), USD billion (constant 2019 prices) ................... 28
Figure 23. Total funding in agricultural innovation by Private Companies 2010-2019, USD
billion (Constant 2010 prices) ................................................................................... 29
Figure 24. Percentage of innovation funding towards provision of ecosystem services and
NRM 2010-2019, USD bn (Constant 2010 prices) ..................................................... 30
Figure 25. SAI as a share of innovation for each of the two definitions 2010-2019
(annualized), USD bn (Constant 2019 prices) ........................................................... 31
Figure 26. Percentage of overall innovation funding by stated sustainability intentions
(referring sustainability domains by Musumba et al.) 2010-2019, Percentage of total
innovation funding .................................................................................................... 32
Figure 27. Funding in innovation and SAI (broad definition) by value-chain 2010-2019, USD
billion (Constant 2019 prices) ................................................................................... 33
Figure 28. Funding in innovation and SAI (broad definition) by innovation area 2010-2019,
USD billion (Constant 2019 prices) ............................................................................ 33
Tables
Table 1. Inclusions under ‘Funding in Innovation in Agriculture’ ............................................ 5
Table 2. Examples of inclusions and exclusions for funding analysis in this study .................. 6
Table 3. Key parameters for this study .................................................................................... 8
Table 4. Funding in agricultural innovation by Global South Governments .......................... 12

viii
List of Acronyms and Abbreviations
Acronym Full Form
AGRA Alliance for Green Revolution Africa
APAARI Asia-Pacific Association of Agricultural Research Institutions
ASTI Agricultural Science and Technology Indicators
BMGF Bill & Melinda Gates Foundation
Bn Billion(s)
CAAS Chinese Academy of Agricultural Sciences
CoSAI Commission on Sustainable Agriculture Intensification
CSO Civil Society Organizations
CSR Corporate Social Responsibility
EMBRAPA Empresa Brasileira de Pesquisa Agropecuária
ESG Environmental, Social and Corporate governance
EU European Union
FAO Food and Agriculture Organization of the United Nations
FCDO UK Government Foreign, Commonwealth and Development Office
GHG Greenhouse Gas
ICAR Indian Council of Agricultural Research
IDA International Development Association
IFAD International Fund for Agricultural Development
IFPRI International Food Policy Research Institute
IWMI International Water Management Institute
KARLO Kenya Agricultural and Livestock Research Organization
KSU Kansas State University
Mn Million(s)
MNC Multinational Corporation
NARO National Agricultural Research Organizations
NGO Nongovernmental Organization
NPO Non-Profit Organization
NRM Natural Resource Management
ODA Official Development Assistance
OECD Organisation for Economic Co-operation and Development
PE/VC Private Equity / Venture Capital
PSU Public Sector Undertaking
R&D Research and Development
RKVY Rashtriya Krishi Vikas Yojana
SAI Sustainable Agricultural Intensification
SDG Sustainable Development Goals
SLU Swedish University of Agricultural Sciences
SSA Sub-Saharan Africa
USAID United States Agency for International Development
WLE CGIAR Research Program on Water, Land and Ecosystems

ix
Executive Summary
What are the patterns of funding in agricultural innovation for the Global South1? Who are the key
funders in this innovation and who are the key recipients? How does this funding split between various
topics and value chains? What proportion of these funds support Sustainable Agricultural
Intensification (SAI)? And how is SAI innovation funding split across different parts of the agriculture
sector funding and innovation canvas?
This study, carried out in 2020-21 by Dalberg Advisors Asia (relying on secondary and primary funding
data, modeling2, and expert discussions), answers some of these key questions. The study covers four
key categories of funders – (i) Global South Governments (domestic funding 3), (ii) Development
Partners4, (iii) Private Companies, and (iv) Private Equity/Venture Capital (PE/VC) funds. It studies their
funding across the last decade (2010-2019) for the Global South and seeks to achieve a baseline
understanding of these funding patterns. While private funding by farmers and other agricultural
producers can be significant, they are excluded from this report’s analysis due to the study focus and
lack of available data.
The study covers both agriculture innovation funding overall and SAI innovation funding specifically
after developing a clear approach to defining SAI for these funding calculations.
The broad definition. Funding that aims to produce both gains in productivity and improve
environmental sustainability.
The narrow definition. Funding that meets the above criteria, AND also aims to improve human
(nutrition, education) or social (e.g. equity) dimensions.
The study also highlights challenges with funding data granularity (e.g., lack of descriptions on funding
flows) and tagging of sustainable funding data that prevent a closer look at this stage. Details of the
methodology can be found here.
To our knowledge this is the first attempt to create a global baseline of funding patterns for innovation
in agriculture and SAI. This report hopes to be a starting point with analysis that serves as a useful
baseline but is expected to keep getting refined in the coming years, as reporting standards become
more robust and harmonized.
1 World Bank’s definition of the Global South which includes Asia (except for Japan, Singapore, and South Korea), Central America, South America, Mexico, Africa, and the Middle East (with the exception of Israel). 2 “Modeling” here refers to extrapolations and intrapolations of existing data across countries and years, using assumptions verified through experts and secondary research. Refer the Methodology Section at the end of the report and Detailed Methodology document for further details. 3 Coverage of government funding on agriculture includes only domestic funding within this report. 4 Includes Development Partners i.e., Bilateral and Multilateral agencies and International Philanthropies (including all major philanthropic funding recorded within the OECD.Stat. n.d. “Creditor Reporting System.” This will exclude some domestic philanthropies within Global South nations).

x
The state of funding in agricultural innovation for the Global South
Note: All values in this report are in USD (constant 2019 prices and constant 2019 exchange rates)
Across various funding sources5, ~USD 60 billion (range USD 50-70 billion) per year goes towards
agricultural innovation in the Global South; a large fraction of this comes from government funding,
increasing by ~5% per year over the last decade (2010-2019). Given the total size and importance of
agriculture within the Global South economy, this is not high by any means – the total funding is less
than 4.5% of the total Global South agricultural output and less than USD 20 per person per year in
these geographies. Of the four main sources of funding in agricultural innovation, governments are
the major contributors (60-70%). The Chinese government is one of the biggest investors in agriculture
and innovation within the Global South (funding ~USD 20-25 billion annually on agricultural
innovation) and constitutes half of the government innovation funding pool globally. The second
biggest source of innovation funding is private corporations (20-25%), most of which is on research
and development and marketing of new products developed in the areas of farm mechanization, crop
protection and seed development and biotechnology (mainly for plant breeding). Development
Partners (institutional investors, bilateral and multilateral agencies, and international philanthropies)
contribute to the rest of the innovation funding (10-20%).
Overall innovation funding has been increasing, but the rate of growth has slowed down in the
second half of the last decade. Innovation funding grew ~3% annually in the second half of 2010-
2019, compared with 7% p.a. in the first half of the decade. The slow growth has been due to the
largest investors – private corporations and governments – slowing down the rate at which they are
increasing their funding for agriculture innovation. Development Partners have seen an overall decline
in funding for agricultural innovation in the last decade.
About 30-40% of this innovation funding is focused on traditional science & technology or product
development; the rest is focused on general institutional, infrastructural, extension and marketing
activities that enable adoption of new technologies and agricultural practices. Global South
Governments funnel ~30% of their agriculture innovation money into science & technology related
activities. The majority (~70%) goes towards marketing, extension services, and developing
infrastructure that enables the adoption of new technologies or promotes new agricultural practices
amongst agricultural communities. This is understandable since in most cases, adoption requires a
significant last-mile push, involving hundreds of thousands of agriculture workers. Private
corporations on the other hand, spend ~50% of their innovation funding on traditional science &
technology, and the remaining 50% on the marketing of new products. From a value chain lens, more
than 50% of the innovation funding targets crops, while ~20% of the funding goes towards livestock.
About 20% of the funding is cross-cutting i.e., funding to generally improve the agricultural sector
without targeting specific value-chains, e.g., funding in water conservation, generic farmer
engagement platforms, etc.
In terms of recipient categories, most innovation funding goes to government agencies and private
companies, with public universities and research institutes receiving a third of this innovation
funding. Since governments fund a majority of innovation in the sector, and half of this goes towards
promoting the adoption of innovations, it is not surprising that 50% of agricultural innovation funding
5 We base our analysis across four funding sources: (i) Global South governments (domestic spends), (ii) Private Companies, (iii) Development Partners (bilateral and multilateral agencies, international philanthropies), and (iv) Institutional Investors.

xi
is received by various government agencies including government ministries, state-level departments
of agriculture and rural development, and other government-run entities that operate on the ground.
The remaining science & technology funding goes towards universities and research institutes that are
mostly government run and funded. The second largest recipient of innovation money are private
companies that use it for research and development (R&D) as well as use part of their marketing
budgets for driving adoption of new technologies and products.
From a systems lens, agricultural production system activities receive more than 60-70% of all
innovation funding with macro-systems (policy, knowledge, trade, finance) and natural resource
management and ecosystem services (land, water, soil protection) receiving between 10-15% each.
Innovation on agricultural inputs and new agricultural production processes are significantly funded
(likely receiving 25-30% of innovation funding each). Funding for macro-systems that support
innovation such as new policies, new financing systems, and new collaborative systems is significantly
lesser (~10-15%). Similarly, innovations focused on ecosystem services attract only a small portion of
overall funding (~10-15%).
State of funding targeting innovation in Sustainable Agricultural Intensification
Note: If not mentioned otherwise, values on SAI funding have been stated using the ‘Broad’ definition (page ix).
Currently, less than 7% of all funding in agricultural innovation is clearly identifiable as being
targeted towards SAI from the data; private corporations and Development Partners spend a slightly
higher proportion of their innovation funding on SAI activity. It is possible that the overall proportion
of innovation funding towards SAI could be marginally higher, but the lack of granular reporting
standards limits our understanding. Based on the information available and our analysis of stated
intentions, private corporations and Development Partners appear to spend a higher percentage of
their innovation money on SAI (~9-10%). This is likely due to strong incentives for these groups (in
particular, large corporations) to state sustainability intentions within their annual reports and media
engagement that have advantages around brand perception. Based on the Indian government’s data,
this share is likely lower for governments (~6%) as they likely do not spell out the intention of
sustainability as much as multilateral organizations or private companies.
In absolute terms, governments drive a majority of agricultural innovation funding, and
subsequently drive the most funding for innovation in SAI; the upper-bound for this is likely to be
USD 2-3 billion annually. Government agricultural innovation funding is not very granular for most
countries and using a detailed analysis of India’s data, the study estimates that no more than 6-7% of
the total public innovation funding globally is towards SAI. Using a narrow definition for SAI, this
number would likely halve.
Private companies may contribute ~USD 2-3 billion a year towards innovation in SAI6,with ~9% of
their innovation funds having clearly stated SAI objectives7 ; PE/VC funding in startups are a small
but growing proportion of the total funding for SAI. Large agri-businesses that fund a significant
portion of private sector innovation tend to emphasize sustainability intentions. Research in seed
development and biotechnology constitutes about half of these SAI spends – with stated intentions
6 Considering the broad SAI definition. 7 The study looks at innovation funding targeted towards the Global South. This includes funding made in the Global North but intended to impact the Global South. The geographical separation has been estimated using sales values as proxies where data was not available.

xii
focusing on productivity improvements as well as environmental or nutritional improvements.
Funding in startups by PE/VC funders contributes 2% of the overall funding in SAI innovation but is
growing rapidly at nearly 50% p.a. in the past 3-4 years and could drive substantial improvements in
sustainability.
Development Partners (bilateral/multilateral agencies, philanthropies) contribute ~USD 500 million
per year to SAI innovation. A large fraction of this is driven by bilateral and multilateral funding that,
in many cases, states intentions of sustainability while funding research or agricultural programs in
Global South nations. Donor funding is particularly important in low-income and some mid-income
countries in Sub-Saharan Africa and Asia.
Gaps and opportunities in financing SAI
There is an urgent need to align on a common definition of SAI and publish high-quality and granular
funding data to track progress towards SAI innovation. The current reporting of agricultural funding
data across all funding sources (except some donors and international philanthropies) is very poor in
terms of quality and granularity. Further, to track progress on SAI innovation, a common view and
definition of sustainability is key. This creates an opportunity for international organizations to work
and rally behind a common framework to classify agriculture funding and funder intentions on
different dimensions of sustainability. CoSAI has established a taskforce on Principles and Metrics to
develop and agree on a set of principles and metrics to guide and track innovation in SAI.
While assessing sustainability impact was beyond the scope of this study, initial assessments point
towards a need for private companies and institutional funders to, at the minimum, be more
intentional in their approach to innovation for SAI. Though most large agribusinesses state intentions
around sustainability, there is limited understanding and independent public information on the
impact of these programs, funding, and technologies. Sustainability goals for most companies remain
focused on their internal business operations and perhaps their CSR teams: these goals need to rapidly
expand to move from Corporate Social Responsibility (CSR) to Environment, Social and Governance
(ESG) – i.e., to cover core business activities including R&D, as well as marketing8.
Development Partners internally already have their funding aligned with specific sustainability goals
but need to do more and set reporting standards within the entire industry. 8-10% of donor and
philanthropic innovation spends are towards SAI based on publicly available information (on the
OECD.Stat database9). Most of these institutions have sustainability goals internally and make sure
that their projects are environmentally and socially sustainable. However, even within the
Development Partners, there is a lack of alignment around definitions of sustainability and
corresponding tagging up of funding. Development funders should improve reporting on SAI within
their organizations and also set the standard for all categories of funders by being the early adopter
of standardized SAI frameworks and metrics while publishing data on funding, disbursements, and
funding transparently.
PE/VC funders are largely focused on China and India; there is an opportunity to enable greater
funding for agricultural startups in other Global South countries. Nearly 90% of PE/VC funding in
agricultural startups, including startups driving SAI outcomes, are in China and India. While this is
8 Charity Heller, “From CSR to ESG: How to Kickstart Your ESG Program in 2021”, 2021 9 OECD.Stat. n.d. “Creditor Reporting System.” https://stats.oecd.org/Index.aspx?DataSetCode=crs1.

xiii
understandable, given the scale of operations in these countries and a developed funder network, this
asymmetry creates an opportunity to transfer knowledge and funds to other countries. This type of
knowledge transfer for countries where these networks are underdeveloped can help drive SAI
innovation.
This study contributes to understanding current patterns of funding in innovation in agriculture for
the Global South, and how much of this promotes SAI. This is the first such attempt to our
knowledge. Going forward, funders, led by Development Partners should seek to adopt shared
reporting standards and metrics for SAI and fund more research to build upon this baseline study.


1
1. Context and Key Objectives of this Report
The opening chapter sets up the context for this study, describes the need to increase agricultural
production sustainably, and the need to develop a comprehensive understanding of global funding
patterns for sustainable agricultural innovation (SAI) in the Global South. This chapter also clearly
outlines the scope of the study, definitions of sustainability used within the study, and the key
geographical, chronological, and definitional boundaries that have formed the basis of the analysis in
this report.
1.1 Context
Our world in 2050 will have 10 billion people10 (See Figure 1 below). The challenge of adequately
feeding these 10 billion with nutritious food while protecting and restoring the natural environment
and tackling climate change, as well as ensuring equitable socio-economic outcomes is perhaps the
biggest development challenge facing us.
Figure 1. Total Global Population Global, 2001-2050, billions.
Source: Ranganathan et al.11; World Resource Institute12; United Nations “World Population Prospects”13
Growth in food production using current methods is socially, economically, and environmentally
unsustainable. Agriculture contributes significantly to GHG emissions, accounting for up to ~45% of
methane (CH4) emissions14 and ~60% of nitrous oxide (N2O) emissions15 and increases in agriculture
10 United Nations. 2015. “World Population Prospects.” https://population.un.org/wpp/Publications/Files/Key_Findings_WPP_2015.pdf 11 Ranganathan, Janet, Richard Waite, Tim Searchinger, and Craig Hanson. 2018. “How to Sustainably Feed 10 Billion People by 2050, in 21 Charts.” Accessed June 28, 2021. https://www.wri.org/insights/how-sustainably-feed-10-billion-people-2050-21-charts. 12 United Nations. 2015. “World Population Prospects.” https://population.un.org/wpp/Publications/Files/Key_Findings_WPP_2015.pdf 13 WRI. 2019. “Creating a Sustainable Food Future.” https://files.wri.org/d8/s3fs-public/wrr-food-full-report.pdf. 14 Smith, Kevin. 2005. “The Impact of Agriculture and Other Land Uses on Emissions of Methane and Nitrous and Nitric Oxides” 2 (2–3): 101–8. 15 Smith, Kevin. 2017. “Changing Views of Nitrous Oxide Emissions from Agricultural Soil: Key Controlling Processes and Assessment at Different Spatial Scales” 68 (2): 137–55. https://doi.org/10.1111/ejss.12409.

2
production using current methods will create a 11-gigaton Greenhouse Gas (GHG) mitigation gap16
between expected agricultural emissions in 2050 and the target level needed to hold global warming
below 2oC. Similarly, globally, use of water for agriculture accounts for ~70% of total freshwater usage
and if food production continues to increase using current irrigation methods, several countries, such
as India, will face a severe water crisis. In a business-as-usual approach global agricultural land will
need to increase by 593 million hectares17 (an area twice the size of India) to meet the global food
production goal in 2050, and this will lead to significant biodiversity and human well-being
externalities. Furthermore, soil erosion could lead to a loss of ~USD 400 billion per year globally18 and
the continued use of certain types of chemical fertilizers and pesticides, could exacerbate risks for
human health. Apart from building climate resilience, the global food system also needs to optimize
for improved nutrition and health outcomes while taking care that agricultural livelihoods are
protected, improved, and inclusive.
The Global South, in 2050, will account for a majority of the global population and will face the
burden of feeding its population while battling with severe constraints on arable land, high GHG
emission loads, and freshwater constraints. Population in countries in the Global South is expected
to grow by ~31% by 2050 and will comprise ~86% of the global population19. Food demand will be
compounded due to increasing affluence and countries such as China, India, and Brazil will have
limited arable land to meet their food security targets. For instance, China will face the daunting task
of feeding 22% of the world population with 7% of the world’s arable land20. India will need to feed
20-25% of the world’s population with only 4% of the world’s freshwater resources. Additionally,
adequate livelihoods will need to be found for millions living in rural areas who will face shrinking land
sizes and incomes. Significant innovation in SAI will be, thus, critically necessary for these countries to
meet food demand while preventing environmental and socio-economic disasters.
A thorough understanding of innovation funding trends in agricultural systems is critical to guide
future funding decisions and help in the sustainable achievement of 2050 food goals; however,
funding data is scattered, definitions of sustainability and innovation are not consistently applied
by different actors, and consequently, a global view of these funding patterns is missing. While many
stakeholders within the agricultural innovation system align on the need to switch to sustainable
agricultural practices and on the need for increased funding in this space, further effort is stymied due
to a poor understanding of the current funding patterns for innovation. Data is fragmented, does not
always progress along a common frame of understanding, and consequently, private, public, and
philanthropic actors might be underfunding in SAI-trading off sustainability in the future for short-
medium term gains in agriculture productivity using unsustainable methods. Further, even well-
intentioned stakeholders and investors might be underfunding in SAI innovation or might have a
misplaced assessment of sectors and themes that need more funding.
16 Ranganathan, Janet, Richard Waite, Tim Searchinger, and Craig Hanson. 2018. “How to Sustainably Feed 10 Billion People by 2050, in 21 Charts.” Accessed June 28, 2021. https://www.wri.org/insights/how-sustainably-feed-10-billion-people-2050-21-charts. 17 Ibid 18 Esrawan, H., R. Lal, and F. Reich. 2001. “Land Degradation: An Overview.” https://www.nrcs.usda.gov/wps/portal/nrcs/detail/soils/use/?cid=nrcs142p2_054028. 19 World Bank. n.d. “World Development Indicators.” https://databank.worldbank.org/source/world-development-indicators. 20 Economist “With rising population and declining arable land, China may be staring at a major food crisis” 2020

3
Against this backdrop, CoSAI, commissioned Dalberg Advisors in Asia to conduct a baseline
estimation of SAI innovation funding intended for the Global South. This report outlines key findings
from a broad landscape assessment carried out by Dalberg covering funding into different categories
of SAI innovation activity, globally, by the public sector, private sector, philanthropic and development
donors, as well as venture capitalists and private equity players.
1.2 Objectives of this study
This study seeks to assess a) the total funding being made annually into agricultural innovation by
public, private sector, philanthropic, and development actors, b) the total funding being made in SAI
innovation (a subset of innovation), c) the split of this funding by various cuts (regional, value chains,
categories of innovation).
The authors hope that the study serves as a baseline but also think that there is an opportunity for
future versions to revise these numbers based on new data that becomes available. Another point to
highlight at the outset is that the report defines SAI in a specific way, to ensure that results don’t get
misinterpreted by others with different definitions for SAI.
Structure of the report
The report is organized into four chapters covering the following:
Chapter 1. Context and Key Objectives of this Report
Chapter 2. State of Funding in Agricultural Innovation for the Global South
Chapter 3. State of Funding targeting Innovation in Sustainable Agricultural Intensification
Chapter 4. Gaps and Opportunities in Funding in Innovation and SAI
1.3 Research and analytical approach
The study covers the four key categories of funders for agricultural innovation globally – (i) Global
South governments (domestic spends21), (ii) Development Partners22, (iii) Private Companies, and (iv)
PE/VC investors. Data was collected from industry reports, annual reports of companies, government
budget and funding documents, third party funding data sources such as Tracxn, Statista, OECD.Stat,
BMGF grants database, through expert conversations, and credible media reports. Key findings and
values arriving through the estimations have been validated, where possible, through experts across
each of the funder categories. Details of the methodology can be found here.
In several places, the study highlights ranges and assumptions to indicate uncertainty of the analysis
based on the quality and granularity of funding data available. For several questions, funding data
lacked comprehensiveness or granularity (See Figure 2 below) and the models developed for this study
use reasonable extrapolations and intrapolations to compute funding values in these cases. Some
assumptions have been used to classify funding into SAI (refer to the methodology here).
21 Coverage of government spends on agriculture includes only domestic spends within this report. 22 Includes Development partners i.e., Bilateral and Multilateral agencies and International Philanthropies (including all major philanthropic funding recorded within the OECD.Stat. n.d. “Creditor Reporting System.” This will exclude some domestic philanthropies within Global South nations).

4
Figure 2. Data availability and granularity across funding sources.
Definitions used for the analysis
Agriculture value chains, SAI, innovation funding, and even the Global South are constructs
interpreted differently by different organizations. This study has adopted a consistent definition to
enable comparisons and engagement on the outputs of the analysis. These definitions are listed
below.
A. What is considered as the Global South?
The term Global South as used in this report follows the World Bank definition which includes
countries and territories in Asia (except for Japan, Singapore, and South Korea), Central America,
South America, Mexico, Africa, and the Middle East (except for Israel).
Further, this study looks at funding targeted “for” the Global South. This means that it considers
innovations aimed at innovations that specifically impact Global South nations. However, for two
funding sources i.e., governments and PE/VC investors; this study looks at funding “in” the Global
South nations, since based on expert interviews, this seems a suitable proxy for funding for the Global
South. For example, most funding for agricultural research in Kenya is focused on Kenya or other
Global South nations.
B. What is considered funding in innovation?
Funding in ‘innovation’, as used in the study, include all funding related to the creation or adoption
of new agricultural technologies, practices, and systems targeted towards the Global South. In
addition to purely technological innovation, the study includes funding in non-technological areas

5
such as business models, policy reforms, agricultural extension and training, process innovations, and
marketing funding on innovative technologies. This expanded definition allows the study to count new
business models, startup funding on e-commerce platforms that promote access to agriculture inputs,
and other similar examples–all important funding in agricultural innovation. On the other hand, pure
subsidies to purchase existing products and services in agriculture, or routine administration costs are
not counted as innovation funding.
This definition results in the following inclusions under ‘Funding in Innovation in Agriculture” (See
Table 1 below).
Table 1. Inclusions under ‘Funding in Innovation in Agriculture’.
Funding type Proportion
considered
Example of inclusions
1 Research and Development 100% Research and product development
funding to develop a new seed variety
2 Extension/Marketing
% Depending on
funding description
Programs training farmers on using new
agroforestry practices; Marketing spends
for a new hybrid seed
3 Institutional/Infrastructure Management and maintenance of
research institutions; Operations of
programs to modernize slaughterhouses
4 Policy Reform Funding in implementation or adoption
of agricultural policies e.g., reform of
fertilizer subsidies
5 Process/Business Model Changes PE/VC funding for startups developing
digital marketplaces for purchase and
sale of agricultural produce
Percentage values for non-R&D spends have been taken on a project/funding level on a case-by-case
basis to account for funding that is judged to support adoption of innovative agricultural practices (See
Methodology). General infrastructure funding such as rural roads has not been included. The full
databases and percentages used is open for inspection in the methodology, here..
C. What is considered funding in agriculture?
The study includes all funding linked to on-farm food value-chain activities and any off-farm processes
essential to the production of a consumable food product. Since the goal of the study is to understand
the Global South’s preparedness for a sustainable food secure future, the analysis is limited to funding
in food and excludes funding in cash crops, innovations for food retail including restaurants, and
innovation funding in non-essential value-added categories such as milk flavoring, manufacturing of
potato chips.
Table 2 below illustrates these inclusions and exclusions.

6
Table 2. Examples of inclusions and exclusions for funding analysis in this study.
Included Innovations related to milk pasteurization; flour mills, sugar mills, any on-farm
production, urban farming/vertical farming
Excluded Innovations in cotton and cannabis production and other industrial crops other
industrial crops such as rubber, paper, wood etc.; milk flavouring technologies, cheese
packaging technology; e-commerce platforms for grocery purchase; restaurant tech
D. How is Sustainable Agricultural Intensification defined for this study?
Sustainable Agriculture Intensification (SAI) is a multi-dimensional construct with different actors
adopting different definitions23. This study uses five agriculture sustainability domains – economic,
social, environmental, human condition, and productivity – and uses the stated intention for the
funding to assess whether it gets classified as SAI in the analysis.
The study uses a “narrow” and a “broad” definition of SAI (See Figure 3 below) – based on
combinations of the five sustainability outcomes, used in the Sustainability Intensification Assessment
Framework by Musumba et al., 2017 24 (through the Feed the Future Sustainable Intensification
Innovation Lab; web version of the framework: https://sitoolkit.com/) that the funding aims to
achieve. This framework was used since it allowed the team to analyze funder intentions (See Figure
4 below) with variable quality data across multiple funders, while providing the flexibility to consider
various definitions of SAI. The team had additionally planned to use the Gliessman agroecology
framework (Dalberg Asia 2020, Inception Report) but this was not possible due to the poor quality of
data available25. The broad and narrow definitions were developed by the study team in discussions
with experts and funders.
23 Garnett, T., M. C. Appleby, A. Balmford, I. J. Bateman, T. G. Benton, P. Bloomer, B. Burlingame, et al. 2013. “Sustainable Intensification in Agriculture: Premises and Policies.” Science 341 (6141): 33–34. https://doi.org/10.1126/science.1234485.; Mockshell, Jonathan, and Josey Kamanda. 2018. “Beyond the Agroecological and Sustainable Agricultural Intensification Debate: Is Blended Sustainability the Way Forward?” International Journal of Agricultural Sustainability 16 (2): 127–49. https://doi.org/10.1080/14735903.2018.1448047;Pretty, Jules N. 1997. “The Sustainable Intensification of Agriculture: Making the Most of the Land.” Natural Resources Forum 21 (4): 247–56; Rockström, Johan, John Williams, Gretchen Daily, Andrew Noble, Nathanial Matthews, Line Gordon, Hanna Wetterstrand, et al. 2017. “Sustainable Intensification of Agriculture for Human Prosperity and Global Sustainability.” Ambio 46 (1): 4–17. https://doi.org/10.1007/s13280-016-0793-6. 24 Musumba, Mark, Philip Grabowski, Cheryl Palm, and Snapp Sieglinde. 2017. “Guide for the Sustainable Intensification Assessment Framework.” USAID, Kansas State University. https://www.k-state.edu/siil/documents/docs_siframework/Guide%20for%20SI%20Assessment%20Framework%20-%2010.24.17.pdf 25 Other studies using the Gliessman framework (Gliessman, S. R. 2015. Agroecology: The Ecology of Sustainable Food Systems, Third Edit. Taylor & Francis, Boca Raton.) have taken deep dives into datasets from some funders. In particular: (Biovision. 2020. “Money Flows Report: What Is Holding Back Investment in Agroecological Research for Africa?” http://www.ipes- food.org/_img/upload/files/Money%20Flows_Full%20report.pdf) covers funding by the Swiss Development Corporation, Gates Foundation, and Kenya Government R&D.

7
The broad definition. Funding that aims to produce both gains in productivity and improve
environmental sustainability.
The narrow definition. Funding that meets the above criteria, and also aim to improve human
(nutrition, education) or social (equity) dimensions.
Figure 3. Broad and narrow definitions of SAI based on stated intentions of sustainability
Figure 4. Examples of stated intentions considered under each sustainability domain.
Also, the study focuses on stated intentions (in terms of sustainability outcomes) and not the achieved
outcomes to classify funding as being for SAI. This has been done for reasons of necessity: data is not
available on outcomes and impacts for most of the funding this study covers. However, intention can
be used an indicator to assess both the past and future funding in SAI. Stated intentions is also a good
proxy for funding aimed at SAI, since investors that clearly state sustainability intentions are more
likely to consider the overall impact of their innovations on the environment, society, and human
condition.
Note: Unless stated otherwise, this study reports funding targeted towards SAI using the broad
definition.
A summary of parameters used, is presented in Table 3 below:

8
Table 3. Key parameters for this study.
Parameter Description
1 Geography The Global South which includes countries and territories in Asia (with the exception of
Japan, Singapore, and South Korea), Central America, South America, Mexico, Africa,
and the Middle East (with the exception of Israel). This is based on the World Bank
definition of the Global South.
2 Time period 2010-2019
3 Industry Any food related agricultural and core food processing activity
4 SAI assessment Two combinations based on sustainability tagging of funding around 5 domains (refer
figure above)
5 Financial
measurement
Funding data has been taken across all funding sources which includes funding and
fund disbursement data wherever available and budget data where these are not
available.
Limitations of the study
Data on agriculture innovation funding, especially SAI innovation, for public-private-philanthropic
sectors put together is not available or easily accessible, especially with a global frame of analysis.
Only very few countries or organizations report this data with sufficient granularity. This report has
used a large range of credible data sets, expert discussions, and modeling26 to develop answers to the
questions outlined above and has a detailed methodology. Some key limitations of the data and the
methodology include:
1. The funding values in this study should be considered reasonably robust estimates but not
precise funding numbers. Future studies could continue to improve these estimates as and
when new data gets published.
2. Due to limited data availability, findings in this report exclude some funder categories. The
Development Partners category also excludes development funding not captured by the
OECD.Stat database – public research funding provided by the Global North that is not
counted as Official Development Assistance (ODA) and some philanthropic and multilateral
funders that may not report details of their projects within the Organization for Economic Co-
operation and Development (OECD) Creditor Reporting System. Self-funding by farmers and
producers is excluded due to the study methodology overall.
3. Funding is included in our analysis based on “stated sustainability intention” and not the
finally achieved “sustainability outcomes”. Outcome data is very rarely available and generally
of poor quality. This is an important limitation of the study. In many cases it seems likely that
stated intentions may overstate the final outcome, the estimates of ‘funding to SAI’ may be
too high. However, intentions may be under-reported in some cases (such as many national
Global South governments). More importantly, funding in productivity (alone) may have a
beneficial effect on social, human and environmental outcomes, even in the absence of
specific intentions. This methodology may also lead to over-or under-estimating SAI
outcomes. It is likely to over-estimate SAI outcomes in many cases, not only because of
26 “Modeling” here refers to extrapolations and interpolations of existing data across countries and years, using assumptions verified through experts and secondary research. Refer the methodology section at the end of the report and Detailed Methodology document for further details.

9
‘greenwashing’27 but because of the inherently risky and long-term nature of research and
innovation (i.e., intended results may take a long time and many attempts to achieve). On the
other hand, the methodology may frequently under-estimate SAI outcomes, in particular
when increased productivity itself has positive effects on other SAI outcomes such as poverty,
nutrition or the environment.
4. While identifying funding as SAI or not, the data did not allow the team to distinguish between
different degrees of sustainability, or between ‘incremental’ and ‘transformative’ innovation.
For example, a piece of research on precision application of pesticides (to reduce the quantity
applied) would be identified as “environmentally sustainable”, i.e., the same as an
agroecological investment. This is a limitation of this study which can only be fixed by agreeing
definitions and improving reporting standards.
5. The study relies on project or program funding descriptions to identify SAI domains. Hence,
SAI values in this report are likely an underestimate in all cases, due to inadequate
descriptions. If better descriptions around projects were available, overall funding aimed at
innovation in SAI might be higher.
6. Since many of the specific analyses in this report are, to the best of our knowledge, being
carried out for the first time, our model includes a number of assumptions and extrapolations
based on the best information we could obtain, including expert opinion. Assumptions,
multipliers and sources are fully listed in the methodology.
7. Finally, our analysis measures “external funding” into innovation and not cash or labour
investments made by farmers or other direct value chain actors in their own enterprises, since
the objective is to influence this external funding.
The values reported in this study may differ from other analyses due to some of the following reasons:
a) Expansive definition of innovation that goes significantly beyond R&D. The definition of
innovation in this study is broad and includes funding in non-R&D related innovation such as
programmatic and institutional spends that contribute to adoption of new practices and
technologies. The specific items selected for inclusion may also differ from other studies.
b) Data sources and extrapolations used. The study took an ’80-20’ approach and
extrapolated global funding from the sum of the largest funders especially for public and
private sector funding. Detailed data was not obtained for any but the largest private
investors and countries.
c) Values standardized to 2019 prices and USD exchange rates. All values in this study use
constant 2019 prices as well as constant 2019 USD exchange rates. Hence, adjustments will
need to be made while comparing values with studies that report funding values in different
units.
d) Different geographic scope. This study focuses on the Global South as defined in Table 3.
The definition in this study includes some Oceania countries (low-income island nations),
Caribbean nations and South Africa, which are excluded in some other studies that cover the
Global South.
27 ‘Greenwashing’ refers to over-claiming intentions or potential effects on environmental sustainability.

10
2. State of Funding in Agricultural Innovation for the
Global South
This chapter analyses funding in agricultural innovation in the Global South and addresses two key issues. It
examines existing patterns of funding in agricultural innovation for the Global South, and the allocation of
these funds across value-chains, geographical regions, funding sources, implementing agencies, and sub-
sectors within agriculture. The chapter begins with a macro-view of innovation spends and then,
subsequently provides funding breakdowns for each of the four major funding sources – (i) Global South
governments (domestic spends 28 ) (ii) Private Companies (iii) Development Partners 29 , and (iv) Private
Equity/Venture Capital (PE/VC) funds. Finally, the chapter describes how this funding for innovation is spread
across different components of the agriculture sector innovation canvas.
2.1 Trends in overall agriculture innovation funding in the Global South
The annual funding on agricultural innovation in the Global South between 2010-2019 has been ~USD 60
billion (range USD 50-70 billion), representing less than 4.5% of agricultural output value30 in the Global
South. As shown in Figure 5 below, this is dominated by government funding on innovation (60-70% of the
total), private sector players (20-25%), Development Partners (10-20%), and institutional funders such as PE
and VC funds coming in last (~2%). This amounts to about 4.5% of the total value of agricultural production
in the Global South. This innovation funding intensity compares poorly to the energy sector that tends to
spend close to 6% of the sector revenue value on innovation with ~3%31 going towards scientific research,
technical support, and patent costs alone. However, over the last decade, agricultural innovation funding as
a percentage of overall agricultural funding has gone up. What is specifically noteworthy, is a slow rate of
growth in the second half of the last decade where innovations grew ~2% per annum as compared with 7%
in the first half of the decade.
Interestingly, governments such as Brazil and India have been increasing their innovation funding at a higher
rate than China, where most increases in agricultural funding has been towards large infrastructure projects
that are not counted as innovation in this study. Increases in private sector funding has been led by
agricultural chemical and farm mechanization companies. While funding by companies in precision
agriculture saw the highest increase over the last 10 years (>25% growth per year), this is still a small
proportion of the overall funding by private companies.
Despite these increases, significantly more needs to be invested and done in order to enable a transition to
sustainable agriculture similar to what has been achieved in sustainable energy.
28 Coverage of government spends on agriculture includes only domestic spends within this report. 29 Includes Development partners i.e., Bilateral and Multilateral agencies and International Philanthropies (including all major philanthropic funding recorded within the OECD.Stat. n.d. “Creditor Reporting System.” This will exclude some domestic philanthropies within Global South nations). 30 Total agricultural output sourced from FAO.Stat datasets on agricultural value-added (constant USD). 4% includes R&D funding and fundings in adoption of new agricultural technologies and practices. 31 Craft. n.d. “What Industry Spends the Most on Research and Development?” https://craft.co/reports/s-p-100-r-d.

11
Figure 5. Average annual agricultural innovation funding in the Global South 2010-2019, USD billion (Constant 2019 prices).
Source: Dalberg Analysis
Most agriculture innovation funding goes to recipient government agencies (~50%) and private companies
(~30%); Universities and research institutes (at 16%) and Non-Governmental Organizations (NGOs)/civil
society organizations (CSOs) account for the remaining (See Figure 6). There are clear patterns in funder-
recipient pairs for agricultural innovation funding. Governments end up funding a large fraction of their
innovation funds in public programs on agriculture innovation. Similarly, private companies as investors,
channel most of their innovation funding back into the private sector (largely R&D activities, and marketing/
promoting uptake of innovations) with a tiny fraction being directed towards universities and public research
institutes. For instance, in countries such as Brazil and China, experts say that increasingly larger
agribusinesses have provided funding to the federal research agencies. For example, in Brazil, Bayer and
Syngenta have both collaborated with federal research agency (EMBRAPA) and other public research
institutes for their R&D activities (Refer case study on Brazil, here32). As recipients, universities and research
institutes receive innovation funding mainly for basic research and product development. Funding by PE/VC
firms in agriculture startups are growing but continue to remain a very small segment within the Global
South.
Figure 6. Flow of funds by source and recipient of innovation funding 2010-2019 (annualized), USD billion (Constant 2019 prices).
Source: Dalberg Analysis
32 The Annexure for this report has been published separately, which includes the list of experts consulted as well as eight detailed case studies

12
Over the last decade, funding in agricultural innovation has been slowly increasing. The first half of the
decade between 2010-2015 saw substantial growth in innovation funding averaging ~7% per annum, driven
primarily by increases in government as well as private sector funding. This growth continued in the second
half of the decade 2015-2019, but at a slower pace. The lower rate of growth (2% annually) is most noticeable
in large companies focused on sectors such as farm mechanization, seeds development, and biotech such as
Bayer, Syngenta, and John Deere. While this study has not analyzed reasons behind this fall, restrictive
regulatory environments, political instability, and a weak global economy could be some of the likely reasons
for falling R&D intensity ratios amongst these companies33.
A. The split of innovation funding by funding sources
Governments account for ~70% of the total innovation funding, private sector for about 20%; the
remaining ~10% is funded by institutional investors and Development Partners. A huge share of funding in
agricultural innovation is coming from governments across the Global South, dominated primarily by China.
Private companies, particularly large agribusiness corporations are the next biggest funders of agricultural
innovation cumulating to between the 15-20% of total innovation. Within the private sector, startups funded
by PE and VC investors account for between 4-5% of the agriculture innovation funding. However, since
these innovations can be quite disruptive, even small amounts of funding can lead to larger transformations
within the sector. Bilateral and multilateral funders contribute to ~7% and this is led by funders from the
USA and select European countries. While multilateral agencies such as The World Bank (largely through the
International Development Association (IDA) and International Fund for Agricultural Development (IFAD),
see case study here, are also important contributors, a large fraction of their funding takes the form of loans
and actual investment amounts34 remain low compared with other bilateral agencies that tend to focus on
grants. Finally, international philanthropies35 form ~1% of the total funding to agricultural innovation and
this is led by the Bill and Melinda Gates Foundation (BMGF) that accounts for ~70% of this category.
Public funding in agriculture innovation is dominated by China, India, and Brazil, with these three
governments accounting for nearly 40% of overall agricultural innovation funding in the Global South (See
Table 4 below). China accounts for a major fraction of the public sector agriculture innovation funding in the
Global South (~50%) with Brazil and India together contributing another 10-12%. Public sector funding tends
to focus on research & development as well as long-term institutional funding. Global South governments
also receive ~40-50% of funding from bilateral and multilateral agencies that tend to focus on funding
research institutes, agricultural programs, and policy initiatives.
Table 4. Funding in agricultural innovation by Global South Governments.
Governments Total Funding in
Agricultural Innovation
(USD bn)
% Of total govt. funding in
agricultural innovation
% Of total funding in
agricultural innovation
China 20 (15-25) 48% 33%
India 3 (2.5-3.5) 7% 5%
Brazil 2 (1.5-2.5) 5% 3%
Rest of Global South 17 (15-20) 40% 28%
Source: Dalberg Analysis
33 BCG, “Reviving Agricultural Innovation in Seeds and Crop Protection”, 2020 34 Actual funding amount for development agencies providing loan was calculated based on the differential interest value = (Average interest rate for the country – concessional interest rate offered) * (principal amount of loan) 35 International Philanthropies include all major philanthropic funding recorded within the OECD.Stat database. This will exclude some domestic philanthropies within Global South nations.

13
B. The split of innovation funding by agriculture value chains
Crops receive more than half of the funding in agriculture innovation; livestock and fisheries receive
limited funding, but this share is likely to grow. 50-60% of the overall innovation funding goes towards
crops, with fisheries, aquaculture, and livestock accounting for less than 20% (See Figure 7 below). Cross-
cutting activities such as new practices or technologies focused on watershed management, biodiversity and
forests management, water conservation, and agricultural reform also receive approximately 20% of the
total innovation funding. While this funding is loosely related to some value-chains, they are not directly
focused on any single value chain and hence, are categorized as “cross-cutting”. Crops account nearly 80-
90% of the cumulative innovation funding made by private sector and startups largely due to innovation
programs at large seeds, pesticides, and fertilizer companies such as Bayer Crop Science, ChemChina
Syngenta, and John Deere (farm equipment for crops) that invest significantly on both R&D and marketing
of innovations.
Overall, the innovation funding on crops is higher than its proportionate contribution to the overall output
value, perhaps because agribusinesses and governments focus on the large market potential for crops.
However, innovation funding for both fisheries and livestock are expected to increase significantly in the
future both due to the high commercial value for these categories. A higher focus on sustainability will be
important given the high environmental footprints especially for livestock. This increase in funding for
fisheries and livestock is witness in PE/VC funding patterns where livestock/fisheries used to receive ~1% of
this funding in 2010, but this has now increased to close to 10% of the overall PE/VC funding in agriculture.
Figure 7. Total agricultural innovation funding in the Global South 2010, 2015 and 2019, USD billion (Constant 2019 prices).
Source: Dalberg Analysis
While funding in alternate protein still forms a small fraction of overall funding in agricultural innovation,
even while considering only PE/VC funding, this is a growing space of interest and if successful models and
products emerge, can result in innovation funding from livestock and fisheries getting redirected to this
space. Analysis by GFI of PitchBook data shows that PE/VC funding in alternate proteins has increased from
~USD 1 million in 2018 to nearly USD 60 million in 202036, with a large part of this growth being driven by
funding in China.
36 GFI analysis of PitchBook data

14
C. The split of innovation funding across functional activities
Figure 8. Split by functional area 2010-2019 (annualized), USD billion (Constant 2019) prices).
Research & Development (~33%), Marketing/Extension/Behaviour change (37%), and
Institutional/Infrastructure projects (25%) are the three functional categories accounting for nearly all the
agriculture innovation funding.
Out of the overall ~USD 60 billion funded on agriculture innovation per year, research and development as
traditionally understood – conducting research or developing new products and services – accounts for a
little less than a third (Figure 8). Marketing of technical innovations (a fraction of overall marketing funding
by organizations) along with extension services and training programs to help farmers and producers adopt
these innovations, account for about 37% of this innovation funding. Innovations that lead to the creation
or strengthening of institutions or infrastructure account for another 26% of the total innovation funding
(for instance programs such as the Rashtriya Krishi Vikas Yojana (RKVY) and National Horticulture Missions
in India). Innovation funding for new policies, subsidies for adoption of innovations, only account for a small
fraction of the overall funding spend (less than 5%). This represents a potential opportunity where increased
funding in developing policies and incentive mechanisms for SAI related technologies can drive sustainability
transformation at scale. For example, experts in Brazil say that EMBRAPA has worked closely with the
government to develop agricultural policies that enable productivity and sustainability within the sector. This
collaborative model of research agencies playing a role in policy making can play a role across other Global
South countries as well.
A majority of innovation funding is provided to government agencies, private companies, and
universities/research institutes; civil society actors and other development agencies receive significantly
smaller portions. Governments (as funders) fund large amounts on developing infrastructure and
institutional innovations as well as implementing agricultural extension programs. These are mostly run
by government agencies under agricultural ministries in Global South nations. Hence, ~50% of innovation
funding is towards programs implemented by the government themselves. A further 15-20% is channelled
through public universities/research institutes largely for government funded research and development.
Private companies, mainly large agri-businesses, also play an important role in funding innovation, largely
for their own R&D and marketing of innovations.

15
2.2 Trends in agriculture innovation funding by each source
Funding by governments
Governments are the largest contributors to agricultural innovation in the Global South; with China
contributing nearly half of all government funding. Out of the ~USD 60 billion per year in overall agriculture
innovation funding, between ~USD 40 billion (range of USD 35-45 billion) comes from public funding. This
accounts for between 10-13%37 of all agricultural funding by governments in the Global South. Government
funding over the last decade has increased consistently driven by China (5% annual growth) and India (9%
annual growth). China accounts for approximately half of these public innovation funding and is a crucial
player for the Global South. To illustrate, just China’s agriculture research funding (~USD 6 billion) was nearly
equal to the combined agriculture innovation funding for India and Brazil.
Regionally, due to China, the Eastern Asia region funds the most on agricultural innovation (~USD 15-25
billion a year), followed by Latin America & the Caribbean (~USD 7 billion), and South Asia (~USD 5 billion).
Driven by China, Eastern Asia accounts for the lion’s share of agriculture innovation funding (See Figure 9
and Figure 10 below). Excluding China, Latin American governments (driven by Brazil with 20-30% of regional
funding) and South Asian governments (driven by India at 50% of the regional funding) account for a majority
of the public innovation funding in agriculture. Effective knowledge management and funding across public
innovation funds in these regions can 38make a significant difference.
Figure 9. Total government agricultural innovation funding in the Global South 2010-2019 (annualized), USD billion (Constant 2019 prices).
Source: Dalberg Analysis
Brazil’s agriculture innovation funding has on average stayed constant over the last 10 years, however
falling since 2014. Despite growing agricultural exports and output, the funding by the Brazilian government
in agriculture and subsequently agricultural innovation has not been increasing over time, with a small
decline in budgets. In 2018, Brazil public funding on agriculture innovation was ~USD 2.6 billion, a little less
than India (~USD 4 billion), and considerably less than China (~USD 26 billion). A proportion of public funding
in Brazil have been substituted by innovation funding by large companies such as Bayer and Syngenta who
37 Calculated by dividing estimate innovation spends by governments by government spends on “Agriculture, forestry, fishing” as reported by FAO. n.d. “FAOSTAT Database.” http://www.fao.org/faostat/en/#data. 38 Country classification into regions has been done based on regional classification on United Nations, “UNSTATS” (United Nations. n.d. “UNSTATS Database.” United Nations. Accessed June 28, 2021. https://unstats.un.org/home/.)

16
have funded agricultural research within Brazil in recent years including through prominent collaborations
with EMBRAPA, the apex national agricultural research organization in Brazil. However, when looking at just
R&D related funding, Brazil funds marginally more than India (~USD 1.9 billion n vs ~USD 1.7 billion in 2019).
These values are also similar to other estimates published by OECD.Stat (The General Services Support
Estimate on funding in Agricultural Knowledge and Innovation Systems)39. See the Brazil case study, here, for
further details.
Figure 10. Total government agricultural innovation funding in the Global South 2010-2019, USD billion (Constant 2019 prices).
Source: Dalberg Analysis
37% of public innovation funding goes towards marketing programs, extension services, and behaviour
change programs that drive adoption of agricultural innovations; 34% of public funding on agriculture
innovation goes towards institutional and infrastructural innovation for new agriculture products and
services. Governments, in their enabler role, fund more on innovations to help “new products and services”
get adopted and scale than on R&D to create those new products. Approximately 34% of the public
innovation funding goes towards institutional funding, new infrastructure, as well as agrarian reform.
Examples include public funding in setting up the dairy entrepreneurship development program in India,
which amongst its other objectives, aims to modernize dairy farms for production of clean milk and bring
structural changes in the unorganized sector so that initial processing of milk can be taken up at the village
level. Similarly, about 37% of the public innovation funding goes towards setting up and scaling extension
programs.
27% of public funding on agriculture innovation goes towards technology and R&D activities; this is
increasing at 7% annually (See Figure 11 below), faster than the global agricultural output. Science &
technology funding in agriculture are largely provided for operations and projects of a single government
‘apex research institution’ that coordinates agricultural research in the country or utilizes funding for its own
research, with the remaining flowing to state level and affiliated agricultural research institutes and
universities. Apex research institutions include National Agricultural Research Organizations (NARO) such as
Indian Council of Agricultural Research (ICAR), the Kenyan Agricultural and Livestock Research Organization
39 OECD, Agricultural Policy Monitoring and Evaluation 2021: Addressing the Challenges Facing Food Systems

17
(KALRO) and EMBRAPA in Brazil; and advanced research institutes such as Chinese Academy of Agricultural
Sciences (CAAS).
Interviews with experts reveal while funding on science & technology has grown faster than the overall world
agricultural output growth, most of this has been on driving innovations in high value agricultural sub-sectors
such as horticulture, livestock, and fisheries. The focus of this funding has been to improve seed varieties,
animal breeds, fish breeds, and practices for increased productivity and trade. This focus on technology
innovation is a reflection of the shift within China towards horticulture and livestock products. Land
traditionally used for grain and soybean cultivation has been turned into apple and kiwi orchards, having
significant export potential. Brazil similarly has had a strong focus on exports expansion and has invested in
technology to increase agricultural exports.
Figure 11. Technology related domestic agricultural innovation funding in the Global South 2010-2019, USD billion (Constant 2019 prices).
Source: Dalberg Analysis
Government innovation funding focuses predominantly on crops; livestock and fisheries attract less than
half the innovation funding compared to crops. 47% of the innovation funding by governments goes
towards crops. In countries like India this is higher at nearly ~70%. Approximately 27% of the innovation
funding by Global South governments focuses on cross-cutting themes such as forest preservation, water
conservation, and general agricultural reforms, especially prominent within countries such as Brazil. Though
livestock receive 20% of the overall funding on innovation by governments, in China, these sub-sectors retain
a strong focus. Compared with the relative output value of crops, governments spend a lot more on crops
than livestock and fisheries (See Figure 12 below). Innovation funding for crops is higher than their share of
output value whereas the innovation shares for livestock, and fisheries are both smaller than their output
value shares. This is likely because a majority of the agricultural workforce is employed within the crops value
chain, hence, attracting the most attention from governments.

18
Figure 12. Agricultural innovation funding vs output value 2018, (Constant USD 2019 prices).
*Innovation split by the three value-chain categories has been arrived at by excluding funding in cross-cutting themes.
Source: Statistia.com40 and Dalberg Analysis
40 Split of output value has been calculated using data on China and India sourced from Statista.com
Spotlight 1. More than half of the Kenyan government’s research funding goes to
livestock, fisheries and aquaculture.
Crops get most of the government innovation funding in Kenya (more than 60%); livestock, dairy, poultry,
and fisheries get ~15% of the government innovation funding (See Figure 13 below). Like the rest of the
Global South, the economic and employment potential of the crops value chain results in higher public
funding, through agricultural extension and programmatic support on the ground. Interestingly, Kenya’s
government-research-funding (subset of innovation funding) is highly oriented towards livestock,
fisheries and aquaculture which cumulatively receive 50-60% of the government’s total agricultural
research funding. Further details in the Kenya Case Study, here.
Figure 13. Value-chain wise split of government agricultural funding, agricultural innovation funding, and agricultural R&D funding- USD billion (Constant 2019 prices), 2010-2019.

19
Spotlight 2. China’s rise and influence in agriculture and innovation in the Global South.
Figure 14. Agricultural funding for countries in the Global South 2010-2019.
Source: FAOStat and Dalberg Analysis41
China’s funding in agriculture has been growing significantly and forms a significant proportion of the
overall Global South funding on innovation. In the last decade, China’s overall funding on agriculture
grew by 8% annually, significantly faster than similar funding by India and Brazil. Even though China’s
agricultural output is just twice of India and seven times that of Brazil, Chinese public funding on
agriculture is nine times that of India and thirty times that of Brazil pointing to the outsized role that
public funding in agriculture players in the country (See Figure 14 above). The Chinese government spent
as much on agriculture in 2019 as did all the other governments in the Global South in 2018 and 2019
combined. A large fraction of Chinese government funding has focused on building agricultural
infrastructure, including warehousing, supply chains, water conservation projects, and management and
procurement for state-owned farms. However, even after removing these infrastructural funding,
Chinese government’s funding in agricultural technology contributed to ~40% of all public funding
towards agricultural technology in the Global South.
Public funding in China has focused on developing high-value sub-sectors such as horticulture and
livestock and for developing efficient supply chains through technology platforms. According to expert
interviews, most of China’s public funding on agriculture innovation has focused on developing and
improving high-value agricultural production with clear economic trade benefits to China. Over the years,
the country has transformed large portions of land traditionally producing grains and soybeans to
produce fruits such as apples and kiwis that get exported. The shortfall in grain production has been
offset, to a certain extent, by cultivating value chains in, especially, African countries that have a relative
advantage for these products. For example, China has given large quantities of agricultural equipment
including tractors, sowing and soil-tilling machines, rice and wheat thresher machines, cottonseed
removing machines and generators to modernize agriculture production relevant for exports to China42.
Other innovation funding by China includes funding in adoption of digital technologies for farming to
improve supply chains, new age farm automation technologies such as drones, and innovative livestock
management systems including cloning technologies43.

20
Private corporations414243
Private corporations funded ~USD 13 billion (in the range of USD 9-18 billion) annually over the last decade
on agricultural innovation for the Global South, cumulating to USD 150 billion (ranging from USD 90-180
billion); this represents 20-25% of the overall agricultural innovation funding for the Global South. Private
sector funding in innovation typically comprises their direct R&D and new product development funding as
well as funding in marketing and extension made by these companies to support the adoption of these new
products and services. The funding is roughly evenly split between R&D funding and non-R&D funding in
marketing and adoption support. Key players include agriculture related divisions of global giants such as
Bayer Crop Science, Syngenta, ADM as well as other thematic players. While smaller agribusinesses also
contribute to innovation in the agriculture and food sector, they have a very small financial contribution
compared to the largest global agricultural corporations44.
The sub-sectors of farm mechanization, crop protection, and seed development and biotech together
account for approximately two-thirds of the private sector funding in innovation (See Figure 15 below).
Farm mechanization (25% of total) and pesticides (23% of total) represent the largest sub-sectors in terms
of innovation funding by the private sector. Funding in these sub-sectors is dominated by large companies
including Bayer Crop Sciences, Cargill, Syngenta, John Deere, and focus predominantly on crops. Other
sizeable categories include Meat & Poultry processing companies (~10%), Animal Health companies (~6%),
Fertilizer companies (~3%), and commodity specific processing companies (~3%), while Fisheries and
Aquaculture are estimated to receive less than 2% of the total innovation funding. Precision Agriculture
related innovation funding forms ~1% of the total funding by private companies, however, is the fastest
growing category growing at ~25% p.a. in the past decade. When looking at these categories from a value-
chains lens, crops receive ~80% of innovation funding by private companies. This is not surprising, since large
seed, biotech, pesticide, and fertilizer companies dominate sales and innovation amongst private
41 Agricultural funding by governments has been sourced through budget data for four countries – Brazil, China, India, and Kenya and using FAOstat data (FAO. n.d. “FAOSTAT Database.” http://www.fao.org/faostat/en/#data). 42 Xinhua. 2019. “Ethiopia Benefits from Chinese Agricultural Equipment Donation,” http://www.xinhuanet.com/english/2019-08/21/c_138324333.htm. 43 Since there is limited data on China’s funding, this information was sourced through semi-structured interviews with experts on the Chinese agricultural economy. 44 Also documented by others, e.g., OECD. 2019. “Innovation, Productivity and Sustainability in Food and Agriculture: Main Findings from Country Reviews and Policy Lessons.” Paris: Organisation for Economic Co-operation and Development. https://www.oecd-ilibrary.org/sites/c9c4ec1d-en/index.html?itemId=/content/publication/c9c4ec1d-en&mimeType=text/html&_csp_=6eac8f0258f5b7a030c5e15a65812684&itemIGO=oecd&itemContentType=book
SPOTLIGHT 2. China’s rise and influence in agriculture and innovation in the Global South
(continued).
However, there is a significant lack of detail and granularity in China’s agricultural funding and
innovation funding data. This prevents developing a full understanding of funding patterns and also the
focus on SAI. Agriculture policies within China and the importance accorded to SAI in China, will be an
important driver of the future of sustainable agriculture. The presence of high-quality, granular data
published by China on agricultural funding makes it difficult at this stage to understand the programs and
initiatives that receive public funding. While this challenge of data scarcity or opacity is also evident in
other countries across continents, given the size of China’s agriculture funding, the gap for China is worth
highlighting. This study has relied on the Chinese National General Public Budgets, Ministry of Science &
Technology Statistical Yearbooks, as well as expert inputs to arrive quantitative and qualitative
understandings of the country’s funding in agricultural innovation and SAI.

21
corporations. Livestock receives most of the remaining innovation funding, funded by companies in meat
processing, animal health and animal nutrition. Overall, large agribusinesses have also seen a fall in their
R&D intensity ratios over the years. According to private sector experts we interviewed, this is likely because
agricultural input companies face high costs of innovation due to increasingly restrictive regulatory
environment and increasingly complex next generation innovations and consumer preferences has pushed
these companies to focus on incremental innovations instead of breakthrough ones. This calls for a need to
derisk private capital to stimulate transformative innovations.
Figure 15. Total funding by Private Companies in agricultural innovation focused on the Global South 2010-2019, USD billion (Constant 2019 prices).
Note: Year-wise trends in the above graph have been shown by taking moderate assumptions for the estimation. Given more
aggressive or conservative assumptions, the absolute value could be lower or higher, but the trend and split is expected to be the
same.
Private equity and venture capital investors
PE/VC investors funded between USD 1.3-2 billion45 per year in agriculture innovation between 2010-19,
and account for ~3% of the overall innovation funding in agriculture for the Global South. Although, PE/VC
funding represents a small share of the overall agriculture innovation funding, a large percentage of this
funding is for disruptive innovation that can have an outsized impact if the technology works, and the
business models prove viable. For example, startups that increase information availability on markets,
climate and agronomic recommendations will help small farmers but also put pressure on intermediaries
within the agri value chain which causes dynamic effects on the way business is conducted in the sector.
Another example includes startups that create increased value for by products and waste from agriculture,
creating absolutely new markets for products. This study relied on a few paid databases that capture granular
deal flow in the PE/VC space and then modeled funding for the Global South to count funding into startups
45 Estimates have been made by analyzing trends of funding captured by the Tracxn database. These trends were superimposed on estimates of overall PE and VC funding in agricultural innovation in the Global South using research reports such as the AgFunder. 2021. “AgriFoodTech Investment Report.” https://research.agfunder.com/2015/2015-agfunder-global-report.pdf and McKinsey&Company. 2019. “Private Markets Come of Age: McKinsey Global Private Markets Review.” https://www.mckinsey.com/~/media/mckinsey/industries/private%20equity%20and%20principal%20investors/our%20insights/private%20markets%20come%20of%20age/private-markets-come-of-age-mckinsey-global-private-markets-review-2019-vf.ashx

22
not just in the Global South but also companies based in the Global North where spillovers are likely.
Examples of such spillovers include a German startup Plantix which has developed an AI engine to detect
pests in crops and has a significant user base in India.46
Thematically, technology enabled agri-marketplaces and farmer engagement platforms received ~60% of
all PE/VC agriculture funding; this was followed (distantly) by seed development and biotech startups
(~15%) – See Figure 16 below. Agriculture marketplaces, data-based advisory solutions, and platforms
offering a combination of information, market linkages, and sometimes even financial support emerge as
the most-funded innovation areas. Companies that received funding include Ninjacart (India), Fruitday
(China), and Meicai (China), all focused on creating tech-based business models that use advanced analytics
to drive supply chain efficiencies in agricultural value chains. These companies use simple tech enabled data
solutions to better manage supply chains and meet farmer needs at lower costs. Seed development
companies that received funding included Advanta (India), and Nuziveedu Seeds (India), both manufacturing
hybrid seeds. From a commodity lens, ‘crops’ attract the highest share of PE/VC funding although funding
that cut across commodity chains also received a notable proportion of funding, driven largely by funding
for agriculture financing companies that target both individual farmers as well as agricultural businesses.
Figure 16. Total funding by PE/VC investors in agriculture related companies based in the Global South 2010-2019, USD billion (Constant 2019 prices).
Source: Tracxn and Dalberg Analysis
China and India are the largest recipients of PE/VC funding in agriculture, followed distantly by Kenya,
Brazil, Argentina, and Nigeria. ~80-90% of funding by PE/VC funders in agriculture in the Global South were
focused on China (~40-45%) and India (~40-45%). This is driven by the large market sizes and mature PE/VC
networks within these countries. The number of PE/VC funds and investor knowledge has also increased
substantially over the years in these two markets. Other significant countries such as Kenya, Nigeria, Brazil,
Argentina, and Mexico get ~1-3% of the overall PE/VC agricultural funding pie each.
Philanthropic, multilateral and bilateral agencies
Note: Analysis in this section is based on data from OECD databases.
Average funding by Development Partners for agricultural innovation is estimated to be at ~USD 6 billion
per year between 2010-201947 with an annual contribution that stagnated and perhaps even decreased to
46 German Indian Startup Exchange Program, “Plantix: How an AgriTech startup is helping Indian farmers fight crop diseases”, 2021 47 This includes funding to governments of ~USD 12-13 bn that also gets included in the section on government funding. It is also important to note that ~75% of bilateral and multilateral funding were classified as aimed at development or adoption of innovation (i.e., new technologies or agricultural practices).

23
USD 5.3 billion annually in the recent past; multilateral agencies and international philanthropies have
increased their funding whereas bilateral agencies have stagnated or decreased (See Figure 17 below).
Bilateral constitute more than 70% of this funding followed by multilaterals (20-25%) and philanthropies (~5-
10%). Bilateral contributions are led by the USA, and other European national aid agencies, while multilateral
contributions are led by European Union (EU) institutions. 48 Bilaterals fund considerably more than
multilateral funders, and this pattern holds true largely because most multilateral agencies assistance takes
the form of ODA loans and for which this study counts the difference between these concessional rates and
market lending rates as the true “investment”. However, over the years, multilateral agencies such as World
Bank (largely through IDA) and IFAD have increased their funding in agriculture forming a much larger part
of the overall investment. Amongst international philanthropies, BMGF is the single largest player
contributing ~70-80% of all agriculture related innovation funding by philanthropies. Overall, nearly half of
bilateral and multilateral funding is targeted towards Sub-Saharan Africa (SSA) and 96% of philanthropic
funding is focused on SSA.
Figure 17. Total funding by Development Partners in agricultural innovation in the Global South 2010-2019, USD billion (Constant 2019 prices).
Source: OECD.Stat and Dalberg Analysis
In addition to ~USD 54 billion in innovation funding by international philanthropies and ODA countries
over the last decade, bilateral aid by countries such as India and China are significant (between USD 5-6
billion over the last decade), however limited data granularity prevents a nuanced understanding of these
flows. China and India, together, invest more than USD 600 million per year in agricultural innovation funding
overseas. Most of China and India’s funding is focused on Africa and is likely going towards support activities
to drive adoption of technologies. For example, China funds technology demonstration centers in Africa to
promote the usage of and train stakeholders on new agricultural technologies to increase production and
economic efficiency49. Given that China is a large importer of agricultural products, in some cases China has
funded heavily in training agricultural communities in other countries (e.g., Ethiopia) to improve their
agricultural production efficiency by adopting new technologies and practices, and hence, improve trade
prospects with China.
48 EU Institutions the European Commission, European Development Fund, and European Investment Bank 49 Harding et al., “Chinese agriculture technology demonstration centres in Southern Africa: the new business of development”, 2016

24
The Sub-Saharan Africa (SSA) region gets a large fraction of funding by Development Partners for
agriculture innovation (~46%) – See Figure 18 below. A significant proportion of bilateral and multilateral
funds are targeted towards the regional programs and projects in Africa (~6.5% of bilateral and multilateral
funding). After SSA, South Asia and Latin America are the two largest recipients of development funding for
agricultural innovation, getting ~12% each. Within South Asia, Afghanistan received ~50% of all funding for
the region, followed by India, Pakistan, Bangladesh, and Nepal that received ~10-12% each. Further, a
majority of international philanthropic funding for agriculture innovation (~65%) is focused on Sub-Saharan
African countries. This philanthropic funding is distributed across most SSA countries and does not have
extreme concentrations in a small number of countries. For instance, countries such as Uganda, Ethiopia,
Mali, Ghana and Kenya, all get ~1.5-3% of bilateral and multilateral funding each. Philanthropic funding is
largely driven by BMGF, and focused on the SSA region, Latin America, and Southern Asia (driven by India).
Figure 18. Total funding by Development Partners in agricultural innovation focused on the Global South 2010-2019, USD billion (Constant 2019 prices).
Source: OECD.Stat and Dalberg Analysis
Where target value-chains could be assessed, more than 40% of agricultural innovation funding goes
towards crops; this ratio for crops is lower than the focus on crops by both the governments and the
private sector. Crops receive more than 40% of agricultural innovation funding by these development
agencies, however this is proportionately much lower compared with the private sector (>90% going towards
crops) and governments (>50% going towards crops). 15-20% of innovation funding by is these funders are
focused on livestock, and 15-20% towards fisheries and aquaculture both receiving between USD 300-400
million annual. However, fisheries and aquaculture have witnessed a sharp rise in innovation funding by
Development Partners: Funding (~USD 600-650 million in 2017 and ~USD 500-550 million in 2018). Funding
in fisheries by both bilateral/multilateral funders (tripled over 2014-18) and philanthropies (increased by 10x
between 2014-2018) has increased substantially in the recent past. Funding that crosscut across all value-
chains constituted ~12% of total funding by these funders.
The balance between research & development and other categories of innovation, has changed in favour
of uptake and scaling for Development Partners between 2010-2018. Whereas bilateral and multilateral
agencies funded closer to ~20% of their innovation related funds on research & development for agriculture
closer to 2010, this has almost halved to <10% in 2018 where data was available. It appears that there has

25
been an increased focus by Development Partners to support the adoption and scaling of new agricultural
technologies and practices. Examples include funding by IDA in Tanzania’s Accelerated Food Security
Program which includes improving farmers’ access to agricultural knowledge, technologies, marketing
systems and infrastructure50 and funding by the UK Government Foreign, Commonwealth & Development
Office (FCDO) in the International Climate Fund with the aim to promote sustainable low carbon land use
and forest management in small and medium-scale farms by encouraging technological progress in Brazil.
2.3 Funding trends across the agriculture sector’s funding and innovation canvas
This study segments funding in the agriculture sector’s funding and innovation canvas into three distinct
layers for the purposes of innovation funding analysis. Layer one, ‘macro systems’ that include governance
and policy institutions, financing systems, knowledge and education systems within agriculture, as well as
international/domestic trade; Layer two, ‘production systems’ that include core agricultural value chains and
50 World Bank. 2009. “Accelerated Food Security Program of the United Republic of Tanzania.” https://documents1.worldbank.org/curated/en/765431468311442774/pdf/485490PGD0P114101Official0Use0Only1.pdf.
Spotlight 3. USAID stands out with increasing agricultural innovation funding in the private
sector.
United States Agency for International Development (USAID) funds ~USD 600 million annually on
agricultural innovation, ~200 million of which is channelled into the private sector (2018) – under the
overarching focus on economic growth. While in 2015, less than 5% of USAID's agricultural innovation
pool went to the private sector; in 2018, the number went up to ~35% (See Figure 19 below). This share
is much higher than that of other bilaterals, where ~9% of funding went to the private sector in 2018.
~90% of this investment into the private sector is through the “private sector in the provider country”,
i.e., the USA, as opposed to PPPs or "private sector in the recipient country". A more detailed analysis
reveals that much of this is around improving the agricultural infrastructure as well as the policy network
in the recipient country. For more information see the USAID case study, here.
Figure 19. Share of USAID’s Innovation Funding 2010-2019, USD billion (Constant 2019 prices).

26
production activity therein; and Layer three, ‘Ecosystem Services & Natural Resource Management (NRM)
systems’ that include systems to manage, conserve or develop ecosystem services and production factors
necessary for or are impacted by agricultural production such as soil, water, biodiversity, forests, and land
(See Figure 20 below).
The analysis in this section covers funding by all funder categories: Governments, Private Sector,
Development Partners, and PE/VC actors. Funding by governments in this section are based on a model that
relies on granular Indian data and extrapolations, with adjustments, to other countries such as China, Brazil
where corresponding data did not have sufficient granularity.
Figure 20. Map of dominant area of innovation funding and financing needs.
Source: Dalberg Analysis51
Innovation funding for Layer 1: Macro systems (policy, financing, knowledge, trade systems)
Between USD 20–25 billion is funded annually for innovations in macro systems forming 30% of the overall
agricultural innovation funds; most of this innovation funding is focused on agricultural knowledge and
education systems. The macro systems layer receives approximately 30% of all the innovation funding for
agriculture with governments being a significant contributor: this layer accounts for nearly 55-60% of the
entire innovation funding by Governments. A large fraction of innovation funding in this layer is focused on
agriculture knowledge and education systems and staff costs and project related expenses at higher
51 The map is created using estimated innovation funding by private companies, PE/VC investors, bilateral/multilateral agencies, international philanthropies, and the Indian government. For governments, extrapolates Indian funding to other countries since data granularity on government budgets for the rest of the Global South was poor.

27
education institutes, universities, and public research institutes are significant cost drivers (See Figure 21
below). Funding in this layer includes almost all the funding provided to organizations such as Chinese
Academy of Agricultural Sciences (China), Indian Council of Agricultural Research (India), EMBRAPA (Brazil),
and Kenya Agricultural & Livestock Research Organization (Kenya) amongst other federal research agencies.
When compared to knowledge and education systems, other components of Layer 1 – policy systems,
financing systems, and even trade systems – receive limited innovation funding. This is sub-optimal
because funding in sustainable agriculture policy research and policy reform, can drive large scale agricultural
transformations and crowd-in more innovation funding. An example of this successfully taking place is in
Brazil, where strong systems coupled with a strategic vision, has led to EMBRAPA, the apex federal
agricultural research agency, providing policy research and data support to the government.
Further, only a small fraction of research projects carried out in agricultural research institutes and
education institutes get commercialized. More and more strategic integration of the private sector can not
only improve the returns from this activity but can also crowd-in more private sector funding.
Figure 21. Agricultural innovation funding by the Indian government 2010-2019, USD billion (Constant 2019 prices).
Source: Dalberg Analysis
Innovation funding for Layer 2: Agricultural production systems (across value chains)
Between USD 25-35 billion has been funded annually for innovations in agriculture production systems
over the last decade, accounting for ~50% of the overall agriculture innovation spends. The core systems
of agriculture – the production of inputs, production processes, post-production, processing – get
approximately 50% of the innovation funding within the entire agriculture sector’s funding and innovation
canvas in the Global South. Innovation funding into these areas comes from both governments (research
funding, agricultural missions) as well as the private sector (research funding, production factories producing
products and services, multi-disciplinary centers of innovation). Projects are heterogeneous cutting across
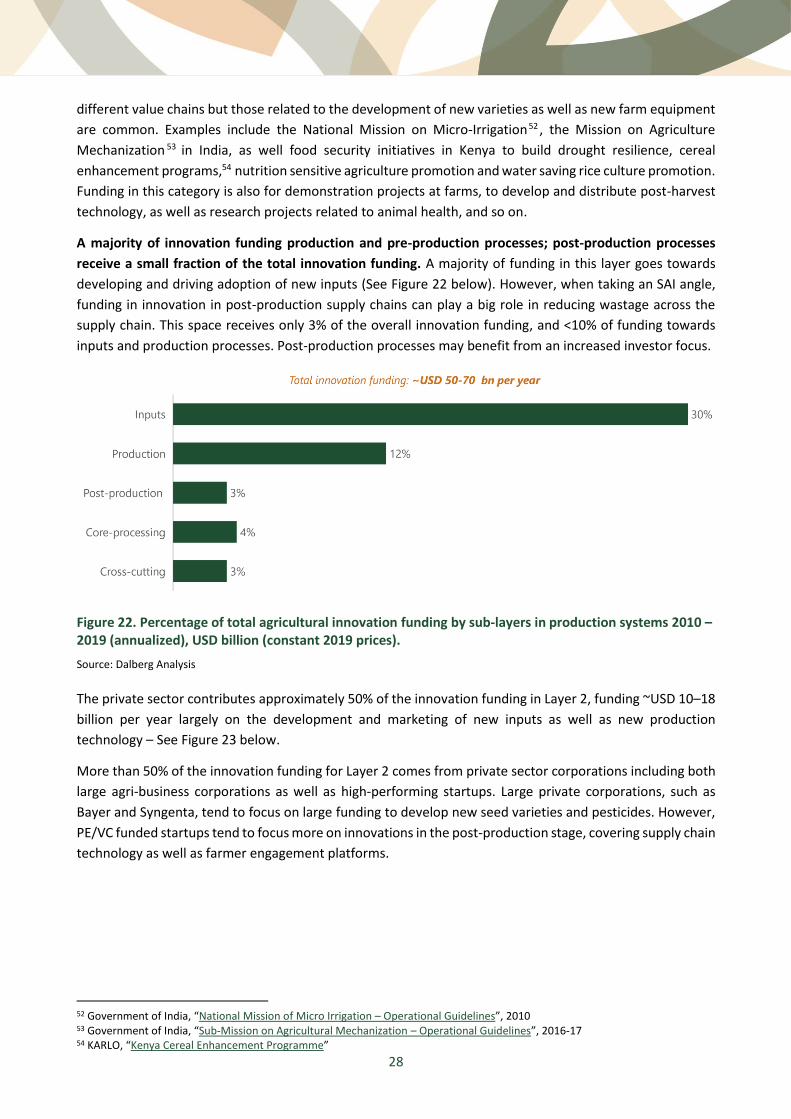
28
different value chains but those related to the development of new varieties as well as new farm equipment
are common. Examples include the National Mission on Micro-Irrigation52 , the Mission on Agriculture
Mechanization 53 in India, as well food security initiatives in Kenya to build drought resilience, cereal
enhancement programs,54 nutrition sensitive agriculture promotion and water saving rice culture promotion.
Funding in this category is also for demonstration projects at farms, to develop and distribute post-harvest
technology, as well as research projects related to animal health, and so on.
A majority of innovation funding production and pre-production processes; post-production processes
receive a small fraction of the total innovation funding. A majority of funding in this layer goes towards
developing and driving adoption of new inputs (See Figure 22 below). However, when taking an SAI angle,
funding in innovation in post-production supply chains can play a big role in reducing wastage across the
supply chain. This space receives only 3% of the overall innovation funding, and <10% of funding towards
inputs and production processes. Post-production processes may benefit from an increased investor focus.
Figure 22. Percentage of total agricultural innovation funding by sub-layers in production systems 2010 – 2019 (annualized), USD billion (constant 2019 prices).
Source: Dalberg Analysis
The private sector contributes approximately 50% of the innovation funding in Layer 2, funding ~USD 10–18
billion per year largely on the development and marketing of new inputs as well as new production
technology – See Figure 23 below.
More than 50% of the innovation funding for Layer 2 comes from private sector corporations including both
large agri-business corporations as well as high-performing startups. Large private corporations, such as
Bayer and Syngenta, tend to focus on large funding to develop new seed varieties and pesticides. However,
PE/VC funded startups tend to focus more on innovations in the post-production stage, covering supply chain
technology as well as farmer engagement platforms.
52 Government of India, “National Mission of Micro Irrigation – Operational Guidelines”, 2010 53 Government of India, “Sub-Mission on Agricultural Mechanization – Operational Guidelines”, 2016-17 54 KARLO, “Kenya Cereal Enhancement Programme”

29
Figure 23. Total funding in agricultural innovation by Private Companies 2010-2019, USD billion (Constant 2010 prices).
Source: Dalberg Analysis
Innovation funding for Layer 3: Agriculture ecosystem services & natural resource management
Approximately USD 10 billion in innovation funding is utilized every year for the protection, conservation,
and development of ecosystem services as well as natural resource management; this represents
approximately 13–20% of all agricultural innovation funding and is dominated by governments and
development institution funding. Funding towards these activities has been growing 5% annually but still
constitutes the smallest portion across the three layers of the agriculture sector funding and innovation
canvas described above. Most of this innovation funding is made by government agencies or by development
actors since many of these activities are not profitable and lead to limited private sector involvement. This
has started to change though and increasingly there are startups that are focused on soil health
management, water and biodiversity conservation through the use of data and analytics. For e.g., Shuxi
Technology 55 , a startup in China provides data driven precision agriculture solutions including
recommendations to monitor soil health. Another India based startup Sumo Agro56, manufactures soil
nutrients with the aim of supporting regenerative agriculture. However, most of the current funding invests
largely in biodiversity and forestry management, and soil and water conservation projects (See Figure 24
below) including watershed development, and training of farmers on soil and water conservation from
bilateral and multilateral sources. For example, the World Bank/IDA invests in countries in the Global South
to improve water use efficiency through the adoption of water saving technologies and to increase surface
and increase groundwater availability through the rehabilitation of small to medium irrigation schemes,
terrace rehabilitation, bank protection works and other water and soil conservation activities57. Finding
inducements for private sector players and funders will be key going forward to protect production factors
as well as NRM.
55 Tracxn, “Shuxi Technology – Company Profile” 56 Tracxn, “Sumo Agro– Company Profile” 57 World Bank. n.d. “Development Projects: Groundwater and Soil Conservation Project.” Text/HTML. World Bank. Accessed June 28, 2021. https://projects.worldbank.org/en/projects-operations/project-detail/P074413.

30
Figure 24. Percentage of innovation funding towards provision of ecosystem services and NRM 2010-2019, USD bn (Constant 2010 prices).
Note: Year-wise trends in the above graph have been shown by taking moderate assumptions for the estimation. Given more
aggressive or conservative assumptions, the absolute value could be lower or higher, but the trend and split is expected to be the
same. See methodology section in Annexure for more details.
Source: Dalberg Analysis
Development Partners spend ~23% of their innovation funding in ecosystem services and NRM;
government funding to this layer is likely to be much lower. Data granularity for tagging to each of the
layers in the agricultural innovation canvas was highest for development funders and the Indian government.
Based on this, development partners spend a considerably larger amount of their innovation funding on layer
3 – with a large focus on Forestry and Biodiversity Management, as well as water and soil management.
Funding for innovations in land use and rights management is almost negligible. As opposed to Development
Partners, the Indian government spends more on water and soil health management (~5% of agricultural
innovation funding), however overall funding by the government on this layer is low (~8% of all agricultural
innovation funding).

31
3. State of Funding Targeting Innovation in
Sustainable Agricultural Intensification
This chapter begins by setting the definition of Sustainable Agriculture Intensification (SAI) in a specific
manner and then analyzing funding in agricultural innovation in the Global South using this definition.
Specific issues addressed in this chapter include A) Estimated levels of funding explicitly targeting SAI
innovation in the Global South B) The varying SAI funding volume by each of the funder types and C) The SAI
funding split across different parts of the agriculture sector funding and innovation canvas, value chains, and
regions. For CoSAI, SAI refers to the transformative changes in agriculture and food systems that are urgently
required to meet rapidly increasing global needs for affordable, nutritious, safe and healthy food, while
protecting and improving the natural environment and promoting resilient livelihoods and social equity. The
broad definition of SAI: Funding that aims to produce both gains in productivity and improve environmental
sustainability. The narrow definition of SAI: Funding that meets the above criteria (broad definition), and
also aim to improve human (nutrition, education) or social (equity) dimensions. See Figures 3 and 4 for more
details.
3.1 SAI innovation funding: the macro view
Caveat: SAI innovation funding calculations have more uncertainty than the agriculture innovation funding
values reported in Chapter 2 largely due to the absence of granular data and inconsistent project descriptions
across data sources. Consequently, the study highlights key assumptions in the Annexure and indicates
uncertainties and ranges in the calculations wherever relevant. It is important to note here that funding in
SAI by governments have been estimated using an extrapolation of available data on the Indian
government’s programs. Poor funding data quality and granularity published by governments restricted
more extensive country-wise analysis of spends aimed at SAI. The government SAI innovation funding
reported in this section, should thus, be treated as an estimate that should be refined going forward once
more granular data becomes available.
Figure 25. SAI as a share of innovation for each of the two definitions 2010-2019 (annualized), USD bn (Constant 2019 prices).
Source: Dalberg Analysis

32
Under the broad definition of SAI defined above, less than USD 5 billion annually is targeted towards SAI
innovation in the Global South; this represents between 6-7% of the total innovation funding for
agriculture in the region. As seen in Figure 25 above, using the broad definition, annual funding in SAI
innovation can be estimated to be around USD 3.4-4.7 billion and between USD 2-2.6 billion annually using
the narrow definition. Thus, even under the broad definition, spends on SAI innovation is less than <7% of
the total agricultural innovation spends which are USD ~60 billion annually. The remaining (~93%) innovation
funding seems to be focused on productivity and economic improvements without an explicit focus on
sustainability. However, it is possible that some of this 93% would qualify as SAI if more granular funding
information had been available and had that funding been tagged into appropriate sustainability domains.
Irrespective, what we can be sure of is that funding in SAI innovation is much lower than what is required.
Based on analysis of the Indian government’s data, the proportion of innovation funding that have stated
intentions of SAI for governments (<6%) is less than the private sector (~9%) and Development Partners
(~10%). Some of this is likely because of the manner in which governments describe their innovation funding
but there is a clear need to increase their focus on cross-cutting sustainability outcomes. The private sector,
with valuable brands at stake, is being asked to focus more on ESG outcomes and might be better than
government entities at articulating sustainability goals. Similarly, Development Partners including bilateral
and multilateral agencies and philanthropic funders, have a strong internal strategic focus on sustainability
and usually state these in their project and program descriptions and this might explain the percentage
funding on SAI innovation.
Based on available data and extrapolations, 28% of innovation funding in agriculture targets economic
sustainability and productivity improvements, ~7% of innovation funding explicitly targets environmental
outcomes, and ~10-13% of funding target human condition and social sustainability outcomes – See Figure
26 below. This is likely an underestimate in all cases, due to inadequate descriptions. Hence, it is likely that
if better descriptions around projects were available, overall spends aimed at innovation in SAI would be
higher than the 7% that this study is able to calculate but would still be at quite a low percentage overall.
Figure 26. Percentage of overall innovation funding by stated sustainability intentions (referring sustainability domains by Musumba et al., 2017; or www.sitoolkit.com) 2010-2019, Percentage of total innovation funding.
Source: Dalberg Analysis
From an agriculture value chain perspective, SAI innovation funding percentages mirror the overall
agriculture innovation funding with two crucial exceptions a) The Fisheries and Aquaculture category has
more funding on SAI innovation and b) The Livestock category has less funding on SAI innovation. While
~2% of livestock innovation funding was classifiable as intended for SAI, this value was much higher at ~8%

33
for fisheries and aquaculture (See Figure 27 below). These trends are likely because aquaculture and fisheries
are beginning to get recognized as important sectors for sustainable food security and also because current
approaches for a majority of funding in livestock emphasize productivity enhancements and not the other
dimensions of sustainability. An increased focus on overall sustainability by prominent private sector players
in livestock – companies such as Tyson Foods (USA) & BRF (Brazil) – could drive up SAI funding for this sector
as many of these large players currently have limited stated intentions around environmental sustainability.
Figure 27. Funding in innovation and SAI (broad definition) by value-chain 2010-2019, USD billion (Constant 2019 prices).
Source: Dalberg Analysis
From an innovation area perspective, ~8% of technology related innovation funding is aimed at SAI, 4% of
the institutional innovation funding, and ~3% of the marketing and extension program innovation funding.
As can be seen in Figure 28 below the percentage of innovation funding targeting SAI outcomes is the highest
for the “technology” innovation area. This is driven primarily by private sector R&D funding, especially by
seed companies, as well as science & technology projects funded by public systems. Conversely, SAI accounts
for a much smaller share of innovation funding on marketing and extension programs primarily because
while these programs state social sustainability intentions, they have a limited focus on environmental
sustainability and hence don’t get covered under either broad or narrow definition of SAI in this study.
Figure 28. Funding in innovation and SAI (broad definition) by innovation area 2010-2019, USD billion (Constant 2019 prices).
Source: Dalberg Analysis

34
3.2 SAI innovation funding patterns by funding source
This section of the chapter describes SAI innovation funding trends for each of the four sources (Government,
Private Companies, PE/VC, Development Partners) keeping in mind that different sources have different
levels of funding data granularity and availability as described in Chapter 2. The analysis for each source
begins with a note on data availability and then goes on to describe specific trends.
SAI innovation funding by governments
Based on data available from the Government of India, the study estimates less than 6% of public funding
for agricultural innovation is aimed at SAI. Extrapolating India data to all Global South governments would
give an estimated total annual government funding of <USD 3 billion targeted at SAI (or around half of all
estimated funding for SAI innovation)58. The focus on the five SAI domains, as indicated earlier, also varies
by country. For instance, based on conversations with experts in Brazil and India, it is likely that public
funding aimed at SAI in Brazil emphasizes environmental sustainability whereas public funding in India
emphasizes the social dimension of sustainability.
Institutional innovation and agricultural extension innovation projects have limited stated intentions on
environmental sustainability and consequently do not get tagged as SAI in our analysis. Technology
innovation spends include research funding that aims to protect the environment, while improving
productivity of agriculture and nutritional value of food. The narrow SAI definition covers only select research
by the government that focuses on social, environmental, as well as productivity domains. A lot of the
subsidy funding is towards traditional inputs and does not get categorized as innovative. Most public funding
on agricultural extension and institution-building is not classified under SAI, since these programs have a
social focus along with the economic and productivity goals but limited stated intentions around
environmental sustainability. As an example, most of the extension and institutional funding, that constitutes
more than 80% of public innovation funding in India, does not get classified as SAI based on stated intentions.
In India, funding for Rashtriya Krishi Vikas Yojana (RKVY) 59 , and the state and central allocations for
agriculture extension all aim to promote new agri-business models, entrepreneurs, cultivation and
infrastructural funding to modernize production and farming units and hence clearly state intentions of
58 A study by Biovision - “Money Flows: What is holding back investment in agroecological research for Africa”, 2020 analyzed a subset of projects by a public agricultural research institute in Kenya (KARLO) and found that nearly 40% of their funding could be classified as targeted towards agroecological transformation based on classifications on level 3, 4, 5, of the Gliessman’s 5 Levels of Agroecological Transformation (Gliessman, S. R. 2015. Agroecology: The Ecology of Sustainable Food Systems, Third Edit. Taylor & Francis, Boca Raton.). However, this framework and data was not directly comparable to that used in the present report. Experts that we interviewed believed that in Kenya, private sector funding for innovation in SAI is much higher than that from the government 59 https://rkvy.nic.in/static/index.html
Important Note on Data Availability & Modeled Numbers for Public Funding Aimed at SAI Innovation:
Data on public funding for agriculture is available for most countries and macro-numbers can be
triangulated through different budget documents. The key challenge is that granularity of data is poor
with websites for major countries missing key information on the breakdown of agriculture funding by
programs or even information describing programs in sufficient detail to enable accurate classification of
funding into different dimensions of this study’s SAI framework. India was the only major country in the
study sample that had sufficiently detailed data that allowed a detailed classification of innovation
funding into SAI. The numbers reported for public funding on SAI are based on the extrapolation of Indian
numbers to the Global South ranges and upper bounds are indicated clearly.

35
driving economic efficiency and even social outcomes but have limited consideration for environmental
sustainability.
SAI innovation funding by private companies and PE/VC investors
Based on data available and the model developed, the study estimates that private companies likely fund
less than USD 2 billion annually for SAI innovation in the Global South; this is 30-35% of the total SAI
innovation funding, and approximately ~9-10% of the overall private companies’ funding for agricultural
innovation (using the broad SAI definition).
Private sector corporations fund on SAI innovation both through their R&D activities as well as marketing
activities to promote the adoption of new products and services developed. Almost every large company,
annual reports for which were analyzed by this study, clearly stated intentions to focus on nutrition
enhancements, environmental sustainability, in addition to increased productivity and economic
improvement as the key motivations behind this focus on innovation (refer to Spotlight 4 below for
examples). While these intentions are not clearly stated at the level of individual R&D projects, there are
overall claims made around intentions of sustainability for their innovation funding by these companies and
they typically apply a certain number of sustainability principles to their projects (that often focus on aspects
of ‘do no harm’). (Refer to Spotlight 4 below). As a result, a large fraction of R&D and corresponding
marketing spending within the private sector qualifies as SAI using the broad definition of this study.
Important Note on Data Availability & Modeled Numbers for Private Sector Funding Aimed At SAI
Innovation: Data in this section is shown by analyzing (i) data from the annual reports of large agriculture
and food sector companies globally across all the key agriculture sub-sectors and modeling to extrapolate
these patterns to a global scale and (ii) Proprietary databases tracking PE/VC funding including Traxcn
and Agfunder along with industry reports on funding trends in the PE/VC industry. For private companies,
granular data that would enable attribution to specific destination countries is missing because of the
way companies report their financials. For the detailed methodology, please refer to the Annexure.

36
PE/VC funding forms a small but growing proportion of the total private sector funding in agricultural
innovation and SAI. Currently, while PE/VC accounts for less than 2% of innovation funding with clearly
articulated SAI intentions, this value has been growing in the last 3-4 years at ~50% per annum. Sub-sectors
such as soil remediation and regeneration, adoption of agroforestry practices are positive outliers and have
a high number of startup funding that aim to increase productivity while also improving environmental
indicators. Further, given the disruptive innovation sought by the funded startups, relatively low levels of
funding could drive large transformations in the sector directly and also become an important complement
that extends the reach of publicly funded innovations such as hybrid seeds and new agricultural equipment.
Spotlight 4. Private sector standards.
Many large-scale private sector companies have their own standards and metrics for sustainability,
although they may not apply these consistently across all their innovation work. Here are two examples:
1. Bayer (Extract)
“For us, product stewardship means that our products satisfy the highest quality standards and are safe
for people, animals and the environment when properly used. We respect legal requirements, and our
voluntary commitment and internal standards go beyond these in a variety of areas. This includes
(examples):
• “Producing more with less: Smart farming helps farmers maximize their yields through
agronomic best practices while reducing the amount of resources needed"
• "Biodiversity: Encouraging practices like crop rotation and cover cropping, creating flower
strips, refuges, bird nesting aids and insect hotels helps build an agro-environment rich in
biodiversity"
• "Bee care and bee safety: Controlling the Varroa mite, planting flower strips and applying crop
protection products in a way that minimizes exposure to bees are just a few measures to protect
pollinators"
• "Water preservation: Efficient water management, establishment of bufferstrips and on-farm
wastewater management are good examples to follow."
2. OLAM (Extract)
• Safe & Decent Work: Provide and support safe workplaces that respect the rights of everyone.
• Nutrition & Health: Improve farmer and employee wellness and longevity.
• Diversity & Inclusion: All people are socially and economically empowered.
• Climate Action: Reduce, mitigate and adapt to the impacts of changing weather patterns.
• Healthy Ecosystems: Support and encourage biodiversity and effective land use.
• Healthy Soils: Protect soil and help restore degraded land.
• Water: Reduce water usage while improving yields.
• Reduce Waste: Feed more people and increase farmer incomes by reducing food waste.
Source: Bayer, OLAM websites; Bayer CropScience Website, Bayer Website; Bayer CropScience, “Global Brochure”, 2020;
atsource.io/methodology (Metrics Tab).
Compiled by Jonathan Wirths, CoSAI

37
SAI innovation funding by development partners
SAI innovation funding made by this category of funders was ~USD 500 million annually over the last
decade a figure that represents less than 20% of total SAI innovation funding; bilateral & multilateral
donors account for more than 90% of funding in this category with funding by philanthropic donors
accounting for less than 10%. Organizational objectives for Development Partners working in agriculture
emphasize sustainability, and in some cases, sustainability outcomes are a prerequisite for funding decisions
by these agencies. The study finds that 10% of the innovation funding by these agencies qualifies as SAI, a
ratio higher than the public sector or the private sector. It is also possible that the actual SAI funding for
Development Partners is higher than those claimed in this study due to limited descriptions of projects and
programs available in the OECD dataset. With the available descriptions, Bilateral and multilateral funding
to SAI has been increasing by ~10% annually between 2010-201860.
60 Not including China
Important Note on Data Availability & Modeled Numbers for Funding Aimed at SAI Innovation by This
Segment of Funders: Analysis in this section relies on data from the OECD dataset, which is a
comprehensive list of bilateral, multilateral, and philanthropic projects. Given the size of the OECD
dataset, word crawl algorithms along with sampled triangulation was used by the study team. For the
detailed methodology, please refer to the Annexure.

38
4. Observations on Improving Funding for
Agricultural Innovations and SAI
This chapter identifies potential gaps in the way funding is made in agricultural innovation keeping in
mind the overall goal of SAI. This chapter then discusses potential opportunities and strategies for
stakeholders within the agricultural innovation system to address these gaps and subsequently change
the direction of innovation in agriculture.
4.1 Why is it important to increase innovation funding for SAI
Improving food security while meeting sustainability targets is one of the main global development
challenges facing this generation (Refer Chapter 1). A fundamental shift to more sustainable ways of
producing food is needed and this will require significant innovation across different categories:
technology innovation, institutional innovation, behavioural innovation, and finally financial
innovation.
The study shows that only a small fraction of the total innovation funding within the agriculture sector
is aimed towards SAI; and these ratios have not increased substantially over time. Over the last
decade, USD ~60 billion per year gets funded in agricultural innovation (USD 65-90 billion in more
recent years), however less than USD 5-7 billion out of this (less than 7%), targets SAI. In a world that
is rapidly having variable climate patterns that affect agricultural production along with reducing
biodiversity and natural land, such a small emphasis on SAI innovation is simply not able to change the
trajectory rapidly enough to meet sustainability targets set for 2030 or 2050. Even comparatively,
innovation funding for sustainable agriculture is significantly behind funding for sustainable energy,
as an example. Understanding funding gaps and leveraging opportunities to push innovation in SAI is,
hence, necessary and urgent.
4.2 Underfunding patterns for SAI
While the focus of this study was to create a baseline for funding and not to identify underfunding or
gaps, there are some patterns in funding or under-funding worth highlighting for each source of
funding.
Government
1. Public innovation funding for SAI emphasizes adoption of innovations, with lesser funding
in basic research and product development compared with the private sector: ~30% of
government funding is in agricultural research and development. The remaining 70% goes
towards innovation in extension and behaviour change of farmers and producers and
institutional funding. Contrasting this with the private sector, where companies fund 50% on
research and development, there is a potential gap in government funding on research. This
gap may be more pronounced when we consider efficiency differences between the public
and private sector in relevance of research funding (experts interviewed said that the same
dollar spent by the private sector on research is likely to be more relevant to the needs on the

39
ground). Experts (refer Annexure document for this report61) said that the large fraction of
public funding is difficult to commercialize due to lack of structured information flow and
funnels between implementers and researchers. However, it is also important to acknowledge
that governments fund in ‘difficult’ areas such as soil and water management and last mile
rural extension programs that affect efficiency of funding and also require more emphasis on
extension/institutional funding than R&D.
2. Limited funding in SAI related policy and innovation on ecosystem services/NRM: A large
portion of government innovation funding aimed at SAI is linked to parts of Layer 1 (related
funding is on research, education, and knowledge systems) and Layer 2 (production systems).
This results in limited SAI funding on other important aspects, specifically innovations in Layer
3 (conservation, protection, and development of production factors such as soil & water).
3. Low levels of targeted subsidies to enable the adoption of SAI: Government agriculture
subsidy programs still focus largely on fertilizers and inputs that are intended to promote
productivity. Repurposing these subsidies to focus on subsidies for public goods related to
adoption of SAI related innovations could be useful. Tracking these subsidies for SAI at a global
scale as initiated by the OECD62, is likely to be very useful in advocating for these shifts.
Private companies
1. Low levels of SAI focus in crucial sub-sectors such as animal nutrition, animal health, crop
protection, fertilizers, and farm mechanization: These are large sub-sectors with
considerable private sector activity and innovation funding. But there are limited intentions
and funding is focused on integrating sustainability within these areas. In many cases,
sustainability funding lies outside the core R&D focus of companies, within the CSR teams
within the company. R&D and core innovation activity continues to focus on productivity and
economic efficiency as the main means of sustainability.
2. Limited proof of impact of technologies: While private corporations tend to state
sustainability intentions, there seems to be no assessment of eventual sustainability impact
of their technologies. Agri-businesses currently look at sustainability from two lens – one, the
sustainability of their own operations e.g., factories, offices, and so on and two, CSR funding
used to create positive social impact amongst farmers and other agricultural workers. The
framing of sustainability needs to be extended to include business divisions and R&D divisions
to ensure that a large fraction of the products and services released within the market by
companies drive sustainability outcomes in terms of the framework described in this study
i.e., a move from CSR to ESG.
PE/VC investors
1. Limited focus on environmental sustainability: Even while considering a broad definition of
SAI, only 1% of PE/VC funding in agriculture is considered as SAI related. This is largely because
there is a lack of startups that are focused on environmental sustainability, possibly because
of the lack of viable business models. Most startups receiving funding are focused on driving
61 The Annexure for this report has been published separately, which includes the list of experts consulted as well as eight detailed case studies 62 OECD (2021) Agricultural policy Monitoring and Evaluation 2021: Addressing the challenges facing food systems https://www.oecd-ilibrary.org/sites/05bd280b-en/index.html?itemId=/content/component/05bd280b-en#endnotea1z14

40
economic efficiency, productivity, and nutrition outcomes with very limited direct focus on
environmental sustainability. Since success and scalability of startups such as those focused
on soil nutrients, monitoring systems, and others can have a positive impact on the
environmental sustainability of agriculture, there remains a need to catalyse this space
through creating blended revenue models, putting a value on sustainability outcomes so that
more business models become viable. Having special purpose funds that can make it easier
for startups to succeed – such as working capital funds or accounts receivables-based lending
– can be very useful. Cross-cutting efforts will be needed from donors, consumers, and
governments.
Development Partners
1. Poor reporting of sustainability intentions: While most bilateral and multilateral agencies
have started keeping sustainability as a mandatory requirement on all projects and funding,
there is limited reporting and definitions of what constitutes sustainability. Analysis of SAI
funding and outcomes is challenging at this stage due to limited information and stated
intentions of development funding. Some Development Partners have developed frameworks
and indicators for innovation in SAI – in particular USAID through Feed the Future Sustainable
Intensification Innovation Lab has developed the framework used in this study (Musumba et
al., 2017; and www.sitoolkit.com) – but these are yet not widely adopted.
Finally, this study has also highlighted the lack of reporting and tracking of innovation and SAI related
data across funding sources. Agricultural innovation related funding is reported in a non-standardized
manner across sources making it difficult for any institution to track these funding flows. Initiatives
like ASTI have implemented large scale projects to track just research and science & technology spends
on a regular basis but have not always found it easy to maintain permanent funding. Tracking overall
innovation funding while including the private sector and adoption related spends would be a
mammoth task, and this will need to improve and made more efficient to enable periodic assessments
of the state of SAI funding.
4.3 Opportunities to improve funding for SAI
Creating a common view and definition around SAI. The first step to measuring SAI and funding in
SAI is to create a common framework to measure intention as well as the impact of agricultural
funding and agricultural innovation funding. While companies and investors have started indicating a
need for environmentally and socially sustainable agriculture, this has not translated into significant
changes, in part because of ambiguous definitions and non-standard metrics that are the norm today.
A common framework and measurement scale should be created by international institutions and
used by funders at the funding stage to signal overall sustainability of operations/funding. As an
example, GIIN’s metrics around measuring impact of agricultural programs could serves as a good
starting point for the industry would these need to be combined with common SAI related frameworks
such as the Sustainability Intensification Assessment Framework by Musumba et al. and Gliessman’s
(2015)5 principles of agroecological transition63 as well measured from a funders/innovators point of
view. The issue is being further considered by CoSAI through an international Taskforce.
63 Gliessman, S. R. 2015. Agroecology: The Ecology of Sustainable Food Systems, Third Edit. Taylor & Francis, Boca Raton.

41
Opportunities to improve data density for SAI. While implementing and mandating the use of a
common framework to tag and measure funding in SAI can take years, it is important that funders in
agricultural innovation improve data availability for their funding to improve baseline understanding
of agricultural funding even when seen through different definitions and frames. Funding by
governments in agriculture cut across multiple functional departments including agriculture,
education, environment, etc. as well as across different levels (federal, state, and local). Governments
have poor reporting standards, with most budgets not having the required detail to analyze intentions
around their programs. Similarly, funding by private companies, the second largest funder in
agricultural innovation have limited detail around their sustainability funds (R&D and non R&D). There
is a real need and opportunity to create reporting standards and protocols that allow high-quality
analysis of agricultural funding at a Global level.
Increase funding for projects that work on creating robust links between the public and private
sectors to create technologies/solutions that are likely to be scaled and commercialized. There is a
potential gap today between agricultural research conducted and the ability to translate this research
and resultant technologies to on ground impact. It is important for governments to engage the private
sector and implementation agencies in innovation and research projects from the beginning in order
to increase the chances of commercialization and impact. This transformation has already been seen
in EMBRAPA (Brazil) which aims to have ~40%64 of project funding directed towards productive
partnerships between private and public funders by 2023 and reduce funding on basic research.
Blended finance instruments also serve as an opportunity to leverage private capital in the agricultural
innovation system, while using public funds to address ‘public goods’ like the environment and social
goals65.
Translate private sector intentionality to impact through certification standards. Private sector
companies and startups can use SAI related certifications on new technologies to improve their
consumer appeal, especially in countries like Brazil where environmental activism is strong. Today,
most private companies state intentions around driving environmental and social sustainability since
it is strongly linked to their brand value. However, most sustainability measures are linked to their
own operations instead of the technologies being developed. This serves as an opportunity for
international organizations to develop certification standards on new technologies that can improve
brand value for these companies while parallelly improving innovation in SAI.
Building SAI sensitivity in private agri-businesses and their research teams. While large agri-
businesses have CSR and social innovation teams focused on driving sustainability, there is limited
nexus between these teams and R&D teams within the organization. Given the need to increase SAI
related challenges, mandatory sensitization trainings can be set by international organizations for
large agri-businesses and their R&D teams to improve discussions around sustainability.
Opportunity to transfer learnings from India and China to create a strong funding network for
startups/agri-tech in other Global South countries. China and India receive a disproportionate
majority of PE/VC funding in agriculture in the Global South. Countries such as Brazil, Mexico, South-
East Asian countries, and others have much to learn. There is an opportunity for international
64 Sourced from EMBRAPA. 65 Blended Finance Taskforce. 2020. “Better Finance, Better Food: Investing in the New Food and Land Use Economy.” London : NICFI, FOLU. https://www.blendedfinance.earth/s/Better-Finance-Better-Food-Investing-in-the-new-food-and-land-use-economy-pc86.pdf

42
organizations and institutions to set up collaborative platforms that enable the growth of agtech and
sustainable agriculture startups within these countries.
Finally, the study proposes a few raw ideas for governments, private sector stakeholders, and
institutions (donors and philanthropies) to improve SAI innovation funding reporting and
measurement. These are early thoughts and would benefit from getting refined in consultation with
experts.
Governments should focus on tracking and developing an internal understanding of their funding in
SAI. Current funding data on governments are tracked at a ministry and department level with no
standardized tracking on funding made towards sustainable agriculture. Governments should develop
databases and reporting systems around agricultural funding that cut across departments and
ministries in order to measure their own funding into sustainability. While in many cases governments
may not be directly incentivized to do so, interest groups and other civil society organizations can play
a strong role in pushing this agenda.
Private sector companies should move towards a standardized reporting of SAI related spends, with
larger sustainable companies using it to also signal business sustainability and an environmentally
friendly brand. While some large agricultural companies already signal environmental sustainability
intentions to their shareholders and consumers through press releases and related comments in their
annual reports, a more standardized measurement of their spends will provide a stronger signal to
funders as well as consumers around their intentions to push for a sustainable future. This can have
positive impacts on their brand, while also encouraging other private players to invest in innovation
for SAI.
Finally, the onus lies with Development Partners to create a common standard for measurement of
SAI funding as well as make sure that most, if not all of their agricultural innovation funding can be
classified as SAI. Philanthropies and development agencies have the funds, the network, and influence
to create a standard within the development sector for measuring SAI and SAI related innovation
funding. These institutions need to be the first mover, providing the benefits of measuring funding on
a common sustainability standard and then advocating for its use across all types of funders including
Global South governments, other international agencies, and private investors.

43
5. Concluding Remarks
This study represents, to the best of our knowledge, the first attempt to measure funding going
towards agricultural innovation in the Global South by Governments, the Private Sector, Development
Partners, and PE/VC investors – going beyond technical R&D to measure complementary funding in
scale-up and adoption and also the funding in innovation in policies, financial instruments, and social
institutions. In addition, this represents the first global attempt to measure the proportion of this
funding to SAI that has stated intentions of promoting environmental, social or human sustainability.
The study points to some striking patterns and trends. These include for example:
• The small share, 4.5% of the global south agriculture output, of funding that is focused on
innovation.
• The small share of innovation funding (<7%) that is explicitly focussed on delivering
environmental outcomes.
• The relatively low share of innovation funding aimed at Natural Resources Management
(critical for environmental sustainability and climate change) and also at post-harvest matters
(critical for reducing food loss and waste). While this report cannot determine the
‘appropriate’ level of funding in particular areas, it is striking, for example, that the level of
funding in innovation for post-harvest matters is less than a tenth of the funding in
Production and Farm Inputs.
The study also highlights the biggest funders of agricultural innovation for the Global South, who will
need to lead the changes required to promote sustainability:
• 60-70% of all funding is from Global South governments themselves – although this global
figure is dominated by the huge funding from the Chinese government.
• 20-25% of funding comes from private sector, where innovation funding is dominated by
relatively few large seeds, biotech, agrochemical and mechanization companies. Within this
PE/VC funding is small, but influential.
• 10-20% of funding is from Development Partners, of which about 70% is from bilateral grants,
led by the US and European donors. Multilaterals (international development banks and the
EU) provide a smaller share as grants (about 20% in this group) but leverage this through
much larger soft loans to governments. Philanthropies are relatively small (about 10% of all
Development Partner funding) but can be influential, e.g., BMGF.
In terms of methodology, three points are worth highlighting. First, while the study team parsed
hundreds of thousands of rows of funding data, the quality of data, the tagging of funding data into
various sustainability categories is far from perfect. This results in this study have been calculated
based on a combination of published data as well as information assumptions for the models built by
the study team. And hence these results should be taken as a starting point and should be refined
going forward. Second, there are competing definitions of sustainability and while this study adopts a
commonly accepted framework, the study also acknowledges that the result might have been slightly
different had a different definition been used. The third point is linked to the vital debate of whether
stated intentions or achieved outcomes should be counted when assessing the level of funding for

44
sustainable agriculture. The experience of the team has been that outcome information is almost
impossible to find at the global cross-cutting level that the study focuses and hence stated intentions
are not only more practical to focus on but might also be better in terms of framing the sustainable
agriculture funding debate going forward.
An important recommendation that emerges from the process of developing this study is the need to
fund more in creating a standardized approach to cataloguing, classifying, and measuring funding in
innovation in agriculture being made by different categories of funders globally. Such a common
standard of reporting agricultural innovation funding would go a long way in making future analysis
easier as well as more granular and would provide transparency about sustainability intensions and
incentives for change.


The Commission on Sustainable Agriculture
Intensification (CoSAI) brings together 21
Commissioners to influence public and private
support to innovation in order to rapidly scale
up sustainable agricultural intensification (SAI) in
the Global South.
For CoSAI, innovation means the development
and uptake of new ways of doing things – in
policy, social institutions and finance, as well as
in science and technology.
Contact us: [email protected]
wle.cgiar.org/cosai