funding and the future, michael birtwistle, ncvo
TRANSCRIPT
FUNDING AND THE FUTURE
18 NOVEMBER 2015
Michael Birtwistle, Senior Policy Officer

FUNDING
2

3
30.2 29.632.6
35.7 36.640.1 41.4 42.1 40.6 40.8 41.4 40.6 40.5 40.7
-28.8 29.031.4
33.7 33.2
37.7 38.9 38.9 39.4 40.1 39.6 39.3 39.3 39.1
2000/01 2001/02 2002/03 2003/04 2004/05 2005/06 2006/07 2007/08 2008/09 2009/10 2010/11 2011/12 2012/13 2013/14
INCOME
SPENDING
VOLUNTARY SECTOR HAS SEEN NO GROWTH IN SPENDING SINCE 2006/07Voluntary sector income and spending, 2000/01 to 2013/14 (£ billions, 2012/13 prices)Source: NCVO, TSRC, Charity Commission Note: Figures for 2013/14 are provisional
4
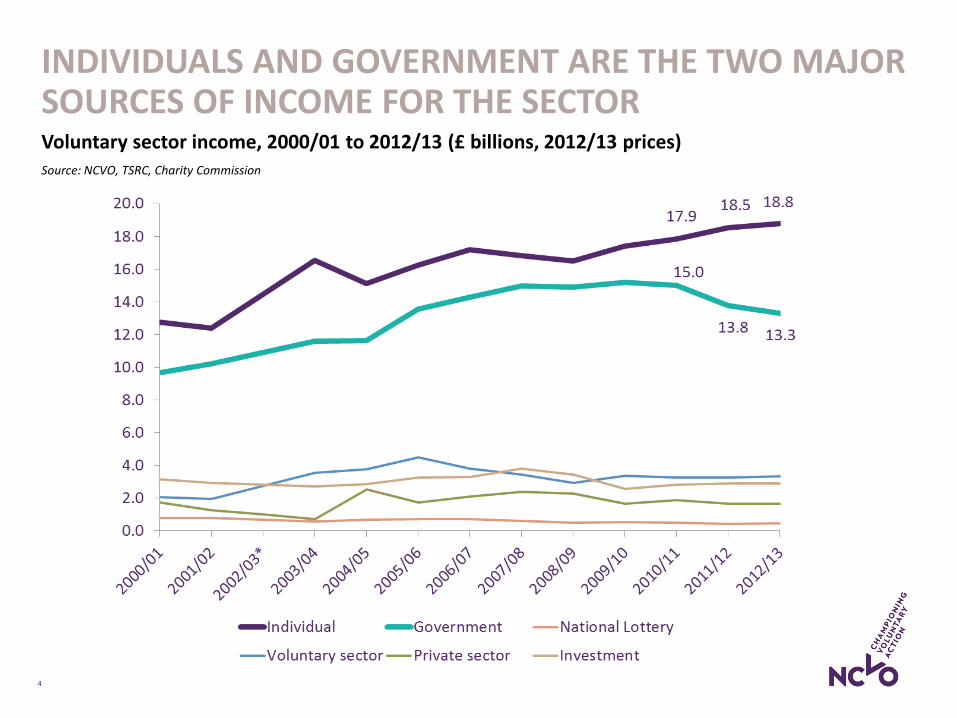
INDIVIDUALS AND GOVERNMENT ARE THE TWO MAJOR SOURCES OF INCOME FOR THE SECTORVoluntary sector income, 2000/01 to 2012/13 (£ billions, 2012/13 prices)Source: NCVO, TSRC, Charity Commission
5
0.2
-0.3
-0.4
-0.3
0.1
0.0
-0.7
-0.1
2009/10 2010/11 2011/12 2012/13
Central Government
Local Government
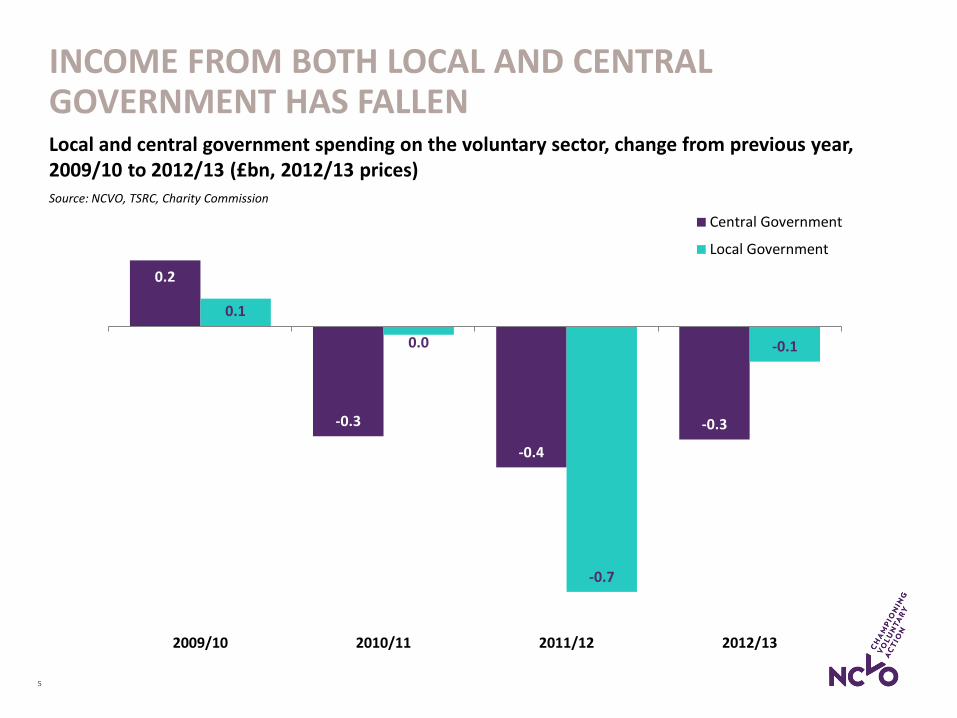
INCOME FROM BOTH LOCAL AND CENTRAL GOVERNMENT HAS FALLENLocal and central government spending on the voluntary sector, change from previous year, 2009/10 to 2012/13 (£bn, 2012/13 prices)Source: NCVO, TSRC, Charity Commission
6
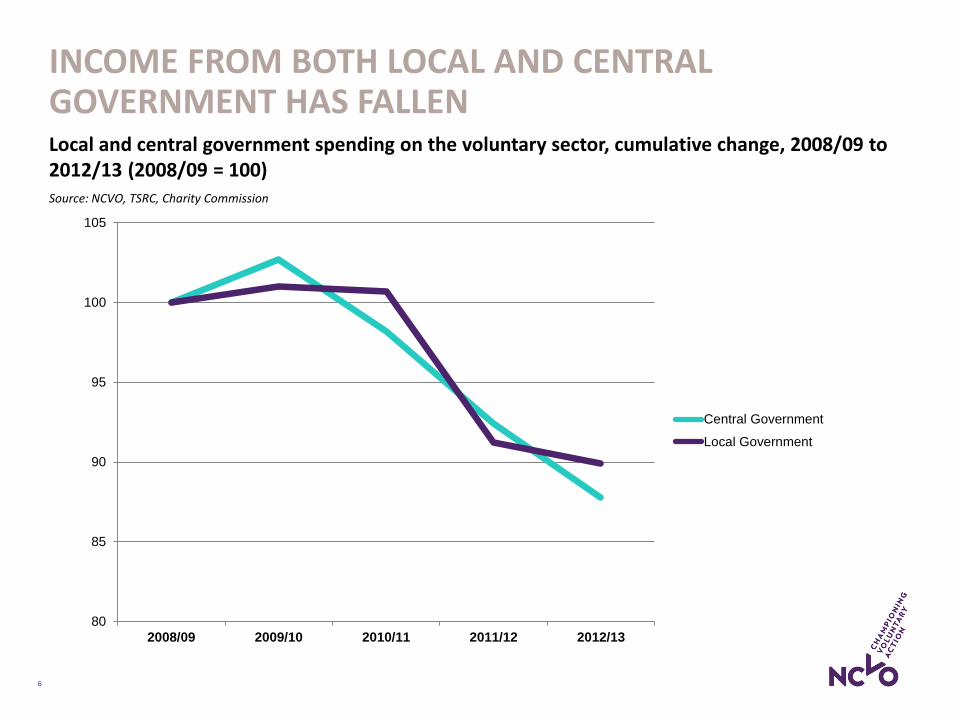
INCOME FROM BOTH LOCAL AND CENTRAL GOVERNMENT HAS FALLENLocal and central government spending on the voluntary sector, cumulative change, 2008/09 to 2012/13 (2008/09 = 100)Source: NCVO, TSRC, Charity Commission
80
85
90
95
100
105
2008/09 2009/10 2010/11 2011/12 2012/13
Central Government
Local Government

7
CHANGES IN GOVERNMENT INCOME DEPEND ON ORGANISATION SIZEGovernment spending on the voluntary sector, cumulative change, 2008/09 to 2012/13 (2008/09 = 100)Source: NCVO, TSRC, Charity Commission
40
50
60
70
80
90
100
110
120
2008/09 2009/10 2010/11 2011/12 2012/13
Minor + Small
Medium
Large
Major

8
4.9
6.0
2.2
4.8
12.1 12.3
12.1
11.1
0
5
10
15
20
00
/01
20
01
/02
20
02
/03
20
03
/04
20
04
/05
20
05
/06
20
06
/07
20
07
/08
20
08
/09
20
09
/10
20
10
/11
20
11
/12
20
12
/13
Government contracts
Government grants
GOVERNMENT GRANTS AND CONTRACTS HAVE CONTINUED TO FALL AS GOVERNMENT SPENDING IS CUTGovernment grant and contract income to the UK voluntary sector, 2000/01 to 2012/13 (£ billions, 2012/13 prices)Source: NCVO, TSRC, Charity Commission

9
THE INCREASE IN INCOME FROM INDIVIDUALS IS ENTIRELY FROM FEES FOR SERVICESVoluntary sector income from individuals, cumulative change, 2007/08 to 2012/13 (2007/08 = 100)Source: NCVO, TSRC, Charity Commission
60
80
100
120
140
160
180
2007/08 2008/09 2009/10 2010/11 2011/12 2012/13
Donations
Legacies
Fees for services
Fundraising

THE FUTURE
10

11
INCOME FROM INDIVIDUALS IS NOT MAKING UP FOR GOVERNMENT CUTSVoluntary sector income projections from individuals and government sources (£bn, 2012/13 prices)Source: NCVO, TSRC, Charity Commission
0
5
10
15
20
25
20
09/1
0
20
10/1
1
20
11/1
2
20
12/1
3
20
13/1
4
20
14/1
5
20
15/1
6
20
16/1
7
20
17/1
8
20
18/1
9
Individual income
Individual income (inflation adjustedprojections)
Individual income required to offsetcuts
Government income
Government income (inflationadjusted projections)

13
BARNET: THE GRAPH OF DOOM


LOCAL AUTHORITY FUNDING FOR CORE SERVICES
Source: Original graph from LGA interim report, amended to include LGA-estimated cuts in grants to local authorities following Spending Review 2015 (adjusted to reflect recent developments).

The State(Public Agencies)
The Market(Private Firms)
The Community(Households,
Families)
Public
Private
VoluntarySector
Source: Evers & Laville, 2004