funding for reserve component equipment: an analysis · pdf filefunding for reserve component...
TRANSCRIPT

FUNDING FOR RESERVE COMPONENT EQUIPMENT: AN ANALYSIS OF THE BUDGET PROCESS
A Report Prepared by the Federal Research Division, Library of Congress
under an Interagency Agreement with the Commission on the National Guard and Reserves
November 2007
Researcher: Seth L. Elan
Project Manager: Alice R. Buchalter
Federal Research Division Library of Congress Washington, D.C. 20540−4840 Tel: 202−707−3900 Fax: 202−707−3920 E-Mail: [email protected] Homepage: http://www.loc.gov/rr/frd/
p 59 Years of Service to the Federal Government p 1948 – 2007

Library of Congress – Federal Research Division Reserve Component Equipment Funding
PREFACE
This report analyzes the Department of Defense’s current system of tracking the funding
for reserve component equipment for the budget years 1997–2006. It evaluates the consistency of
data appearing in various official Department of Defense budget documents and congressional
appropriations, comparing promised and actual funding and determining what equipment was
purchased with the funding. Supporting this analysis are several tables containing data extracted
from the relevant budget documents. The report also describes efforts by various government
agencies to improve the transparency of the budget process. Finally, the report evaluates the
possibility of mandating separate budgetary accounts for reserve component equipment.
i

Library of Congress – Federal Research Division Reserve Component Equipment Funding
TABLE OF CONTENTS
PREFACE........................................................................................................................................ i
TRACKING FUNDING FOR NATIONAL GUARD AND RESERVE EQUIPMENT............... 1 Introduction............................................................................................................................... 1 Data Sources ............................................................................................................................. 2 Discussion of Financial Tables ................................................................................................. 2 Anomalies in the Data............................................................................................................... 5 Accounting for Actual Spending and Its Impact....................................................................... 6
GOVERNMENT BUDGET PROCESS TRANSPARENCY ........................................................ 6
CONCLUSION............................................................................................................................... 9
APPENDIX................................................................................................................................... 11
BIBLIOGRAPHY......................................................................................................................... 19
FIGURES Figure 1. Army Reserve Funding Comparison ............................................................................... 4 Figure 2. Army National Guard Funding Comparison ................................................................... 5
TABLES Table 1. Reserve Component Procurement Funding .................................................................... 13 Table 2. Summary of National Guard and Reserve Equipment Funding ..................................... 15 Table 3. National Guard and Reserve Equipment Procurement Funding..................................... 16 Table 4. Army National Guard and Army Reserve Equipment Procurement Funding................ 17 Table 5. National Guard and Reserve Equipment Funding (P–1R vs. NGRER) ......................... 18
iii

Library of Congress – Federal Research Division Reserve Component Equipment Funding
TRACKING FUNDING FOR NATIONAL GUARD AND RESERVE EQUIPMENT
Introduction
This report assesses the process by which equipment funding for the National Guard and
Reserve is budgeted. The process begins with the president’s budget, which is based on reserve
component equipment requirements identified by the parent services. The president’s budget
takes two forms: the P–1R, which is provided for information purposes only and is not associated
with actual appropriations, and the P–1, which contains the official parent service budget request
for equipment procurement. The next stage (and component) involves congressional additions,
commonly known as “adds” or “earmarks,” to active component accounts on behalf of reserve
components. The third stage/component consists of supplemental congressional appropriations,
which entail periodic but unusual legislation specifically designed to relieve shortfalls in reserve
component equipment. The final stage/component is the National Guard and Reserve Equipment
Appropriation (NGREA), which encompasses routine congressional equipment funding for
reserve components. These components provide reserve equipment funding for a given fiscal
year.
This report
1) Describes how reserve component appropriations are currently identified and tracked within budget documents and from one budget year to another;
2) Analyzes (for budget years 1997 to 2006) the correlation between funding “promised” to the reserve component in the “out years” and the actual amounts funded for those purposes in actual budget years;
3) Assesses the relative benefit of establishing separate procurement accounts for reserve component equipment; and
4) Identifies the means by which other federal organizations have sought to increase the transparency of the budget process to achieve particular policy aims.
The analysis in this report depends on tabular and graphic data. Tables 1–5 are found in
the Appendix; two figures appear in the body of the report. The narrative should be read in
tandem with these tables and figures for greater clarity.
1

Library of Congress – Federal Research Division Reserve Component Equipment Funding
Data Sources
In order to assess equipment procurement funding for the National Guard and Reserve,
the best resource is the Department of Defense’s Web site devoted to budget materials, which
can be found at http://www.defense.gov/comptroller/defbudget/fy2008/index.html.1 In the years
under discussion, 1996–2007, this site has provided greater disclosure of the various components
of Department of Defense spending each successive year. However, the task of tracking and
analyzing trends in spending on reserve components remains a major challenge, in particular
because the data lack consistency. The equipment funding data extracted from Department of
Defense budget documents appear in tables 1–5 in this report. The annual appropriations for the
Department of Defense, including conference committee documents, serve as another data
source.
Discussion of Financial Tables
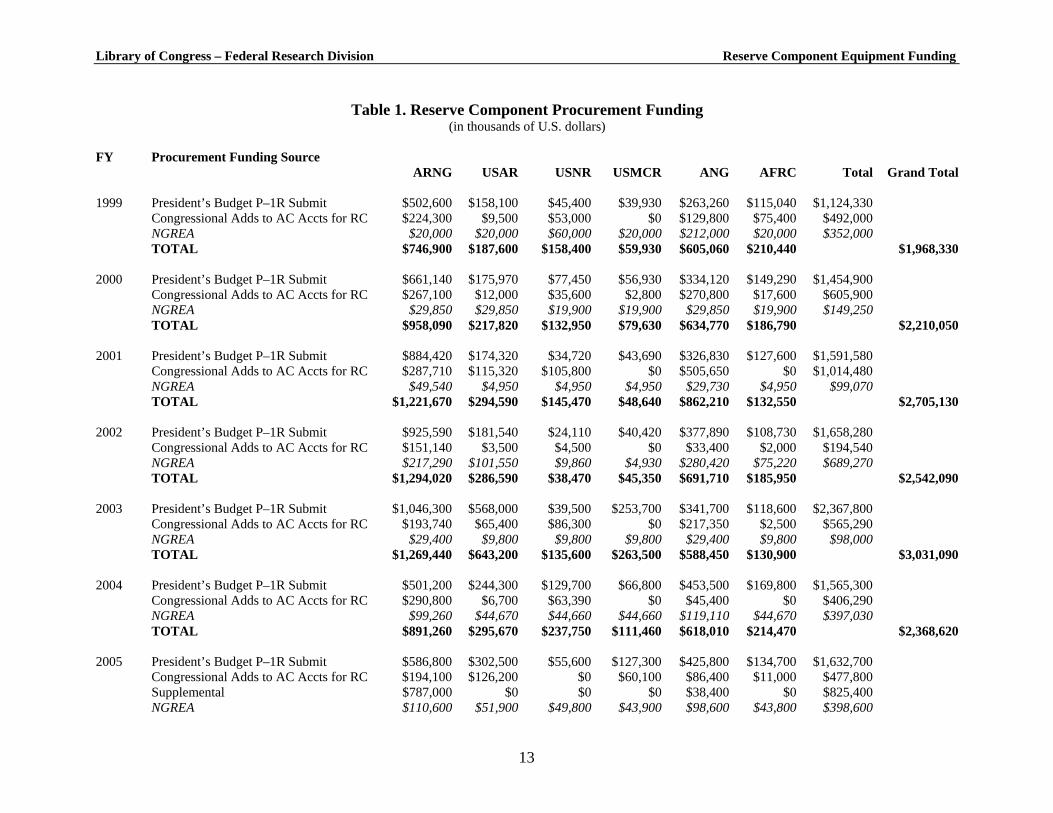
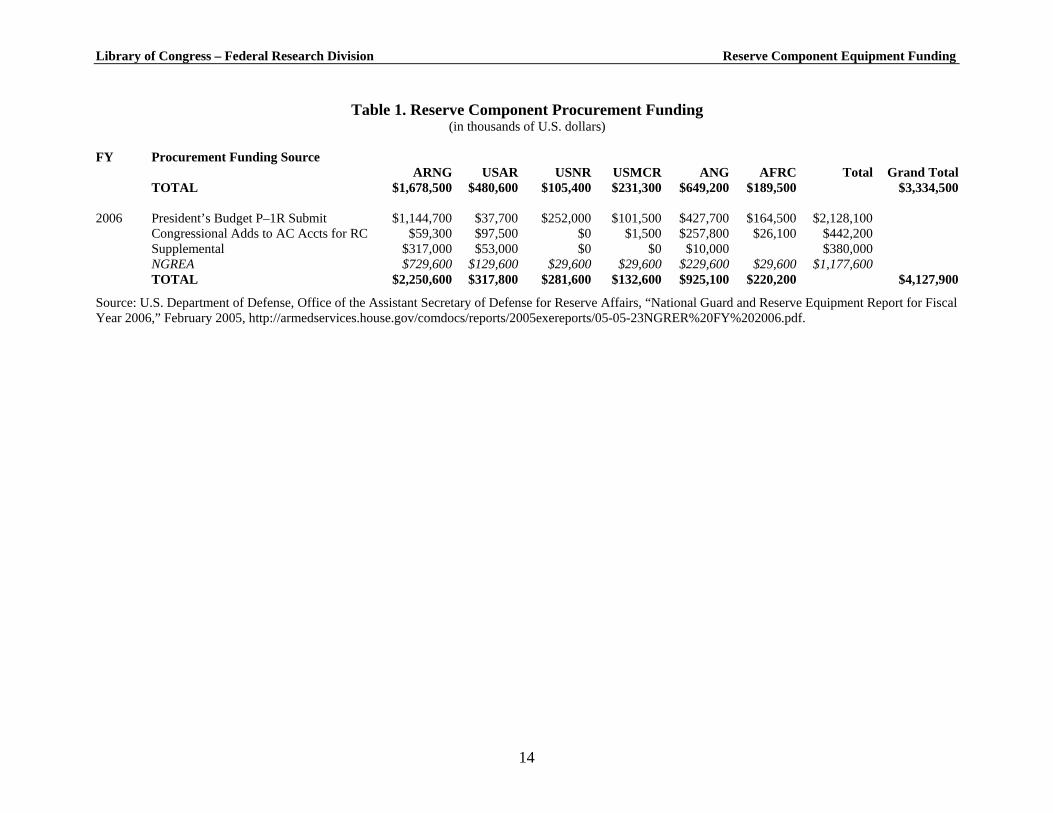
Table 1 (see Appendix) provides an overview of reserve component equipment
procurement appropriations from FY 1999 to FY 2006.2 Data were not available for FY 1997
and FY 1998. FY 1999 to FY 2004 budgets had three line items for each year: the P–1R,
congressional adds to active component accounts for reserve components, and the National
Guard and Reserve Equipment Appropriation (NGREA). FY 2005 and FY 2006 budgets had
four line items: the previous three items plus a supplemental appropriation. From FY 1999 to FY
2006, funding more than doubled to US$4.1 billion. However, FY 2006 funding reflects the
impact of US$1.3 billion of supplemental funding for National Guard equipment in Pub.L.No.
109–148, the FY 2006 Defense Appropriations Bill (the Leahy–Bond amendment).3
Table 2 (see Appendix) shows the P–1R’s summary of projected, current, and past
appropriations for spending on National Guard and Reserve equipment in the P–1R from FY
1 U.S. Department of Defense, Office of the Under Secretary of Defense (Comptroller), “Defense Budget Materials,” http://www.defense.gov/comptroller/defbudget/fy2008/index.html (accessed October 16, 2007). 2 U.S. Department of Defense, Office of the Assistant Secretary of Defense for Reserve Affairs, “National Guard and Reserve Equipment Report for Fiscal Year 2006,” February 2005, http://armedservices.house.gov/comdocs/ reports/2005exereports/05-05-23NGRER%20FY%202006.pdf. 3 U.S. Congress, Senate, Office of Senator Patrick Leahy, “Senate Passes Leahy–Bond Amendment to Replenish National Guard Equipment Stocks,” September 29, 2005, http://leahy.senate.gov/press/200509/092905b.html; and Pub.L.No. 109–148, Department of Defense, Emergency Supplemental Appropriations to Address Hurricanes in the Gulf of Mexico, and Pandemic Influenza Act, 2006, 119 Stat. 2680, December 30, 2005.
2

Library of Congress – Federal Research Division Reserve Component Equipment Funding
1999 to FY 2006.4 P–1Rs were not available for FY 1998 and FY 2000. For a given year’s P–
1R, the current presidential budget allocation is shown in bold and underlined. The figures below
the line represent projections. For comparability, the first column shows procurement funding,
including congressional adds and NGREA. The relationship between total procurement funding
and the P–1R has no clear pattern. Consistent underfunding occurred in FY 2005, for example,
but in other years, procurement funding generally exceeded the P–1R recommendation. This
judgment holds whether the comparisons are current, backward-looking, or forward-looking. The
funding in these years reflects the impact of congressional adds and the NGREA.
Table 3 (see Appendix) focuses on the NGREA component of the National Guard and
Reserve equipment procurement appropriations process from FY 1997 to FY 2006.5 A second
line is provided for FY 2004 because FY 2004 numbers were substantially revised retroactively
in FY 2006 budget materials. The table tracks the progression of the NGREA account from the
P–1R and the P–1 to congressional deliberation. In the case of the P–1R and P–1, separate
breakouts are provided for Reserve and National Guard funding. The congressional deliberation
section displays House, Senate, and conference committee totals. As the table highlights, no
disparities exist between the P–1R and P–1 for FY 1999 through FY 2006. Only in FY 1997 and
FY 1998 did disparities exist in total funding for reserve equipment. In FY 1997, funding in the
P–1 was 8 percent lower, and in FY 1998, it was 1 percent higher than that projected in the P–
1R. From FY 1998 to FY 2005, the funding results from congressional conference proceedings
were remarkably similar to P–1 figures. During this period, a 9 percent lower conference funding
result in FY 2001 was the largest disparity noted (see table 3). Also during this period, only in
2001 did the conference committee reduce the P–1 appropriation figure by a significant US$1
billion amount. This reduction presumably was offset by US$1.3 billion of supplemental funding
from the Leahy–Bond amendment.6
As table 3 indicates, in general the conference committee settled on appropriations close
to the P–1 figures, even though appropriations stipulated by the preceding House and Senate
versions of legislation sometimes differed widely. For example, in 2004 the House proposed
4 U.S. Department of Defense, Office of the Under Secretary of Defense (Comptroller), “Procurement Programs (P– 1R),” http://www.defense.gov/comptroller/defbudget/fy2008/index.html (accessed October 16, 2007). 5 “Defense Budget Materials” and Department of Defense appropriations acts for fiscal years 1997 to 2006, available through Library of Congress, THOMAS Web site, http://thomas.loc.gov. 6 “Senate Passes Leahy–Bond Amendment to Replenish National Guard Equipment Stocks,” and Pub.L.No. 109– 148.
3

Library of Congress – Federal Research Division Reserve Component Equipment Funding
NGREA spending of US$100 million, while the Senate proposed US$700 million. The
conference committee split the difference at US$400 million, close to the US$397 million figure
in the P–1.
Table 4 (see Appendix) focuses on NGREA funding for the Army National Guard and
Reserve exclusively. This focus allows examination of the premise that army components suffer
disproportionately from irregular funding. Table 4 indicates that there is scarcely any difference
between P–1R projections and P–1 budget totals. In fact, when adjustments are made to P–1 and
P–1R amounts in later fiscal years, they are invariably upward, as demonstrated by the data to
the right of the P–1 and P–1R charts in table 4. However, congressional action has led repeatedly
to significant shortfalls in funding for Army components; surpluses generally involve immaterial
amounts (see fig. 1 and Surplus/Shortfall section of table 4). These findings suggest that funding
for army components is more variable than for their counterparts in the other services.
Figure 1. Army Reserve Funding Comparison7
Army Reserve Equipment Funding (P1 vs. Conference Committee) (in thousands of U.S. dollars)
$0 $20,000 $40,000 $60,000 $80,000
$100,000 $120,000 $140,000
1998 1999 2000 2001 2002 2003 2004 2005 2006
FY
P1 Conference
The same comparison for Army National Guard equipment funding (P1 vs. Conference
Committee) is depicted visually in figure 2.
7 Figure created using data from table 4 (see Appendix).
4

Library of Congress – Federal Research Division Reserve Component Equipment Funding
Figure 2. Army National Guard Funding Comparison8
Army National Guard Equipment Funding (P1 vs. Conference Committee) (in thousands of U.S. dollars)
$0
$200,000
$400,000
$600,000
$800,000
1998 1999 2000 2001 2002 2003 2004 2005 2006
FY
P1 Conference
Anomalies in the Data
Data consistency is a pervasive problem. The president’s budget for National Guard and
Reserve equipment (known as P–1R) indicates not just the current fiscal year’s recommendation,
but also estimated spending over a multiyear period (both trailing and projected). It is not clear
what causes the fluctuations in past years’ figures. For example, for FY 2002, the P–1R provides
five different figures (see the 2002 row of table 2). Given that no consistent figure is provided, it
is difficult to pinpoint the P–1R recommendation for a given year. One approach is to rely on
budget documents stemming from the same budget year: i.e., the FY 2004 P–1R for the FY 2004
recommendation. In keeping with this approach, the relevant figures are highlighted and
underlined in table 2. However, these figures do not appear to be definitive. Specifically, they
differ from data found in the National Guard and Reserve Equipment Reports (NGRER). In the
NGRER summary chart, the line item for the P–1R recommendation (the first row for each year
in table 1) does not coincide with corresponding figures in the P–1R itself (see table 2).
Data for the NGREA are similarly inconsistent. Compare the figures for National Guard
and Reserve Equipment spending in the P–1R with the NGREA cite in the NGRER (see table 5,
Appendix).9
8 Figure created using data from table 4 (see Appendix). 9 There are two versions of the P–1R statistic in FY 2004 because the second is a revised number from a later document.
5
Library of Congress – Federal Research Division Reserve Component Equipment Funding
Accounting for Actual Spending and Its Impact
Once Congress has appropriated funds, it is difficult to determine how much of the
appropriated money has been spent and what equipment has been purchased. Documentation is
needed that tracks both of these items. Currently, each reserve component’s equipment funding
is contained in the respective parent service budget request. However, it might be useful if the
reserve components maintained separate accounts. Such an accounting system would make it
easier to track funding from proposal to procurement. Transparency and accountability would
both benefit.
GOVERNMENT BUDGET PROCESS TRANSPARENCY
The need for budget transparency is an active concern of the entire federal government.
On September 26, 2006, Congress enacted Pub.L.No. 109–282, the Federal Funding
Accountability and Transparency Act of 2006.10 The law requires that the Office of Management
and Budget establish a Web site to document each federal contract and grant in excess of
US$25,000. The Web site is required to go into operation by January 1, 2008.11 This new Web
site will join two others already introduced by the George W. Bush administration to improve the
transparency of the federal budget process:
• ExpectMore.gov evaluates the effectiveness of more than 9,000 individual programs, representing 98 percent of the budget, using the Program Assessment Rating Tool (PART).12 PART consists of 25 questions that seek to determine whether a program’s “purpose is clear and whether it is well designed to achieve its objectives,” whether it is required to achieve annual and long-term strategic goals, how the program is managed, and whether its results can be measured accurately.13 In 2007, 78 percent of programs were classified as “performing,” 3 percent were “ineffective,” and 19 percent were unable to demonstrate results.14
10 Pub.L.No. 109–282, Federal Funding Accountability and Transparency Act of 2006, 120 Stat. 1186, September 26, 2006.11 Garret Leigh Hatch, “The Federal Funding Accountability and Transparency Act: Background, Overview, and Implementation Issues,” Congressional Research Service, October 6, 2006, http://www.fas.org/sgp/crs/secrecy/ RL33680.pdf. 12 U.S. Executive Office of the President, Office of Management and Budget, “OMB: PART Assessments Improve Transparency and Accountability,” September 19, 2007, http://www.whitehouse.gov/omb/pubpress/2007/091907_ part.html. 13 U.S. Executive Office of the President, Office of Management and Budget, “The Program Assessment Rating Tool (PART),” http://www.whitehouse.gov/omb/expectmore/part.html (accessed October 10, 2007). 14 U.S. White House, “Getting to Results: 2007 PART Scores,” 2007, http://www.whitehouse.gov/omb/pubpress/ 2007/factsheet_part2007.pdf.
6

Library of Congress – Federal Research Division Reserve Component Equipment Funding
• Results.gov tracks agencies’ progress in moving toward the standards established in the President’s Management Agenda (PMA).15 The PMA consists of five government-wide goals, including two that relate to financial systems and the budget: “improved financial performance” and “budget and performance integration.”16 Improved financial performance refers to encouraging agencies to obtain clean audits in a timely manner.17
Budget and performance integration refers to taking program effectiveness into account when allocating resources.18 The PMA also includes nine agency-specific goals, including one that applies to the Department of Defense: “coordination of Veterans’ Affairs and defense programs and systems.”19 This initiative refers to encouraging the Department of Defense and the Department of Veterans Affairs to coordinate their health care programs and eliminate overlap.20
Soon after former Secretary of Treasury Paul O’Neill took office in President George W.
Bush’s first administration, he pledged to correct the federal government’s tradition of delayed
and inaccurate financial reporting.21 In April 2001, he compared the federal government’s
performance unfavorably with that of Alcoa Corporation, where he had just retired as chairman:
“In the organization that I left in December, it took us 2-1/2 days to close our financial books at
more than 300 locations in 36 countries. It takes the Federal Government five months to close
our books; and then the auditors give us a qualified opinion. This is not the stuff of
excellence.”22
The PMA was designed in part to address this deficiency. The U.S. Department of
Agriculture (USDA) and the Department of Treasury provide two early case studies in budget
reform inspired by the PMA. In FY 2002, the Department of Agriculture produced accurate and
timely financial statements for the first time in its 140-year history.23 Using mostly internal
resources, USDA depended on setting clear goals and a quick timetable for progress, identifying
15 U.S. White House, “Fact Sheet: Achieving Greater Transparency and Accountability in Government,” September 26, 2006, http://www.fas.org/sgp/news/2006/09/wh092606-fs.html. 16 U.S. White House, “Frequently Asked Questions about the PMA,” http://www.whitehouse.gov/results/agenda/ faq.html (accessed September 28, 2007). 17 U.S. Executive Office of the President, Office of Management and Budget, “Improved Financial Performance,” The President’s Management Agenda, Fiscal Year 2002, http://www.whitehouse.gov/omb/budget/fy2002/mgmt.pdf. 18 U.S. Executive Office of the President, Office of Management and Budget, “Budget and Performance Integration,” The President’s Management Agenda, Fiscal Year 2002, http://www.whitehouse.gov/omb/budget/fy 2002/mgmt.pdf. 19 “Frequently Asked Questions about the PMA.” 20 U.S. Executive Office of the President, Office of Management and Budget, “Coordination of VA and DoD Programs and Systems,” The President’s Management Agenda, Fiscal Year 2002, http://www.whitehouse.gov/omb/ budget/fy2002/mgmt.pdf. 21 U.S. Department of Treasury, “Treasury Secretary Paul O’Neill to the Economic Club of New York,” April 19, 2001, https://www.ustreas.gov/press/releases/po209.htm.22 “Treasury Secretary Paul O’Neill to the Economic Club of New York.”
7

Library of Congress – Federal Research Division Reserve Component Equipment Funding
responsible officials and holding them accountable, and emphasizing leadership and talent.24 In a
similar FY 2002 initiative, the Department of Treasury was able to reduce the time required to
close monthly books from 20 days to three days and to produce an annual Performance and
Accountability Report (PAR) from five months to 45 days.25 The PAR requires agencies to
document their progress in achieving long-term objectives with respect to their programs,
management, and budget.26 In FY 2006, all federal agencies submitted their PARs by the 45-day
accelerated deadline, and 18 out of 24 agencies received clean audit opinions.27 Auditors refused
to endorse the submissions from the Departments of Defense, Energy, Homeland Security, and
State; serious weaknesses found in the Department of Transportation’s submission resulted in a
qualified opinion.28
The Department of Homeland Security (DHS), in particular, has struggled with
consolidating the financial reporting of disparate component agencies.29 It abandoned a system
designed to modernize financial reporting known as eMerge2 after spending US$52 million on
the failed system.30 David Norquist, DHS’s chief financial officer, testified before Congress that
his department would seek to rectify shortcomings by relying on its Internal Controls over
Financial Reporting (ICOFR) Playbook.31 ICOFR compiles the best practices for internal
controls observed at other federal agencies.32
23 U.S. White House, “USDA’s First Clean Audit,” http://www.whitehouse.gov/results/agenda/howthey didit-usda.html (accessed October 1, 2007). 24 “USDA’s First Clean Audit.” 25 U.S. White House, “Department of Treasury: Accelerated Reporting of Financial Statements,” http://www.white house.gov/results/agenda/howtheydidit-treasury.html (accessed October 1, 2007). 26 U.S. National Aeronautics and Space Administration, “Performance and Accountability Report: Fiscal Year 2004,” http://www.nasa.gov/pdf/83171main_PAR1.pdf.27 Mary Mosquera, “Agencies Improve Financial Rigor,” Government Computer News, November 17, 2006, http://www.nexis.com. 28 “Agencies Improve Financial Rigor.” 29 Brittany R. Ballenstedt, “Lawmakers Urge DHS to Speed up Financial Consolidation,” Government Executive, June 29, 2007, http://www.govexec.com/dailyfed/0607/062907b1.htm.30 Ballenstedt. 31 U.S. Congress, House of Representatives, Committee on Government Reform, Subcommittee on Government Management, Finance and Accountability, Hearing on DHS Financial Management, 109th Cong., 2d sess., September 13, 2006 (Statement of David Norquist, Chief Financial Officer, Department of Homeland Security), http://www.nexis.com. 32 Hearing on DHS Financial Management.
8

Library of Congress – Federal Research Division Reserve Component Equipment Funding
CONCLUSION
Tracking funding requests for equipment for reserve components is a challenging task for
several reasons. First, the entire process lacks transparency. Second, although overall funding
statistics are available, they do not appear to be consistent or definitive. Third, reserve
component funding requests are contained in parent service budgets, making them difficult to
track independently. As a result, it is all but impossible to determine the impact of funding on
actual equipment procurement. In order to resolve these issues, it might make sense for each
reserve component to be given independent budget authority. The associated overhead expense
would seem to be justified by the improvement in transparency, accountability, and ultimately
military readiness.
The premise that the National Guard and Reserve were shortchanged regarding
equipment funding for the budget years 1997–2006 could not be demonstrated conclusively for
all components. However, there is some evidence that the Army Reserve and Army National
Guard received less from the Congress in miscellaneous equipment funding than they had been
led to expect by the president’s budget (either P–1R or P–1). The lack of consistent data
precludes a definitive finding.
Despite the increasing amount of disclosure in Department of Defense budget documents
during the past 10 years, it is noteworthy that the department failed to obtain a clean audit
opinion as recently as FY 2006, even though many other agencies received clean audits during
the current administration. This deficiency could be used as a selling point for improving the
transparency of the equipment budget process for the National Guard and Reserve.
9
Library of Congress – Federal Research Division Reserve Component Equipment Funding
APPENDIX
11
Library of Congress – Federal Research Division Reserve Component Equipment Funding
Table 1. Reserve Component Procurement Funding (in thousands of U.S. dollars)
FY Procurement Funding Source ARNG USAR USNR USMCR ANG AFRC Total Grand Total
1999 President’s Budget P–1R Submit Congressional Adds to AC Accts for RC NGREA TOTAL
$502,600 $224,300
$20,000 $746,900
$158,100 $9,500
$20,000 $187,600
$45,400 $53,000 $60,000
$158,400
$39,930 $0
$20,000 $59,930
$263,260 $129,800 $212,000 $605,060
$115,040 $75,400 $20,000
$210,440
$1,124,330 $492,000 $352,000
$1,968,330
2000 President’s Budget P–1R Submit Congressional Adds to AC Accts for RC NGREA TOTAL
$661,140 $267,100
$29,850 $958,090
$175,970 $12,000 $29,850
$217,820
$77,450 $35,600 $19,900
$132,950
$56,930 $2,800
$19,900 $79,630
$334,120 $270,800
$29,850 $634,770
$149,290 $17,600 $19,900
$186,790
$1,454,900 $605,900 $149,250
$2,210,050
2001 President’s Budget P–1R Submit Congressional Adds to AC Accts for RC NGREA TOTAL
$884,420 $287,710
$49,540 $1,221,670
$174,320 $115,320
$4,950 $294,590
$34,720 $105,800
$4,950 $145,470
$43,690 $0
$4,950 $48,640
$326,830 $505,650
$29,730 $862,210
$127,600 $0
$4,950 $132,550
$1,591,580 $1,014,480
$99,070 $2,705,130
2002 President’s Budget P–1R Submit Congressional Adds to AC Accts for RC NGREA TOTAL
$925,590 $151,140 $217,290
$1,294,020
$181,540 $3,500
$101,550 $286,590
$24,110 $4,500 $9,860
$38,470
$40,420 $0
$4,930 $45,350
$377,890 $33,400
$280,420 $691,710
$108,730 $2,000
$75,220 $185,950
$1,658,280 $194,540 $689,270
$2,542,090
2003 President’s Budget P–1R Submit Congressional Adds to AC Accts for RC NGREA TOTAL
$1,046,300 $193,740
$29,400 $1,269,440
$568,000 $65,400
$9,800 $643,200
$39,500 $86,300
$9,800 $135,600
$253,700 $0
$9,800 $263,500
$341,700 $217,350
$29,400 $588,450
$118,600 $2,500 $9,800
$130,900
$2,367,800 $565,290
$98,000 $3,031,090
2004 President’s Budget P–1R Submit Congressional Adds to AC Accts for RC NGREA TOTAL
$501,200 $290,800
$99,260 $891,260
$244,300 $6,700
$44,670 $295,670
$129,700 $63,390 $44,660
$237,750
$66,800 $0
$44,660 $111,460
$453,500 $45,400
$119,110 $618,010
$169,800 $0
$44,670 $214,470
$1,565,300 $406,290 $397,030
$2,368,620
2005 President’s Budget P–1R Submit Congressional Adds to AC Accts for RC Supplemental NGREA
$586,800 $194,100 $787,000 $110,600
$302,500 $126,200
$0 $51,900
$55,600 $0 $0
$49,800
$127,300 $60,100
$0 $43,900
$425,800 $86,400 $38,400 $98,600
$134,700 $11,000
$0 $43,800
$1,632,700 $477,800 $825,400 $398,600
13
Library of Congress – Federal Research Division Reserve Component Equipment Funding
Table 1. Reserve Component Procurement Funding (in thousands of U.S. dollars)
FY Procurement Funding Source ARNG USAR USNR USMCR ANG AFRC Total Grand Total
TOTAL $1,678,500 $480,600 $105,400 $231,300 $649,200 $189,500 $3,334,500
2006 President’s Budget P–1R Submit $1,144,700 $37,700 $252,000 $101,500 $427,700 $164,500 $2,128,100 Congressional Adds to AC Accts for RC $59,300 $97,500 $0 $1,500 $257,800 $26,100 $442,200 Supplemental $317,000 $53,000 $0 $0 $10,000 $380,000 NGREA $729,600 $129,600 $29,600 $29,600 $229,600 $29,600 $1,177,600 TOTAL $2,250,600 $317,800 $281,600 $132,600 $925,100 $220,200 $4,127,900
Source: U.S. Department of Defense, Office of the Assistant Secretary of Defense for Reserve Affairs, “National Guard and Reserve Equipment Report for Fiscal Year 2006,” February 2005, http://armedservices.house.gov/comdocs/reports/2005exereports/05-05-23NGRER%20FY%202006.pdf.
14

Library of Congress – Federal Research Division Reserve Component Equipment Funding
Table 2. Summary of National Guard and Reserve Equipment Funding
President's Budget (P–1R)
(in thousands of U.S. dollars)
FY 1998 1999 2000 2001 2002 2003 2004 2005 2006
Procurement Funding*
$1,968,330 $2,210,020 $2,705,140 $2,542,090 $3,031,090 $2,368,620 $1,632,600
1998 NA NA NA NA NA
1999 $1,785,000 $1,363,600 $1,427,300 $1,481,600 $1,780,900 $2,205,300
2000 NA NA NA NA NA NA NA
2001
$2,181,000 $2,280,600 $1,829,900 $1,877,400 $3,072,300 $2,451,500 $2,526,100
2002
$1,962,900 $2,315,200 $1,897,100
2003
$1,914,400 $2,603,600 $2,630,700 $2,140,000 $2,197,700 $2,363,600
2004
$2,333,700 $2,454,700 $1,928,800 $2,089,200 $3,480,500
2005
$2,393,600 $2,136,600 $2,026,200 $3,235,600
2006
$2,260,000 $2,599,500 $2,488,000
*including Congressional adds, NGREA
Surplus/Shortfall
1999 2000 2001 2002 2003 2004 2005
$604,730 $782,720
$1,223,540 $761,190 $825,790
–$212,670 –$70,580 $875,240 $664,690 –$41,210 –$82,880
–$893,500
$247,120 $389,940 $644,990
$790,740 –$61,510 $400,390 $228,620
–$565,100
$208,390 $576,390 $439,820
–$456,600
$637,490 $232,020
–$393,600 $108,620
–$966,900
Source: U.S. Department of Defense, Office of the Under Secretary of Defense (Comptroller), “Procurement Programs (P–1R),” http://www.defense.gov/comptroller/ defbudget/fy2008/index.html (accessed October 16, 2007).
15

Library of Congress – Federal Research Division Reserve Component Equipment Funding
Table 3. National Guard and Reserve Equipment Procurement Funding (in thousands of U.S. dollars)
Fiscal Year House Senate Conference P–1 P–1R (President's budget/NG&RE) Total Reserve National Guard Total Reserve National Guard
1997 NA NA NA $717,300 $437,200 $280,100 $781,000 $353,000 $427,900 1998 $850,000 $653,000 $653,000 $647,000 $275,300 $371,700 $642,100 $201,600 $440,400 1999 $120,000 $500,000 $352,000 $352,000 $120,000 $232,000 $352,000 $100,000 $252,000 2000 NA NA NA $149,200 $89,500 $59,700 $149,200 $69,600 $79,500 2001 NA $150,000 $100,000 $109,700 $19,800 $89,900 $109,700 $15,000 $94,900 2002 $501,485 $560,505 $699,130 $695,100 $193,000 $502,100 $695,100 $188,000 $507,200 2003 NA $130,000 $100,000 $103,000 $39,200 $63,800 $103,000 $29,400 $73,600 2004 $100,000 $700,000 $400,000 $397,000 $179,300 $217,700 $397,000 $134,400 $262,600 2004 (FY 06) NA NA NA $447,100 $208,800 $238,300 $447,100 $154,100 $293,100 2005 NA $500,000 $350,000 $349,900 $159,300 $190,600 $349,900 $119,400 $230,500 2006 NA $422,000 $180,000 $1,194,000 $218,400 $975,600 $1,194,000 $188,800 $1,005,200
Conference vs. P–1 Percentage P–1 vs. P–1R Percentage Difference Difference
1998 $6,000 1% –$63,700 –8% 1999 $0 0% $4,900 1% 2000 NA NA $0 NA 2001 –$9,700 –9% $0 NA 2002 $4,030 1% $0 NA 2003 –$3,000 –3% $0 NA 2004 $3,000 1% $0 NA 2005 $100 0% $0 NA 2006 –$1,014,000 –290% $0 NA
Source: U.S. Department of Defense, Office of the Under Secretary of Defense (Comptroller), “Defense Budget Materials,” http://www.defense.gov/comptroller/ defbudget/fy2008/index.html (accessed October 16, 2007); and U.S. Congress, “Department of Defense Appropriations Bill,” http://thomas.loc.gov (accessed October 2007).
16

Library of Congress – Federal Research Division Reserve Component Equipment Funding
Table 4. Army National Guard and Army Reserve Equipment Procurement Funding
P–1 Adjustment to P–1 P–1R (President's budget/NG&RE) Adjustment to P–1R Total Army Army Total Army Army Total Army Army Total Army Army
Fiscal Reserve National Reserve National Reserve National Reserve National Year Guard Guard Guard Guard 1997 $152,800 $91,500 $61,300 $214,500 $113,700 $100,800 1998 $142,500 $73,700 $68,800 $142,500 $73,700 $68,800 1999 $40,000 $20,000 $20,000 $40,000 $20,000 $20,000 2000 $59,600 $29,800 $29,800 $59,600 $29,800 $29,800 2001 $54,400 $5,000 $49,400 $54,400 $5,000 $49,400 2002 $321,200 $102,300 $218,900 $321,200 $102,300 $218,900 2003 $39,200 $9,800 $29,400 $41,700 $31,900 $39,200 $9,800 $29,400 $41,700 $31,900 2004 $153,700 $44,800 $108,900 $171,900 $56,700 $115,200 $153,700 $44,800 $108,900 $172,000 $56,700 $115,300 2005 $134,500 $39,800 $94,700 $135,900 $96,100 $134,400 $39,800 $94,600 $135,900 $96,100 2006 $875,600 $129,600 $746,000 $875,600 $129,600 $746,000
Congressional Action Surplus/Shortfall (Conference vs. P–1)
Army Reserve Army National Guard Army Army National
House Senate Conference House Senate Conference Reserve Guard
1997 NA NA NA NA NA NA 1997 NA NA
1998 $20,000 $65,000 $75,000 $43,000 $140,000 $70,000 1998 $1,300 $1,200
1999 $20,000 $45,000 $20,000 $20,000 $72,000 $20,000 1999 $0 $0
2000 NA $20,000 $5,000 NA $50,000 $50,000 2000 –$24,800 $20,200
2001 NA $15,000 $10,000 NA $15,000 $10,000 2001 $5,000 –$39,400
2002 NA $15,000 $10,000 NA $40,000 $30,000 2002 –$92,300 –$188,900
2003 NA $15,000 $10,000 NA $40,000 $30,000 2003 $200 $600
2004 $15,000 $50,000 $45,000 $20,000 $240,000 $100,000 2004 $200 –$8,900
2005 NA $50,000 $40,000 NA $150,000 $95,000 2005 $200 $300
2006 NA NA $30,000 NA NA $30,000 2006 –$99,600 –$716,000
Source: U.S. Department of Defense, Office of the Under Secretary of Defense (Comptroller), “Defense Budget Materials,” http://www.defense.gov/comptroller/Defbudget/ fy2008/index.html (accessed October 16, 2007); and U.S. Congress, “Department of Defense Appropriations Bill,” http://thomas.loc.gov (accessed October 2007).
17

Library of Congress – Federal Research Division Reserve Component Equipment Funding
Table 5. National Guard and Reserve Equipment Funding (P–1R vs. NGRER) (in thousands of U.S. dollars)
Fiscal Year P–1R Version NGRER Version 1999 $352,000 $352,000 2000 $149,200 $149,250 2001 $109,700 $99,070 2002 $695,100 $689,270 2003 $103,000 $98,000 2004 $397,000/$447,100 $397,030 2005 $349,900 $398,600 2006 $1,194,000 $1,177,600 Source: U.S. Department of Defense, Office of the Under Secretary of Defense (Comptroller), “Procurement Programs (P–1R),” http://www.defense.gov/comptroller/defbudget/fy2008/index.html (accessed October 16, 2007); and U.S. Department of Defense, Office of the Assistant Secretary of Defense for Reserve Affairs, “National Guard and Reserve Equipment Report for Fiscal Year 2006,” February 2005, http://armedservices.house.gov/comdocs/reports/2005exereports/05-05-23NGRER% 20FY%202006.pdf.
18

Library of Congress – Federal Research Division Reserve Component Equipment Funding
BIBLIOGRAPHY
Ballenstedt, Brittany R. “Lawmakers Urge DHS to Speed up Financial Consolidation.” Government Executive. June 29, 2007. http://www.govexec.com/dailyfed/0607/ 062907b1.htm.
Hatch, Garret Leigh. “The Federal Funding Accountability and Transparency Act: Background, Overview, and Implementation Issues.” Congressional Research Service. October 6, 2006. http://www.fas.org/sgp/crs/secrecy/RL33680.pdf.
Mosquera, Mary. “Agencies Improve Financial Rigor.” Government Computer News. November 17, 2006. http://www.nexis.com.
U.S. Congress. House of Representatives. Committee on Oversight. Subcommittee on Government Reform. Hearing on DHS Financial Management. 109th Cong., 2d sess., September 13, 2006 (Statement of David Norquist, Chief Financial Officer, Department of Homeland Security). http://www.nexis.com.
U.S. Congress. Senate. Office of Senator Patrick Leahy. “Senate Passes Leahy–Bond Amendment to Replenish National Guard Equipment Stocks.” September 29, 2005. http://leahy.senate.gov/press/200509/092905b.html.
U.S. Department of Defense. Office of the Assistant Secretary of Defense for Reserve Affairs. “National Guard and Reserve Equipment Report for Fiscal Year 2006.” February 2005. http://armedservices.house.gov/comdocs/reports/2005exereports/05-05-23NGRER% 20FY%202006.pdf.
U.S. Department of Defense. Office of the Under Secretary of Defense (Comptroller). “Defense Budget Materials.” http://www.defense.gov/comptroller/defbudget/fy2008/index.html (accessed October 16, 2007).
U.S. Department of Defense. Office of the Under Secretary of Defense (Comptroller). “Procurement Programs (P–1R).” http://www.defense.gov/comptroller/defbudget/fy2008/ index.html (accessed October 16, 2007.
U.S. Department of the Treasury. “Treasury Secretary Paul O’Neill to the Economic Club of New York.” April 19, 2001. https://www.ustreas.gov/press/releases/po209.htm.
U.S. Executive Office of the President. Office of Management and Budget. “Budget and Performance Integration.” The President’s Management Agenda. Fiscal Year 2002. http://www.whitehouse.gov/omb/budget/fy2002/mgmt.pdf.
U.S. Executive Office of the President. Office of Management and Budget. “Coordination of VA and DoD Programs and Systems.” The President’s Management Agenda. Fiscal Year 2002. http://www.whitehouse.gov/omb/budget/fy2002/mgmt.pdf.
19

Library of Congress – Federal Research Division Reserve Component Equipment Funding
U.S. Executive Office of the President. Office of Management and Budget. “Improved Financial Performance.” The President’s Management Agenda. Fiscal Year 2002. http://www.white house.gov/omb/budget/fy2002/mgmt.pdf.
U.S. Executive Office of the President. Office of Management and Budget. “OMB: PART Assessments Improve Transparency and Accountability.” September 19, 2007. http://www.whitehouse.gov/omb/pubpress/2007/091907_part.html.
U.S. Executive Office of the President. Office of Management and Budget. “The Program Assessment Rating Tool (PART).” http:www.whitehouse.gov/omb/expectmore/part.html (accessed October 10, 2007).
U.S. National Aeronautics and Space Administration. “Performance and Accountability Report: Fiscal Year 2004.” http://www.nasa.gov/pdf/83171main_PAR1.pdf.
U.S. White House. “Department of Treasury: Accelerated Reporting of Financial Statements.” http://www.whitehouse.gov/results/agenda/howtheydidit-treasury.html (accessed October 1, 2007).
U.S. White House. “Fact Sheet: Achieving Greater Transparency and Accountability in Government.” September 26, 2006. http://www.fas.org/sgp/news/2006/09/wh092606-fs.html.
U.S. White House. “Frequently Asked Questions about the PMA.” http://www.whitehouse.gov/ results/agenda/faq.html (accessed September 28, 2007).
U.S. White House. “Getting to Results: 2007 PART Scores.” 2007. http://www.whitehouse.gov/ omb/pubpress/2007/factsheet_part2007.pdf.
U.S. White House. “USDA’s First Clean Audit.” http://www.whitehouse.gov/results/agenda/how theydidit-usda.html (accessed October 1, 2007).
20