fungi divesity
TRANSCRIPT

8/11/2019 Fungi Divesity
http://slidepdf.com/reader/full/fungi-divesity 1/17
898
American Journal of Botany 99(5): 898–914. 2012.
American Journal of Botany 99(5): 898–914, 2012; http://www.amjbot.org/ © 2012 Botanical Society of America
In both natural and agricultural ecosystems, plants form sym-biotic relationships with diverse and ecologically important fungi(Petrini, 1996; Agrios, 2005). Although the most widely recog-
nized fungal symbionts are mycorrhizal fungi and plant patho-gens, members of every major lineage of land plants (including
bryophytes, ferns and their allies, conifers, and angiosperms) alsoharbor fungal endophytes—highly diverse, horizontally trans-mitted fungi that live within overtly healthy aboveground tis-
sues such as leaves and stems (i.e., class 3 endophytes, sensuRodriguez et al., 2009; e.g., Carroll, 1986; Clay, 1990; Rodrigues,1994; Dobranic et al., 1995; Fisher, 1996; Faeth and Hammon,1997; Davis et al., 2003; Arnold and Lutzoni, 2007; Higginset al., 2007; Davis and Shaw, 2008; Hoffman and Arnold, 2008;U’Ren et al., 2010). In contrast to the systemic and verticallytransmitted endophytes associated with many cool-seasongrasses (class 1 endophytes, Rodriguez et al., 2009), endophytesof most plants form highly localized infections, with hyphaeusually growing intercellulary (but occurring within single epi-dermal cells in some host species; Petrini, 1991; Stone et al.,2000). Plant tissues accumulate fungal infections as a functionof exposure to inoculum, which often is positively associatedwith tissue age; thus, a single mature leaf can frequently harbor
numerous endophyte species (Carroll, 1995; Lodge et al., 1996;Gamboa and Bayman, 2001; Arnold et al., 2003). Althoughmost endophytes are thought to be commensal or mildly para-sitic, many provide benefits to their hosts, mediating defenseagainst pathogens and herbivores and influencing plant re-sponses to abiotic stressors such as drought (Costa Pinto et al.,2000; Arnold et al., 2003; Arnold and Engelbrecht, 2007;Márquez et al., 2007; Mejía et al., 2008). Endophytes are com-mon in photosynthetic tissues of plants in biomes ranging fromhot deserts to tropical rainforests and tundra (Arnold and
1 Manuscript received 16 September 2011; revision accepted 9 March 2012.The authors thank the National Science Foundation for supporting this
research (DEB-0640996 and DEB-0702825 to A.E.A., DEB-0640956 toF.L., and an NSF-supported IGERT Fellowship in Genomics to J.M.U.)and for fostering discussion that informed this work through the FungalEnvironmental Sampling and Informatics Network (FESIN, DEB-0639048to T. Bruns, K. Hughes, and A.E.A.). J.M.U. also was supported by theMycological Society of America’s Clark T. Rogerson student researchaward and MSA Graduate Fellowship. The authors thank E. Gaya,K. Molnár, F. Santos, M. Gunatilaka, M. Hoffman, M. del Olmo R., and D.L. Taylor for field and laboratory assistance; D. R. Maddison for sharing
pre-release versions of Mesquite and ChromaSeq; P. Degnan, T. Wheeler,J. Stajich, S. Huse, S. J. Miller, and Y. Sun for computational assistance;R. J. Steidl and R. Kaczorowski for assistance with statistical analyses;R. Harris, B. Hodkinson, E. Gaya, B. McCune, and S. Heidmarsson forassistance with lichen identifications; M. J. Epps for assistance withplant identifications; and two anonymous reviewers for improving themanuscript.
5 Author for correspondence (e-mail: [email protected]), phone:520-621-7212, fax: 520-621-9290
doi:10.3732/ajb.1100459
HOST AND GEOGRAPHIC STRUCTURE OF ENDOPHYTIC AND
ENDOLICHENIC FUNGI AT A CONTINENTAL SCALE 1
JANA M. U’REN 2 , FRAN Ç OIS LUTZONI 3 , JOLANTA MIADLIKOWSKA 3 , ALEXANDER D. LAETSCH 4 ,AND A. ELIZABETH ARNOLD 2,5
2 School of Plant Sciences, University of Arizona, Tucson, Arizona 85721 USA;3 Department of Biology, Duke University, Durham, North Carolina 27708 USA; and
4 Department of Pharmacology and Toxicology, University of Arizona, Tucson, Arizona 85721 USA
• Premise of the study: Endophytic and endolichenic fungi occur in healthy tissues of plants and lichens, respectively, playingpotentially important roles in the ecology and evolution of their hosts. However, previous sampling has not comprehensivelyevaluated the biotic, biogeographic, and abiotic factors that structure their communities.
• Methods: Using molecular data we examined the diversity, composition, and distributions of 4154 endophytic and endolichenicAscomycota cultured from replicate surveys of ca. 20 plant and lichen species in each of five North American sites (Madreanconiferous forest, Arizona; montane semideciduous forest, North Carolina; scrub forest, Florida; Beringian tundra and forest,western Alaska; subalpine tundra, eastern central Alaska).
• Key results: Endolichenic fungi were more abundant and diverse per host species than endophytes, but communities of endo-phytes were more diverse overall, reflecting high diversity in mosses and lycophytes. Endophytes of vascular plants werelargely distinct from fungal communities that inhabit mosses and lichens. Fungi from closely related hosts from different re-
gions were similar in higher taxonomy, but differed at shallow taxonomic levels. These differences reflected climate factorsmore strongly than geographic distance alone.
• Conclusions: Our study provides a first evaluation of endophytic and endolichenic fungal associations with their hosts at acontinental scale. Both plants and lichens harbor abundant and diverse fungal communities whose incidence, diversity, andcomposition reflect the interplay of climatic patterns, geographic separation, host type, and host lineage. Although culture-freemethods will inform future work, our study sets the stage for empirical assessments of ecological specificity, metabolic capabil-ity, and comparative genomics.
Key words: Ascomycota; diversity; endolichenic fungi; endophytic fungi; lichens; plant–fungal symbioses; symbiotrophs.

8/11/2019 Fungi Divesity
http://slidepdf.com/reader/full/fungi-divesity 2/17
899May 2012] U’REN ET AL.—CONTINENTAL-SCALE ASSOCIATIONS OF SYMBIOTROPHIC FUNGI
study design, and molecular analyses to differentiate morphologically similar strains, nor (2) placed these surveys into alarger context by evaluating similar pools of host species inmultiple biogeographic provinces and bioclimatic zones.
Here, we present the results of a large-scale survey of endophytic and endolichenic fungal communities associated withlocally replicated, phylogenetically diverse sets of 20–23 plan
and lichen host taxa in each of five sites across North AmericaThis culture-based effort resulted in 4791 isolates, which is thelargest and most geographically extensive collection of endophytic and endolichenic fungi sampled to date. We use molecular data (ITS rDNA-partial LSU rDNA) from 4154 of theseisolates to examine (1) how isolation frequency and diversity ofungi differ as a function of host type (plant vs. lichen), hoslineage (mycobiont order or plant division), abiotic factors, andgeographic location; (2) the geographic heterogeneity of endophytic and endolichenic communities at local and continentascales; and (3) the influence of host type and identity on thcomposition of endophytic and endolichenic communities alevels ranging from fungal classes to genotypes.
MATERIALS AND METHODSFive sites representing five distinct environmental, biological, and biogeo
graphic regions were chosen for this study (Table 1): the Madrean Sky IslandArchipelago of southeastern Arizona (AZC); the Appalachian Mountains ofwestern North Carolina (NCH); subtropical scrub forest in Florida (FLA); Beringian tundra and boreal forest in the Seward Peninsula ecoregion of westernAlaska (AKN); and inland, subalpine tundra in the Interior Highlands of easterncentral Alaska (AKE). Within each site, we selected species of plants and lichens that were phylogenetically diverse and representative of the region (Hultén1965; Radford et al., 1968; Barton, 1994; Brodo et al., 2001; http://wwwarchbold-station.org/station/html/datapub/species/lists/plantlist.html). Sitewere chosen to represent biologically and geographically distinct locations, awell as areas where endophytic and endolichenic fungi have not been previouslystudied in detail.
For this study, we define a community as the assemblage of culturable funginhabiting apparently healthy tissues of the dominant plants and lichens in each
site. For analyses, we subdivide these communities by host type (plant or lichen) and host lineage (mycobiont class or plant division). Our sampling wasdesigned to capture a statistically complete sample of endophytic and endolichenic richness within each site (i.e., such that estimated richness fallswithin the 95% confidence intervals of observed richness) to permit meaningfucomparisons of diversity and composition among communities (see Carroll1986; Gotelli, 2008).
In each site, we collected fresh tissues of 10 or 11 species of plants and thallof 7–12 genera of lichens representing 12–18 species (Tables 2, 3) from each o
Lutzoni, 2007), but the scale of their diversity and broad pat-terns of their host associations are not well understood.
Fungal symbionts resembling endophytes (i.e., endolichenicfungi) appear similarly ubiquitous in asymptomatic thalli of li-chens (Suryanarayanan et al., 2005; Arnold et al., 2009; Dinget al., 2009; U’Ren et al., 2010), wherein they associate primar-ily with photobionts (Arnold et al., 2009). Although they have
been characterized from a limited number of lichen species andgeographic areas, current evidence suggests that like endo-phytes, endolichenic fungi are horizontally transmitted, formhighly localized infections, and represent at least five classes ofnonlichenized Pezizomycotina, dozens of families, and largenumbers of previously unknown species (Arnold et al., 2009;U’Ren et al., 2010). Phylogenetic analyses and ancestral statereconstructions of trophic modes indicate that endophytic andendolichenic fungi are closely related and that endolichenicfungi may have provided the evolutionary source for transitionsto endophytism multiple times across the Ascomycota (Arnoldet al., 2009).
The distribution and biodiversity of these symbiotrophicfungi has been examined at scales ranging from a single leaf orhost individual to landscape and continental distributions (e.g.,Carroll, 1995; Arnold and Lutzoni, 2007; Davis and Shaw,2008; Hoffman and Arnold, 2008; Arnold et al., 2009). At aglobal scale, species diversity of endophytes appears to peak inthe seasonally wet tropics and decreases with increasing lati-tude (Arnold and Lutzoni, 2007, but see Suryanarayanan et al.,2011), and relatively few endophyte species or genotypes ap-pear to be shared among closely related hosts in different geo-graphic locations (Fisher et al., 1994, 1995; Arnold and Lutzoni,2007; Hoffman and Arnold, 2008; Arnold et al., 2009). Atsmaller spatial scales, symbiotrophic fungal communities oftendiffer among co-occurring plant species (Petrini, 1996; Arnoldet al., 2000; Suryanarayanan and Kumaresan, 2000) and be-tween physically proximate plants and lichens (Suryanarayananet al., 2005; U’Ren et al., 2010), with the exception of a re-
cently identified and ecologically flexible group of symbi-otrophic fungi that inhabits both lichens and mosses (U’Renet al., 2010). However, despite the increasing number of studiesevaluating endophyte biodiversity and distributions (e.g., Panand May, 2009; Saunders et al., 2010; Vega et al., 2010; Higginset al., 2011), no study to date has (1) simultaneously examinedendophytic and endolichenic fungi in multiple lineages of phy-logenetically diverse hosts using consistent methods, a replicated
TABLE 1. Geographic and abiotic characteristics of North American sites sampled for endolichenic and endophytic fungi from 2007 to 2008.
Site Vegetation type Collection date Latitude LongitudeElevation(m.a.s.l.)
Mean annualprecipitation (mm)
Mean annualtemperature (C)
Meangrowing
season (d)
Chiricahua Mountains,Arizona (AZC)
Temperate coniferous forest Jun-07 31° 55′ 47″ N 109° 22′ 56″ W 2300 512.3 12.3 202
Highlands Biological Station,North Carolina (NCH)
Granite outcrop in temperatesemideciduous forest
Jul-07 35° 01′ 41″ N 83° 160′ 72″ W 1100 2091.7 11.3 252
Archbold Biological Station,Florida (FLA)
Subtropical scrub forest Mar-08 27° 11′ 19″ N 81° 20′ 15″ W 35–65 1315.7 22.2 365
Eagle Summit,Alaska (AKE)
Subalpine low shrub tundra Jun-08 65° 29′ 04″ N 145° 24′ 13″ W 1113 267.5 −2.8 142
Nome, Alaska (AKN) Beringian tundra andconiferous forest
Jun-08 64° 30′ 04″ N 165° 24′ 23″ W 6 405.1 −3.1 122
Notes: Additional site information provided in U’Ren et al. (2010). Alaska vegetation types are based on information from http://www.hort.purdue.edunewcrop/cropmap/alaska/maps/AKeco3.html . Climate data were obtained from the Western Regional Climate Center (http://www.wrcc.dri.edu/CLIMATEDATA.html) or the Southeastern Regional Climate Center (http://www.sercc.com/climateinfo/historical/historical.html).
8/11/2019 Fungi Divesity
http://slidepdf.com/reader/full/fungi-divesity 3/17
900 AMERICAN JOURNAL OF BOTANY [Vol. 99
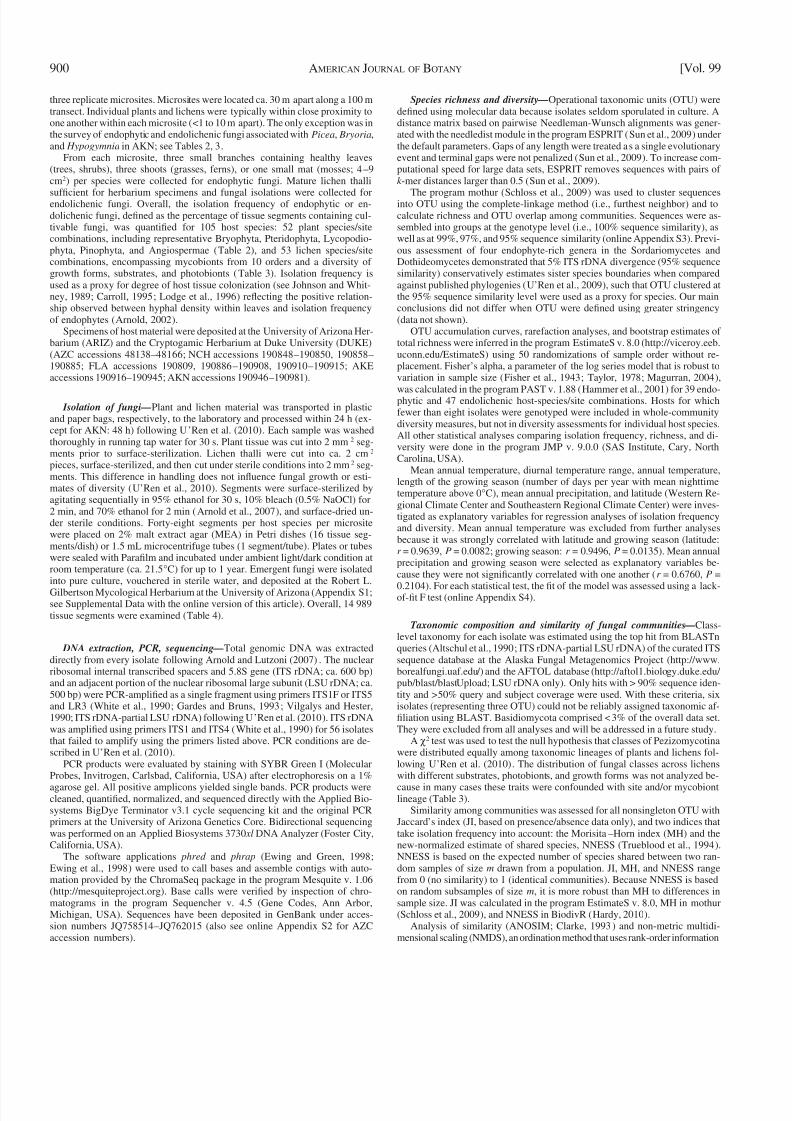
Species richness and diversity —Operational taxonomic units (OTU) weredefined using molecular data because isolates seldom sporulated in culture. Adistance matrix based on pairwise Needleman-Wunsch alignments was gener-ated with the needledist module in the program ESPRIT (Sun et al., 2009) underthe default parameters. Gaps of any length were treated as a single evolutionaryevent and terminal gaps were not penalized (Sun et al., 2009). To increase com-putational speed for large data sets, ESPRIT removes sequences with pairs ofk -mer distances larger than 0.5 (Sun et al., 2009).
The program mothur (Schloss et al., 2009) was used to cluster sequencesinto OTU using the complete-linkage method (i.e., furthest neighbor) and tocalculate richness and OTU overlap among communities. Sequences were as-sembled into groups at the genotype level (i.e., 100% sequence similarity), aswell as at 99%, 97%, and 95% sequence similarity (online Appendix S3). Previ-ous assessment of four endophyte-rich genera in the Sordariomycetes andDothideomycetes demonstrated that 5% ITS rDNA divergence (95% sequencesimilarity) conservatively estimates sister species boundaries when comparedagainst published phylogenies (U’Ren et al., 2009), such that OTU clustered atthe 95% sequence similarity level were used as a proxy for species. Our mainconclusions did not differ when OTU were defined using greater stringency(data not shown).
OTU accumulation curves, rarefaction analyses, and bootstrap estimates oftotal richness were inferred in the program EstimateS v. 8.0 (http://viceroy.eeb.uconn.edu/EstimateS) using 50 randomizations of sample order without re-placement. Fisher’s alpha, a parameter of the log series model that is robust tovariation in sample size (Fisher et al., 1943; Taylor, 1978; Magurran, 2004),
was calculated in the program PAST v. 1.88 (Hammer et al., 2001) for 39 endo-phytic and 47 endolichenic host-species/site combinations. Hosts for whichfewer than eight isolates were genotyped were included in whole-communitydiversity measures, but not in diversity assessments for individual host species.All other statistical analyses comparing isolation frequency, richness, and di-versity were done in the program JMP v. 9.0.0 (SAS Institute, Cary, NorthCarolina, USA).
Mean annual temperature, diurnal temperature range, annual temperature,length of the growing season (number of days per year with mean nighttimetemperature above 0° C), mean annual precipitation, and latitude (Western Re-gional Climate Center and Southeastern Regional Climate Center) were inves-tigated as explanatory variables for regression analyses of isolation frequencyand diversity. Mean annual temperature was excluded from further analysesbecause it was strongly correlated with latitude and growing season (latitude:r = 0.9639, P = 0.0082; growing season: r = 0.9496, P = 0.0135). Mean annualprecipitation and growing season were selected as explanatory variables be-cause they were not significantly correlated with one another (r = 0.6760, P =
0.2104). For each statistical test, the fit of the model was assessed using a lack-of-fit F test (online Appendix S4).
Taxonomic composition and similarity of fungal communities —Class-level taxonomy for each isolate was estimated using the top hit from BLASTnqueries (Altschul et al., 1990; ITS rDNA-partial LSU rDNA) of the curated ITSsequence database at the Alaska Fungal Metagenomics Project (http://www.borealfungi.uaf.edu/) and the AFTOL database (http://aftol1.biology.duke.edu/ pub/blast/blastUpload; LSU rDNA only). Only hits with >90% sequence iden-tity and >50% query and subject coverage were used. With these criteria, sixisolates (representing three OTU) could not be reliably assigned taxonomic af-filiation using BLAST. Basidiomycota comprised <3% of the overall data set.They were excluded from all analyses and will be addressed in a future study.
A χ 2 test was used to test the null hypothesis that classes of Pezizomycotinawere distributed equally among taxonomic lineages of plants and lichens fol-lowing U’Ren et al. (2010). The distribution of fungal classes across lichenswith different substrates, photobionts, and growth forms was not analyzed be-
cause in many cases these traits were confounded with site and/or mycobiontlineage (Table 3).
Similarity among communities was assessed for all nonsingleton OTU withJaccard’s index (JI, based on presence/absence data only), and two indices thattake isolation frequency into account: the Morisita–Horn index (MH) and thenew-normalized estimate of shared species, NNESS (Trueblood et al., 1994).NNESS is based on the expected number of species shared between two ran-dom samples of size m drawn from a population. JI, MH, and NNESS rangefrom 0 (no similarity) to 1 (identical communities). Because NNESS is basedon random subsamples of size m , it is more robust than MH to differences insample size. JI was calculated in the program EstimateS v. 8.0, MH in mothur(Schloss et al., 2009), and NNESS in BiodivR (Hardy, 2010).
Analysis of similarity (ANOSIM; Clarke, 1993) and non-metric multidi-mensional scaling (NMDS), an ordination method that uses rank-order information
three replicate microsites. Microsites were located ca. 30 m apart along a 100 mtransect. Individual plants and lichens were typically within close proximity toone another within each microsite (<1 to 10 m apart). The only exception was inthe survey of endophytic and endolichenic fungi associated with Picea , Bryoria ,and Hypogymnia in AKN; see Tables 2, 3.
From each microsite, three small branches containing healthy leaves(trees, shrubs), three shoots (grasses, ferns), or one small mat (mosses; 4–9cm2 ) per species were collected for endophytic fungi. Mature lichen thalli
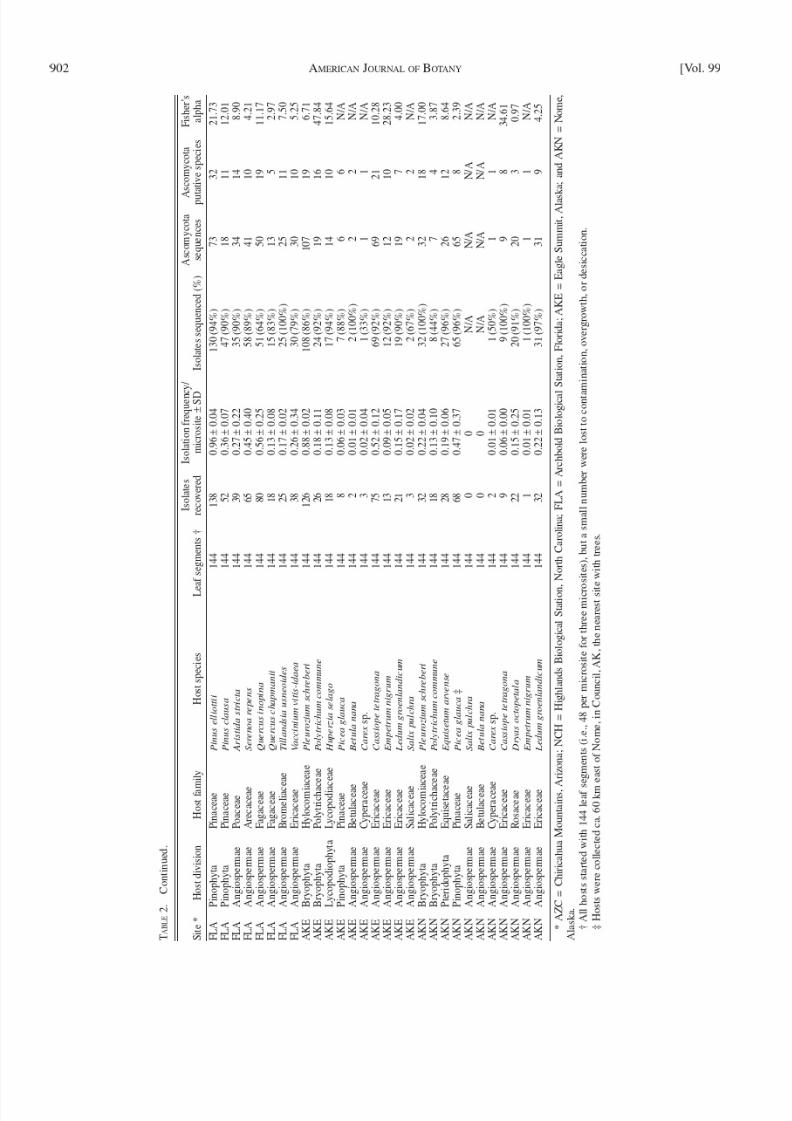
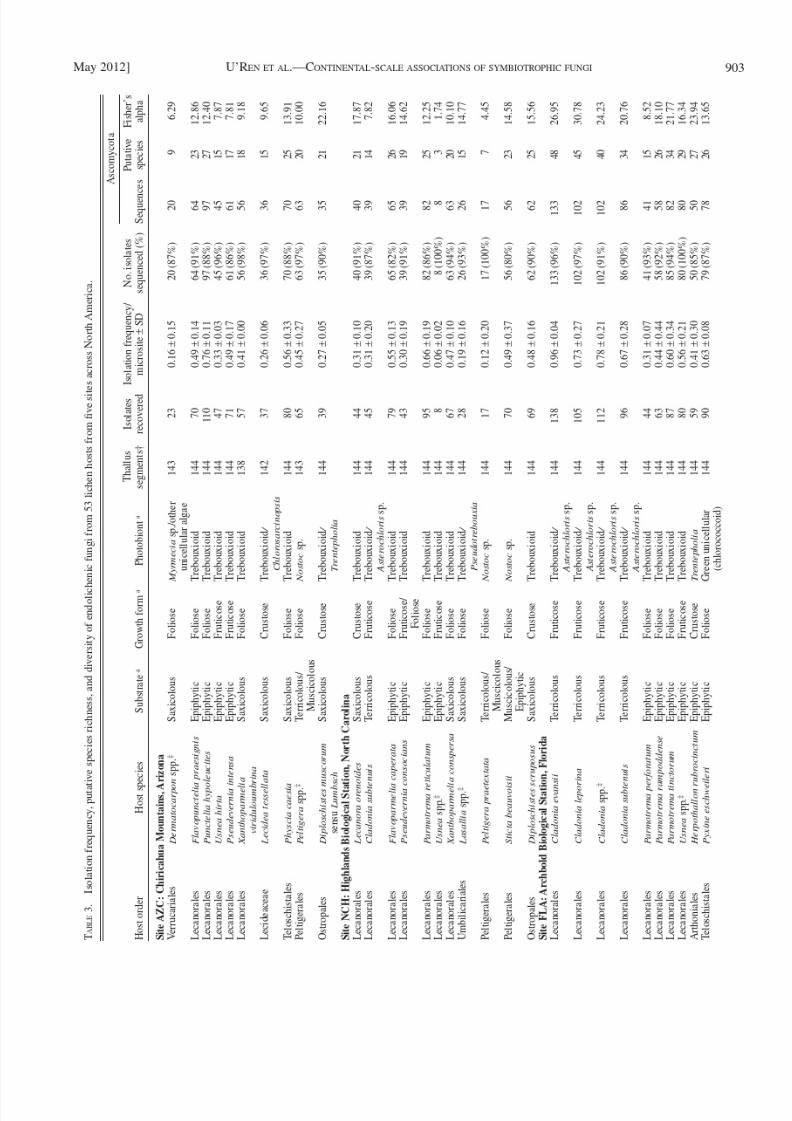
sufficient for herbarium specimens and fungal isolations were collected forendolichenic fungi. Overall, the isolation frequency of endophytic or en-dolichenic fungi, defined as the percentage of tissue segments containing cul-tivable fungi, was quantified for 105 host species: 52 plant species/sitecombinations, including representative Bryophyta, Pteridophyta, Lycopodio-phyta, Pinophyta, and Angiospermae (Table 2), and 53 lichen species/sitecombinations, encompassing mycobionts from 10 orders and a diversity ofgrowth forms, substrates, and photobionts (Table 3). Isolation frequency isused as a proxy for degree of host tissue colonization (see Johnson and Whit-ney, 1989; Carroll, 1995; Lodge et al., 1996) reflecting the positive relation-ship observed between hyphal density within leaves and isolation frequencyof endophytes (Arnold, 2002).
Specimens of host material were deposited at the University of Arizona Her-barium (ARIZ) and the Cryptogamic Herbarium at Duke University (DUKE)(AZC accessions 48138–48166; NCH accessions 190848–190850, 190858– 190885; FLA accessions 190809, 190886–190908, 190910–190915; AKEaccessions 190916–190945; AKN accessions 190946–190981).
Isolation of fungi —Plant and lichen material was transported in plasticand paper bags, respectively, to the laboratory and processed within 24 h (ex-cept for AKN: 48 h) following U’Ren et al. (2010). Each sample was washedthoroughly in running tap water for 30 s. Plant tissue was cut into 2 mm2 seg-ments prior to surface-sterilization. Lichen thalli were cut into ca. 2 cm2 pieces, surface-sterilized, and then cut under sterile conditions into 2 mm2 seg-ments. This difference in handling does not influence fungal growth or esti-mates of diversity (U’Ren et al., 2010). Segments were surface-sterilized byagitating sequentially in 95% ethanol for 30 s, 10% bleach (0.5% NaOCl) for2 min, and 70% ethanol for 2 min (Arnold et al., 2007), and surface-dried un-der sterile conditions. Forty-eight segments per host species per micrositewere placed on 2% malt extract agar (MEA) in Petri dishes (16 tissue seg-ments/dish) or 1.5 mL microcentrifuge tubes (1 segment/tube). Plates or tubeswere sealed with Parafilm and incubated under ambient light/dark condition atroom temperature (ca. 21.5° C) for up to 1 year. Emergent fungi were isolatedinto pure culture, vouchered in sterile water, and deposited at the Robert L.
Gilbertson Mycological Herbarium at the University of Arizona (Appendix S1;see Supplemental Data with the online version of this article). Overall, 14 989tissue segments were examined (Table 4).
DNA extraction, PCR, sequencing —Total genomic DNA was extracteddirectly from every isolate following Arnold and Lutzoni (2007). The nuclearribosomal internal transcribed spacers and 5.8S gene (ITS rDNA; ca. 600 bp)and an adjacent portion of the nuclear ribosomal large subunit (LSU rDNA; ca.500 bp) were PCR-amplified as a single fragment using primers ITS1F or ITS5and LR3 (White et al., 1990; Gardes and Bruns, 1993; Vilgalys and Hester,1990; ITS rDNA-partial LSU rDNA) following U’Ren et al. (2010). ITS rDNAwas amplified using primers ITS1 and ITS4 (White et al., 1990) for 56 isolatesthat failed to amplify using the primers listed above. PCR conditions are de-scribed in U’Ren et al. (2010).
PCR products were evaluated by staining with SYBR Green I (MolecularProbes, Invitrogen, Carlsbad, California, USA) after electrophoresis on a 1%
agarose gel. All positive amplicons yielded single bands. PCR products werecleaned, quantified, normalized, and sequenced directly with the Applied Bio-systems BigDye Terminator v3.1 cycle sequencing kit and the original PCRprimers at the University of Arizona Genetics Core. Bidirectional sequencingwas performed on an Applied Biosystems 3730 xl DNA Analyzer (Foster City,California, USA).
The software applications phred and phrap (Ewing and Green, 1998;Ewing et al., 1998) were used to call bases and assemble contigs with auto-mation provided by the ChromaSeq package in the program Mesquite v. 1.06(http://mesquiteproject.org). Base calls were verified by inspection of chro-matograms in the program Sequencher v. 4.5 (Gene Codes, Ann Arbor,Michigan, USA). Sequences have been deposited in GenBank under acces-sion numbers JQ758514–JQ762015 (also see online Appendix S2 for AZCaccession numbers).

8/11/2019 Fungi Divesity
http://slidepdf.com/reader/full/fungi-divesity 4/17
901May 2012] U’REN ET AL.—CONTINENTAL-SCALE ASSOCIATIONS OF SYMBIOTROPHIC FUNGI
in a dissimilarity matrix (Gauch, 1982), were conducted in the program PASTv. 1.88 (Hammer et al., 2001) using all nonsingleton OTU (i.e., those OTU oc-curring more than once in the entire data set). ANOSIM uses distance measuresto test the null hypothesis that there are no differences in species compositionbetween two or more groups (Warwick et al., 1990; Clarke, 1993). Distances(defined as 1-Morisita’s index) were converted to ranks and the test statistic R calculated as the difference of mean ranks between vs. within groups. Signifi-cance was computed by 10 000 permutations of group membership.
Partial Mantel tests (Smouse et al., 1986; Legendre and Troussellier, 1988)based on the distribution of Pearson correlation coefficient (r ) with 10 000 ran-dom permutations (see Manly, 1997; Legendre, 2000) were used to examine theinfluence of climatic similarity and geographic distance on endophytic and en-dolichenic community composition for each site, while holding effects of eitherclimate or intersite distance constant. Climatic similarity was based on Euclid-ean distances of the factor scores from the principal component analysis (PCA)of two abiotic variables (length of growing season and mean annual precipita-tion, Table 1) at each site following Rissler and Apodaca (2007) . Communitydissimilarity matrices were calculated using 1-NNESS.
RESULTS
Overall, 4791 fungal isolates were obtained in culture, cor-responding to emergence of fungi from 31.8% ± 27.3% of sur-face-sterilized segments of photosynthetic tissue from lichenand plant species collected from five sites across North Amer-ica. Fungi were isolated from all host species except Quercusrugosa at AZC, Salix pulchra at AKN, and Betula nana at AKN(Tables 2, 3).
Differences in isolation frequency as a function of host type —Fungi were isolated nearly twice as frequently from li-chen tissue segments (41.0% ± 2.5 of segments; mean per spe-cies ± SE; 3124 isolates overall) than from plant tissue segments(23.0% ± 2.2; 1667 isolates overall; Wilcoxon rank sum
2
1 =32.499, P < 0.0001; Table 4). For both plants and lichens, isola-tion frequency differed significantly among sites (Table 4;online Appendix S4), although patterns were not consistent
between host types (e.g., AKN had the lowest isolation fre-quency for endolichenic fungi, whereas AZC had the lowestisolation frequency for endophytic fungi). For endophytes, in-tersite differences in isolation frequency reflected differencesamong angiosperms, but not Pinophyta or mosses (which hadconsistently high isolation frequencies in all sites; AppendixS4). Isolation frequency also differed more than 3-fold as afunction of host lineage (i.e., mycobiont order and plant di-vision) after taking into account the effect of site (Table 5;online Appendix S4).
Isolation frequency and abiotic factors —The isolation fre-quency of endolichenic fungi from 52 species of lichens in-creased linearly as a function of growing season, but was notsensitive to mean annual precipitation (Fig. 1). The isolation
frequency of endophytic fungi from 48 species of plants in-creased linearly as a function of both growing season and an-nual precipitation (Fig. 1). This trend is strong for endophytesfrom vascular plants only, but not for endophytes of mosses(online Appendix S4). Mean isolation frequencies for endo-phytic and endolichenic fungi were significantly associatedwith latitude (P < 0.05; online Appendix S4).
Completeness of sampling —Sequence data from 4154 en-dophytic and endolichenic Ascomycota yielded 715 uniquegenotypes (313 of which were unique to lichens, 247 wereunique to plants, and 155 were shared between both host types, T
A B L E 2 .
I s o l a t i o n f r e q u e n c y , p u t a t
i v e s p e c i e s r i c h n e s s , a n d d i v e r s i t y o f e n d o p h y t i c f u n g i f r o m 5 2 p l a n t h o s t s f r o m fi v e s i t e s a c r o s s N o r t h A m e r i c a .
S i t e *
H o s t d i v i s i o n
H o s t f a m
i l y
H o s t s p e c i e s
L e
a f s e g m e n t s †
I s o l a t e s
r e c o v e r e d
I s o l a t i o n f r e q u e n c
y /
m i c r o s i t e ± S
D
I s o l a t e s s e q u e n c e d ( % )
A s c o m y c o t a
s e q u e n c e s
A
s c o m y c o t a
p u t a t i v e s p e c i e s
F i s h e r ’ s
a l p h a
A Z C
B r y o p h y t a
B r y a c e a e
L e u c o b r y u m s p .
1 4 1
2 1
0 . 1 5 ± 0 . 0 2
1 9 ( 9 1 % )
1 9
1 3
1 8 . 1 4
A Z C
B r y o p h y t a
D i t r i c h a c e a
e
C e r a t o d o n p u r p u r e u s
1 4 3
3 0
0 . 2 1 ± 0 . 1 6
3 0 ( 1 0 0 % )
3 0
1 5
1 1 . 9 3
A Z C
P t e r i d o p h y t a
D r y o p t e r i d a c e a e
W o o d s i a p l u m m e r a e
1 4 4
7
0 . 0 5 ± 0 . 0 9
5 ( 7 1 % )
5
4
9 . 2 8
A Z C
P i n o p h y t a
C u p r e s s a c e
a e
J u n i p e r u s d e p p e a n a
1 4 4
2 2
0 . 1 5 ± 0 . 1 2
1 9 ( 8 6 % )
1 9
1 0
8 . 5 4
A Z C
P i n o p h y t a
P i n a c e a e
P i n u s a r i z o n i c a v a r . a r i z o n i c a
1 4 4
9
0 . 0 6 ± 0 . 0 2
9 ( 1 0 0 % )
9
2
0 . 7 9
A Z C
P i n o p h y t a
P i n a c e a e
P s e u d o t s u g a m e n z i e s i i v a r . g l a u c a
1 4 4
2 1
0 . 1 5 ± 0 . 2 2
1 6 ( 7 6 % )
1 6
3
1 . 0 8
A Z C
A n g i o s p e r m a e
P o a c e a e
E r a g r o s t i s i n t e r m e d i a
1 4 4
2
0 . 0 1 ± 0 . 0 2
2 ( 1 0 0 % )
2
1
0 . 7 9
A Z C
A n g i o s p e r m a e
F a g a c e a e
Q u e r c u s r u g o s a
1 3 0
0
0
N / A
N / A
N / A
N / A
A Z C
A n g i o s p e r m a e
F a g a c e a e
Q u e r c u s g a m b e l i i
1 2 8
1
0 . 0 1 ± 0 . 0 1
1 ( 1 0 0 % )
1
1
N / A
A Z C
A n g i o s p e r m a e
F a g a c e a e
Q u e r c u s h y p o l e u c o i d e s
1 4 4
4
0 . 0 3 ± 0 . 0 5
3 ( 7 5 % )
3
1
N / A
A Z C
A n g i o s p e r m a e
O l e a c e a e
F r a x i n u s v e l u t i n a
1 2 5
1
0 . 0 1 ± 0 . 0 2
1 ( 1 0 0 % )
1
1
N / A
N C H
B r y o p h y t a
N / A
U n k n o w n m o s s
1 4 4
6 6
0 . 4 6 ± 0 . 3 5
6 0 ( 9 1 % )
6 0
1 4
5 . 7 4
N C H
B r y o p h y t a
H y p n a c e a e
H y p n u m s p .
1 4 4
6 8
0 . 4 7 ± 0 . 2 3
6 5 ( 9 6 % )
6 5
2 4
1 3 . 7 5
N C H
L y c o p o d i o p h y t a
S e l a g i n e l l a c e a e
S e l a g i n e l l a t o r t i p i l a
1 4 4
1 7
0 . 1 2 ± 0 . 1 7
1 4 ( 8 2 % )
1 4
8
7 . 7 5
N C H
P t e r i d o p h y t a
D r y o p t e r i d a c e a e
D r y o p t e r i s m a r g i n a l i s
1 3 1
5
0 . 0 4
3 ( 6 0 % )
3
3
N / A
N C H
P i n o p h y t a
P i n a c e a e
P i n u s s t r o b u s
1 1 4
1 4
0 . 1 4 ± 0 . 1 1
1 3 ( 9 3 % )
1 3
6
4 . 3 2
N C H
P i n o p h y t a
P i n a c e a e
T s u g a c a n a d e n s i s
1 4 4
5 4
0 . 3 8 ± 0 . 2 6
4 9 ( 9 1 % )
4 9
1 3
5 . 7 8
N C H
A n g i o s p e r m a e
S a p i n d a c e a
e
A c e r r u b r u m
1 1 9
4 8
0 . 3 6 ± 0 . 3 8
4 8 ( 1 0 % )
4 8
1 0
3 . 8 4
N C H
A n g i o s p e r m a e
P o a c e a e
D a n t h o n i a s p .
1 4 4
1 3 3
0 . 9 2 ± 0 . 0 7
1 2 4 ( 9 3 % )
1 2 4
9
2 . 2 2
N C H
A n g i o s p e r m a e
E r i c a c e a e
K a l m i a l a t i f o l i a L .
1 4 4
2 9
0 . 2 0 ± 0 . 3 1
2 9 ( 1 0 0 % )
2 9
6
2 . 2 9
N C H
A n g i o s p e r m a e
F a g a c e a e
Q u e r c u s m o n t a n a
1 4 4
6 0
0 . 4 2 ± 0 . 3 3
5 7 ( 9 5 % )
5 7
6
1 . 6 9
F L A
B r y o p h y t a
B r y a c e a e
L e u c o b r y u m s p .
1 4 4
5 5
0 . 3 8 ± 0 . 2 5
5 4 ( 9 8 % )
5 3
1 4
6 . 2 0
F L A
L y c o p o d i o p h y t a
S e l a g i n e l l a c e a e
S e l a g i n e l l a a r e n i c o l a
1 4 4
3 8
0 . 2 6 ± 0 . 2 6
3 0 ( 7 9 % )
3 0
2 3
4 5 . 1 1
8/11/2019 Fungi Divesity
http://slidepdf.com/reader/full/fungi-divesity 5/17
8/11/2019 Fungi Divesity
http://slidepdf.com/reader/full/fungi-divesity 6/17

8/11/2019 Fungi Divesity
http://slidepdf.com/reader/full/fungi-divesity 7/17

8/11/2019 Fungi Divesity
http://slidepdf.com/reader/full/fungi-divesity 8/17
905May 2012] U’REN ET AL.—CONTINENTAL-SCALE ASSOCIATIONS OF SYMBIOTROPHIC FUNGI
three sites (AZC, AKE, and AKN), and the bootstrap estimateexceeded the upper bound of the 95% confidence intervalaround observed richness by only 1.29 to 2.78 OTU for NCHand FLA, respectively (Table 4). For endophytic fungi, sampling nearly captured local richness of culturable endophyticfungi within four sites (AKE, AKN, AZC, and NCH) with bootstrap estimates exceeding the upper bound of the 95% confidence intervals by only 0.11 to 2.45 OTU; however, thbootstrap estimate for FLA exceeded the observed by 11.14OTU (Table 4). Therefore, we recovered the majority of culturable
based on 100% ITS rDNA-partial LSU rDNA similarity; Fisher’salpha = 248.9) and 359 OTU (107 of which were found onlyin lichens, 134 were found only in plants, and 118 occurred inboth host types, based on 95% ITS rDNA-partial LSU rDNAsimilarity; Fisher’s alpha = 94.3). Despite sampling nearly15 000 tissue pieces from 105 host species, our sampling effortwas statistically insufficient to capture the total OTU richnessof culturable endophytic and endolichenic fungi over the entirestudy (Fig. 2, Table 4). However, sampling sufficiently cap-tured local richness of culturable endolichenic fungi within
TABLE 4. Isolation frequency, putative species richness, and diversity of endolichenic and endophytic fungi per site using OTU based on 95% ITS rDNApartial LSU rDNA sequence similarity.
Host SiteTissue
segmentsIsolates
recovered
Isolationfrequency/microsite± SD *
Isolatessequenced
(%)Ascomycotasequences
Putative species(95% CI)
Bootstrapestimaterichness Fisher’s alpha (FA) †
Mean FA/hosspecies ± SD ‡
Lichen AZC 1430 599 0.42 ± 0.17 A 547 (91%) 547 69 (60.0, 78.0) 77.47 21.39 (21.1, 21.68) 11.22 ± 4.55NCH 1584 565 0.36 ± 0.19 A 497 (88%) 497 77 (68.3, 85.7) 86.99 26.56 (26.21, 26.91) 11.80 ± 5.18FLA 1440 874 0.61 ± 0.19 A 816 (93%) 812 102 (93.1, 111.0) 113.78 34.62 (34.16, 35.08) 20.50 ± 6.57AKE 1440 799 0.55 ± 0.37 A 686 (86%) 686 45 (36.9, 53.2) 51.23 15.43 (15.22, 15.64) 13.73 ± 9,35AKN 1728 287 0.17 ± 0.22 B 235 (82%) 235 43 (37.0, 49.0) 48.47 10.05 (9.91, 10.19) 12.78 ± 7.10Total 7622 3124 0.41 ± 0.28 2781 (89%) 2777 225 (212.8, 237.2) 248.75 57.80 (57.72, 57.88) 14.05 ± 7.24
Plant AZC 1531 118 0.08 ± 0.08 c 105 (89%) 105 39 (31.4, 46.6) 47.62 22.47 (21.8, 23.14) 7.22 ± 6.68NCH 1372 494 0.35 ± 0.25 ab 462 (94%) 462 70 (63.3, 76.7) 79.15 24.63 (23.89, 25.37) 5.26 ± 3.75FLA 1440 548 0.38 ± 0.24 a 475 (87%) 367 98 (87.6, 104.4) 115.54 43.5 (42.11, 44.89) 12.51 ± 12.65AKE 1440 295 0.21 ± 0.28 bc 261 (88%) 251 57 (49.7, 64.3) 64.41 26.33 (25.53, 27.13) 18.78 ± 16.61AKN 1584 212 0.13 ± 0.14 abc 194 (92%) 192 54 (45.1, 62.9) 63.91 25.48 (24.71, 26.25) 10.25 ± 12.02Total 7367 1667 0.23 ± 0.27 1497 (90%) 1377 252 (237.8, 266.2) 286.75 90.43 (90.22, 90.64) 10.45 ± 11.29
* Different letters represent significant differences (P < 0.05) based on ANOVA on residuals following test for host phylogeny effect with post hocTukey-Kramer HSD comparison of isolation frequency among lichens (uppercase) and plants (lowercase) from five sites.
† For each site, diversity and 95% confidence intervals were calculated using rarefaction at N = 105 for endophytes and N = 235 for endolichenic fungiwhich is equal to the smallest sample size for endophytic and endolichenic fungi, respectively.
‡ Mean diversity per host species was significantly greater for endolichenic fungi than endophytes ( t test, log-transformed Fisher’s alpha, t 84 = 3.66, P =0.0004). Mean species richness of endolichenic fungi per host species (18.74 ± 10.85) significantly exceeded that of endophytes (8.79 ± 7.20) (t testlog-transformed OTU t 99 = −4.94, P < 0.0001).
TABLE 5. Taxonomic distribution of the number of lichen or plant host species sampled, host species per site, tissue pieces examined and isolaterecovered; isolation frequency; number of isolates sequenced, number of putative species and bootstrap estimate, and diversity (Fisher ’s alpha [FA]using OTU based on 95% ITS rDNA-partial LSU rDNA sequence similarity.
Host Host classificationHost
species SitesMean isolation
frequency ± SD * SequencesAscomycotasequences
Ascomycota putativespecies (95% CI)
Bootstrapestimate richness
Mean FA/hostspecies ± SD †
Lichen Arthoniales 1 1 0.41 ± 0.30 50 50 27 (18.0, 36.0) 34.58 23.94Lecanorales 34 5 0.38 ± 0.31 B 1658 1657 187 (171.4, 202.6) 212.29 15.18 ± 7.74Lecideaceae 2 2 0.47 ± 0.26 AB 123 123 34 (28.5, 39.5) 39.50 10.30 ± 0.92Ophioparmaceae 2 2 0.77 ± 0.31 A 201 201 25 (20.7, 29.3) 27.73 6.58 ± 2.49Ostropales 2 2 0.38 ± 0.16 AB 97 97 42 (34.3, 49.7) 51.13 18.86 ± 4.67Peltigerales 5 4 0.44 ± 0.38 AB 275 275 67 (60.1, 73.9) 77.71 12.14 ± 8.30Rhizocarpaceae 1 1 0.68 ± 0.37 87 87 24 (17.5, 30.6) 29.30 10.95
Teloschistales 2 2 0.59 ± 0.22 AB 151 148 50 (42.1, 57.9) 60.12 13.78 ± 0.18Umbilicariales 3 3 0.32 ± 0.32 AB 119 119 41 (34.3, 47.7) 49.53 11.44 ± 5.37Verrucariales 1 1 0.16 ± 0.15 20 20 9 (5.8, 12.2) 10.76 6.29
Plant Bryophyta 9 5 0.34 ± 0.24 a 400 392 86 (76.7, 95.3) 97.82 14.58 ± 13.40 aLycopodiophyta 3 3 0.17 ± 0.08 ab 61 58 40 (29.4, 50.6) 51.68 22.83 ± 19.69 aPteridophyta 3 3 0.09 ± 0.08 ab 35 34 19 (14.3, 23.7) 23.45 8.96 ± 0.45 abPinophyta 9 5 0.30 ± 0.29 a 355 268 82 (74.4, 89.7) 94.65 7.08 ± 7.05 abAngiospermae 28 5 0.18 ± 0.22 b 646 626 118 (107.2, 128.8) 134.24 7.83 ± 9.47 b
* Different letters after values represent significant differences (P < 0.05) based on ANOVA on residuals following test for site effect with post hocTukey-Kramer HSD comparison of isolation frequency among lichen mycobionts (uppercase) and plant divisions (lowercase). Arthoniales, Rhizocarpaceaeand Verrucariales only had one representative so were excluded from the analysis.
† Different letters represent significant differences (P < 0.05) based on ANOVA on residuals following test for site effects. There was no significandifference in diversity among mycobiont orders (online Appendix S4).

8/11/2019 Fungi Divesity
http://slidepdf.com/reader/full/fungi-divesity 9/17
906 AMERICAN JOURNAL OF BOTANY [Vol. 99
associated with mean diversity of either endolichenic or endo-phytic fungi in these sites (online Appendix S4).
Geographic heterogeneity in fungal communities —Thecomposition of fungal communities differed significantly amongsites (Fig. 4). Post hoc pairwise comparisons indicate significant
differences in all cases (P < 0.05 using a Bonferroni correction)except for endophytic fungi from AZC and AKN, where isola-tion frequencies were relatively low (Table 4) and for which thedifference is nearly significant (uncorrected P = 0.0528). Theseresults could reflect our sampling of different species betweensites, but we observe the same pattern when analyses are re-stricted to fungal communities from congeneric hosts (e.g., Cla-donia spp. from NCH, FLA, and AKE: ANOSIM on Morisitadistances, R = 0.8155, P < 0.0001). Overall, only one and twoOTU from endophytic and endolichenic fungi, respectively, oc-curred across all five sites (<1% of OTU; tentatively identifiedas Lecythophora spp.; data not shown). Thirty-one percent ofnonsingleton OTU occurred in only one site. When AKN andAKF are treated as a single site (broadly defined as tundra/bo-real), 61% of nonsingleton OTU occurred in only one site.
Cluster analyses also reveal a strong effect of site on fungal com-munities (Fig. 4). Fungal communities from proximate sites (e.g.,NCH and FLA) cluster more closely than communities from moregeographically distant sites (Fig. 4). Sites in eastern and westernNorth America are clearly demarcated by both NMDS and clusteranalyses (Fig. 4). These analyses also show a secondary effect ofhost type: fungal communities isolated from plants and lichenswithin the same geographic location are more similar than fungalcommunities from the same host type in other sites (Fig. 4).
When compared across sites, similarity of fungal communitiesreflects environmental similarity more strongly than geographicproximity. Partial Mantel tests show that when the effect of
fungi in these host–site combinations. Based on the small dif-ferences between observed and estimated richness, these datawere used to compare diversity among substrates, sites, andhost lineages.
Differences in diversity as a function of host type —At the
genotype and OTU levels, cumulative diversity of endophyticfungi exceeded that of endolichenic fungi by a factor of 1.2 and1.6, respectively (P < 0.0001, determined by bootstrap random-ization) (Table 4; also see online Appendix S3). However, on aper host species basis, the mean diversity of OTU from lichenssignificantly exceeded that from plants (Table 4). Mean diver-sity of endolichenic fungi per host species was similar amongsites (Table 4); however, there was slight evidence that endo-phyte diversity per host species differed among sites (i.e., P =0.0689; online Appendix S4).
Endolichenic diversity did not differ significantly as a func-tion of mycobiont order, but diversity of endophytic fungi dif-fered significantly among plant divisions (Table 5). Endophyticfungi from Lycopodiophyta and Bryophyta were significantlymore diverse per host species than those from Angiospermae
(Table 5).
Diversity and abiotic factors —Endolichenic diversity in-creased linearly with increasing length of the growing season,but there was no effect of annual precipitation (Fig. 3, onlineAppendix S4; N = 47 lichen species/site combinations). Overall,endophyte diversity was not strongly related to annual precipita-tion or duration of the growing season (Fig. 3; online AppendixS4; N = 39 plant species/site combinations). However, the diver-sity of Pinophyta-associated endophytes per host species waspositively correlated with mean length of growing season ( R 2 =0.53, F 1,6 = 6.70, P = 0.0413). Latitude alone was not significantly
Fig. 1. Endophytic and endolichenic isolation frequency as a function of (A) mean annual precipitation and (B) mean length of growing season for 52lichen and 48 plant species/site combinations in five sites across North America (Chiricahua Mountains, Arizona [AZC], Highlands Biological Station,North Carolina [NCH], Archbold Biological Station, Florida [FLA], Eagle Summit, Alaska [AKE], and Nome, Alaska [AKN]). Solid circles and blacktrendline indicate endophytic hosts; open circles and gray trendline indicate endolichenic hosts. For each explanatory variable, the coefficient of determina-tion ( R 2 ) and the P -value for ANOVA is presented for endolichenic and endophytic fungi. Points are jittered for readability.

8/11/2019 Fungi Divesity
http://slidepdf.com/reader/full/fungi-divesity 10/17
907May 2012] U’REN ET AL.—CONTINENTAL-SCALE ASSOCIATIONS OF SYMBIOTROPHIC FUNGI
Taxonomic composition of fungal communities —BLASTnqueries of the Alaska Fungal Metagenomics Project ITSrDNA database and AFToL LSU rDNA database revealedthat the majority of fungi sequenced here (97.2%) are Ascomycota (Pezizomycotina, N = 4152; Saccharomycotina N = 2). Five classes and approximately 21 orders, 62 familiesand 150 genera of Pezizomycotina were represented. Two identical isolates from Serenoa repens in FLA were the only mem
bers of Saccharomycotina found in the study (tentativelyidentified as Pichia sp.; data not shown). We did not find anypreviously known lichenicolous fungi or mycobionts.
Classes of Pezizomycotina were not evenly represented inour sample (ANOVA on logit-transformed percentages, F 4,42 =15.67, P < 0.0001). The majority were Sordariomycetes (67.5%of isolates), followed by Pezizomycetes (15.8% of isolates)Dothideomycetes (10.4% of isolates), Leotiomycetes (4.9% oisolates), and Eurotiomycetes (1.3% of isolates).
These classes of Pezizomycotina differed significantly inrelative abundance among sites and in lichens vs. plants(Fig. 7).
geographic distance is removed, community similarity is posi-tively associated with climatic similarity (endolichenic r = −0.784,P = 0.0055; endophytic r = −0.757, P = 0.0073). Yet, when theeffect of climatic similarity is removed, community similarity isnot positively associated with geographic proximity (endolichenicr = −0.397, P = 0.2439; endophytic r = −0.333, P = 0.3483).
Distinctiveness of endophytic vs. endolichenic communi-
ties —In each site, endophytic and endolichenic communitiesdiffer significantly from one another, except in AKE where theynearly differ significantly (Fig. 5). This reflects a disparity be-tween endophytes of vascular plants and endolichenic fungi:fungal communities in lichens were significantly more similarto those in mosses than to those in vascular plants (Wilcoxonpairwise comparison, Z = −8.38, P < 0.0001) (Fig. 5). Althoughstrict-sense host specificity was rare, within-site comparisonsshowed that communities of fungi within lichens were moresimilar to one another than were communities in plants (Fig. 5),corresponding to higher host-specificity among endophytesthan among endolichenic fungi (Fig. 6).
Fig. 2. Species accumulation curves (species observed: Mao Tau), 95% confidence intervals, and bootstrap estimate of richness based on ITS rDNApartial LSU rDNA OTU (95% sequence similarity) for (A) 2777 isolates of endolichenic fungi from living thalli of 53 lichen species from five sites, (B)1377 isolates of endophytic fungi from living photosynthetic tissues of 49 species of plants from five sites, (C) endolichenic fungi by site, and (D) endo-phytic fungi by site. Site abbreviations are as follows: AZC (Chiricahua Mountains, Arizona); NCH (Highlands Biological Station, North Carolina); FLA(Archbold Biological Station, Florida); AKE (Eagle Summit, Alaska); and AKN (Nome, Alaska).

8/11/2019 Fungi Divesity
http://slidepdf.com/reader/full/fungi-divesity 11/17
908 AMERICAN JOURNAL OF BOTANY [Vol. 99
and composition of symbiotrophic fungi reflect the interplay ofclimatic patterns, geographic separation, host type, and hostlineage. These data are important for understanding communityassembly at local scale, as well as broader ecological andevolutionary associations between fungi and photosyntheticorganisms. Perhaps most striking is our finding that congeneric and
DISCUSSION
Our study of plants and lichens in five sites across NorthAmerica provides a first comparison of the associations of en-dophytic and endolichenic fungi with their hosts at a continen-tal scale. Together our data indicate that the incidence, diversity,
Fig. 3. Endophytic and endolichenic diversity as a function of (A) mean annual precipitation and (B) mean length of growing season for 47 lichen and39 plant species/site combinations representing five sites across North America (Chiricahua Mountains, Arizona (AZC), Highlands Biological Station,North Carolina (NCH), Archbold Biological Station, Florida (FLA), Eagle Summit, Alaska (AKE), and Nome, Alaska (AKN)). Solid circles and blacktrendline indicate endophytic hosts; open circles and gray trendline indicate endolichenic hosts. For each explanatory variable, the coefficient of determina-tion ( R 2 ) and the P -value for ANOVA is presented for endolichenic and endophytic fungi. Precipitation × growing season was not significant for eitherendophytic or endolichenic fungal diversity. Points are jittered for readability.
Fig. 4. Non-metric multidimensional scaling (NMDS) plots of (A) endolichenic and (B) endophytic fungal communities, showing the differences incommunity composition among sites (Chiricahua Mountains, Arizona (AZC), Highlands Biological Station, North Carolina (NCH), Archbold BiologicalStation, Florida (FLA), Eagle Summit, Alaska (AKE), and Nome, Alaska (AKN)). Each point represents the fungal community from a single lichen or planthost, and convex hulls (i.e., the smallest convex polygon containing all points) show the area occupied by points from each site. One-way analysis of simi-larity (ANOSIM) indicates significant differences in community composition among sites for both endophytic and endolichenic fungi. Post hoc pairwisecomparisons indicate significantly different species composition between all sites (P < 0.05 after Bonferroni correction) except for endophytic fungi fromAZC and AKN, which nearly differed significantly (P = 0.0528 uncorrected). (C) Unweighted pair-group average (UPGMA) dendrogram showing hierar-chical clustering of endophytic and endolichenic communities from each site. Bootstrap values are based on 1000 bootstrap replicates. Hosts with <3 se-quences and singleton OTU were excluded from analyses. The Morisita index was used to quantify community similarity for NMDS, ANOSIM, andUPGMA cluster analysis. Hosts from each microsite were pooled because communities of fungi from different microsites are not significantly different(ANOSIM P > 0.05), with the exception of microsites two and three for endolichenic fungi in AKE.

8/11/2019 Fungi Divesity
http://slidepdf.com/reader/full/fungi-divesity 12/17
909May 2012] U’REN ET AL.—CONTINENTAL-SCALE ASSOCIATIONS OF SYMBIOTROPHIC FUNGI
fungi ranged from ~1 to 5.25 times that of endophytic fungi. Ona per host species basis, endolichenic fungi were more diversethan endophytic fungi in all sites except the two tundra locations (AKE and AKN). In the temperate zone, the higher abundance and diversity of endolichenic fungi likely reflects thelonger exposure of lichen thalli to spore rain relative to theshorter lifetimes of leaves (some thalli can live up to 100 yearssee Arnold et al., 2009). In AKE and AKN, isolation frequencies for endophytes generally were low, but those endophyte
that were recovered had very high species richness, yieldinghigh diversity values.
In general, endophytic fungi were particularly diverse in earlier-arising plant lineages such as mosses and lycophytes, especially compared to angiosperms (Tables 2, 4). In contrastendolichenic diversity did not differ as a function of mycobionorder. Genetic distance among lichen mycobionts was smallethan among plants: a large fraction of focal lichens belong toone order (Lecanorales) and one class (Lecanoromycetes). Thlatter is estimated to have diversified 269–380 million years ago(Gueidan et al., 2011). In contrast, we sampled plant hosts spanning four major clades of land plants, which arose approximately
confamilial lichens and plants living in different regions are in-fected by distinctly local symbionts. These local fungi may besimilar in terms of higher taxonomy to those in other sites, butdiffer at shallow taxonomic levels.
Because of this turnover in species composition among sites,our collection of over 4700 isolates was insufficient to capturethe estimated richness of these symbiotrophic fungi. Bootstrapestimates suggest at least 400 OTU and 849 genotypes of culti-vable fungi in our sampled hosts. Overall, one-third of all OTU
were found only once, precluding any inference regarding theirhost or geographic specificity. This number of singletons islower than in many studies (see Arnold and Lutzoni, 2007;Arnold et al., 2007; Higgins et al., 2007; Davis and Shaw,2008), reflecting our within-site sampling depth and replica-tion. In each site, we captured or very nearly captured the totalrichness of cultivable endophytic and endolichenic fungi (Table4), providing an opportunity to explore the factors shaping theirecological distributions.
Overall, fungi emerged from up to 61% of lichen thallus seg-ments and 38% of photosynthetic tissue segments from plantsper site. In each site, the incidence of cultivable endolichenic
Fig. 5. Non-metric multidimensional scaling (NMDS) plots of endophytic and endolichenic fungal communities, showing the differences in community composition between lichen (open circles) and plant (closed circles) hosts from each site: (A) Chiricahua Mountains, Arizona (AZC); (B) HighlandsBiological Station, North Carolina (NCH); (C) Archbold Biological Station, Florida (FLA); (D) Eagle Summit, Alaska (AKE); and (E) Nome, Alaska(AKN). Convex hulls show the area occupied by points from each host type. One-way analysis of similarity (ANOSIM) indicates significant differences ( P < 0.05after Bonferroni correction) in community composition between endophytic and endolichenic fungi in all sites but AKE, where endophytes and en-dolichenic communities nearly differ significantly. (E) Mean ± SEM pairwise similarity (Morisita-Horn) of endophytic and endolichenic fungal communities within the same site. Different letters represent significant differences (P < 0.05) based on post hoc Wilcoxon rank-sum comparisons;
2
3 = 290.19, P < 0.0001Hosts with <3 sequences and singleton OTU were excluded from analyses. The Morisita index was used to quantify community similarity for NMDS andANOSIM.

8/11/2019 Fungi Divesity
http://slidepdf.com/reader/full/fungi-divesity 13/17
910 AMERICAN JOURNAL OF BOTANY [Vol. 99
differences among sites reflect climate more strongly than geo-graphic distance alone. However, endolichenic and endophyticfungi differ somewhat in their associations with climate variables.
Mean length of the growing season, which is correlatedwith latitude but is more informative statistically, was posi-tively associated with the isolation frequency and diversity ofendolichenic fungi. This may reflect increased growth and
photosynthetic rates of lichen thalli under warmer conditions(Coxson and Kershaw, 1983) , through which more photosyn-thate might be available to these secondary mycobionts. Pho-tosynthetic rates of photobionts also are influenced by factorssuch as thallus moisture content (Benedict, 1990), with manybecoming physiologically active in the presence of fog ordew. This may explain the decoupling we observed betweenannual rainfall and endolichenic fungal diversity and abun-dance (Figs. 1, 3).
Overall, isolation frequency of endophytic fungi increasedwith increasing precipitation and growing season length, con-sistent with a strong relationship of rainfall and productivity oncolonization and persistence by endophytic fungi in vascularplants (see Carroll, 1995; Arnold and Herre, 2003; Reiher,2011). However, nonvascular plants displayed a different pat-tern: when analyzed alone, isolation frequency of moss-associatedendophytes was not strongly influenced by annual rainfall orgrowing season length (online Appendix S4). In contrast withseveral previous studies (e.g., Ahlholm et al., 2002; Helanderet al., 1993; but see Suryanarayanan et al., 2003), neither rain-fall nor growing season was a strong predictor of endophytediversity overall. However, growing season length was signifi-cantly correlated with endophyte diversity in conifers. This mayreflect the fact that leaves of evergreens such as conifers accumu-late endophytes as they age through multiple growing seasons(Bernstein and Carroll, 1977; Petrini and Carroll, 1981), whereasour estimates of isolation frequency and diversity for deciduousleaves represent colonization from a single growing season.
Here, we used mean length of growing season and annual
precipitation to define climatic similarity, but other abiotic fac-tors, as well as biotic factors such as local land use history, firehistory, or plant diversity, density, and composition, also maybe important. Future studies will sample hosts specifically toelucidate the biotic and abiotic factors influencing their distri-butions, as well as the geographic scale at which communitiesof endophytic and endolichenic fungi begin to turn over (seehttp://www.EnDoBiodiversity.org).
Taxonomic composition and host affiliation —The majorityof endophytic and endolichenic fungi belonged to the same fiveclasses of Pezizomycotina (Ascomycota), but a small numberof Saccharomycotina (Ascomycota) and Basidiomycota alsowere found, especially in FLA (Table 4). Cultivable basidiomy-
cetes occur frequently as endophytes of woody tissues, but alsohave been observed in foliar tissue, albeit rarely, using bothculturing and direct PCR (Arnold et al., 2007; Pan et al.,2008; Rodriguez et al., 2009).
The taxonomic composition of fungal communities differedat both the class and OTU levels between lichens and plants.Lichens rarely contained Leotiomycetes ( N = 23 isolates; 0.8%),which are common as endophytes of many conifers (Ganleyet al., 2004; Ganley and Newcombe, 2006; Wang et al., 2006;Arnold et al., 2007), or Dothideomycetes ( N = 128 isolates;9.3%), which occur frequently as endophytes (Arnold et al.,2007; Arnold and Lutzoni, 2007; Higgins et al., 2007).
475 million years ago (Wellman et al., 2003; Steemans et al.,2009). This disparity in genetic distance may underlie the con-sistent levels of endolichenic diversity among lichens (Table 5)and greater host-generalism we observed among endolichenicfungi compared to endophytic fungi (Figs. 5F, 6).
Influence of abiotic factors on symbiotroph communi-
ties —Earlier studies have noted that endophytic communitiesfrom taxonomically related hosts differ in incidence, diversity,and composition among biogeographic regions (e.g., Fisheret al., 1995; Arnold et al., 2003; Arnold, 2007; Arnold andLutzoni, 2007; Hoffman and Arnold, 2008). Whether endolichenicfungi display similar patterns had not been studied previously,although a latitudinal gradient of isolation frequency and diver-sity was reported by Arnold et al. (2009). Dispersal limitation,limits to host range, local adaptive evolution, and environmen-tal selection have been invoked to explain geographic heteroge-neity of fungal communities (see Lumbsch et al., 2008; Peayet al., 2010), but the interplay of these factors has not been stud-ied simultaneously in previous work.
We found that latitude alone was not a strong indicator ofdiversity when analyzed on a per host species basis. However,
fungi in lichens were more diverse overall in more southerlysites, yielding a significant association between community-level diversity and latitude for endolichenic fungi (Table 4). Nosuch pattern was observed for endophytes, but latitude becamesignificant when our data were compared with tropical endo-phytes (data from Arnold and Lutzoni, 2007; Arnold et al.,2009; online Appendix S4).
Previous studies evaluating distributions of endophytic andendolichenic fungi have not decoupled latitude or geographicproximity from abiotic factors related to climate. We found thatsymbiotroph communities in sites that were closer togetherwere more similar than those in more distant sites, but that
Fig. 6. Mean ± SEM pairwise similarity (Morisita–Horn) among indi-viduals of the same host species (intraspecific) vs. similarity among indi-viduals of different species (interspecific) for endophytic and endolichenicfungal communities within the same site. Similarity was significantlygreater for conspecific hosts compared to heterospecific hosts for commu-nities of fungi in plants (two-sided t test on logit-transformed Morisita– Horn; t 46 = 6.98, P < 0.0001) and lichens (t 1624 = 2.67, P = 0.0076). Hostswith <3 sequences and singleton OTU were excluded from analyses.

8/11/2019 Fungi Divesity
http://slidepdf.com/reader/full/fungi-divesity 14/17
911May 2012] U’REN ET AL.—CONTINENTAL-SCALE ASSOCIATIONS OF SYMBIOTROPHIC FUNGI
sp.; Basilier et al., 1978; DeLuca et al., 2002), and/or ecology(water use and resistance to desiccation; Dilks and Proctor1974, 1976, 1979; Glime, 2007).
Perspectives —Because our conclusions are based solely on
cultured isolates and likely exclude species that require morespecialized nutrients or are obligate symbionts, we likely underestimated fungal species richness and diversity. Similarly, missingspecies have the potential to alter our estimates of host and geographic affiliations. Culture-free approaches such as direct PCRand pyrosequencing can recover comparable or greater fungal diversity, as well as different taxonomic groups compared to culturing alone (Arnold et al., 2007; Gallery et al., 2007; Jumpponenand Jones, 2009); however, these methods also are subject tobias (see Kunin et al., 2010). For example, Tedersoo et al. (2010found that ITS tag pyrosequencing errors led to an artificial increase in insertions and singletons compared to Sanger sequencing
At the OTU level, our results confirm earlier findings thatcommunities of endolichenic fungi are largely distinct from en-dophytic fungi, with the exception of endophytes inhabitingmosses (see above, and U’Ren et al., 2010) and some cosmo-politan genotypes of Xylariaceae with broad host ranges (see
Davis et al., 2003; Suryanarayanan et al., 2005). Endophytes ofmosses were equally similar in composition to endolicheniccommunities from saxicolous, terricolous, epiphytic, and musi-colous lichens (data not shown), such that their similarity is notsolely due to overlapping niches (During and Van Tooren,1990). Moreover, the OTU that colonize both mosses and li-chens represent multiple classes (Dothideomycetes, Eurotio-mycetes, Leotiomycetes, Pezizomycetes, and Sordariomycetes)rather than a single evolutionary lineage. Thus, the similarity ofendolichenic and moss-endophytic fungi may be explained bysimilar host architecture (i.e., nonvascular architecture), chem-istry (associations with N2 -fixing cyanobacteria such as Nostoc
Fig. 7. Percentage of isolates representing each of five classes of Pezizomycotina (Pezizomycetes, Dothideomycetes, Eurotiomycetes, Leotiomycetesand Sordariomycetes) as a function of site (Chiricahua Mountains, Arizona (AZC), Highlands Biological Station, North Carolina (NCH), Archbold Biological Station, Florida (FLA), Eagle Summit, Alaska (AKE), and Nome, Alaska (AKN)) for (A) endophytic fungi and (B) endolichenic fungi. The totanumber of sequences assessed is listed at the top of each stacked bar. These classes of Pezizomycotina were not equally distributed among sites (endolichenic
2
16 = 141.76, P < 0.0001, endophytic 2
16 = 299.32, P < 0.0001), nor among lichens vs. plants ( 2
16 = 185.21, P < 0.0001).

8/11/2019 Fungi Divesity
http://slidepdf.com/reader/full/fungi-divesity 15/17
912 AMERICAN JOURNAL OF BOTANY [Vol. 99
BERNSTEIN , M. E., AND G. C. CARROLL . 1977. Internal fungi in old-growthDouglas fir foliage. Canadian Journal of Botany 55: 644–653.
BRODO , I. M., S. D. SHARNOFF , AND S. SHARNOFF . 2001. Lichens of NorthAmerica. Yale University Press, New Haven, Connecticut, USA.
CARROLL , G. C. 1986. The biology of endophytism in plants with spe-cial reference to woody perennials. In N. J. Fokkema and J. van denHeuvel [eds.], Microbiology of the phylloplane, 205–222. CambridgeUniversity Press, Cambridge, UK.
CARROLL , G. C. 1995. Forest endophytes: Pattern and process. Canadian
Journal of Botany 73 (supplement 1): S1316–S1324.CLARKE , K. R. 1993. Non-parametric multivariate analysis of changes in
community structure. Australian Journal of Ecology 18: 117–143.CLAY , K. 1990. Fungal endophytes of grasses. Annual Review of Ecology
and Systematics 21: 275–297.COSTA PINTO , L. S., J. L. AZEVED , J. O. PEREIRA , M. L. CARNEIRO VIEIRA , AND
C. A. LABATE . 2000. Symptomless infection of banana and maizeby endophytic fungi impairs photosynthetic efficiency. The New
Phytologist 147: 609–615.COXSON , D. S., AND K. A. KERSHAW . 1983. The ecology of Rhizocarpon
superficiale . II. The seasonal response of net photosynthesis and res-piration to temperature, moisture, and light. Canadian Journal of
Botany 61: 3019–3030.DAVIS , E. C., J. B. FRANKLIN , A. J. SHAW , AND R. VILGALYS . 2003.
Endophytic Xylaria (Xylariaceae) among liverworts and angio-sperms: Phylogenetics, distribution, and symbiosis. American Journal
of Botany 90: 1661–1667.DAVIS , E. C., AND A. J. SHAW . 2008. Biogeographic and phylogenetic
patterns in diversity of liverwort-associated endophytes. American
Journal of Botany 95: 914–924.DELUCA , T. H., O. ZACKRISSON , M. C. NILSSON , AND A. SELLSTEDT . 2002.
Quantifying nitrogen-fixation in feather moss carpets of boreal for-ests. Nature 419: 917–920.
DILKS , T. J. K., AND M. C. F. PROCTOR . 1974. The pattern of recovery ofbryophytes after desiccation. Journal of Bryology 8: 97–115.
DILKS , T. J. K., AND M. C. F. PROCTOR . 1976. Effects of intermittent desic-cation on bryophytes. Journal of Bryology 9: 249–264.
DILKS , T. J. K., AND M. C. F. PROCTOR . 1979. Photosynthesis, respirationand water content in bryophytes. The New Phytologist 82: 97–114.
DING , G., Y. LI , S. FU , S. LIU , J. WEI , AND Y. CHE . 2009. Ambuic acid and
torreyanic acid derivatives from the endolichenic fungusPestalotiopsis sp. Journal of Natural Products 72: 182–186.DOBRANIC , J. K., J. A. JOHNSON , AND Q. R. ALIKHAN . 1995. Isolation of
endophytic fungi from eastern larch ( Larix laricina ) leaves fromNew Brunswick, Canada. Canadian Journal of Microbiology 41:194–198.
DURING , H. J., AND B. F. VAN TOOREN . 1990. Bryophyte interactions withother plants. Botanical Journal of the Linnean Society 104: 79–98.
ELIX , J. A., K. L. GAUL , AND H. T. LUMBSCH . 1987. Isolation of a novel li-chen xanthone from the genus Diploschistes s. lat. Australian Journal
of Chemistry 40: 1031–1033.EWING , B., AND P. GREEN . 1998. Base-calling of automated sequencer
traces using Phred. II. Error probabilities. Genome Research 8:186–194.
EWING , B., L. HILLIER , M. WENDL , AND P. GREEN . 1998. Base-calling ofautomated sequencer traces using Phred. I. Accuracy assessment.Genome Research 8: 175–185.
FAETH , S. H., AND K. E. HAMMON . 1997. Fungal endophytes in oak trees:Long-term patterns of abundance and associations with leafminers.
Ecology 78: 810–819.FISHER , P. J. 1996. Survival and spread of the endophyte Stagonospora
pteridiicola in Pteridium aquilinum , other ferns and some floweringplants. The New Phytologist 132: 119–122.
FISHER , P. J., F. GRAF , L. E. PETRINI , B. C. SUTTON , AND P. A. WOOKEY .1995. Fungal endophytes of Dryas octopetala from high arctic semi-desert and from the Swiss alps. Mycologia 87: 319–323.
FISHER , P. J., O. PETRINI , L. E. PETRINI , AND B. C. SUTTON . 1994. Fungal en-dophytes from the leaves and twigs of Quercus ilex L. from England,Majorca and Switzerland. The New Phytologist 127: 133–137.
and that estimates of ectomycorrhizal fungal richness and tax-onomy were sensitive to primer selection, DNA extraction, andPCR methods. In addition, Arnold et al. (2007) and Higgins et al.(2011) found that certain clades of endophytic fungi recoveredby culturing were not found from environmental PCR-based sur-veys of the same plant material. Undoubtedly the addition ofculture-free methods would enhance the results presented here.
In turn, our culture library sets the stage for empirical assess-ments of ecological specificity, multigene phylogenetics,metabolic capability, and comparative genomics. Such studieswill shed light on functional trait distributions associated withgeography, climate, and host use; inform host-symbiotrophcoevolution at large and small spatial scales; and improvetaxonomic tools for fungal diversity studies based on culture-independent methods.
LITERATURE CITED
AGRIOS , G. N. 2005. Plant pathology, 5th ed. Elsevier Academic Press,Burlington, Massachusetts, USA.
AHLHOLM , J., M. HELANDER , P. ELAMO , I. SALONIEMI , S. NEUVONEN , S.HANHIM Ä KI , AND K. SAIKKONEN . 2002. Micro-fungi and inverte-
brate herbivores on birch trees: Fungal mediated plant–herbivoreinteractions or responses to host quality? Ecology Letters 5:648–655.
ALTSCHUL , S. F., W. GISH , W. MILLER , E. W. MYERS , AND D. J. LIPMAN .1990. Basic local alignment search tool. Journal of Molecular
Biology 215: 403–410.ARNOLD , A. E. 2002. Fungal endophytes in neotropical trees: Abundance,
diversity, and ecological interactions. Ph.D. dissertation, Universityof Arizona, Tucson, Arizona, USA.
ARNOLD , A. E. 2007. Understanding the diversity of foliar fungal endo-phytes: Progress, challenges, and frontiers. Fungal Biology Reviews 21: 51–66.
ARNOLD , A. E., AND B. M. J. ENGELBRECHT . 2007. Fungal endophytesnearly double minimum leaf conductance in seedlings of a neotropi-cal tree species. Journal of Tropical Ecology 23: 369–372.
ARNOLD , A. E., AND F. LUTZONI . 2007. Diversity and host range of foliar
fungal endophytes: Are tropical leaves biodiversity hotspots? Ecology
88: 541–549.ARNOLD , A. E., D. A. HENK , R. L. EELLS , F. LUTZONI , AND R. VILGALYS .
2007. Diversity and phylogenetic affinities of foliar fungal endo-phytes in loblolly pine inferred by culturing and environmental PCR.
Mycologia 99: 185–206.ARNOLD , A. E., AND E. A. HERRE . 2003. Canopy cover and leaf age affect
colonization by tropical fungal endophytes: Ecological pattern andprocess in Theobroma cacao (Malvaceae). Mycologia 95: 388–398.
ARNOLD , A. E., Z. MAYNARD , G. GILBERT , P. D. COLEY , AND T. A. KURSAR .2000. Are tropical fungal endophytes hyperdiverse? Ecology Letters 3: 267–274.
ARNOLD , A. E., L. MEJ Í A , D. KYLLO , E. ROJAS , Z. MAYNARD , AND E. A.HERRE . 2003. Fungal endophytes limit pathogen damage in a tropi-cal tree. Proceedings of the National Academy of Sciences, USA 100:15649–15654.
ARNOLD , A. E., J. MIADLIKOWSKA , K. L. HIGGINS , S. D. SARVATE , P. GUGGER ,A. WAY , V. HOFSTETTER , ET AL . 2009. A phylogenetic estimationof trophic transition networks for ascomycetous fungi: Are lichenscradles of symbiotrophic fungal diversification? Systematic Biology 58: 283–297.
BARTON , A. M. 1994. Gradient analysis of relationships among fire, en-vironment, and vegetation in a southwestern USA mountain range.
Bulletin of the Torrey Botanical Club 121: 251–265.BASILIER , K., U. GRANHALL , AND T.-A. STENSTR Ö M . 1978. Nitrogen fixation
in wet minerotrophic moss communities of a subarctic mire. Oikos 31: 236–246.
BENEDICT , J. B. 1990. Experiments on lichen growth. I. Seasonal pat-terns and environmental controls. Arctic and Alpine Research 22:244–254.
8/11/2019 Fungi Divesity
http://slidepdf.com/reader/full/fungi-divesity 16/17
913May 2012] U’REN ET AL.—CONTINENTAL-SCALE ASSOCIATIONS OF SYMBIOTROPHIC FUNGI
FISHER , R. A., A. S. CORBET , AND C. B. WILLIAMS . 1943. The relation be-tween the number of species and the number of individuals in a ran-dom sample of an animal population. Journal of Animal Ecology 12:42–58.
GARDES , M., AND T. D. BRUNS . 1993. ITS primers with enhanced specific-ity of basidiomycetes: application to the identification of mycorrhizaeand rusts. Molecular Ecology 2: 113–118.
GALLERY , R., J. W. DALLING , AND A. E. ARNOLD . 2007. Diversity, host
affinity, and distribution of seed-infecting fungi: A case study withneotropical Cecropia . Ecology 88: 582–588.
GAMBOA , M. A., AND P. BAYMAN . 2001. Communities of endophytic fungiin leaves of a tropical timber tree (Guarea guidonia : Meliaceae).
Biotropica 33: 352–360.GANLEY , R. J., S. J. BRUNSFELD , AND G. NEWCOMBE . 2004. A community of
unknown, endophytic fungi in western white pine. Proceedings of the
National Academy of Sciences, USA 101: 10107–10112.GANLEY , R. J., AND G. NEWCOMBE . 2006. Fungal endophytes in seeds and
needles of Pinus monticola . Mycological Research 110: 318–327.GAUCH , H. G. JR . 1982. Multivariate analysis in community structure.
Cambridge University Press, Cambridge, UK.GLIME , J. M. 2007. Bryophyte ecology, vol 1. Physiological ecology.
Electronic book sponsored by Michigan Technological Universityand the International Association of Bryologists, website http://www.bryoecol.mtu.edu/ [accessed 29 August 2011].
GOTELLI , N. J. 2008. Measuring species diversity. In A primer of ecology,4th ed., 204–224. Sinauer, Sunderland, Massachusetts, USA.
GUEIDAN , C., C. RUIBAL , G. S. DE HOOG , AND H. SCHNEIDER . 2011. Rock-inhabiting fungi originated during periods of dry climate in the lateDevonian and middle Triassic. Fungal Biology 115: 987–996.
HAMMER , Ø., D. A. T. HARPER , AND P. D. RYAN . 2001. PAST:Paleontological statistics software package for education and dataanalysis. Palaeontologia Electronica 4: 9 pp.
HARDY , O. J. 2010. BiodivR 1.2. A program to compute statistically unbi-ased indices of species diversity within sample and species similaritybetween samples using rarefaction principles. Website http://ebe.ulb.ac.be/ebe/Software.html.
HELANDER , M. L., S. NEUVONEN , T. SIEBER , AND O. PETRINI . 1993. Simulatedacid rain affects birch leaf endophyte populations. Microbial Ecology 26: 227–234.
HIGGINS , K. L., A. E. ARNOLD , J. MIADLIKOWSKA , S. D. SARVATE , AND F.LUTZONI . 2007. Phylogenetic relationships, host affinity, and geo-graphic structure of boreal and arctic endophytes from three majorplant lineages. Molecular Phylogenetics and Evolution 42: 543–555.
HIGGINS , K. L., P. D. COLEY , T. A. KURSAR , AND A. E. ARNOLD . 2011. Culturingand direct PCR suggest prevalent host generalist among diverse fungalendophytes of tropical forest grasses. Mycologia 103: 247–260.
HOFFMAN , M., AND A. E. ARNOLD . 2008. Geography and host identityinteract to shape communities of endophytic fungi in cupressaceoustrees. Mycological Research 112: 331–344.
HULT É N , E. 1965. Flora of Alaska and neighboring territories: A manualof the vascular plants. Stanford University Press, Stanford, California,USA.
JOHNSON , J. A., AND N. J. WHITNEY . 1989. A study of fungal endophytes ofneedles of balsam fir ( Abies balsamea ) and red spruce (Picea rubens )in New Brunswick, Canada, using culture and electron microscopetechniques. Canadian Journal of Botany 67: 3513–3516.
JUMPPONEN , A., AND K. L. JONES . 2009. Massively parallel 454 sequenc-ing indicates hyperdiverse fungal communities in temperate Quercus
macrocarpa phyllosphere. The New Phytologist 184: 438–448.KUNIN , V., A. ENGELBREKTSON , H. OCHMAN , AND P. HUGENHOLTZ . 2010.
Wrinkles in the rare biosphere: Pyrosequencing errors can lead to ar-tificial inflation of diversity estimates. Environmental Microbiology 12: 118–123.
LEGENDRE , P. 2000. Comparison of permutation methods for the partialcorrelation and partial Mantel tests. Journal of Statistical Computation
and Simulation 67: 37–73.LEGENDRE , P., AND M. TROUSSELLIER . 1988. Aquatic heterotrophic bacte-
ria: Modeling in the presence of spatial autocorrelation. Limnology
and Oceanography 33: 1055–1067.
LODGE , D. J., P. J. FISHER , AND B. C. SUTTON . 1996. Endophytic fungi o Manilkara bidentata leaves in Puerto Rico. Mycologia 88: 733–738.
LUMBSCH , H. T., P. K. BUCHANAN , T. W. MAY , AND G. M. MUELLER . 2008Phylogeography and biogeography of Fungi. Mycological Research
112: 423–424.MAGURRAN , A. E. 2004. Measuring biological diversity. Blackwell
Oxford, UK.MANLY , B. J. F. 1997. Randomization, bootstrap and Monte Carlo meth
ods in biology, 2nd ed. Chapman and Hall, London, UK.MÁ RQUEZ , L. M., R. S. REDMAN , R. J. RODRIGUEZ , AND M. J. ROOSSINCH
2007. A virus in a fungus in a plant: Three-way symbiosis requiredfor thermal tolerance. Science 315: 513–515.
MEJ Í A , L. C., E. I. ROJAS , Z. MAYNARD , S. VAN BAEL , A. E. ARNOLD , PHEBBAR , G. J. SAMUELS , ET AL . 2008. Endophytic fungi as biocontrol agents of Theobroma cacao pathogens. Biological Control 464–14.
PAN , J. J., A. M. BAUMGARTEN , AND G. MAY . 2008. Effects of host planenvironment and Ustilago maydis infection on the fungal endophyte community of maize ( Zea mays ). The New Phytologist 178147–156.
PAN , J. J., AND G. MAY . 2009. Fungal–fungal associations affect the assemblyof endophyte communities in maize ( Zea mays ). Microbial Ecology 58668–678.
PEAY , K., M. BIDARTONDO , AND A. E. ARNOLD . 2010. Not every fungus is ev
erywhere: Scaling to the biogeography of fungal–plant interactions acrosroots, shoots, and ecosystems. The New Phytologist 185: 878–882.
PETRINI , O. 1991. Fungal endophytes of tree leaves. In J. H. Andrews and SS. Hirano [eds.], Microbial ecology of leaves, 179–197. Springer-VerlagNew York, New York, USA.
PETRINI , O. 1996. Ecological and physiological aspects of host-specificityin endophytic fungi. In S. C. Redlin and L. M. Carris [eds.], Endophytifungi in grasses and woody plants, 87–100. APS Press, St PaulMinnesota, USA.
PETRINI , O., AND G. CARROLL . 1981. Endophytic fungi in foliage of someCupressaceae in Oregon. Canadian Journal of Botany 59: 629–636.
RADFORD , A. E., H. E. AHLES , AND C. R. BELL . 1968. Manual of the vasculaflora of the Carolinas. University of North Carolina Press, Chapel HillNorth Carolina, USA.
REIHER , A. 2011. Leaf-inhabiting endophytic fungi in the canopy of thLeipzig floodplain forest. Ph.D. dissertation, University of LeipzigGermany.
RISSLER , L. J., AND J. J. APODACA . 2007. Adding more ecology into speciedelimitation: Ecological niche models and phylogeography help define cryptic species in the black salamander ( Aneides flavipunctatus )Systematic Biology 56: 924–942.
RODRIGUES , K. F. 1994. The foliar fungal endophytes of the Amazonian palm Euterpe oleracea . Mycologia 86: 376–385.
RODRIGUEZ , R. J., J. F. WHITE , A. E. ARNOLD , AND R. S. REDMAN . 2009. Fungaendophytes: Diversity and functional roles. The New Phytologist 182314–330.
SAUNDERS , M., A. E. GLENN , AND L. M. KOHN . 2010. Exploring the evolutionary ecology of fungal endophytes in agricultural systems: Using functional traits to reveal mechanisms in community processes. Evolutionary
Applications 3: 525–537.SCHLOSS , P. D., S. L. WESCOTT , T. RYABIN , J. R. HALL , M. HARTMANN , E
B. HOLLISTER , R. A. LESNIEWSKI , ET AL . 2009. Introducing mothurOpen-source, platform-independent, community-supported softwarefor describing and comparing microbial communities. Applied and
Environmental Microbiology 75: 7537–7541.SMOUSE , P. E., J. C. LONG , AND R. R. SOKAL . 1986. Multiple regression and
correlation extensions of the Mantel test of matrix correspondenceSystematic Biology 35: 627–632.
STEEMANS , P., A. LE HÉ RISS É , J. MELVIN , M. A. MILLER , F. PARIS , J. VERNIERS
AND C. H. WELLMAN . 2009. Origin and radiation of the earliest vasculaland plants. Science 324: 353.
STONE , J. K., C. W. BACON , AND J. F. WHITE JR . 2000. An overview of endophytic microbes: Endophytism defined. In C. W. Bacon and J. F. White[eds.], Microbial endophytes, 3–29. Marcel Dekker, New York, NewYork, USA.

8/11/2019 Fungi Divesity
http://slidepdf.com/reader/full/fungi-divesity 17/17
914 AMERICAN JOURNAL OF BOTANY
SUN , Y., Y. CAI , F. YU , M. L. FARRREL , W. MCKENDREE , AND W.FARMERIE . 2009. ESPRIT: Estimating species richness using largecollections of 16S rRNA pyrosequences. Nucleic Acids Research 37: e76.
SURYANARAYANAN , T. S., AND V. KUMARESAN . 2000. Endophytic fungi ofsome halophytes from an estuarine mangrove forest. Mycological
Research 104: 1465–1467.SURYANARAYANAN , T. S., T. S. MURALI , N. THIRUNAVUKKARASU , M. B. G.
RAJULU , G. VENKATESAN , AND R. SUKUMAR . 2011. Endophytic fun-gal communities in woody perennials of three tropical forest types ofthe Western Ghats, southern India. Biodiversity and Conservation 20:913–928.
SURYANARAYANAN , T. S., G. N. THIRUNAVUKKARASU , G. N. HARIHARAN , AND P. BALAJI . 2005. Occurrence of non-obligate microfungi inside lichenthalli. Sydowia 57: 120–130.
SURYANARAYANAN , T. S., G. VENKATESAN , AND T. S. MURALI . 2003. Endophyticfungal communities in leaves of tropical forest trees: Diversity and distri-bution patterns. Current Science 85: 489–493.
TAYLOR , L. R. 1978. Bates, Williams, Hutchinson—A variety of diversi-ties. In L. A. Mound and N. Warloff [eds.], Diversity of insect faunas,1–18. Blackwell, Oxford, UK.
TEDERSOO , L., R. H. NILSSON , K. ABARENKOV , T. JAIRUS , A. SADAM , I.SAAR , M. BAHRAM , ET AL . 2010. 454 Pyrosequencing and Sangersequencing of tropical mycorrhizal fungi provide similar results
but reveal substantial methodological biases. The New Phytologist 188: 291–301.
TRUEBLOOD , D. D., E. D. GALLAGHER , AND D. M. GOULD . 1994. Threesages of seasonal succession on the Savin Hill Cove mudflat, BostonHarbor. Limnology and Oceanography 39: 1440–1454.
U’REN , J. M., J. W. DALLING , R. E. GALLERY , D. R. MADDISON , E. C. DAVIS ,C. M. GIBSON , AND A. E. ARNOLD . 2009. Diversity and evolutionaryorigins of fungi associated with seeds of a neotropical pioneer tree: Acase study for analyzing fungal environmental samples. Mycological
Research 113: 432–449.U’REN , J. M., F. LUTZONI , J. MIADLIKOWSKA , AND A. E. ARNOLD . 2010.
Community analysis reveals close affinities between endophytic andendolichenic fungi in mosses and lichens. Microbial Ecology 60:
340–353.VEGA , F. E., A. SIMPKINS , M. C. AIME , F. POSADA , S. W. PETERSON , S. A.
REHNER , F. INFANTE , ET AL . 2010. Fungal endophyte diversity in cof-fee plants from Columbia, Hawai’i, Mexico and Puerto Rico. Fungal
Ecology 3: 122–138.VILGALYS , R., AND M. HESTER . 1990. Rapid genetic identification and
mapping of enzymatically amplified ribosomal DNA from severalCryptococcus species. Journal of Bacteriology 172: 4238–4246.
WANG , Z., P. R. JOHNSTON , S. TAKAMATSU , J. W. SPATAFORA , AND D.S. HIBBETT . 2006. Toward a phylogenetic classification of theLeotiomycetes based on rDNA data. Mycologia 98: 1065–1075.
WARWICK , R. M., K. R. CLARKE , AND SUHARSONO . 1990. A statisticalanalysis of coral community responses to the 1982–83 El Niño in theThousand Islands, Indonesia. Coral Reefs 8: 171–179.
WELLMAN , C. H., P. L. OSTERLOFF , AND U. MOHIUDDIN . 2003. Fragments ofthe earliest land plants. Nature 425: 282–285.
WHITE , T. J., T. BRUNS , S. LEE , AND J. W. TAYLOR . 1990. Amplificationand direct sequencing of fungal ribosomal RNA genes for phylogenet-ics. In M. A. Innis, D. H. Gelfand, J. J. Sninsky, and T. J. White [eds.],PCR protocols: A guide to methods and applications. Academic Press,San Diego, California, USA.