further analysis of data from the usage study · element energy (2013), “further analysis of data...
TRANSCRIPT

Further Analysis of Data from the HEUS Correlation of Consumption with Low Carbon Technologies
i
Further Analysis of
Data from the
Household Electricity
Usage Study:
Correlation of
Consumption with Low
Carbon Technologies
Final report for
Department of Energy
and Climate Change
and
Department for the
Environment Food and
Rural Affairs
24th March 2014
Element Energy Limited
20 Station Road
Cambridge CB1 2JD
Tel: 01223 852499
Fax: 01223 353475

Further Analysis of Data from the HEUS Correlation of Consumption with Low Carbon Technologies
i
Contents
1 Executive summary ........................................................................................ 1
2 Introduction ..................................................................................................... 7
3 Methodology and assumptions ....................................................................... 9
3.1 Annual and monthly household electricity consumption ................................ 9
3.2 Low carbon technology demand and generation profiles ............................ 11
3.3 Low carbon technology uptake and population growth ................................ 14
3.4 National scale-up ........................................................................................ 18
3.5 Load Shifting Measures .............................................................................. 18
4 The Household Electricity Usage Study demand profiles .............................. 19
5 Low carbon technology profiles for a single household ................................. 21
5.1 Electric vehicles .......................................................................................... 21
5.2 Heat pumps ................................................................................................ 22
5.3 Solar photovoltaic systems ......................................................................... 23
5.4 Small-scale wind turbines ........................................................................... 24
6 Interaction of low carbon technologies with household electricity usage ....... 26
6.1 Demand technologies ................................................................................. 26
6.2 Generation technologies ............................................................................. 28
6.3 Aggregate impact of a single household taking up all LCTs ........................ 33
7 Load shifting potential of low carbon technologies ........................................ 36
7.1 Load shifting potential of heat pumps .......................................................... 36
7.2 Load shifting potential of electric vehicle charging ...................................... 39
8 National Implications of low carbon technologies .......................................... 43
8.1 Annual electricity consumption trends ......................................................... 43
8.2 Forecast Diurnal Demand and Generation Profiles by Uptake Scenario ..... 44
8.3 Impact of Demand Side Response on Load Shifting ................................... 47
9 Conclusions and recommendations .............................................................. 51
10 Appendix....................................................................................................... 54
10.1 Household Electricity Usage Study – Demand profiles by month.............. 54
10.2 Heat pump operation logic ........................................................................ 54
10.3 Electric vehicle assumptions .................................................................... 56
10.4 Air and ground average temperature profiles............................................ 58

Further Analysis of Data from the HEUS Correlation of Consumption with Low Carbon Technologies
ii
Authors
For comments or queries please contact:
Dr Alvin Chan
01223 855249
Dr Mark Hughes
01223 855240

Further Analysis of Data from the HEUS Correlation of Consumption with Low Carbon Technologies
1
1 Executive summary
Objective
Between 2010 and 2011, the Department of Energy and Climate Change
(DECC), the Department for the Environment Food and Rural Affairs
(Defra) and the Energy Saving Trust conducted the Household Electricity
Usage Study (HEUS) to examine the electricity usage patterns of 250
owner-occupier households in England. This study produced
comprehensive household electricity usage profiles resolved to the level of
individual appliances.
While the HEUS didn’t specifically explore low carbon technologies (LCTs)
among the household appliances, both low carbon demand technologies
(such as heat pumps and electric vehicles) and low carbon embedded
generation technologies (such as small-scale solar photovoltaics and wind
turbines) can be expected to have significant impacts on household
electricity usage profiles as these technologies are more widely adopted in
the UK.
Our objective in this project is to draw on our existing models of LCTs and
DECC projections of their future adoption rates in the UK to explore their
expected impact on the household electricity usage profiles gathered in the
HEUS. We also examine how LCTs will impact on seasonal variations in
domestic electricity demand (i.e. winter versus summer) along with their
influence on household peak electricity demands and the extent to which
demand side response (DSR) strategies could limit these impacts, on a
household and national scale1.
Findings and Recommendations
UK domestic electricity demand from the grid is likely to rise
substantially, to as much as 48% over current levels, by 2030 driven by
a combination of population growth and demand from heat pumps and
electric vehicles, which are offset to some extent by embedded small-
scale wind and solar generation. Annual electricity demand from
1 We have assumed that the 250 English owner-occupied households monitored in the
HEUS give a reasonable representation of current UK household electricity consumption profiles consistent with findings in other recent HEUS studies: Element Energy (2013), “Further Analysis of Data from the Household Electricity Usage Study: Consumer Archetypes”. Element Energy (2013), “Further Analysis of Data from the Household Electricity Usage Study: Increasing Insight and UK Applicability”.

Further Analysis of Data from the HEUS Correlation of Consumption with Low Carbon Technologies
2
domestic consumers rises in all scenarios, reaching as much as
162TWh/year by 2030 in the High Uptake Scenario (see Figure 1)2.
Figure 1: Forecast UK annual domestic electricity demand for three DECC LCT uptake scenarios. Substantial increases in demand are forecast for 2030 under all LCT uptake scenarios.
The seasonal dependence of electricity consumption is set to markedly
increase in the Central and High Uptake Scenarios. Average daily
domestic electricity demand in December is expected to be
685GWh/day, more than double the demand forecast for the summer
months (see Figure 2). The ratio of average daily domestic demand in
winter versus summer months is expected to rise from 1.76 in 2010 to
2.15 in 2030 in the High Uptake Scenario.
Recommendation: Planning for generation and network capacity
needs to take into account the increasing seasonal dependency of
2 This includes the impact of population growth on base demand, but for simplicity we have
not included any effects due to increases in energy efficiency as these have been examined elsewhere: Element Energy (2013), “Further Analysis of Data from the Household Electricity Usage Study: Increasing Insight and UK Applicability”, where a UK-wide technical potential saving of 15TWh/year from energy efficiency was identified.

Further Analysis of Data from the HEUS Correlation of Consumption with Low Carbon Technologies
3
domestic electricity demand and the resulting system redundancies
this requires in the electricity networks. This highlights the
importance of comprehensive industry planning and analysis work in
this area, such as that initiated by DECC and Ofgem’s Smart Grid
Forum. Since these impacts will vary considerably for different
regional demographic compositions3, behavioural trends, building
types, LCT uptake characteristics4,5 and levels of technology
clustering, future work will need to focus on how the investment
required for network reinforcement over the coming decades
(estimated by the Smart Grid Forum to be between £20-£60 billion
cumulatively to 20506) will vary for different network regions and
assets in the UK.
Figure 2: Forecast average daily electricity demand from domestic consumers, under the DECC High Uptake Scenario (i.e. high uptake of electric vehicles, heat pumps, solar PV and small-scale wind) compared to the 2010 HEUS monthly averages. By 2030, demand on an average day in December increases to more than double that of demand on average days in the summer months.
3 Element Energy (2013), “Further Analysis of Data from the Household Electricity Usage
Study: Increasing Insight and UK Applicability”. 4 Element Energy (2011) “Plug-in Vehicles Economics and Infrastructure: Quantifying
Consumer Behaviour”, for the Energy Technologies Institute. 5 Element Energy (2009), “Strategies for the uptake of electric vehicles and associated
infrastructure implications”, for the Committee on Climate Change. 6 DECC/Ofgem Smart Grid Forum (2012), “Assessing the Impact of Low Carbon
Technologies on Great Britain’s Power Distribution Networks”.
0
100
200
300
400
500
600
700
Dai
ly D
om
est
ic E
lect
rici
ty D
em
and
(G
Wh
/day
)
2010 (HEUS) 2020 2030

Further Analysis of Data from the HEUS Correlation of Consumption with Low Carbon Technologies
4
The implications for peak-time demand from LCT uptake are also
significant with an approximately 40% and 60% increase in demand
during the morning and evening peaks, respectively, by 2030 for the
DECC High Uptake Scenario relative to the average domestic profile
from the HEUS (see Figure 3). The majority of this additional demand
originates from the operation of heat pumps.
Recommendation: The increased “peakiness” of domestic diurnal
demand highlights the importance of DSR strategies as LCT uptake
increases. Further work is required to understand how the variations
in peak shifting potentials for different consumer archetypes7,8 map
to the likelihood of LCT uptake, which will have important
implications for the total amount of peak-time demand that can be
shifted. Further work is also required to understand how daily peaks
in domestic demand from the grid, and the ability to level them, will
vary for different regions and network assets in the UK. More region
and asset specific information on how peaks in domestic demand
will interact with commercial and industrial loads is also needed.
Figure 3: UK annual average electricity demand and generation profiles, in 2030 for the DECC High Uptake Scenario with no DSR.
7 Element Energy (2013), “Further Analysis of Data from the Household Electricity Usage
Study: Consumer Archetypes”. 8 Element Energy (2013), “Further Analysis of Data from the Household Electricity Usage
Study: Increasing Insight and UK Applicability”.
00:00 04:00 08:00 12:00 16:00 20:00
-10
-5
0
5
10
15
20
25
30
35
-10
-5
0
5
10
15
20
25
30
35
00:00 04:00 08:00 12:00 16:00 20:00
UK
Do
me
stic
Ele
ctri
city
De
man
d (
GW
)
PV Wind Heat Pump
EV HEUS Before LCTs HEUS After LCTs

Further Analysis of Data from the HEUS Correlation of Consumption with Low Carbon Technologies
5
We have modelled several DSR scenarios for heat pumps and electric
vehicles to determine the extent to which the morning and evening
peak increases could be mitigated. We find that simple time-of-use
tariffs (such as the current Economy 10 tariff), if widely deployed with
uniform time bandings, could potentially create network load problems
related to loss of diversity in UK electricity consumption. Figure 4
shows that heat pumps and electric vehicle charging that are
automated to avoid high-tariff periods will create significant peaks at the
beginning of static low-tariff time-periods as these devices all activate
at the same time.
Recommendation: When designing peak-shifting strategies, care
must be taken to ensure behavioural diversity is maintained. For
example, in the case of time-of-use tariffs, staggered start-times for
different consumers, both locally and nationally, could be used to
ensure that new peaks at the beginning of low-tariff periods are not
created if these schemes are widely adopted. The formation of new
peaks could also be mitigated by the use of a suite of DSR
technologies and incentives (also including direct remote control of
LCT devices, well-monitored dynamic time-of-use tariffs, etc.).
Figure 4: UK annual average electricity demand and generation profile, in 2030 for the DECC High Uptake Scenario, with heat pumps and EVs operating on the Economy 10 tariff. Substantial new peaks are formed at the beginning of low-tariff periods.
00:00 04:00 08:00 12:00 16:00 20:00
-10
-5
0
5
10
15
20
25
30
35
40
-10
-5
0
5
10
15
20
25
30
35
40
00:00 04:00 08:00 12:00 16:00 20:00
UK
Do
me
stic
Ele
ctri
city
De
man
d (
GW
)
PV Wind Heat Pump
EV HEUS Before LCTs HEUS After LCTs

Further Analysis of Data from the HEUS Correlation of Consumption with Low Carbon Technologies
6
We modelled the effect of diversified DSR approaches to determine the
optimised technical potential for DSR (see Figure 5). In this case, an
average reduction of 2.5GW can be achieved in the evening peak
period. The heat pump component of this shift (approximately 50-80%,
depending on season) is based on access to a 180L thermal storage
tank – a consideration which must be balanced with its physical
footprint in a typical household.
Recommendation: Further research is required to assess the
physical capacity, consumer attitudes, and likelihood of uptake for
hot water thermal storage tanks in UK domestic heat pump
installations since this is a critical element for significant domestic
DSR when LCTs are more widely adopted in the UK.
Figure 5: UK annual average electricity demand and generation profile, in 2030 with diversified DSR measures for the DECC High Uptake Scenario.
00:00 04:00 08:00 12:00 16:00 20:00
-10
-5
0
5
10
15
20
25
30
35
40
-10
-5
0
5
10
15
20
25
30
35
40
00:00 04:00 08:00 12:00 16:00 20:00
UK
Do
me
stic
Ele
ctri
city
De
man
d (
GW
)
PV Wind
Heat Pump EV
HEUS Before LCTs HEUS After LCTs (Diversified DSR)

Further Analysis of Data from the HEUS Correlation of Consumption with Low Carbon Technologies
7
2 Introduction
Between 2010 and 2011, the Department of Energy and Climate Change
(DECC), the Department for the Environment Food and Rural Affairs
(Defra) and the Energy Saving Trust (EST) conducted the Household
Electricity Usage Study (HEUS) which examined the electricity usage
behaviour of 250 owner-occupier households in England. A large dataset
was produced by this study on the appliance and electricity usage
characteristics of each monitored household, as well as various details
about the demographics of the household occupants and the
characteristics of the buildings in which they live.
While the incidence of low carbon technologies (LCTs) in the HEUS
households was low, DECC projections9 forecast significant uptake of LCTs
in UK households over the coming decades, with significant implications for
the electricity consumed, and generated, by households in the UK.
In this report, we investigate how the electricity consumption profiles for
typical English households, as recorded by the HEUS, will be impacted by
the uptake of LCTs including electric vehicles (EVs) and heat pumps, as
well as domestic solar photovoltaic (PV) and micro-wind generation
systems.
More specifically, this report examines:
a) Typical profiles of electricity demand/generation from heat pumps,
electric vehicles, domestic solar PV and small-scale wind turbine
systems.
b) The interactions between these new LCT demand and generation
profiles with the existing electricity consumption profile of the
average English household (from the HEUS) are explored to
determine where new peaks in consumption (or electricity export)
might emerge. The forecast uptake rates for each LCT9 are used to
examine when these peaks are expected to emerge in the average
UK domestic profile10.
c) The potential for demand side response (DSR) measures to limit the
impact of new demand peaks on a household and national scale.
9 DECC/Ofgem Smart Grid Forum (2012), “Assessing the Impact of Low Carbon
Technologies on Great Britain’s Power Distribution Networks”. 10
In this report we assume that the HEUS household profiles are approximately representative of the UK average based on the findings of earlier work: Element Energy (2013), “Further Analysis of Data from the Household Electricity Usage Study: Increasing Insight and UK Applicability”.

Further Analysis of Data from the HEUS Correlation of Consumption with Low Carbon Technologies
8
Figure 6: Electricity demand profile of the average HEUS household as a function of time of day, as a yearly average and for the hottest and coldest days of the year11.
11
Above average demand levels on the coldest and hottest days of the year are primarily related to additional demand from heating and cold appliances, respectively.
0
200
400
600
800
1000
1200
1400
1600
1800
00:00 04:00 08:00 12:00 16:00 20:00
Ele
ctri
city
De
man
d (
W)
Yearly Average Coldest Day (20/12/2010) Hottest Day (26/06/2010)

Further Analysis of Data from the HEUS Correlation of Consumption with Low Carbon Technologies
9
3 Methodology and assumptions
3.1 Annual and monthly household electricity consumption
The first step was to calculate the average annual and monthly electricity
demand profiles for the 250 HEUS households, with 10-minute resolution.
Because not all HEUS households were monitored over a full year, the
mean monthly consumption profiles are taken from households where
measurements were available for the month in question. The strong
seasonal dependence of domestic electricity consumption in the HEUS
households is shown below in Figure 7. All monthly average profiles exhibit
a strong peak during the early evening, between 6-7pm.
Figure 7: The average diurnal electricity demand profile for the HEUS households over a whole year and for the months with lowest (May) and highest (December) total electricity demand.
While energy efficiency improvements and new appliances can be
expected to change typical domestic demand profiles over time, for
simplicity, we have not considered these effects when looking at the impact
of LCT adoption on the average HEUS household demand profiles12.
12
The impact of energy efficiency measures on the HEUS households has already been examined in: Element Energy (2013), “Further Analysis of Data from the Household Electricity Usage Study: Increasing Insight and UK Applicability”, and Cambridge Architectural Research, Element Energy, Loughborough University (2013), “Electrical Appliances at Home: Tuning in to Energy Saving”.
0
200
400
600
800
1000
1200
00:00 04:00 08:00 12:00 16:00 20:00
Ele
ctri
city
De
man
d (
W)
Yearly Average May average December average

Further Analysis of Data from the HEUS Correlation of Consumption with Low Carbon Technologies
10
Similarly, we have not considered changes to existing consumption
patterns in response to adoption of new LCTs (e.g. households adopting
solar PV may adjust existing consumption patterns to maximise on-site use
of generated electricity). That is, we assumed no change in the underlying
demand profile when examining the impact of increasing levels of LCT
adoption over time. In the case of households that install heat pumps, we
do deduct any existing primary electric space heating consumption from
their underlying profile. Where households used secondary electric space
heating to supplement their primary system, it was assumed that this
behaviour would continue regardless of the primary system used, though it
is recognised that improvements in thermal efficiency and heating control
systems may in fact reduce secondary electric space heating usage in
some of these cases.
When determining the average demand from space heating in the 250
HEUS households, only the 116 households that were monitored during the
November to March space heating period were included, since households
monitored outside this period would give artificially low space heating
values. For all other appliance types, the full HEUS sample was used. Of
the 250 HEUS households, only 9 used primary electric heating, and only 3
of these were monitored during the November to March heating period. As
such, the sample size on which primary space heating load was determined
was unfortunately small. However, the high uncertainty in the primary
electric heating load profile is offset by the low proportion of homes with this
technology (less than 4% of the HEUS sample) when building the national
average domestic profile for the HEUS dataset. For comparison, 8% of
households across the UK are reported to use primary electric heating13,14.
Analysis in this report is constrained by the limited sample size (250
households) and monitoring duration (26 households were monitored for a
full year, the remaining 224 were monitored for a month each on a rolling
basis throughout the trial) of the HEUS dataset. Therefore, we have tried to
avoid cross-sectioning the dataset into smaller groups where possible.
Given the seasonal nature of many LCT domestic loads, it was necessary
to break the average HEUS demand profiles out by month, however, to
preserve sample sizes, we have not further broken down the HEUS group
by household types. For larger sample sizes, it is possible to apply different
LCT uptake rates for various household types. However, the extra
resolution of this approach would not be meaningful in the context of the
small HEUS sample size.
13
Department of Energy and Climate Change (2012), “Energy Consumption in the UK”, available from: https://www.gov.uk/government/publications/energy-consumption-in-the-uk 14
Palmer, J, Cooper, I (2012), “UK Housing Energy Fact File 2012”, for DECC.
Further Analysis of Data from the HEUS Correlation of Consumption with Low Carbon Technologies
11
3.2 Low carbon technology demand and generation profiles
3.2.1 Electric vehicle charging
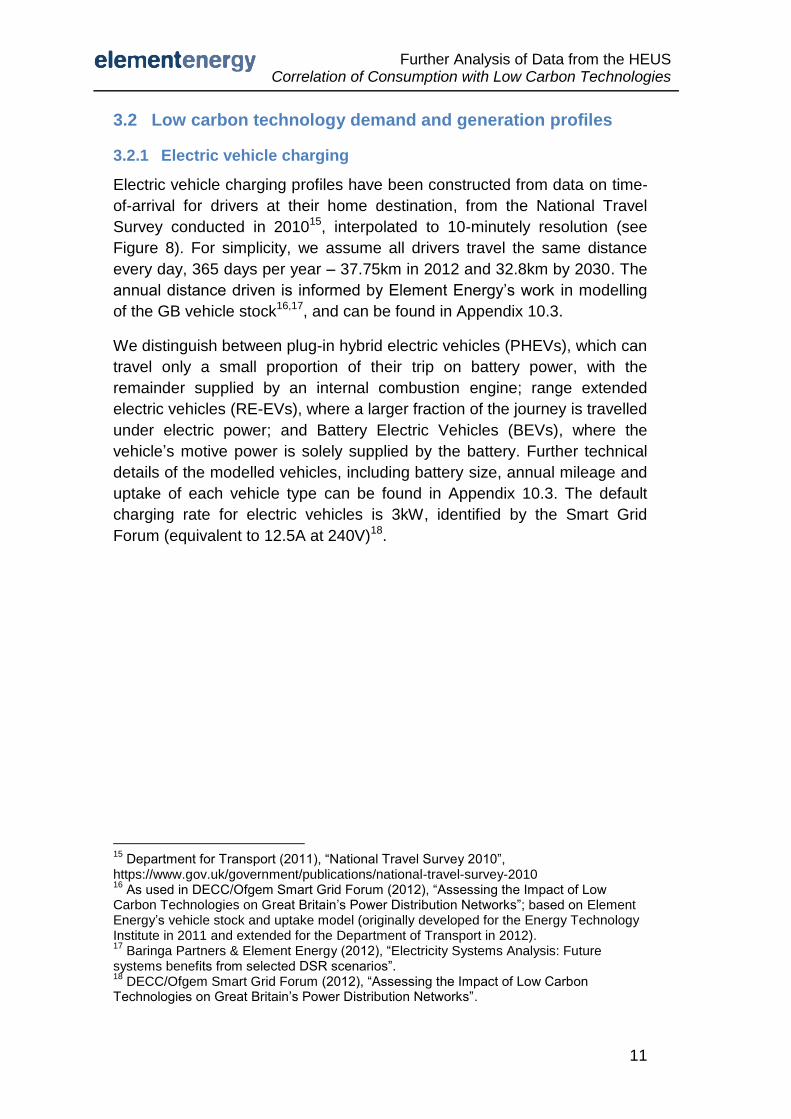
Electric vehicle charging profiles have been constructed from data on time-
of-arrival for drivers at their home destination, from the National Travel
Survey conducted in 201015, interpolated to 10-minutely resolution (see
Figure 8). For simplicity, we assume all drivers travel the same distance
every day, 365 days per year – 37.75km in 2012 and 32.8km by 2030. The
annual distance driven is informed by Element Energy’s work in modelling
of the GB vehicle stock16,17, and can be found in Appendix 10.3.
We distinguish between plug-in hybrid electric vehicles (PHEVs), which can
travel only a small proportion of their trip on battery power, with the
remainder supplied by an internal combustion engine; range extended
electric vehicles (RE-EVs), where a larger fraction of the journey is travelled
under electric power; and Battery Electric Vehicles (BEVs), where the
vehicle’s motive power is solely supplied by the battery. Further technical
details of the modelled vehicles, including battery size, annual mileage and
uptake of each vehicle type can be found in Appendix 10.3. The default
charging rate for electric vehicles is 3kW, identified by the Smart Grid
Forum (equivalent to 12.5A at 240V)18.
15
Department for Transport (2011), “National Travel Survey 2010”, https://www.gov.uk/government/publications/national-travel-survey-2010 16
As used in DECC/Ofgem Smart Grid Forum (2012), “Assessing the Impact of Low Carbon Technologies on Great Britain’s Power Distribution Networks”; based on Element Energy’s vehicle stock and uptake model (originally developed for the Energy Technology Institute in 2011 and extended for the Department of Transport in 2012). 17
Baringa Partners & Element Energy (2012), “Electricity Systems Analysis: Future systems benefits from selected DSR scenarios”. 18
DECC/Ofgem Smart Grid Forum (2012), “Assessing the Impact of Low Carbon Technologies on Great Britain’s Power Distribution Networks”.
Further Analysis of Data from the HEUS Correlation of Consumption with Low Carbon Technologies
12
Figure 8: Number of electric vehicles arriving home, in 10-minute intervals, calculated from the National Travel Survey (2010) for 7.6 million vehicles.
3.2.2 Domestic heat pumps
In order to accurately determine electricity demand from domestic heat
pumps, the thermal demand and outdoor ambient temperature must be well
understood.
We model the operation of a typical heat pump based on the performance
of a real device19 with a water heating loop and a design flow temperature
of 50°C and return temperature of 45°C. We assume no thermal loss in
pipes leading from the heat exchanger to radiators, and 20 litres of water in
the heating system per kW of electric heating power, with a target indoor
temperature of 20°C, based on figures from a publication for the Energy
Saving Trust where heat pumps underwent field trials20. In demand side
response scenarios, we have modelled a hot water cylinder with a capacity
of 180L, storing water at up to 50°C, based on the central test scenario
from a recent study for DECC21.
For each day in a given month, the mean temperature for each 10-minute
interval has been calculated for a representative central England site that is
19
Dimplex (2007), “Heat Pumps - heating that doesn’t cost the Earth”, accessible from: http://www.fusiongsource.com/brochures/Dimplex%20%20Heat_Pumps_CPD_March07.pdf 20
EA Technology (2011), “The effect of thermostatic radiator valves on heat pump performance”. 21
Kiwa GASTEC at CRE (2013), “Investigation of the interaction between hot water cylinders, buffer tanks and heat pumps”.
0
20,000
40,000
60,000
80,000
100,000
120,000
140,000
160,000
180,000
200,000
00:00 04:00 08:00 12:00 16:00 20:00
Nu
mb
er
of
Ve
hic
les
Arr
ivin
g H
om
e

Further Analysis of Data from the HEUS Correlation of Consumption with Low Carbon Technologies
13
not subject to urban heat-island effects. The location has been selected to
be approximately representative of the wide range of conditions
encountered across the UK. The mean temperature profiles for average
days in the coldest and warmest months are shown in Figure 9. We also
used aggregated average UK diurnal thermal demand profiles obtained
from the Carbon Trust’s Micro CHP trials.22 For further technical details,
including the control strategy for heat pumps, see Appendix 10.2.
Figure 9: Temperature on an average day for the coldest (February) and warmest (August) months.
Heat pump performance is affected significantly by the source temperature,
characterised by the coefficient of performance (COP). The COP values
used in this model have been modelled after performance of a real life
device23 (a 2.2kW-electric heat pump, producing 8kW of thermal power at
7°C). A water flow temperature of 50°C is assumed for the heating circuit.
We consider both air source and ground source heat pumps in this study24.
A schematic representation of the heat pump model and a comparison of
the performance predicted by the heat pump model with published test data
are given in Appendix 10.2.
22
The Carbon Trust (2011), “Micro CHP Field Trial”. 23
Dimplex (2007), “Heat Pumps - heating that doesn’t cost the Earth”, accessible from: http://www.fusiongsource.com/brochures/Dimplex%20%20Heat_Pumps_CPD_March07.pdf 24
Due to the different source temperatures for air source and ground source heat pumps, there exist variations in the seasonal performance factor (SPF) calculated for each device.
0
5
10
15
20
25
00:00 04:00 08:00 12:00 16:00 20:00
Air
Te
me
pra
ture
(0C
)
February August

Further Analysis of Data from the HEUS Correlation of Consumption with Low Carbon Technologies
14
3.2.3 Domestic solar photovoltaic systems
The number of domestic solar photovoltaic (PV) installations has increased
rapidly in recent years, with over 480,000 systems of between 0 and 4kWP
installed by November 201325. On average, these systems are rated at
3kWP – the size assumed in this study for a typical household installation.
We have determined hourly PV generation profile shapes for each month
using the PVGIS solar output estimation tool26, for a tilted plane on a south-
facing, 40° tilt roof in Market Harborough, Leicestershire. This has been
scaled to give electricity production of 937kWh/kWP, as given by the MCS
PV Installation Guide27.
3.2.4 Small-scale wind turbines
In this report, we assume a typical small-scale wind turbine installation with
a rated power of 2.5kWP and 15% load factor, based on typical installations
in a report by the Carbon Trust28 and feed-in tariff generation statistics29.
Monthly wind generation profiles for this size system were obtained by
scaling 30 minute resolution wind-turbine data published by Ofgem and
other literature sources30,31.
3.3 Low carbon technology uptake and population growth
Uptake rates for electric vehicles, domestic heat pumps and domestic solar
PV systems are based on DECC/Ofgem scenarios used by the Smart Grid
Forum32. As there were no details on small-scale wind uptake in the
DECC/Ofgem Smart Grid Forum data, projections of uptake rates in this
case were based on historical growth rates for small wind turbines
(≤15kWP) from UK feed-in tariff statistics33 over the period 2010-2014. We
distinguish between Low, Central and High LCT uptake scenarios as
provided in the Smart Grid Forum data (see Figure 10 to Figure 13).
Household growth projections from the Office of National Statistics (ONS)
25
Department of Energy and Climate Change (2013), “Statistical data set: Weekly solar PV installation & capacity based on registration date”. 26
European Commission, Joint Research Centre (2013), “Photovoltaic Geographical Information System (PVGIS)”. 27
The Microgeneration Certification Scheme (2013), “Solar Irradiance Datasets, MIS 3002”. Note this source does not include inverter and charge controller losses, or any de-rating for soiling or shading. 28
The Carbon Trust (2008), “Small-scale wind energy: Policy insights and practical guidance”. 29
DECC (2013), “Feed-in Tariff generation statistics”. 30
OFGEM (2012), “Renewable Obligation certificates”. 31
Elexon (2012), “New Electricity Trading Arrangements”. 32
DECC/Ofgem Smart Grid Forum (2012), “Assessing the Impact of Low Carbon Technologies on Great Britain’s Power Distribution Networks”. 33
DECC (2013) “Monthly central Feed-in Tariff register statistics”.

Further Analysis of Data from the HEUS Correlation of Consumption with Low Carbon Technologies
15
have been interpolated to provide an estimate of the number of households
in the United Kingdom from 2012-2030, shown in Figure 14, which is
relevant for determining UK domestic demand implications from LCT
uptake.
It is worth noting that the DECC/Ofgem Smart Grid Forum uptake
projections are only for Great Britain (England, Wales and Scotland). We
have assumed that the average household uptake is the same in Northern
Ireland when forecasting the total UK household electricity demand.
Of all heat pump installations, 79% of these are expected to be air source
heat pumps, with ground source units accounting for 21% of the
installations. Only 9% of total heat pump installations are installed in
household with existing primary electric heating systems34, which are
assumed to be displaced by the heat pump. No climate change impacts on
average temperatures are considered in this report.
Figure 10: UK domestic electric vehicles uptake for 2012-2030.
34
DECC (2013), “Renewable Heat Premium Payment Scheme”.
0
1,000,000
2,000,000
3,000,000
4,000,000
5,000,000
6,000,000
7,000,000
8,000,000
9,000,000
2010 2015 2020 2025 2030
Cu
mu
lati
ve d
om
est
ic e
lect
ric
veh
icle
s
Low Central High

Further Analysis of Data from the HEUS Correlation of Consumption with Low Carbon Technologies
16
Figure 11: UK domestic heat pump uptake for 2012-2030.
Figure 12: UK domestic solar photovoltaic systems uptake for 2012-2030.
0
1,000,000
2,000,000
3,000,000
4,000,000
5,000,000
6,000,000
7,000,000
8,000,000
9,000,000
2010 2015 2020 2025 2030
Cu
mu
lati
ve d
om
est
ic h
eat
pu
mp
inst
alla
tio
ns
Low Central High
0
500,000
1,000,000
1,500,000
2,000,000
2,500,000
3,000,000
3,500,000
4,000,000
2010 2015 2020 2025 2030
Cu
mu
lati
ve d
om
est
ic s
ola
r P
V in
stal
lati
on
s
Low Central High

Further Analysis of Data from the HEUS Correlation of Consumption with Low Carbon Technologies
17
Figure 13: UK domestic small-scale wind turbine uptake in the UK for 2012-2030.
Figure 14: UK household growth, interpolated from ONS Household Projections35
35
Office for National Statistics (2010), “ONS Household Projections, United Kingdom, 1961-2033”, Table 401.
0
20,000
40,000
60,000
80,000
100,000
120,000
140,000
160,000
2010 2015 2020 2025 2030
Cu
mu
lati
ve w
ind
tu
rbin
e in
stal
lati
on
s
Low Uptake Central Uptake High Uptake
0
5
10
15
20
25
30
35
40
2010 2015 2020 2025 2030
Nu
mb
er
of
UK
ho
use
ho
lds
(mill
ion
s)

Further Analysis of Data from the HEUS Correlation of Consumption with Low Carbon Technologies
18
Considering all technologies together, we define the Low Uptake Scenario
as Low EV Uptake, Low Heat Pump Uptake, Low Wind Uptake and Low PV
Uptake, and similarly for the Central and High Uptake Scenarios.
3.4 National scale-up
The electricity demand from an average household is a function of the
percentage of households taking up each low carbon technology. This is
determined via the ONS household forecast and the uptake rates identified
by the Smart Grid Forum – for example, if 10% of households take up EVs,
then 10% of the EV demand profile is added to the existing HEUS profile.
In this way, a new HEUS average profile is created, showing the electricity
demand profile after adoption of all LCTs. We assume that the uptake of
LCTs across the UK is consistent with the uptake in Great Britain. The
regional clustering effect of technology uptake is not considered in this
study.
Domestic electricity demand across the UK is calculated assuming the
average household is representative, and the demand in each time step is
multiplied by the projected number of households, to arrive at the
instantaneous power demand from all domestic properties across the
nation at a given time.
The domestic generation profiles from solar PV and wind technologies
include the variability in solar and wind resource, and are indicative of the
average generation for a representative day in each month. It is recognised
that there will be periods of high solar irradiance across the nation, for
example, where peak generation would be higher than indicated in the
average profile. On a monthly scale, however, these effects are balanced
out with periods of low irradiance.
3.5 Load Shifting Measures
To evaluate the load shifting potential of each low carbon technology, an
existing time-of-use tariff, Economy 1036,37, has been considered alongside
an alternative DSR strategy in which diversity of consumer behaviour is
maintained. We assume that all LCT users take up the DSR measures (and
have the thermal storage capacity required to do so), in order to gauge the
maximum potential for reducing peak demand.
36
We have assumed off-peak periods of 12am-5am, 1pm-4pm, 8pm-10pm for Economy 10 tariffs, based on available data. 37
Electric Heating Company, “Economy 10 times”, accessible from: http://www.electric-heatingcompany.co.uk/wp-content/uploads/2012/03/ss-Economy-10-Times.pdf

Further Analysis of Data from the HEUS Correlation of Consumption with Low Carbon Technologies
19
4 The Household Electricity Usage Study demand profiles
The average annual consumption for the HEUS households is 4,194
kWh/year, slightly below the 2012 value of 4,226 kWh/year from the DECC
Digest of UK Energy Statistics38. Only households that were monitored
during the November to March space heating period were used when
determining the average HEUS space heating demand (about 8.6% of total
electricity use). The breakdown by appliance is shown below in Figure 15. It
is important to keep in mind that the HEUS dataset is limited to owner-
occupier homes in England and, therefore, only provides an approximation
of the full UK domestic sector. However, the close approximation with the
average annual domestic demand reported by the DECC Digest of UK
Energy Statistics indicates that, in aggregate, this approximation is
reasonable.
Figure 15: Average household electricity consumption, from the Household Electricity Usage Study.
Figure 16 below shows the contribution of each appliance type to the
average demand profile for the HEUS sample households over a full year.
A full breakdown of electricity demand profiles by month is provided in
Appendix 10.1.
38
Department of Energy and Climate Change (2013), “Digest of UK energy statistics (DUKES)”.

Further Analysis of Data from the HEUS Correlation of Consumption with Low Carbon Technologies
20
Figure 16: Average diurnal electricity demand profile of the 250 HEUS households over a whole year showing the contribution of each appliance type.
0
100
200
300
400
500
600
700
800
00:00 04:00 08:00 12:00 16:00 20:00
Ele
ctri
city
De
man
d (
W)
Unknown Other
Space Heating Showers
Water heating Washing/drying/dishwasher
ICT Audiovisual
Lighting Cooking
Cold appliances
Further Analysis of Data from the HEUS Correlation of Consumption with Low Carbon Technologies
21
5 Low carbon technology profiles for a single household
In this chapter, we use the modelling approach outlined in Section 3.2 to
quantify the electricity generation or demand profile for each LCT taken up
by a single household.
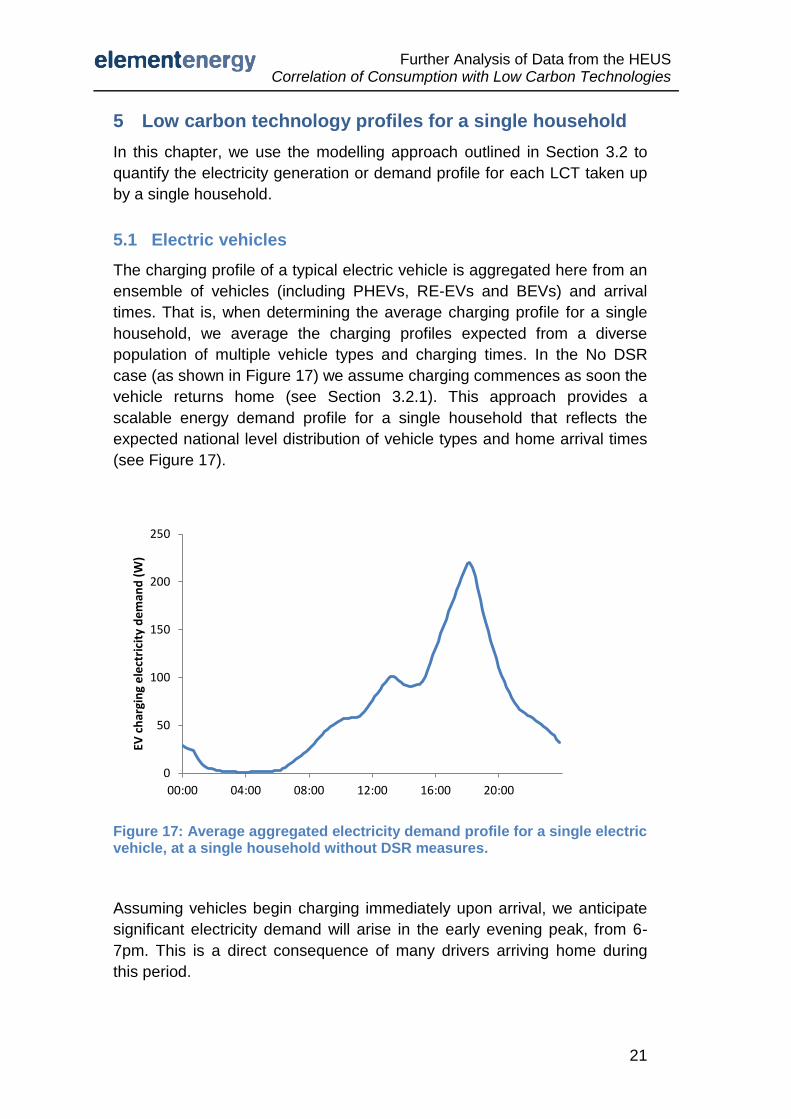
5.1 Electric vehicles
The charging profile of a typical electric vehicle is aggregated here from an
ensemble of vehicles (including PHEVs, RE-EVs and BEVs) and arrival
times. That is, when determining the average charging profile for a single
household, we average the charging profiles expected from a diverse
population of multiple vehicle types and charging times. In the No DSR
case (as shown in Figure 17) we assume charging commences as soon the
vehicle returns home (see Section 3.2.1). This approach provides a
scalable energy demand profile for a single household that reflects the
expected national level distribution of vehicle types and home arrival times
(see Figure 17).
Figure 17: Average aggregated electricity demand profile for a single electric vehicle, at a single household without DSR measures.
Assuming vehicles begin charging immediately upon arrival, we anticipate
significant electricity demand will arise in the early evening peak, from 6-
7pm. This is a direct consequence of many drivers arriving home during
this period.
0
50
100
150
200
250
00:00 04:00 08:00 12:00 16:00 20:00
EV c
har
gin
g e
lect
rici
ty d
em
and
(W
)

Further Analysis of Data from the HEUS Correlation of Consumption with Low Carbon Technologies
22
5.2 Heat pumps
In this analysis, we model the electricity demand from air-to-water and
ground source heat pumps. Given the lower water temperature (we have
assumed 50°C) for efficient operation of domestic heat pumps relative to
say, natural gas boilers (typically 60 to 80°C), the operating times required
to meet household thermal demands are typically longer than other heating
technologies during the colder months. Assuming UK consumers maintain
their current thermal demand profile39, preferentially requiring heating
during morning and evening hours, heat pumps will add significantly to
demand during the 6-7pm evening peak. Only fixed-speed heat pumps are
considered in this report, but even variable-speed heat pumps will operate
at their maximum power in times of high thermal demand, although they
may offer advantages when demand is lower. Electricity demand from an
air source heat pump is given in Figure 18 for representative40 days during
February and August.
Figure 18: Electricity demand from an air source heat pump during representative days in February and August.
39
We have not considered improvements to thermal efficiency of the UK dwelling stock, however it is recognised that such improvements could influence both total heat demand and the options to move heat demand during the day. 40
Representative days in these cases are chosen for the compatibility between the day and monthly mean air temperature.
0
500
1000
1500
2000
2500
00:00 04:00 08:00 12:00 16:00 20:00
Air
So
urc
e H
eat
Pu
mp
Ele
ctri
city
De
man
d (
W)
February August

Further Analysis of Data from the HEUS Correlation of Consumption with Low Carbon Technologies
23
Figure 19: Electricity demand from a ground source heat pump during representative days in February and August.
5.3 Solar photovoltaic systems
Electricity generation from domestic solar photovoltaic systems occurs only
during daylight hours, and hence peaks around noon. Although large
amounts of electricity can be generated, this is not well matched to the
times of peak domestic demand. The seasonal variation of the solar
resource also plays an important role, resulting in greater generation during
summer months. Depending on the season and cloud cover, a 3kWP
domestic solar PV system offers between 550-1300W of power during the
noon peak (see Figure 20).
0
500
1000
1500
2000
2500
00:00 04:00 08:00 12:00 16:00 20:00
Gro
un
d S
ou
rce
He
at P
um
p E
lect
rici
ty D
em
and
(W
)
February August

Further Analysis of Data from the HEUS Correlation of Consumption with Low Carbon Technologies
24
Figure 20: Modelled electricity generation from a typical domestic solar photovoltaic system, rated at 3kWP.
5.4 Small-scale wind turbines
Small-scale wind turbines have the potential to generate electricity
throughout the course of a day, without direct dependence on the solar
position. Again, there are significant daily and seasonal variations in the
wind resource, but, on average, it offers a relatively stable generation
profile when compared to solar PV over a typical day. We expect that a
2.5kWP system could offer approximately 400W of electricity generation on
a typical day, averaged over an annual period (see Figure 21).
0
200
400
600
800
1000
1200
1400
00:00 04:00 08:00 12:00 16:00 20:00
PV
ou
tpu
t p
ow
er
(W)
January February March April
May June July August
September October November December

Further Analysis of Data from the HEUS Correlation of Consumption with Low Carbon Technologies
25
Figure 21: Modelled electricity generation from a typical small-scale wind turbine, rated at 2.5kWP with capacity factor of 15%.
0
100
200
300
400
500
600
700
00:00 04:00 08:00 12:00 16:00 20:00
Win
d t
urb
ine
ou
tpu
t p
ow
er
(W)
January February March April
May June July August
September October November December

Further Analysis of Data from the HEUS Correlation of Consumption with Low Carbon Technologies
26
6 Interaction of low carbon technologies with household
electricity usage
In this chapter, we examine the expected change in average household
electricity profile on a monthly and annual basis when the four LCTs
described above are introduced to the average HEUS household. In reality,
not all households in the UK will be suited to all of these new technologies
(e.g. occupants of multi-storey flats may not be able to home charge their
EVs or install ground-source heat pumps, solar PV or wind systems) which
is reflected in the uptake rates used in subsequent chapters.
6.1 Demand technologies
Heat pumps and electric vehicles both substantially increase household
electricity demand, particularly during the evening peak from 6-7pm (see
Figure 22 to Figure 25).
Due to higher temperatures, thermal demand is significant reduced in the
summer months, represented by August in the figures below. In addition,
the higher temperatures in summer lead to a greater COP, allowing the
heat pump to provide more thermal energy for a given electricity input.
Figure 22: Annual average diurnal electricity demand for a single household using an aggregated average heat pump profile (reflecting the forecast UK composition of air-source and ground-source heat pumps). Any displaced primary electric heating has been removed and no DSR is assumed.
0
500
1000
1500
2000
2500
00:00 04:00 08:00 12:00 16:00 20:00
Ele
ctri
city
De
man
d (
W)
Heat Pump
HEUS Before LCT

Further Analysis of Data from the HEUS Correlation of Consumption with Low Carbon Technologies
27
Figure 23: Average diurnal electricity demand of a representative heat pump profile for February, overlaid on the average HEUS household profile (with any displaced primary electric heating removed) for an average day in February.
Figure 24: Average diurnal electricity demand of a representative heat pump profile for August, overlaid on the average HEUS household profile (with any displaced primary electric heating removed) for an average day in August.
All electric vehicles are considered to be driven the same distance on each
day, though in reality, the distance driven does vary slightly with the time of
arrival and between weekdays and weekends. Due to concentration of
0
500
1000
1500
2000
2500
3000
3500
00:00 04:00 08:00 12:00 16:00 20:00
Ele
ctri
city
De
man
d (
W)
February
HEUS Before LCT
0
500
1000
1500
2000
2500
3000
3500
00:00 04:00 08:00 12:00 16:00 20:00
Ele
ctri
city
De
man
d (
W)
August
HEUS Before LCT

Further Analysis of Data from the HEUS Correlation of Consumption with Low Carbon Technologies
28
vehicles arriving at their home locations in the evening, peak demand
during 6-7pm is expected to rise.
Figure 25: Annual average diurnal electricity demand from an electric vehicle overlaid on the average HEUS household profile. The electric vehicle profile is for a single vehicle that reflects the aggregated average charging patterns and vehicle types expected in the national EV stock41.
6.2 Generation technologies
A solar photovoltaic system offers substantial electricity generation during
daylight hours, but makes no significant contributions to reducing the
evening peak demand (without energy storage), particularly in winter
months, when daylight hours are short.
During winter months, low solar irradiance and higher daytime demand
result in on-site consumption of all solar PV generated electricity, as
illustrated for December in Figure 26. In summer months, much of the solar
electricity must be exported, due to a combination of high solar irradiance
and insufficient demand during the daytime, shown in Figure 27 for May.
For the annual average diurnal profile, there is a net export of electricity to
the grid for an average household with an average-sized solar PV
41
Element Energy modelling of the GB vehicle stock (originally developed for the Energy Technology Institute in 2011, extended for the Department of Transport in 2012, updated in 2013 and currently in use by the DfT).
0
200
400
600
800
1000
1200
00:00 04:00 08:00 12:00 16:00 20:00
Ele
ctri
city
De
man
d (
W)
EV
HEUS Before LCT

Further Analysis of Data from the HEUS Correlation of Consumption with Low Carbon Technologies
29
installation (see Figure 28). Due to the variable nature of the solar resource
and current consumption patterns, the amount of electricity exported peaks
in the summer months, as shown in Figure 29.
Figure 26: Average diurnal electricity generation of a domestic solar photovoltaic system (3kW capacity) in December, overlaid on the average HEUS household profile for December.
Figure 27: Average diurnal electricity generation of a domestic solar photovoltaic system (3kW capacity) in May, overlaid on the average HEUS household profile for May. Negative demand denotes export to the electricity network.
0
200
400
600
800
1000
1200
1400
00:00 04:00 08:00 12:00 16:00 20:00
Ele
ctri
city
De
man
d (
W)
PV Generation
HEUS After PV
December
-1000
-800
-600
-400
-200
0
200
400
600
800
00:00 04:00 08:00 12:00 16:00 20:00
Ele
ctri
city
De
man
d (
W)
PV Generation
HEUS After PV
May

Further Analysis of Data from the HEUS Correlation of Consumption with Low Carbon Technologies
30
Figure 28: Annual average diurnal electricity generation of a domestic solar photovoltaic system (3kW capacity) overlaid on the average HEUS household profile for a whole year. Negative demand denotes export to the electricity network.
Figure 29: Average diurnal exported electricity by month, for an average household with the HEUS household profile, and a solar PV installation only.
A small-scale wind turbine offers a more uniform generation profile than
solar PV when averaged, and satisfies most of a typical household’s
-800
-600
-400
-200
0
200
400
600
800
1000
00:00 04:00 08:00 12:00 16:00 20:00
Ele
ctri
city
De
man
d (
W)
PV Generation
HEUS After PV
Annual
0
1
2
3
4
5
6
7
Ele
ctri
city
exp
ort
ed
to
gri
d b
y so
lar
PV
ge
ne
rati
on
(kW
h/d
ay)

Further Analysis of Data from the HEUS Correlation of Consumption with Low Carbon Technologies
31
electricity demand, as shown in Figure 32. It is important to bear in mind
that this is an averaged profile and, as such, does not reflect the variability
of supply within a given day which is still a concern for households
generating electricity using wind. Since electricity from wind generation is
less dependent on the availability of sunlight than solar PV, it is better able
to reduce grid demand during peak evening hours.
The availability of wind resource is strongly dependent on season, and is
approximately the reverse of solar irradiance – winter months are
characterised by high resource, whilst calm conditions in the summer
months result in less electricity generation from turbines during that period.
The months with the highest and lowest export are March and June,
respectively, and are a consequence of both household electricity demand
and wind resource in those periods (see Figure 30 to Figure 33).
Figure 30: Average diurnal electricity generation of a typical small-scale wind turbine (2.5 kWP) in March, overlaid on the average HEUS household profile for March. Negative demand denotes export to the electricity network.
-600
-400
-200
0
200
400
600
800
1000
00:00 04:00 08:00 12:00 16:00 20:00
Ele
ctri
city
De
man
d (
W)
Wind Generation
HEUS After Wind
March

Further Analysis of Data from the HEUS Correlation of Consumption with Low Carbon Technologies
32
Figure 31: Average diurnal electricity generation of a typical small-scale wind turbine (2.5 kWP) in June, overlaid on the average HEUS household profile for June. Negative demand denotes export to the electricity network.
Figure 32: Annual average diurnal electricity generation of a small-scale wind turbine (2.5 kWP) overlaid on the annual average HEUS household profile. Negative demand denotes export to the electricity network.
-600
-400
-200
0
200
400
600
800
1000
00:00 04:00 08:00 12:00 16:00 20:00
Ele
ctri
city
De
man
d (
W)
Wind Generation
HEUS After Wind
June
-200
-100
0
100
200
300
400
500
600
700
800
00:00 04:00 08:00 12:00 16:00 20:00
Ele
ctri
city
De
man
d (
W)
Wind Generation
HEUS After Wind
Annual Average

Further Analysis of Data from the HEUS Correlation of Consumption with Low Carbon Technologies
33
Figure 33: Average diurnal exported electricity by month, for an average HEUS household with a small wind turbine installation (2.5kWP) only. Export is a function of both wind resource and household demand.
6.3 Aggregate impact of a single household taking up all LCTs
The case in which a household takes up all four LCTs is considered in
Figure 34. Obviously, this scenario will not be possible in all UK households
and would not be expected to be a common occurrence pre-2030, but it
does given an interesting insight into future implications for domestic
demand and generation at the household level under high LCT uptake
scenarios. Over a full year, such a household would demand 14% less
electricity from the grid than the same household without these
technologies in place. The annual average peak demand in the 6-7pm
period would rise to ~1.8 kW, more than double the peak demand for the
current average HEUS household, driven by demand from heat pumps and
electric vehicles which cannot be completely met by the generation
technologies.
0
0.2
0.4
0.6
0.8
1
1.2
1.4El
ect
rici
ty e
xpo
rte
d t
o g
rid
by
win
d
gen
era
tio
n (
kWh
/day
)

Further Analysis of Data from the HEUS Correlation of Consumption with Low Carbon Technologies
34
Figure 34: Annual average diurnal electricity demand for the HEUS households before and after uptake of all four low carbon technologies (i.e. a heat pump, electric vehicle, solar PV and wind turbine). Negative demand denotes export to the electricity grid.
Figure 35: Average daily electricity demand from the grid in each month for a single household with and without all low carbon technologies (i.e. a heat pump, electric vehicle, solar PV and wind turbine).
Over the whole year, the hypothetical household would need to export
~15% of its generated electricity to the grid, with a peak export power of ~1
kW. Depending on the season, the peak export power can range between
-1000
-500
0
500
1000
1500
2000
00:00 04:00 08:00 12:00 16:00 20:00Ele
ctri
cal D
em
and
(W
)
HEUS Before LCT HEUS After LCT - Annual average
0
5
10
15
20
25
30
Dai
ly e
lect
rici
ty d
em
and
fro
m t
he
gri
d
(kW
h/d
ay)
HEUS & all LCTs HEUS

Further Analysis of Data from the HEUS Correlation of Consumption with Low Carbon Technologies
35
0.2-1.2kW. On representative days, peak export coincides with the period
of greatest solar PV generation (i.e. from 12pm to 1pm).
Taking up all the given low carbon technologies results in a highly variable
demand for grid electricity; from 4kWh/day in July, to 25kWh/day in
February when demand for heating is at its greatest. Were this to become a
common occurrence in households across the UK, a great deal of
redundancy in the electricity transmission and distribution networks will be
required to deal with seasonal changes in demand.
Figure 36: Peak demand from the grid and peak export to the grid from a single household with all LCTs in each month. Peak export to the grid typically occurs at 12-1pm in all months, coinciding with highest solar PV generation. Peak demand from the grid remains in the 6-7pm period.
Given the uptake rates identified in DECC and Ofgem’s Smart Grid
Forum42, only a small fraction of households are likely to have taken up all
four of these LCTs by 2030. However, the results shown here reveal the
challenges that LCT uptake could present in the long-term for the UK
electricity network, particularly in terms of seasonal variability in demand
from the grid. As an illustration of this point, a household taking up all four
LCTs would demand 6 times more electricity on an average day in
February compared to an average day in July (see Figure 35).
42
DECC/Ofgem Smart Grid Forum (2012), “Assessing the Impact of Low Carbon Technologies on Great Britain’s Power Distribution Networks”.
0
0.5
1
1.5
2
2.5
3
3.5
Pe
ak d
em
and
(6
-7p
m)
and
pe
ak e
xpo
rt (
all-
day
), p
er
ho
use
ho
ld (
kW)
Peak Demand (6-7pm) Peak Export

Further Analysis of Data from the HEUS Correlation of Consumption with Low Carbon Technologies
36
7 Load shifting potential of low carbon technologies
Given the expected increase in peak load due to LCT uptake, it is important
to consider demand side response (DSR) measures that can be
implemented to promote behaviours that reduce peak demand43. With this
in mind, this chapter explores measures aimed at delivering reductions in
electricity use at peak times for electric vehicle charging and heat pump
operation. To illustrate the maximum DSR potential, we assume all
households equipped with these LCTs engage in the DSR measures being
modelled.
7.1 Load shifting potential of heat pumps
Assuming heat pumps undertaking DSR measures have access to 180
litres of hot water thermal storage (with negligible heat loss), up to 2.6kWh
of thermal demand can be satisfied from a fully charged store which is
approximately equivalent to half of the thermal demand between 6-7pm in
the coldest months. This correlates well with the findings of GL Noble
Denton’s work for the Smart Grid Forum44.Though beyond the scope of this
report, the requirement for a dedicated hot water storage system for heat
pump DSR presents implementation challenges in terms of installation
footprint, highlighted by the current uptake of combination (or “combi”)
boilers in the UK and the accompanying move away from hot water storage
cylinders.45,46
In our modelling, we simulate heat pumps charging thermal storage to
capacity in low-tariff periods, and discharging the thermal storage during
peak periods. Only when thermal demand cannot be satisfied by the
thermal storage do the heat pumps operate during peak periods.
When modelling time-of-use tariffs (TOUT) such as Economy 10 (in which
the evening high-tariff period begins at 4pm47), we find that typical hot
water cylinders can satisfy much of the demand during 4-5pm, but have
insufficient thermal energy to shift a significant amount of electricity
demand from the 6-7pm peak to later times, as indicated by Figure 37.
43
Department of Energy and Climate Change (2012), “Demand Side Response in the domestic sector- a literature review of major trials”. 44
DECC/Ofgem Smart Grid Forum (2012), “Assessing the Impact of Low Carbon Technologies on Great Britain’s Power Distribution Networks”. 45
International Energy Agency Demand Side Management Programme (2012), “Heat pumps for cooling and heating”. 46
P. Strachan et al. (2013), “Modelling of High Energy Performance Buildings”, International Workshop: High Performance Buildings, Brussels. 47
Electric Heating Company, “Economy 10 times”, accessible from: http://www.electric-heatingcompany.co.uk/wp-content/uploads/2012/03/ss-Economy-10-Times.pdf

Further Analysis of Data from the HEUS Correlation of Consumption with Low Carbon Technologies
37
Alternatively, targeted DSR measures that specifically aim to reduce
demand during 6-7pm can substantially lower consumption in that timeslot
(as shown in Figure 38) though this does little to address the high demand
immediate before and after this period. In this approach, the filling of
thermal storage tanks has been delayed to the early morning hours, 12am-
5am.
Figure 37: UK annual average diurnal electricity demand from heat pumps optimised for the Economy 10 tariff, in the 2030 DECC High Uptake Scenario.
In the Economy 10 case, it is important to note that new peaks are formed
at the start of off-peak periods (in this case at 1pm and 8pm) if the low-tariff
periods are assumed to be the same across the UK (see Figure 37). These
peaks are related to the loss in consumption diversity as devices whose
demand has been postponed during the high-tariff periods all activated at
the same time. This problem is only evident where TOUTs are widely
adopted and delayed loads are significant. Since these are two of the goals
of future DSR strategies, consumption diversity is an important
consideration.
0
5
10
15
20
25
30
35
40
00:00 04:00 08:00 12:00 16:00 20:00
UK
an
nu
al a
vera
ge e
lect
rici
ty d
em
and
(G
W)
Heat Pumps HEUS Before LCTs

Further Analysis of Data from the HEUS Correlation of Consumption with Low Carbon Technologies
38
Figure 38: UK annual average diurnal electricity demand from heat pumps with targeted DSR during the 6-7pm period for the 2030 DECC High Uptake Scenario.
Some examples of how consumption diversity could be maintained within
DSR strategies include:
Set up TOUT offerings with staggered start times for low-tariff
periods. This consideration needs to be factored in even at the local
level since local distribution networks will suffer from these same
peaks if times are only staggered between different geographical
regions of the UK.
Direct control strategies can be triggered at appropriate times and
with sufficient spatial distribution to avoid national and local peaks.
Similarly well monitored and targeted dynamic time-of-use tariffs can
be established so as to ensure appropriate diversity levels are
maintained.
Using a variety of DSR strategies, such as those listed in the examples
above, will also help to maintain diversity in electricity consumption
patterns. In this way, diversified DSR measures can distribute the domestic
demand reduction potential over the evening hours. An example where the
demand reduction potential is distributed over the 4pm-9pm period is
shown in Figure 39. Again, the recharging of thermal storage tanks has
been shifted to the early morning hours, 12am-5am.
0
5
10
15
20
25
30
35
40
00:00 04:00 08:00 12:00 16:00 20:00
UK
an
nu
al a
vera
ge e
lect
rici
ty d
em
and
(G
W)
Heat Pumps HEUS Before LCTs

Further Analysis of Data from the HEUS Correlation of Consumption with Low Carbon Technologies
39
Figure 39: UK annual average diurnal electricity demand from heat pumps, with diversified DSR measures distributing demand reduction potential over the 4pm-9pm period in 2030 for the DECC High Uptake Scenario.
7.2 Load shifting potential of electric vehicle charging
In addition to heat pumps, we find the charging behaviour of electric
vehicles has the potential to influence load shifting in the 6-7pm period. To
evaluate the potential impact of DSR measures for EV charging we have
considered four EV charging scenarios for 2030, under the DECC High
Uptake Scenario.
A. No DSR, standard EV charging (3kW): All electric vehicles begin
charging when they arrive home.
B. Basic DSR: Consumers arriving home before 12am delay charging
until start of the night Economy 10 period (12am-5am)48 and then
charge normally at 3kW.
C. Diverse DSR (distributed start times): As in scenario B, but the
beginning of late-evening low-tariff times are now distributed evenly
over 3 hours (between 12am and 3am) in 10-minute increments.
D. Slow-Charge DSR: As in scenario B, but the EV charge rate is
substantially reduced to 1kW.
48
Electric Heating Company, “Economy 10 times”, accessible from: http://www.electric-heatingcompany.co.uk/wp-content/uploads/2012/03/ss-Economy-10-Times.pdf
0
5
10
15
20
25
30
35
40
00:00 04:00 08:00 12:00 16:00 20:00
UK
an
nu
al a
vera
ge e
lect
rici
ty d
em
and
(G
W)
Heat Pumps HEUS Before LCTs

Further Analysis of Data from the HEUS Correlation of Consumption with Low Carbon Technologies
40
The UK’s electricity demand from domestic EVs for each of these charging
scenarios is shown in Figure 40.
Scenario B illustrates the extreme case in which electric vehicle DSR
measures are widely adopted and charging is shifted to a common late-
evening start time, coinciding with the beginning of Economy 10 low-tariff
rates. While there may currently be some geographical variability in
Economy 10 and Economy 7 time bandings between different distribution
networks, there is still potential for formation of problematic local demand
peaks coinciding with the beginning of low-tariff periods.
To address this problem, we consider two potential solutions for vehicle
charging involving load distribution measures that minimise the magnitude
of new peaks (Scenario C with distributed late-evening low-tariff start times
and Scenario D with vehicle charging rates restricted to 1kW). In Figure 40,
both approaches show a substantial reduction in late evening peak
electricity demand when compared to scenario B, where no additional
measures are taken.
Figure 40: UK domestic electricity demand from domestic electric vehicles in 2030 under the DECC High Uptake Scenario, with No DSR (A), Basic DSR (B) and Smart DSR (C, D) scenarios. Compared to the Basic DSR approach, the magnitude of the late-evening peak is considerably reduced in both Smart DSR cases.
0
5
10
15
20
25
00:00 04:00 08:00 12:00 16:00 20:00
UK
EV
Ch
argi
ng
Ele
ctri
city
De
man
d (
GW
)
Scenario A: BAU, 3kW
Scenario B: DSR, 3kW
Scenario C: DSR, 3kW, Staggered Economy 10 Start Times
Scenario D: DSR, 1 kW

Further Analysis of Data from the HEUS Correlation of Consumption with Low Carbon Technologies
41
Figure 41: The electric vehicle contribution to UK annual average diurnal electricity demand under Scenario B (basic DSR).
Figure 42: The electric vehicle contribution to UK annual average diurnal electricity demand under Scenario C (diverse DSR).
0
5
10
15
20
25
30
35
40
00:00 04:00 08:00 12:00 16:00 20:00
UK
Do
me
stic
Ele
ctri
city
De
man
d (
GW
)
EV HEUS Before LCTS
0
5
10
15
20
25
30
35
40
00:00 04:00 08:00 12:00 16:00 20:00
UK
Do
me
stic
Ele
ctri
city
De
man
d (
GW
)
EV HEUS Before LCTS

Further Analysis of Data from the HEUS Correlation of Consumption with Low Carbon Technologies
42
Figure 43: The electric vehicle contribution to UK annual average diurnal electricity demand under Scenario D (slow charging DSR).
0
5
10
15
20
25
30
35
40
00:00 04:00 08:00 12:00 16:00 20:00
UK
Do
me
stic
Ele
ctri
city
De
man
d (
GW
)
EV HEUS Before LCTs

Further Analysis of Data from the HEUS Correlation of Consumption with Low Carbon Technologies
43
8 National Implications of low carbon technologies
In this chapter, we explore the impact of LCT uptake on UK domestic
demand and distributed generation using the technology uptake rates and
growth in number of households identified in Section 3.3. Here we use the
HEUS average household profile (which is based on 250 English
households between 2010 and 2011) as a close approximation for the
average UK household demand (see Chapter Error! Reference source
not found.). For simplicity, we do not consider underlying changes in the
household demand profile due to improvements in energy efficiency and
changing lifestyle trends between 2010 and 2030, which are covered
elsewhere49,50.
8.1 Annual electricity consumption trends
Figure 44 shows the contribution of each LCT to domestic electricity
demand and generation in the UK out to 2030 for the three DECC LCT
uptake scenarios. Nationally, domestic electricity demand on the grid in
2020 is expected to increase modestly relative to 2010, driven primarily by
population growth (on a per household basis renewable generation uptake
largely offsets new demand from EVs and heat pumps). A substantial
increase in domestic electricity demand from the grid is forecast for 2030,
largely due to the uptake of heat pumps. These results are broadly in line
with the trends identified by the Smart Grid Forum51.
49
Element Energy (2013), “Further Analysis of Data from the Household Electricity Usage Study: Increasing Insight and UK Applicability”. 50
Cambridge Architectural Research, Element Energy, Loughborough University (2013), “Electrical Appliances at Home: Tuning in to Energy Saving”. 51
DECC/Ofgem Smart Grid Forum (2012), “Assessing the Impact of Low Carbon Technologies on Great Britain’s Power Distribution Networks”.

Further Analysis of Data from the HEUS Correlation of Consumption with Low Carbon Technologies
44
Figure 44: Forecast UK annual domestic electricity demand. Substantial increases in demand are forecast for 2030 under all low carbon technology uptake scenarios. Increases in the baseline HEUS demand are a result of population growth. Improvements in energy efficiency are not considered.
8.2 Forecast Diurnal Demand and Generation Profiles by
Uptake Scenario
Figure 45 and Figure 46 below show the estimated domestic demand and
generation profiles in the UK for 2020 and 2030 under the DECC Low,
Central and High Uptake Scenarios (described in Chapter 3.3), without any
DSR.
In the Low Uptake Scenario, LCTs are expected to have negligible impact
on the demand profile of an average household, even by 2030. In the
Central Uptake Scenario, demand on the grid around midday, when solar
PV generation is highest, is reduced by 2020. However, this reduction is
countered by increasing demand from electric vehicles and heat pumps by
2030. In the High Uptake Scenario, demand from the grid during the middle
of the day is substantially reduced in 2020 and 2030, due to the high
adoption of solar PV (and to a lesser extent, wind), however, the morning
and evening peaks are considerably larger by 2030, primarily due to the
uptake of heat pumps.

Further Analysis of Data from the HEUS Correlation of Consumption with Low Carbon Technologies
45
Figure 45: UK annual average electricity demand and generation profiles for the DECC Low, Central and High Uptake Scenarios in 2020, with no DSR.
00:00 04:00 08:00 12:00 16:00 20:00
-10
-5
0
5
10
15
20
25
30
35
-10
-5
0
5
10
15
20
25
30
35
00:00 04:00 08:00 12:00 16:00 20:00
UK
Do
me
stic
Ele
ctri
city
De
man
d
(GW
)
PV
Wind
Heat Pump
EV
HEUS Before LCTs
HEUS After LCTs
2020 Low Uptake
00:00 04:00 08:00 12:00 16:00 20:00
-10
-5
0
5
10
15
20
25
30
35
-10
-5
0
5
10
15
20
25
30
35
00:00 04:00 08:00 12:00 16:00 20:00
UK
Do
me
stic
Ele
ctri
city
De
man
d
(GW
)
PV
Wind
Heat Pump
EV
HEUS Before LCTs
HEUS After LCTs
2020 Central Uptake
00:00 04:00 08:00 12:00 16:00 20:00
-10
-5
0
5
10
15
20
25
30
35
-10
-5
0
5
10
15
20
25
30
35
00:00 04:00 08:00 12:00 16:00 20:00
UK
Do
me
stic
Ele
ctri
city
De
man
d
(GW
)
PV
Wind
Heat Pump
EV
HEUS Before LCTs
HEUS After LCTs
2020 High Uptake

Further Analysis of Data from the HEUS Correlation of Consumption with Low Carbon Technologies
46
Figure 46: UK annual average electricity demand and generation profiles for the DECC Low, Central and High Uptake Scenarios in 2030, with no DSR.
With LCT uptake, total daily domestic electricity demand exhibits a greater
dependence on season, primarily due to the increased uptake of heat
pumps and the relatively low generation of PV during the winter months.
00:00 04:00 08:00 12:00 16:00 20:00
-10
-5
0
5
10
15
20
25
30
35
-10
-5
0
5
10
15
20
25
30
35
00:00 04:00 08:00 12:00 16:00 20:00
UK
Do
me
stic
Ele
ctri
city
De
man
d
(GW
)
PV
Wind
Heat Pump
EV
HEUS Before LCTs
HEUS After LCTs
2030 Low Uptake
00:00 04:00 08:00 12:00 16:00 20:00
-10
-5
0
5
10
15
20
25
30
35
-10
-5
0
5
10
15
20
25
30
35
00:00 04:00 08:00 12:00 16:00 20:00
UK
Do
me
stic
Ele
ctri
city
De
man
d
(GW
)
PV
Wind
Heat Pump
EV
HEUS Before LCTs
HEUS After LCTs
2030 Central Uptake
00:00 04:00 08:00 12:00 16:00 20:00
-10
-5
0
5
10
15
20
25
30
35
-10
-5
0
5
10
15
20
25
30
35
00:00 04:00 08:00 12:00 16:00 20:00
UK
Do
me
stic
Ele
ctri
city
De
man
d
(GW
)
PV
Wind
Heat Pump
EV
HEUS Before LCTs
HEUS After LCTs
2030 High Uptake

Further Analysis of Data from the HEUS Correlation of Consumption with Low Carbon Technologies
47
Plans for future electricity networks need to ensure this new pattern can be
met, increasing the redundancy required in the UK electricity network in
terms of both generation and network capacity. This phenomenon will be
particularly acute for regions with high concentration clusters of LCT
uptake.
Figure 47: Forecast average daily electricity demand from domestic consumers, under the DECC High Uptake Scenario compared to the 2010 HEUS monthly averages. By 2030, demand on an average day in December increases to more than double that of demand on average days in the summer months.
8.3 Impact of Demand Side Response on Load Shifting
DSR measures can potentially reduce demand during the current 6-7pm
evening peak period. In order to consider the load shifting potential
attributable to LCTs, two possible cases have been modelled:
1. Basic DSR – Economy 10: A total of 10 hours of off-peak electricity
is provided per day, from 12am-5am, 1pm-4pm, 8pm-10pm. EV
charging occurs during 12am-5am only. Heat pumps operate
preferentially in off-peak periods. EV charging rates are at 3kW.
2. Diversified DSR: A scenario in which DSR response is better
distributed for heat pumps and electric vehicles using the scenarios
described above (i.e. heat pump demand reduction potential is
0
100
200
300
400
500
600
700
Dai
ly D
om
est
ic E
lect
rici
ty D
em
and
(G
Wh
/day
)
2010 (HEUS) 2020 2030

Further Analysis of Data from the HEUS Correlation of Consumption with Low Carbon Technologies
48
spread over the 4pm-9pm period) and EV charging commences for
different households at staggered times between 12am and 3am).
To illustrate the maximum domestic DSR impact from LCTs, we assume all
households adopt the DSR measures being examined in each case. The
annual average diurnal load profile for each of these DSR cases can be
found in Figure 48 and Figure 49 for the DECC High Uptake Scenario.
In the Basic DSR case, substantial new peaks at the start of off-peak
periods are forecast, with only a small demand reduction in the 6-7pm
period, as static time-of-use tariffs with the same off-peak periods are
adopted nationally for heat pumps and electric vehicle charging. These new
peaks exemplify the loss of consumption diversity created when all LCT
devices in all households activate at the same time at the start of the low-
tariff period.
In the Diversified DSR case, load distribution measures are introduced in
such a way as to maintain diversity in consumer behaviour, as discussed in
Section 7.1 and 7.2, avoiding the formation of the new peaks observed in
the basic DSR case. Though maintaining consumption diversity requires a
more nuanced and complex approaches to DSR, the overall benefits for
peak reduction are clear in Figure 49 which demonstrates an average
demand reduction of 2.5GW during the 6-7pm peak period relative to the
no DSR case shown in Figure 46.
The monthly breakdowns for average load during 6-7pm are given in Figure
50 for the DECC Low, Central and High Uptake Scenarios. These figures
demonstrate the seasonal dependence of DSR impact. For example, in the
DECC High Uptake Scenario, the potential savings from LCT DSR in 2030
vary between 4.1GW in January relative to 0.5GW in June.

Further Analysis of Data from the HEUS Correlation of Consumption with Low Carbon Technologies
49
Figure 48: UK annual average electricity demand and generation profile for 2030 in the DECC High Uptake Scenario with basic DSR following Economy 10 tariff bandings.
Figure 49: UK annual average electricity demand and generation profile for 2030 in the DECC High Uptake Scenario with diversified DSR.
00:00 04:00 08:00 12:00 16:00 20:00
-10
-5
0
5
10
15
20
25
30
35
40
-10
-5
0
5
10
15
20
25
30
35
40
00:00 04:00 08:00 12:00 16:00 20:00
UK
Do
me
stic
Ele
ctri
city
De
man
d (
GW
)
PV
Wind
Heat Pump
EV
HEUS Before LCTs
HEUS After LCTs
00:00 04:00 08:00 12:00 16:00 20:00
-10
-5
0
5
10
15
20
25
30
35
40
-10
-5
0
5
10
15
20
25
30
35
40
00:00 04:00 08:00 12:00 16:00 20:00
UK
Do
me
stic
Ele
ctri
city
De
man
d (
GW
)
PV
Wind
Heat Pump
EV
HEUS Before LCTs
HEUS After LCTs(Diversified DSR)

Further Analysis of Data from the HEUS Correlation of Consumption with Low Carbon Technologies
50
Figure 50: Average electricity demand during the 6-7pm peak period with No DSR and Diversified DSR for the DECC Low, Central and High Uptake Scenario relative to those observed for the HEUS.
0
5
10
15
20
25
30
35
40
45
50
UK
ave
rage
ele
ctri
city
de
man
d d
uri
ng
6-7
pm
pe
rio
d (
GW
)
2010 (HEUS) 2030 - No DSR 2030 - Diversified DSR
Low Uptake
0
5
10
15
20
25
30
35
40
45
50
UK
ave
rage
ele
ctri
city
de
man
d
du
rin
g 6
-7p
m p
eri
od
(G
W)
2010 (HEUS) 2030 - No DSR 2030 - Diversified DSR
Central Uptake
0
5
10
15
20
25
30
35
40
45
50
UK
ave
rage
ele
ctri
city
de
man
d d
uri
ng
6-7
pm
pe
rio
d (
GW
)
2010 (HEUS) 2030 - No DSR 2030 - Diversified DSR
High Uptake

Further Analysis of Data from the HEUS Correlation of Consumption with Low Carbon Technologies
51
9 Conclusions and recommendations
UK domestic electricity demand from the grid is likely to rise
substantially, to as much as 48% over current levels, by 2030 driven
by a combination of population growth and demand from heat pumps
and electric vehicles, which are offset to some extent by embedded
small-scale wind and solar generation. Annual electricity demand from
domestic consumers rises in all scenarios, reaching as much as
162TWh/year by 2030 in the High Uptake Scenario (see Figure 1)52.
The seasonal dependence of electricity consumption is set to
markedly increase in the Central and High Uptake Scenarios. Average
daily domestic electricity demand in December is expected to be
685GWh/day, more than double the demand forecast for the summer
months. This ratio is expected to rise from 1.76 in 2010 to 2.15 in
2030 in the High Uptake Scenario.
Recommendation: Planning for generation and network capacity
needs to take into account the increasing seasonal dependency of
domestic electricity demand and the resulting system redundancies
this requires in the electricity networks. This highlights the
importance of comprehensive industry planning and analysis work in
this area, such as that initiated by DECC and Ofgem’s Smart Grid
Forum. Since these impacts will vary considerably for different
regional demographic compositions, behavioural trends, building
types, LCT uptake characteristics and levels of technology
clustering, future work will need to focus on how the investment
required for network reinforcement over the coming decades
(estimated by the Smart Grid Forum to be between £20-£60 billion
cumulatively to 205053) will vary for different network regions and
assets in the UK.
The implications for peak-time demand from LCT uptake are also
significant with an approximately 40% and 60% increase in demand
during the morning and evening peaks, respectively, by 2030 for the
DECC High Uptake Scenario relative to the average domestic profile
52
This includes the impact of population growth on base demand, but for simplicity we have not included any effects due to increases in energy efficiency as these have been examined elsewhere: Element Energy (2013), “Further Analysis of Data from the Household Electricity Usage Study: Increasing Insight and UK Applicability”, where a UK-wide technical potential saving of 15TWh/year from energy efficiency was identified. 53
DECC/Ofgem Smart Grid Forum (2012), “Assessing the Impact of Low Carbon Technologies on Great Britain’s Power Distribution Networks”.

Further Analysis of Data from the HEUS Correlation of Consumption with Low Carbon Technologies
52
from the HEUS. The majority of this additional demand originates from
the operation of heat pumps.
Recommendation: The increased “peakiness” of domestic diurnal
demand highlights the importance of DSR strategies as LCT uptake
increases. Further work is required to understand how the variations
in peak shifting potentials for different consumer archetypes54,55 map
to the likelihood of LCT uptake, which will have important
implications for the total amount of peak-time demand that can be
shifted. Further work is also required to understand how daily peaks
in domestic demand from the grid, and the ability to level them, will
vary for different regions and network assets in the UK. More region
and asset specific information on how peaks in domestic demand
will interact with commercial and industrial loads is also needed.
We have modelled several DSR scenarios for heat pumps and electric
vehicles to determine the extent to which the morning and evening
peak increases could be mitigated. We find that simple time-of-use
tariffs (such as the current Economy 10 tariff), if widely deployed with
uniform time bandings, could potentially create network load problems
related to loss of diversity in UK electricity consumption. Heat pumps
and electric vehicle charging that are automated to avoid high-tariff
periods will create significant peaks at the beginning of static low-tariff
time-periods as these devices all activate at the same time.
Recommendation: When designing peak-shifting strategies, care
must be taken to ensure behavioural diversity is maintained. For
example, in the case of time-of-use tariffs, staggered start-times for
different consumers, both locally and nationally, could be used to
ensure that new peaks, corresponding to the beginning of low-tariff
periods, are not created if these schemes are widely adopted. The
formation of new peaks could also be mitigated by the use of a suite
of DSR technologies and incentives (also including direct remote
control of LCT devices, well-monitored dynamic time-of-use tariffs,
etc.).
We modelled the effect of diversified DSR approaches to determine
the optimised technical potential for DSR. In this case, an average
reduction of 2.5GW can be achieved in the evening peak period. The
heat pump component of this shift (approximately 50-80%, depending
54
Element Energy (2013), “Further Analysis of Data from the Household Electricity Usage Study: Consumer Archetypes”. 55
Element Energy (2013), “Further Analysis of Data from the Household Electricity Usage Study: Increasing Insight and UK Applicability”.

Further Analysis of Data from the HEUS Correlation of Consumption with Low Carbon Technologies
53
on season) is based on access to a 180L thermal storage tank – a
consideration which must be balanced with its physical footprint in a
typical household.
Recommendation: Further research is required to assess the
physical capacity, consumer attitudes, and likelihood of uptake for
hot water tanks in UK domestic heat pump installations since this is
a critical element for significant domestic DSR as LCTs are more
widely adopted in the UK.

Further Analysis of Data from the HEUS Correlation of Consumption with Low Carbon Technologies
54
10 Appendix
10.1 Household Electricity Usage Study – Demand profiles by
month
Electricity demand is seasonally dependent – the highest demand on an
average day occurs in December, whilst the lowest demand is noted in
May. In all months, peak demand occurs between 6-7pm.
Figure 51: Average electricity demand by month from the Household Electricity Usage Study.
10.2 Heat pump operation logic
The simulated heat pump will attempt to satisfy all household thermal
demand. We have modelled a single-speed heat pump that can either be
on or off for the entirety of the 10-minute period being considered.
Thermal demand can be satisfied by either operating the heat pump, or
discharging thermal storage (in the heating loop and dedicated hot water
cylinder). If the demand occurs during a peak period, the heat pump will
attempt to avoid operating by discharging storage if there is sufficient
stored thermal energy, emulating the 4-pipe system presented in a previous
0
200
400
600
800
1000
1200
1400
0
200
400
600
800
1000
1200
1400
00:00 04:00 08:00 12:00 16:00 20:00
Ele
ctri
city
De
man
d (
W)
January February MarchApril May JuneJuly August SeptemberOctober November DecemberYearly Average

Further Analysis of Data from the HEUS Correlation of Consumption with Low Carbon Technologies
55
heat pump study56. A control system is assumed to be implemented such
that during off-peak periods, the heat pump operates to replenish the
thermal storage. We assume a flow temperature of 50°C and a return
temperature of 45°C in the household heating circuit, with 20 litres of
storage within the heating loop per kW of rated thermal output power
required57. For DSR scenarios, we assume a thermal storage with 180
litres of water, maintained at 50°C with a return temperature of 45°C. The
required rated thermal output power (related to the number of radiators and
their rated output) is calculated using data from the Heat Emitter Guide58.
Figure 52: Schematic of the heat pump model and its inputs and outputs.
Figure 53: Heat pump operation time as a function of constant ambient temperature. EA Technology results are measured, Element HEUS results are modelled.
56
EA Technology (2011), “The Effects of Cycling on Heat Pump Performance”. 57
EA Technology (2011), “The effect of thermostatic radiator valves on heat pump performance”. 58
The Microgeneration Certificate Scheme – “MCS 021/MIS 3005 - Heat Emitted Guide for Domestic Heat Pumps”, 2013.
0200400600800
1000120014001600
-6 -4 -2 0 2 4 6 8 10 12 14Dai
ly S
yste
m O
pe
rati
on
al
Tim
e (
min
ute
s)
Outdoor Temperature (oC)
EA Tech Element HEUS

Further Analysis of Data from the HEUS Correlation of Consumption with Low Carbon Technologies
56
10.3 Electric vehicle assumptions59
The modelling of electric vehicles shown in this report assumes battery
capacities of 8kWh for PHEVs, 16kWh for RE-EVs, and 22kWh for BEVs.
The annual mileage assumptions (Figure 54) and EV vehicle type
distributions (Figure 55 to Figure 57) under each scenario are shown
below. Vehicle efficiencies are assumed to be consistent with EU tailpipe
emission regulations (which decrease to 70gkm by 2030).
Figure 54: Annual electric vehicle mileage (km) as a function of year.
Figure 55: EV type distribution, DECC Low Uptake Scenario.
59
Baringa Partners & Element Energy (2012), “Electricity Systems Analysis: Future systems benefits from selected DSR scenarios” for DECC.
0
2000
4000
6000
8000
10000
12000
14000
16000
2010 2015 2020 2025 2030
An
nu
al M
ileag
e (
km)
0%
10%
20%
30%
40%
50%
60%
70%
80%
90%
100%
RE-EV
BEV
PHEV

Further Analysis of Data from the HEUS Correlation of Consumption with Low Carbon Technologies
57
Figure 56: EV type distribution, DECC Central Uptake Scenario.
Figure 57: EV type distribution, DECC High Uptake Scenario.
0%
10%
20%
30%
40%
50%
60%
70%
80%
90%
100%
RE-EV
BEV
PHEV
0%
10%
20%
30%
40%
50%
60%
70%
80%
90%
100%
RE-EV
BEV
PHEV

Further Analysis of Data from the HEUS Correlation of Consumption with Low Carbon Technologies
58
10.4 Air and ground average temperature profiles
Modelled air temperature from a Defra Air Pollution station60, based in
Market Harborough, England, has been used to create the temperature
profile for average days in each month (see Figure 58).
Figure 58: Mean air temperature for each 10-minute time step, for Market Harborough, England.
Ground temperatures for the Midlands were taken from MCS guidance for
ground source heat pump design61 and combined with seasonal ground
temperature profile data from the Energy Saving Trust62 (see Figure 59).
Figure 59: Ground temperature by month, for the Midlands, England.
60
Department for Environment Food and Rural Affairs (2013), “Data Archive”, accessible from: http://uk-air.defra.gov.uk/data/data_selector 61
MSC (2011), “MCS 022: Ground heat exchanger look-up tables”. 62
Energy Saving Trust (2004), “Energy Efficiency Best Practice in Housing - Domestic Ground Source Heat Pumps: Design and installation of closed-loop systems”.
0
5
10
15
20
25
00:00 04:00 08:00 12:00 16:00 20:00
Me
an T
em
pe
ratu
re (
0 C)
January February March AprilMay June July AugustSeptember October November December
0
2
4
6
8
10
12
14
16
Me
an T
em
pe
ratu
re (
0 C)