further education workforce data for england · further education workforce data for england...
TRANSCRIPT

FURTHER EDUCATION WORKFORCE DATA FOR ENGLAND
Analysis of the 2015-2016 Staff Individualised Record (SIR) data FRONTIER ECONOMICS – JUNE 2017

1/43 Document title
00/00/0000
Education & Training Foundation
CONTENTS
EXECUTIVE SUMMARY 2
1. INTRODUCTION 5
2. OUR DATA ANALYSIS APPROACH 7
Original dataset 7
Data processing 7
Providers responding and reclassification for comparison 9
3. PROVIDERS PROFILES 10
Colleges 10
Independent training providers (ITPs) 12
Other providers 12
4. PROFILE OF THE FE WORKFORCE 13
Occupation 13
Staff turnover 14
Part time workers 15
Gender 16
Age 18
Ethnicity 19
Sexual Orientation 20
Disability 21
Annual Gross Pay 22
5. SENIOR STAFF 25
Annual Gross Pay 25
Age 26
Share of full time senior management by gender 27
Share of fulltime senior management by gender 28
6. PROFILE OF THE TEACHING WORKFORCE IN FE 29
Summary 29
Teacher pay 30
Continuous professional development (CPD) 31
Teacher qualifications 32
7. TRENDS OVER TIME 35
Occupational distribution 35
Pay 36
Ethnicity 37
Age 37
Mode of working 38
Estimates of total workforce changes 39
8. CONCLUSIONS 40

2/43 Education & Training Foundation
EXECUTIVE SUMMARY
Frontier Economics was commissioned by the Education and Training Foundation (ETF) to carry out an analysis of the Further Education (FE) workforce in England using the 2015-16 Staff Individualised Record (SIR) dataset. The SIR dataset holds information on standard contracts of employment between FE providers and their members of staff, including information on the contract and on the demographic characteristics of the employee.
Historically SIR data was supplied by FE colleges for each academic year on a voluntary basis, and response rates have varied between years. In 2013-14, only 84 colleges (around a quarter of all colleges) supplied information on 61,524 contracts. Last year the response rate increased to 115 colleges (a third of all colleges) and 79,049 staff contracts. This year, the SIR was extended to cover a broader set of providers including Local Authorities, Independent Training Providers and Third Sector providers in addition to FE Colleges, Sixth Form Colleges and Specialist Colleges. In total, 175 providers supplied data this year with a total 66,061 contracts.
This report provides a descriptive account of the staff working in the FE sector in 2015-16, and where possible draws out comparisons of the workforce across different provider types, with previous years1 and with the school workforce. In addition to the descriptive account of the FE workforce, this year’s report includes some additional analysis looking at the characteristics of senior managers in the sector and how these have evolved over time.
The key findings from our analysis are:
Teachers (including assessors and verifiers) represent close to half of the entire FE workforce. The next biggest occupational group are service staff, followed by administrative and managerial staff (including senior managers and other managers).
Around half of all FE contracts are part-time, a proportion considerably higher than in the general UK workforce which stands at 27%2.
Close to two-thirds of FE staff are female, and this proportion is higher for part-time staff. The proportion of female staff in the FE sector is higher than in the general UK workforce, but lower than in the school workforce where 80% of staff are female3.
Median pay for full-time staff across all occupational groups in FE
1 Workforce reports for 2014-15 are available here: http://www.et-foundation.co.uk/news/etf-publishes-2014-2015-workforce-data/ 2 ONS UK labour market statistics: March 2017 available here: https://www.ons.gov.uk/employmentandlabourmarket/peopleinwork/employmentandemployeetypes/bulletins/uklabourmarket/mar2017 3 School Workforce in England November 2015 available here: https://www.gov.uk/government/uploads/system/uploads/attachment_data/file/533618/SFR21_2016_MainText.pdf

3/43 Education & Training Foundation
colleges is £26,609. Median pay is lower in independent training providers and other providers at £23,500 and 25,694 respectively. Median pay is highest for senior managers and lowest for Service staff across all provider types.
Over half of the staff in the FE sector are over the age of 45, indicating FE continues to be a second career for many. This finding is consistent with other work commissioned by the ETF4 showing that the average age of teacher trainees in FE is 37. The workforce is also predominantly white (86%).
Looking at trends over time, we can see that the FE workforce has been declining over time at an average rate of around 3% per year. Between 2011-12 and 2014-15, the full-time equivalent employees in FE Colleges fell by 12,300 FTEs.
Key findings from our analysis of the teaching staff data are:
Teaching staff are older than other staff (close to 40% of teaching staff are aged 50 or older). The average age of teaching staff in FE is 46 years.
Annual median pay for college teachers is £32,000 and the average is £30,288, much below the average pay of £37,400 for school teachers5.
For the first time in a number of years the SIR captures information on teacher qualifications and continuous professional development (CPD). The data reveals that most teachers (around three quarters) hold a qualification6. The most commonly held teaching qualifications are Postgraduate Certificate of Education (PGCE) covering 32% of teachers, Certificate of Education covering 23% of teachers and Level 5 Diploma in Education and Training covering 11% of teachers.
A third of teachers report main subject area qualifications at QCF Level 6 with another quarter holding main subject area qualifications at QCF Level 7 or higher.
On average, teachers spend 15 hours on CPD although it is worth noting that a majority of teachers (over 60%) report spending no time at all on CPD.
The key differences in findings across provider types are:
Full-time working is considerably more common in independent training providers, which are in line with the country average. In colleges, more than half of staff are part-timers and in other training providers (including Local Authorities and Third Sector organisations) almost 70% of staff work part-time.
Women represent 63% of college staff, 65% of independent 4 http://www.et-foundation.co.uk/wp-content/uploads/2017/03/ITE-data-report-new-brand.pdf 5 https://getintoteaching.education.gov.uk/funding-and-salary/teacher-salaries 6 Teaching qualification above level 2. A quarter of teachers report having no teaching qualification or holding a teaching qualification below level 2.

4/43 Education & Training Foundation
provider staff and 79% of other provider staff.
Independent training providers have the youngest workforce with more than half (ca. 60% of staff) aged under 45. The corresponding proportions are around 50% for colleges and 30% for other providers. The same pattern applies to teaching staff.
Annual median pay for teachers is £32,000 in colleges, £25,389 in independent training providers and £25,505 in other providers.
The key findings from our analysis of the characteristics of senior managers are:
Senior manager numbers have declined in line with the wider FE sector workforce and now account for around 1.4% of the workforce.
Senior managers are older than the general FE workforce with a median age of 51 compared with 46 for teachers and 45 for other staff. The age profile of senior managers has not changed much over the last four years.
Just over half (55%) of senior managers are women.
The vast majority of senior managers work full-time. This is the case for 93% of male senior managers and 91% of female senior managers. This pattern of working has not changed over the last four years.
Median pay for senior managers is £69,000 and there has been little change in that over the last four years.

5/43 Education & Training Foundation
1. INTRODUCTION
This report presents the findings from an analysis of workforce data from
the Staff Individualised Record (SIR) dataset for Further Education (FE)
providers in England for 2015-2016.
This is the thirteenth publication in the series of annual SIR reports on the
English FE workforce, and the fourth to be produced by the Education
and Training Foundation (ETF).
This year, for the first time the SIR data covers a broad range of provider
types including Local Authorities, Independent Training Providers and
Third Sector providers in addition to FE Colleges, Sixth Form Colleges
and Specialist Colleges.
The data contain information on all staff – teaching and non-teaching –
covering staff demographics (such as age, gender, ethnicity, disability
and sexual orientation), staff occupation and pay, subjects taught and
geographical location.
This report provides a descriptive account of the staff working in colleges
in 2015-2016 covering all aspects of the data (demographics, pay,
subjects taught, etc.).
In total, there are around 1,150 publicly funded FE providers in England
delivering learning to around 4 million learners. Around 50% of FE
learners participate in General FE Colleges including Tertiary); a further
22% with private providers (publicly funded); around 20% with another
publicly funded organisations such as Local Authorities and HE providers;
and the remainder at School Sixth Forms, Sixth Form Colleges and
Special Colleges.
This report is based on responses from 176 providers of which:
91 FE Colleges including General FE Colleges (81), Agriculture and Horticulture Colleges (6), National Specialist Colleges (4);
11 Sixth Form Colleges;
46 Independent Training Providers; and
28 Other providers (including Third Sector Organisations, Local Authorities and others.)

6/43 Education & Training Foundation
Where possible, the report comments on trends over time, by comparing
the findings from the 2015-16 data with those in previous years albeit
data comparability issues limit our ability to comment extensively on
changes over time.
The rest of the report is organised as follows:
Section 2 discusses our overall approach to the work including
methodology and a detailed description of the data processing we
have carried out.
Section 3 contains the main description of the FE workforce in
England in 2015-16.
Section 4 describes the characteristics of the teaching workforce
in English FE in 2015-16.
Section 5 presents analysis of the characteristics of senior
managers in FE.
Section 6 looks at some trends over time.
Section 7 concludes.

7/43 Education & Training Foundation
2. OUR DATA ANALYSIS APPROACH
Original dataset
The analysis in this report is based on Staff Individualised Record (SIR)
data. The latest wave of this data is SIR 24 and this was provided to us
by SkillsLogic who were responsible for gathering the data and
implementing some initial data processing. The scope of the SIR24
survey increased compared to previous years’ surveys through including
staff records from independent providers and other non-college
providers. In total, we received 66,061 individual staff records from 175
different providers that refer to the period between 1st August 2015 and
31st July 2016.
Data processing
Before starting the actual data analysis we checked each variable for
consistency with other observations and related information that is
included in other dimensions. Inconsistent records have been set to
‘missing’ to guarantee that the analysis of the respective variable is not
biased and to avoid dropping whole records for cases where only one
out of many other variables shows inconsistencies.
Grouped around broader topics, the SIR24 covers the following
information.
− Further Education (FE) provider information
o Provider name
o UK provider number
o Type of provider
o Location of the provider
− Staff information
o Personal characteristics: gender, age, ethnicity, disability
status and sexual orientation
o Contract information: Date of appointment, date of
contract start, date of leaving (if applicable), category of
work, main subject taught (for teaching staff), and gross
annual pay
o Terms of contract: fraction of fulltime worked, terms of
employment, proportion of time spent (i) providing
teaching and learning, (ii) supporting teaching and
learning, and providing other support.
− Experience/qualification:
o Highest held qualification
o Highest held teaching qualification
o Highest held qualification related to main subject taught
o CPD hours spent a year.
A few variables show inconsistencies. To control for this we set a few
records to missing. The following sets out what the inconsistencies and

8/43 Education & Training Foundation
under which circumstances we neglect these observations in our
analysis.
− Age. The ‘age’ variable was set to missing if the recorded age was
below 16 or above 100.
Main subject taught. (i) The ‘main subject taught’ variable was set to
missing if the staff member is recorded as being a teacher, but
recorded as ‘Not a teacher’ under main subject taught. (ii) Further,
the main subjects Maths and Science should usually be reported
separately, however some7 providers still refer to an older system
that reported these subjects under one single category. We decided
to allocate these records randomly to either Maths or Science. The
probability that a record with ‘Maths and Science’ is allocated to
either Maths or Science equals the proportions of teachers with
correctly coded Maths and Science contracts.
− Annual pay. There were a number of cases where staff members
were recorded as working for less than the minimum wage, based on
their annual pay and the fraction of full-time worked. The ‘annual pay’
variable was set to missing for these records. More generally we set
to missing records that reported to work fulltime but earned less than
£5000 a year. Both restrictions exclude staff that had a ’zero-hours’
or ‘voluntary worker’ contract.
− Proportion of time spent providing teaching and learning,
supporting teaching and learning, and providing other support.
These three variables were set to missing if their sum did not equal
100%.
− Fraction of fulltime. This year’s survey includes a significant
proportion of records that miss information on fulltime. Apart from
being interesting in itself, we use this information to aggregate the
staff in fulltime equivalents (FTEs), a measure that controls for lower
working hours of part time staff when aggregating staff numbers. In a
first step, we recovered information on fulltime based on previous
year’s statements of individuals that could be uniquely identified.
Secondly, we tested and applied an interpolation approach that
estimated for each record the fraction of fulltime that the individual is
working.8
− Date of appointment and date leaving. We flagged observations
that either started or left during the reference year of the survey.
Whereas this does not influence most parts of the analysis, we
exclude those when looking closer at annual pay and the fulltime
7 Eleven providers reported the Maths and Science is an single category. 8 We assessed the accuracy of these predictions by comparing estimates with actual outcomes when available. These test showed that biases stayed on a low one digit percentage level. See Annexe for more details.
9/43 Education & Training Foundation
variable. Working only a fraction of the academic year caused
confusion when reporting annual pay numbers or stating the faction
of fulltime that has been worked.
− Non-unique cases. The combination of UK provider number, the
staff reference number and the number of contracts that an individual
has within one provider should enable to uniquely identify an
observation within the survey. For a few cases this is not the case
however, and most of these can be explained through contract
extensions. When analysing job growth and turnover rates we
decided to neglect all observation that are not uniquely identified.
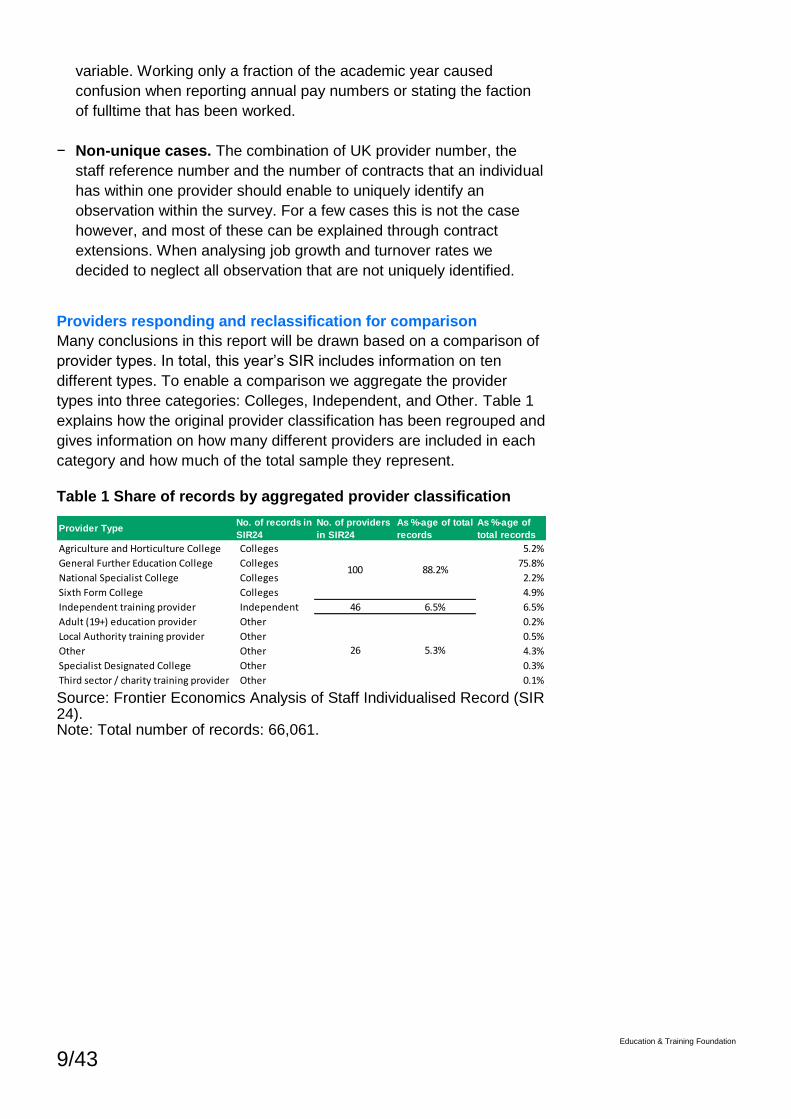
Providers responding and reclassification for comparison
Many conclusions in this report will be drawn based on a comparison of
provider types. In total, this year’s SIR includes information on ten
different types. To enable a comparison we aggregate the provider
types into three categories: Colleges, Independent, and Other. Table 1
explains how the original provider classification has been regrouped and
gives information on how many different providers are included in each
category and how much of the total sample they represent.
Table 1 Share of records by aggregated provider classification
Source: Frontier Economics Analysis of Staff Individualised Record (SIR 24). Note: Total number of records: 66,061.
Provider TypeNo. of records in
SIR24
No. of providers
in SIR24
As %-age of total
records
As %-age of
total records
Agriculture and Horticulture College Colleges 5.2%
General Further Education College Colleges 75.8%
National Specialist College Colleges 2.2%
Sixth Form College Colleges 4.9%
Independent training provider Independent 46 6.5% 6.5%
Adult (19+) education provider Other 0.2%
Local Authority training provider Other 0.5%
Other Other 4.3%
Specialist Designated College Other 0.3%
Third sector / charity training provider Other 0.1%
100 88.2%
26 5.3%

10/43 Education & Training Foundation
3. PROVIDERS PROFILES
Colleges
As noted in Table 1 above, the SIR 24 collection received responses
from 100 Colleges in total (of which 98 supplied usable data9), This is
equivalent to around 30% of all Colleges in England. In terms of the
sample split, the majority of responses (79%) came from General
Further Education Colleges (GFECs), 11% from Sixth Form Colleges
(SFCs), 6% from Agriculture and Horticulture Colleges and 4% from
National Specialist Colleges.
This means that overall GFECs are overrepresented in the SIR 24
sample while SFCs are underrepresented (they account for 11% of the
SIR 24 data but 28% of all colleges). As a whole, however, the Colleges
supplying SIR 24 data appear to be broadly representative of the sector
- they account for 30% of all colleges and also 31% of all learners, 31%
of staff and 32% of college income.
Figure 1 College sample composition in SIR 24
Source: Frontier Economics analysis of SIR 24.
Colleges are not a homogenous category and there are clear
differences between them - the difference between the smallest and
largest colleges in the sample can be tenfold or even greater in terms of
staff and student numbers10. On average, however, GFECs have 6,443
9 A small number of responses were excluded from analytical work due to the small number of records reported in the data. 10 For example, the smallest colleges in the sample have just over 100 staff while the largest have staff over 1,000 in FTE terms.
6%
79%
4%
11%
Agriculture and Horticulture College
General Further Education College
National Specialist College
Sixth Form College

11/43 Education & Training Foundation
students11, of which 2,43312 are between 16 and 18 years old and
therefore most likely to be full time students. GFECs receive on average
£ 23,162,282 funding13 from funding body14 grants. Funding makes up
81 per cent of total income for colleges.15 82% of colleges were judged
good or outstanding for their overall effectiveness at their most recent
Ofsted inspection.16
The average GFEC employs 507 full-time equivalent people, of which
256 are teaching staff.17 Teachers make up 42 per cent of total staff
employed by colleges. 9.7 per cent of all teachers teach engineering
and manufacturing technologies and 4.4 per cent of all teachers teach
mathematics courses. The median pay of college staff is £27,927,
whereas teaching staff have a median pay of teaching staff is £32,000.18
58 per cent of all college staff is female and the average employee
working in a college is 45 years old.
11 SFA data: SFA_and_EFA_funded_learners_S3.1c__Total_learners, 2014-15 12 SFA data: SFA_and_EFA_funded_learners_S3.1a_16-18_Learners, 2014-15 13 SFA data: Income_T1.1_Funding_body_grants, 2014-15 14 Including the Skills Funding Agency, the Education Funding Agency, the Higher Education Funding Council for England and others. 15 AOC: College Key facts; percentages based on 2014-15 (latest numbers): https://www.aoc.co.uk/sites/default/files/AoC%20College%20Key%20Facts%202016%20webversion.pdf 16 AOC: College Key facts; percentage is based on year 2015/2016; percentage is lower for 2016/2017. 17 SFA data: S4.1i_Total_staff_number_as_per_finance_record and S4.1b_Teaching_staff_FTEs, 2014-15 18 SIR data

12/43 Education & Training Foundation
Independent training providers (ITPs)
The SIR 24 contains responses from 46 ITPs, equivalent to around 8%
of all ITPs in England19. Most of the ITPs supplying data are relatively
small with fewer than 50 staff. There are also a handful of large
providers and one very large provider with over 1,000 staff (see Figure
2). Comparing the sample with the population of ITPs20 we can see that
large providers21 are somewhat overrepresented and small providers22
underrepresented in the SIR 24 – large providers and small providers
make up 12% and 27% of the SIR 24 sample but only 5% and 48% of
the population of ITPs.
The average ITP employs 93 staff or 79 staff in full time equivalents. Of
those around 19 are teachers.
Figure 2 ITPs in SIR 24 by size
Source: Frontier Economics analysis of SIR 24.
Other providers
The SIR 24 contains responses from 26 providers which are not ITPs or
GFECs. The majority of providers in this category are Local Authorities
(73%), the remaining being third sector organisations and Adult learning
providers. Local authorities vary in size – the larger ones have over 500
staff and the smaller ones in the region of 50-100 staff. Adult learning
providers and third sector organisations are small with typically fewer
than 20 staff. The average Local Authority provider employs 170 staff or
90 staff in full time equivalents. Of those around 30 are teachers.
19 This is based on an estimated 600 ITPs having a direct contract with the SFA available here: https://www.gov.uk/government/uploads/system/uploads/attachment_data/file/544310/bis-16-360-fe-market-england.pdf 20 ITPs with direct contract with the SFA 21 Defined as those in receipt of over £10m in SFA funding 22 Defined as those in receipt of less than £1m in SFA funding
0
200
400
600
800
1,000
1,200
Pro
vid
er 1
Pro
vid
er 2
Pro
vid
er 3
Pro
vid
er 4
Pro
vid
er 5
Pro
vid
er 6
Pro
vid
er 7
Pro
vid
er 8
Pro
vid
er 9
Pro
vid
er 1
0
Pro
vid
er 1
1
Pro
vid
er 1
2
Pro
vid
er 1
3
Pro
vid
er 1
4
Pro
vid
er 1
5
Pro
vid
er 1
6
Pro
vid
er 1
7
Pro
vid
er 1
8
Pro
vid
er 1
9
Pro
vid
er 2
0
Pro
vid
er 2
1
Pro
vid
er 2
2
Pro
vid
er 2
3
Pro
vid
er 2
4
Pro
vid
er 2
5
Pro
vid
er 2
6
Pro
vid
er 2
7
Pro
vid
er 2
8
Pro
vid
er 2
9
Pro
vid
er 3
0
Pro
vid
er 3
1
Pro
vid
er 3
2
Pro
vid
er 3
3
Pro
vid
er 3
4
Pro
vid
er 3
5
Pro
vid
er 3
6
Pro
vid
er 3
7
Pro
vid
er 3
8
Pro
vid
er 3
9
Pro
vid
er 4
0
Pro
vid
er 4
1
Pro
vid
er 4
2
Pro
vid
er 4
3
Pro
vid
er 4
4
Pro
vid
er 4
5
Pro
vid
er 4
6
Staff headcount

13/43 Education & Training Foundation
4. PROFILE OF THE FE WORKFORCE
In this section we provide an overview of the FE workforce in England
based on the sample of providers responding to the 2015-16 Staff
Individualised Record (SIR 24) dataset. We describe the characteristics
of the workforce, including analysis of occupation, staff turnover,
gender, share of part time/fulltime workers, age, ethnicity, sexual
orientation, disability status and annual pay.
Occupation
In 2015-16 the SIR recorded 66,061 contracts across 172 FE providers.
In line with previous years, teaching staff remain the largest
occupational group, representing around 42% of all contracts. Service
staff, who account for 20% of contracts and Administrative staff, who
account for 17% of contracts, are the second and third largest groups
respectively.
Table 2 Staff breakdown by occupational group in FE colleges in
England, 2015-16
Source: Frontier Economics Analysis of Staff Individualised Record (SIR 24). Note: Total number of records: 66,061.
The occupational breakdown differs across different FE provider types
(see Figure 3). Teaching staff in independent providers represent a
lower fraction of the overall staff, whereas administrative staff, as well as
assessors have a relatively higher share.
Occupation Records in sample As %-age of total
Other Manager 4,181 7.1%
Senior Manager 800 1.4%
Administrative staff 10,325 17.4%
Technical staff 3,514 5.9%
Service staff 11,919 20.1%
Teaching staff 25,070 42.3%
Assessors and verifiers 2,466 4.2%
Apprentice 933 1.6%
Total 59,208

14/43 Education & Training Foundation
Figure 3 Type of occupation by provider type
Source: Frontier Economics Analysis of Staff Individualised Record (SIR 24). Note: Total number of contracts: 66,061.
Staff turnover
We analyse staff turnover using two measures:
− The turnover rate is the number of contracts ending within the 2015-
16 teaching year as a percentage of all contracts at the beginning of
that year.
− The net employment change is the change in the total number
contracts between the beginning and end of the 2015-16 teaching
year, expressed as a proportion of all contracts at the beginning of
that year. This measures whether the workforce has increased or
decreased over the year.
We must note that our analysis of the turnover rate is based on the
number of contracts and not the number of staff because the SIR data is
at a contract rather than individual level.
Overall, there was a 12% turnover rate and a 2% increase in staff
numbers (as measured by the employment change). The increase in
staff numbers is particularly notable given declines of 1.7% in 2014-15
and 2.7% in 2013-14.
Table 3 compares the staff turnover rate and net employment change
across each occupational category. Both measures are notably higher
for apprentices which is to be expected given the fixed duration of
apprenticeship. Among the other occupations, staff turnover is highest
for Senior Managers (14.3%), Assessors and Verifiers (13.0%), and
Administrative and Professional staff (13.1%).
0%
10%
20%
30%
40%
50%
60%
70%
Re
lative
Fre
qu
en
cie
s
Colleges Independent Other

15/43 Education & Training Foundation
Staff numbers have increased in all occupations except Senior
Managers and Other Managers, which now make up 6.7% and 1.7% of
the FE workforce respectively. The largest increases occurred for
Apprentices (35.7%), Assessors and Verifiers (7.9%), and Word
Processing, Clerical and Secretarial staff (7.8%).
Table 3 Turnover and net employment change rates by
occupational groups
Source: Frontier Economics Analysis of Staff Individualised Record (SIR 24). Note: Total number of contracts: 66,061. The high turnover rate of apprentices can be mostly explained by the nature of this working category. The high growth rate will represent a relatively small number of individuals, but does show a large increase in the number of apprentices being taken on by FE providers.
Table 4 Turnover and net employment change rates by
occupational groups, by provider type
Source: Frontier Economics Analysis of Staff Individualised Record (SIR 24).
Table 4 shows that employment growth is very different across different
provider types. In colleges the only categories experiencing positive
growth are technical staff, service staff and assessors and verifiers.
Independent providers report staff increases during 2015/16 for all
occupations.
Part time workers
Firstly, Figure shows what fraction of staff work full time across different
provider types. Within independent providers 74% of staff work full time.
In contrast, in FE colleges 46% of staff work full time and in other
providers the fraction is even lower at 30%. We observe a similar
Occupation Turnover Rate Staff Growth Rate
Other Manager 11.9% -2.0%
Senior Manager 12.3% -4.5%
Administrative staff 13.0% 0.5%
Technical staff 11.4% 2.4%
Service staff 10.6% 4.0%
Teaching staff 11.2% 1.1%
Assessors and verifiers 13.1% 7.9%
Apprentice 46.2% 35.7%
Occupation Turnover Growth Turnover Growth Turnover Growth
Other Manager 13% -4% 9% 12% 4% 1%
Senior Manager 13% -6% 10% 9% 5% 5%
Administrative staff 13% -1% 12% 18% 13% -1%
Technical staff 12% 2% 4% 22% 9% -2%
Service staff 11% 4% 14% 7% 3% 11%
Teaching staff 12% 0% 11% 16% 5% 8%
Assessors and verifiers 12% 4% 17% 22% 6% 12%
Apprentice 52% 25% 23% 67% 17% 200%
Colleges Independent Other

16/43 Education & Training Foundation
tendency among part time workers, where more staff from independent
providers can be found in the upper part of the distribution compared to
colleges and other providers, that is to say part-timers in independent
providers work more hours than part-timers in other provider types.
Figure 4 Shares of staff by fraction of full-time and provider type
Source: Frontier Economics analysis of SIR 24.
Gender
Figure illustrates that on average more than half of the FE workforce is
female (60% of full-time equivalent staff). Given that women are more
likely to work part-time (see Figure ) this measure will underestimate the
proportion of the total number of women working in FE as a share of the
overall number. The proportions vary across occupational groups, but
women are in the majority in all occupations except technical staff.
While women are in the majority of managerial staff, the proportion of
female FTEs in senior managerial roles (53%) is below the average for
all FTEs (60%).
0%
10%
20%
30%
40%
50%
60%
70%
80%
Re
lative
Fre
qu
en
cie
s
Fraction of full-time category
Relative frequency of staff working a fraction of full-time Fulltime = 100
Colleges Independent Other

17/43 Education & Training Foundation
Figure 5 Share of female and male FTE workers per occupation
type
Source: Frontier Economics analysis of SIR 24.
Figure illustrates that women are more likely than men to work part-time
across all provider types. The share of part time workers differs however
quite strongly across provider types. In colleges, 62% of women and
41% of men work part time. Looking at independent training providers,
we observe that only 32% of women and 14% of men work part time.
Other providers have the highest share of part time workers in their
workforce.
Figure 6 Proportion of men and women by working hours as
proportion of working full-time
Source: Frontier Economics analysis of SIR 24. Note: Part time cover all staff records that work less than 100 % of fulltime.
59%53%
79%
36%
66%
53%61%
54%
41%47%
21%
64%
34%
47%39%
46%
0%
10%
20%
30%
40%
50%
60%
70%
80%
90%
100%
Re
lative
Fre
qu
ency b
y C
ate
go
ry o
f W
ork
Share of female and male FTE workers per occupation type
Female Male Average all staff
62%
40%
32%
14%
75%
56%
38%
60%
68%
86%
25%
44%
0%
10%
20%
30%
40%
50%
60%
70%
80%
90%
100%
Female Male Female Male Female Male
Colleges Independent Other
Share of part time / full time employees, by provider type and gender
Part time Full time

18/43 Education & Training Foundation
Age
Figure 7 shows the age distribution of staff working in FE providers split
into the three aggregate types. In general, the highest proportion of staff
is between 50 and 54 years old. There are however differences across
providers. More generally, colleges (45 years) and independent
providers (42 years) have a much younger workforce compared to other
providers (51 years).
Figure 7 Proportion of staff by age bands in FE colleges in England
Source: Frontier Economics analysis of SIR 24. Note: Age was undefined on 1% of all contracts. Measure based on FTEs.
0%
5%
10%
15%
20%
25%
Re
lative
Fre
qu
en
cie
s
Age distribution of staff, by provider type
Colleges Independent Other

19/43 Education & Training Foundation
Ethnicity
Figure 8 illustrates that the workforce in FE colleges is primarily White
British. In detail, White British represent 93% of the workforce of
independent providers, 84% of Colleges and 87% of other providers.
Figure 8 Ethnicity of staff by provider type in England
Source: Frontier Economics analysis of SIR 24. Note: Proportions exclude 5,305 records where ethnicity is reported as unknown. Measured in FTEs.
0%
10%
20%
30%
40%
50%
60%
70%
80%
90%
100%
White British White Other Mixed Asian Black Chinese Other
Sh
are
with
in p
rovid
er
typ
e
Ethnic distribution per occupation type
Colleges Independent Other

20/43 Education & Training Foundation
Sexual Orientation
The SIR includes a question on sexual orientation (see Figure 9). The
graph excludes the share of missing responses and records that report
their sexual orientation as ‘Unknown’. The two categories represent
17% and 33 % of the total workforce, an improvement in the share of
records providing information on sexual information relative to last year
when this information was available for only a third of records.
Figure 9 Sexual orientation of FE staff in England
Source: Frontier Economics analysis of SIR 24.
0.5% 0.9%
78.4%
0.6%
19.5%
0%
10%
20%
30%
40%
50%
60%
70%
80%
90%
Bisexual Gay Heterosexual Lesbian Prefer not to say
Sh
are
of o
ve
rall
sta
ff
Sexual orientation of staff

21/43 Education & Training Foundation
Disability
Close to 6% of staff in FE reported having some form of disability.
However, over half of these staff members chose not to disclose the
nature of their disability. Of those indicating their disability, the most
common was a physical impairment (2% of all staff across provider
types). Comparing across provider types, it is not clear that there are
any systematic differences between provider types23.
Figure 10 Disability status of FE staff in England by provider type
Source: Frontier Economics analysis of SIR 24. Note: Proportions exclude 4,846 records where ethnicity is reported as ‘Unknown’ and 2,200 records with missing information (both representing 14% of total staff).
23 On the face of it, other provider types appear to employ relatively fewer staff without a disability compared to independent providers and colleges. However, these providers also have higher proportion of responses classified as ‘prefer not to say’ and missing values which indicate that this finding may be driven by the way the data reporting is done rather than a genuine difference in employment patterns.
0%
10%
20%
30%
40%
50%
60%
70%
80%
90%
100%
No Prefer not to say Yes - learningdifficulty
Yes - mental illhealth
Yes - physicalimpairment
Yes - rather notsay
Sh
are
of o
ve
rall
sta
ff
Staff disability by provider type

22/43 Education & Training Foundation
Annual Gross Pay
Slight differences in the distribution of annual pay for staff can be seen
when comparing provider types (see
Figure 11). Median pay is £26,609 for college staff, £23,500 for staff in
independent providers, and £25,694 for staff in other provider types.
The vast majority of full time staff (71.8%) earn between £15,000 and
£40,000 a year.
Figure 11 Annual Gross Pay of staff by provider type (fulltime staff
only)
Source: Frontier Economics analysis of SIR 24. Note: For comparability the graph only reports the annual pay for fulltime staff. Also, we excluded records that either started or left the provider during reference year of the survey.
Looking at differences in median pay by category of work in Figure 12,
we see that the median pay across categories of work is actually very
similar between provider types. Only teachers in colleges earn more
than their colleagues in other types of provider, and senior managers in
independent providers earn around £15,000 less compared to the
others, albeit it is worth noting that independent providers are also on
average smaller in terms of staff numbers.
0%
5%
10%
15%
20%
25%
30%
35%
5 - 10 15 - 20 25 - 30 35 - 40 45 - 50 55 - 60 65 - 70 75 -100
> 100
As a
share
of overa
ll
In thousand £
Distribution of pay among staff working (fulltime only)
Colleges Independent Other

23/43 Education & Training Foundation
Figure 12 Median annual pay by provider type and category of
work (fulltime staff only)
Source: Frontier Economics analysis of SIR 24. Note: For comparability the graph only reports the annual pay for fulltime staff. Also, we excluded records that either started or left the provider during reference year of the survey.
0
10,000
20,000
30,000
40,000
50,000
60,000
70,000
80,000
An
nu
al P
ay in
£
Median pay by occupation and provider type
Colleges Independent Other

24/43 Education & Training Foundation
Focusing on colleges, Figure 13 portrays regional differences between
staff. Not surprisingly, staff in the London are paid more than staff in
other regions.
Figure 13 Median annual pay by category of work and region
(fulltime staff only)
Source: Frontier Economics analysis of SIR 24. Note: Colleges, fulltime staff only. Records that started or left the provider during the reference year have been excluded.
0
10,000
20,000
30,000
40,000
50,000
60,000
70,000
80,000
An
nu
al P
ay in
£
Median annual pay of staff per occupation and region (Colleges only)
London South East and Midlands North

25/43 Education & Training Foundation
5. SENIOR STAFF
This section focuses on senior staff in colleges, independent providers
and other providers. Comparisons are made looking at differences in
pay and other characteristics over time. To benchmark the information
from senior staff we include information on teaching staff and all other
staff.
Senior managers include Chief Executives such as Principals,
Managing Directors, Heads of Local Authority Education services, and
Second Tier Managers (e.g. Vice Principals, Directors of Academic
Programmes).
Annual Gross Pay
Senior management in independent providers receive a median pay of
£50,000, which is considerably less than their counterparts in colleges
(£74,000) and other providers (£66,000). This may be related to
provider size – as previously noted in Chapter 2 ITPs are considerably
smaller than GFECs. Their annual pay is also roughly twice as much as
the pay for teaching staff and all other staff.
Figure 14 Median pay of senior managers, teaching staff and other
staff by provider type
Source: Frontier Economics analysis of SIR 24. Note: Colleges, fulltime staff only, and excluding records that started or left the provider during the reference year of the survey.
In order to analyse trends over time, we have focused on a sub-set of
providers (all of which are FE colleges) who have supplied SIR data in
the last four years. There are 29 such providers and so the findings in
this section have been derived from a relatively small sample of the FE
college sector so should be interpreted in this context.
73,992
32,000
22,679
50,000
25,389 23,000
66,167
25,505 26,888
0
10,000
20,000
30,000
40,000
50,000
60,000
70,000
80,000
Me
dia
n p
ay w
ith
in c
lass
Median pay of senior managers, teaching staff and others (fulltime only)
Colleges Independent Other

26/43 Education & Training Foundation
When observing trends over time, the majority of senior managers
earned an annual pay between £50,000 and £70,000, with the
managers in the pay class £70,000 - £80,000 experiencing a significant
increase in the latest period. Around 20% of all senior staff earned
£100,000 or more. Median pay for the selected 29 providers rose from
£67,500 in SIR21 (covering the academic year 2012/2013) to £75,090 in
SIR24.
Figure 15 Pay distribution of senior managers, teaching staff and
other staff over time
Source: Frontier Economics analysis of SIR21, SIR22, SIR23, and SIR24. Note: Colleges, fulltime staff only, and excluding records that started or left the provider during the reference year of the survey. Comparison over time considers only 29 colleges that have reported consistently across the three surveys.
Age
Compared to teachers and other staff, the median age of senior
managers is consistently about 6-7 years older. Over time we can
observe a slight, but not substantial age decrease in all groups.
0%
5%
10%
15%
20%
25%
30%
Rela
tive f
requency o
f cla
ss
Annual pay classes in '000 £
Pay of senior managers over time (fulltime only)
SIR 21 SIR 22 SIR 23 SIR 24

27/43 Education & Training Foundation
Figure 16 Median age of senior managers, teaching staff and other
staff across time
Source: Frontier Economics analysis of SIR21, SIR22, SIR23, and SIR24. Comparison over time considers only 29 colleges that have reported consistently across the three surveys.
Share of full time senior management by gender
The share of senior management working full time has only dropped
slightly since 2012/2013. Female senior managers have a slightly higher
share of part timers compared to men but the difference is very small
and hasn’t changed over time (see Figure 17).
Among senior managers who work part time, the majority work 80%, i.e.
4 days a week, a finding which is consistent across time.
Figure 17 Share of full-time employed within senior management
by gender
Source: Frontier Economics analysis of SIR21, SIR22, SIR23, and
SIR24.
52
47
45
51
47
45
51
46
44
51
46 45
30
35
40
45
50
55
Rela
tive f
requencie
s
Median age of senior managers, teachers and others over time
SIR 21 SIR 22 SIR 23 SIR 24
94% 96%92% 93%
91%
85%87%
91%
0%
10%
20%
30%
40%
50%
60%
70%
80%
90%
100%
Rela
tive f
requencie
s
Share of senior managers working fulltime, by gender
Male Female

28/43 Education & Training Foundation
Share of fulltime senior management by gender
Figure gives information on how the number of senior staff developed
over time compared to previous years and compared to the overall
number of staff in a college. We see that the number of senior staff in
colleges reduced within three years by approximately 13%. At the same
time their share of overall staff decreased marginally from 1.53% to
1.47%. According to this the decrease in senior management numbers
followed the overall trend of declining staff numbers in colleges.
Figure 18 Growth of senior managers and share of senior
managers of all FTE staff
Source: Frontier Economics analysis of SIR21, SIR22, and SIR23. Note: Senior staff in SIR 21 builds the base year for the growth comparison in the following year. The difference in numbers represents the percentage growth or decline compared to that base year. SIR24 data was not included in this figure due to discrepancies with FTE.
100.0
94.1
87.4
1.53%
1.55%
1.47%
1.40%
1.45%
1.50%
1.55%
1.60%
0
20
40
60
80
100
120
SIR 21 SIR 22 SIR 23
Se
nio
r M
an
ag
ers
as a
sh
are
of
all
FT
E s
taff
Gro
wth
in
% o
f re
lative
to
ba
se
su
rve
y (
SIR
21
)
Growth of senior managers and share of senior managers of all FTE staff across waves
Growth from base year Avg. SM share of all FTE staff

29/43 Education & Training Foundation
6. PROFILE OF THE TEACHING WORKFORCE IN FE
In this section we look at the characteristics of teachers in FE, the single largest occupational category in the sector accounting for 42% of staff.
We first look at the demographic characteristics of teachers and highlight any differences between different provider types, and where possible, with the school workforce. We then analyse in more detail teachers’ pay, subjects and teacher numbers across providers, and teachers’ turnover rates.
Summary
Teaching staff are older than other staff (close to 40% of teaching staff are aged 50 or older). The average age of teaching staff in FE is 46 years. Teachers in independent providers tend to be younger while teachers in other provider types (e.g. Local Authorities, charities) are on average older (see Figure ).
Women account for 64% of all staff and 58% of teaching staff. In colleges and independent providers, the proportion of female teachers is consistent with the sector average. In other provider types, women represent close to three quarters of all teachers.
Around 84% of teaching staff in colleges are White British. This ratio is higher in independent providers and lower in other provider types.
Annual median pay for college teachers is £32,000 and the average is £30,288, much below the average pay of £37,400 for school teachers24.
For the first time in a number of years the SIR captures information on teacher qualifications and continuous professional development (CPD). The data reveals that most teachers (around three quarters) hold a teaching qualification25. The most commonly held teaching qualifications are Postgraduate Certificate of Education (PGCE) covering 32% of teachers, Certificate of Education covering 23% of teachers and Level 5 Diploma in Education and Training covering 11% of teachers.
A third of teachers report main subject area qualifications at QCF Level 6 with another quarter holding main subject area qualifications at QCF Level 7 or higher.
On average, teachers spend 15 hours on CPD although it is worth noting that a majority of teachers (over 60%) report spending no time at all on CPD.
24 https://getintoteaching.education.gov.uk/funding-and-salary/teacher-salaries 25 Around the quarter report holding no relevant teaching qualification

30/43 Education & Training Foundation
Figure 19 Age distribution of teaching staff by provider type
Source: Frontier Economics analysis of SIR24 data
Figure 20 Ethnicity of teaching staff by provider type
Source: Frontier Economics analysis of SIR24 data
Teacher pay Annual median pay (for fulltime teachers only) for college teachers is £32,000 and the average is £30,288, much below the average pay of £37,400 for school teachers26. Teacher pay is higher in colleges than in other provider types as shown in Figure . Managerial staff is the only occupational group earning consistently more than teaching staff.
26 https://getintoteaching.education.gov.uk/funding-and-salary/teacher-salaries
0%
5%
10%
15%
20%
25%
Under 25 25 - 29 30 - 34 35 - 39 40 - 44 45 - 49 50 - 54 55 - 59 60 and over
As a
sh
are
of to
tal te
ache
r nu
mb
ers
Ageband
Age distribution of teaching staff by provider type
Colleges Independent Other
0%
10%
20%
30%
40%
50%
60%
70%
80%
90%
100%
Fre
qu
en
cy
Ethnic distribution of teaching starr by provider type
Colleges Independent Other

31/43 Education & Training Foundation
Figure 21 Median pay by occupation and provider type
Source: Frontier Economics analysis of SIR24 data
As in previous years, there is some variation in teacher pay by region.
The highest median pay is in London at £36,613 followed by East and
Midlands at and South at £32,246 and £31,673 and North at £31,218.
The regional variation in teacher pay is consistent across provider types.
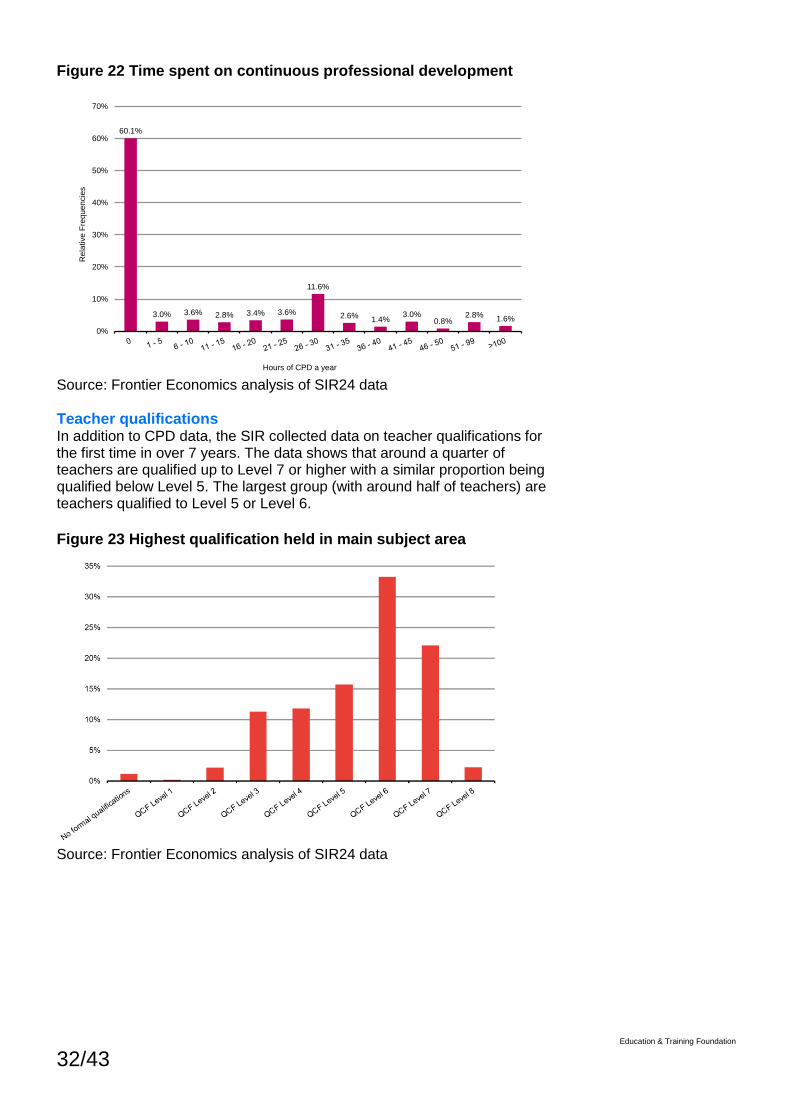
Continuous professional development (CPD)
For the first time this year, the SIR collected data on CPD. The data
shows that on average, teachers spend 15 hours on CPD although it is
worth noting that the average masks a very unequal distribution as
shown in Figure 22.
In fact a majority of teachers (over 60%) report spending no time at all
on CPD. Of the remaining 40%, relatively similar numbers report
between 1-5 hours up to 21-25 hours. The single largest value reported
by teaching staff is between 26 and 30 hours. 12% of teachers report
values higher than 30 hours.
0
10,000
20,000
30,000
40,000
50,000
60,000
70,000
80,000
An
nu
al P
ay in
£
Median pay by occupation and provider type
Colleges Independent Other
32/43 Education & Training Foundation
Figure 22 Time spent on continuous professional development
Source: Frontier Economics analysis of SIR24 data
Teacher qualifications In addition to CPD data, the SIR collected data on teacher qualifications for the first time in over 7 years. The data shows that around a quarter of teachers are qualified up to Level 7 or higher with a similar proportion being qualified below Level 5. The largest group (with around half of teachers) are teachers qualified to Level 5 or Level 6.
Figure 23 Highest qualification held in main subject area
Source: Frontier Economics analysis of SIR24 data
60.1%
3.0% 3.6% 2.8% 3.4% 3.6%
11.6%
2.6%1.4%
3.0%0.8%
2.8%1.6%
0%
10%
20%
30%
40%
50%
60%
70%
Re
lative
Fre
qu
en
cie
s
Hours of CPD a year
Relative frequency of time that teaching staff spends on CPD
33/43 Education & Training Foundation
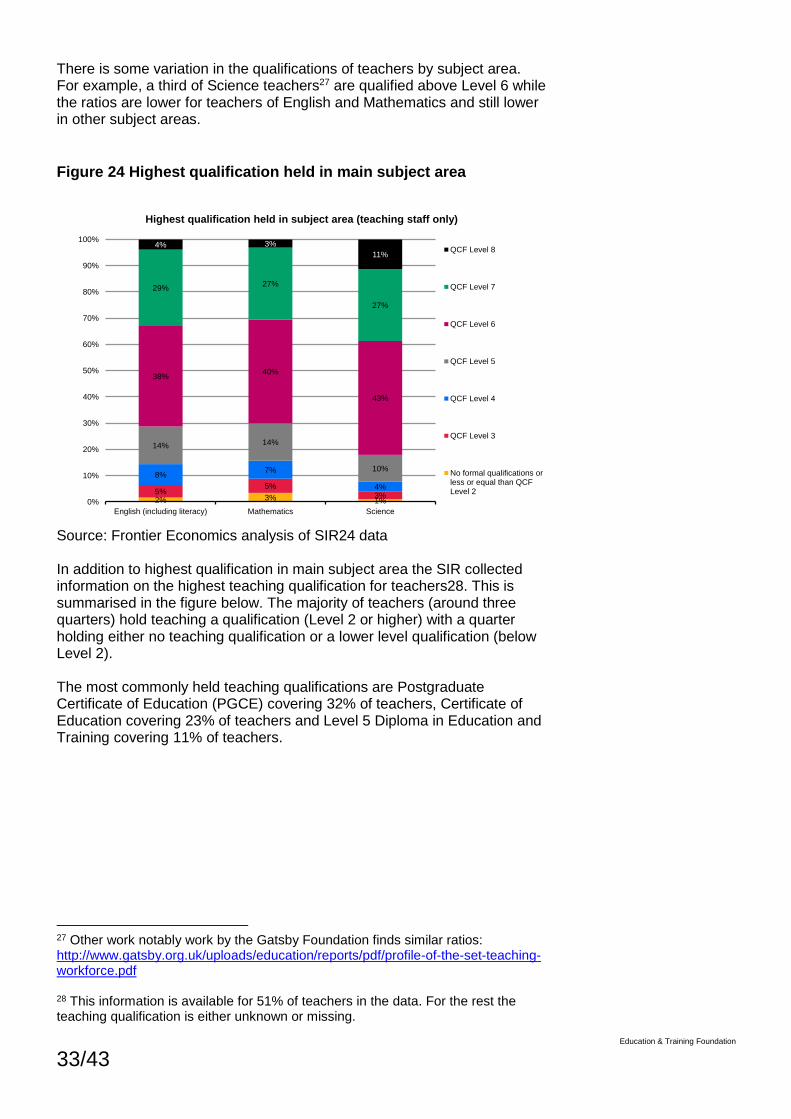
There is some variation in the qualifications of teachers by subject area. For example, a third of Science teachers27 are qualified above Level 6 while the ratios are lower for teachers of English and Mathematics and still lower in other subject areas.
Figure 24 Highest qualification held in main subject area
Source: Frontier Economics analysis of SIR24 data In addition to highest qualification in main subject area the SIR collected information on the highest teaching qualification for teachers28. This is summarised in the figure below. The majority of teachers (around three quarters) hold teaching a qualification (Level 2 or higher) with a quarter holding either no teaching qualification or a lower level qualification (below Level 2). The most commonly held teaching qualifications are Postgraduate Certificate of Education (PGCE) covering 32% of teachers, Certificate of Education covering 23% of teachers and Level 5 Diploma in Education and Training covering 11% of teachers.
27 Other work notably work by the Gatsby Foundation finds similar ratios: http://www.gatsby.org.uk/uploads/education/reports/pdf/profile-of-the-set-teaching-workforce.pdf 28 This information is available for 51% of teachers in the data. For the rest the teaching qualification is either unknown or missing.
2% 3% 1%5%
5%3%
8%7%
4%
14% 14%
10%
38%40%
43%
29%27%
27%
4% 3%
11%
0%
10%
20%
30%
40%
50%
60%
70%
80%
90%
100%
English (including literacy) Mathematics Science
Highest qualification held in subject area (teaching staff only)
QCF Level 8
QCF Level 7
QCF Level 6
QCF Level 5
QCF Level 4
QCF Level 3
No formal qualifications orless or equal than QCFLevel 2

34/43 Education & Training Foundation
Figure 24 Highest teaching qualification held (teachers only)
Source: Frontier Economics analysis of SIR24 data
0%
5%
10%
15%
20%
25%
30%
35%
Level 1 Level 2 Level 3 Level 4 Level 5 Level 6 Level 7 Other No relevantqualifications

35/43 Education & Training Foundation
7. TRENDS OVER TIME
For analysing trends over time we again apply the approach of only
looking at providers that have reported staff records throughout all
previous four SIR waves. More specifically, we use the time series to
draw conclusions on the distribution of staff working in different
occupation types. We analyse how median pay has developed over time
and we look more closely at the ethnic distribution of the workforce.
Finally, we report how the median age and the fulltime share have
changed within occupation types.
Occupational distribution
Figure 25 indicates that there have been little changes in staff
composition over time. The share of teaching staff dropped from 51% to
45% between the previous two data collections. On the other hand the
share of administrative staff and technical staff increased slightly. Note
that apprentices are a new staff category in this year’s and cannot yet
be compared with figures over time.
Figure 25 Distribution of FTE staff in work categories
Source: Frontier Economics analysis of SIR21, SIR22, SIR23, and SIR24. Selected providers.
0%
10%
20%
30%
40%
50%
60%
As a
share
of to
tal
Distribution of FTE staff in work categories over time
SIR 21 SIR 22 SIR 23 SIR 24

36/43 Education & Training Foundation
Pay
Figure 26 shows how different earning groups evolved over time. The
data reveals a modest increase in median earnings (on FTE basis) from
£28,500 (in SIR21) to £29,500 in SIR24.The latest data shows an
increase in the number of employees with annual earnings of £30,000 –
£34,999.
Figure 26 Distribution of pay bands over time (fulltime staff only)
Source: Frontier Economics analysis of SIR21, SIR22, SIR23, and SIR24. Selected providers.
0%
5%
10%
15%
20%
25%
As a
share
of to
tal
Distribution of paybands among fulltime staff over time
SIR 21 SIR 22 SIR 23 SIR 24

37/43 Education & Training Foundation
Ethnicity
Looking at ethnicity, there appears to be an increase in the share of
White British staff from 76% to 82% over the last four years. However,
we have found evidence that this change may not be genuine but rather
may be an artefact of the data29 and so cannot be confident in this
finding.
Figure 27 Ethnic distribution of FTE staff over time
Source: Frontier Economics analysis of SIR21, SIR22, SIR23, and SIR24. Selected providers.
Age
Median age has remained similar over time with senior managers being
the oldest occupation group (51 years), followed by assessors at 47
years. Across all staff, median age has been constant at 46 years. Other
work commissioned by the ETF looking at individuals undertaking Initial
Teacher Education (ITE) shows that the average age of initial teacher
trainee is 37, down from 38 two years ago.
29 We know that this is a variable that is not very well reported with many missing and unknown values, particularly in the earlier years of data. Tracing individuals over time, we can see that individuals who were in later years classed as White British had previously been reported as unknown.
0%
10%
20%
30%
40%
50%
60%
70%
80%
90%
As a
share
of to
tal
Ethnic distribution of FTE staff over time
SIR 21 SIR 22 SIR 23 SIR 24

38/43 Education & Training Foundation
Figure 28 Median age by work category
Source: Frontier Economics analysis of SIR21, SIR22, SIR23, and SIR24. Selected providers.
Mode of working
The share of staff working full time shows different trends depending on
the type of occupation. For professions within senior management or
administration staff we see little changes over time, Teaching staff and
assessors show a step increase in full time numbers. Considering all
staff, the fraction of full time contracts has increased from 46% in SIR 21
to 51% in SIR 24.
Figure 29 Share of fulltime employed of overall staff records over
time
Source: Frontier Economics analysis of SIR21, SIR22, SIR23, and SIR24. Selected providers.
0
10
20
30
40
50
60
Media
n o
utc
om
e w
ithin
cla
ss
Median age of staff by work category
SIR 21 SIR 22 SIR 23 SIR 24
0%
10%
20%
30%
40%
50%
60%
70%
80%
90%
100%
Sh
are
of F
TE
em
plo
ye
d
Share of fulltime employed of overall FTE staff
SIR 21 SIR 22 SIR 23 SIR 24

39/43 Education & Training Foundation
Estimates of total workforce changes
Frontier Economics previously estimated the overall size of the FE
workforce based on SIR data as well as survey data covering Work
Based Learning (WBL) and Adult and Community Learning providers
(ACL). The estimates based on 2013-14 data suggested an overall
workforce of 326,000 staff. The vast majority of staff (250,000) were
employed in GFECs. The WBL and ACL workforces were estimated to
be at around 51,000 and 25,000 respectively. Based on the observed
year to year decline in the GFEC workforce in the SIR data it is possible
to update the workforce estimates. The decline in staff numbers
between SIR 22 and SIR 24 is around 8%. If we apply this rate of
decline to all provider types, we would have a workforce of 230,000 staff
in GFECs and 69,000 staff in other provider types (ITPs, Local
Authorities, Third Sector providers and others).

40/43 Education & Training Foundation
8. CONCLUSIONS
This report provides a descriptive account of the staff working in the FE sector in 2015-16, and where possible draws out comparisons of the workforce across different provider types, with previous years30 and with the school workforce. In addition to the descriptive account of the FE workforce, this year’s report includes some additional analysis looking at the characteristics of senior managers in the sector and how these have evolved over time.
The key findings from our analysis are:
Teachers (including assessors and verifiers) represent close to half of the entire FE workforce. The next biggest occupational group are service staff, followed by administrative and managerial staff (including senior managers and other managers).
Around half of all FE contracts are part-time, a proportion considerably higher than in the general UK workforce which stands at 27%31.
Close to two-thirds of FE staff are female, and this proportion is higher for part-time staff. The proportion of female staff in the FE sector is higher than in the general UK workforce, but lower than in the school workforce where 80% of staff are female
Median pay for full-time staff across all occupational groups in FE colleges is £26,609. Median pay is lower in independent training providers and other providers at £23,500 and 25,694 respectively. Median pay is highest for senior managers and lowest for Service staff across all provider types.
Over half of the staff in the FE sector are over the age of 45, indicating FE continues to be a second career for many. This finding is consistent with other work commissioned by the ETF32 showing that the average age of teacher trainees in FE is 37. The workforce is also predominantly white (86%).
Looking at trends over time, we can see that the FE workforce has been declining over time at an average rate of around 3% per year. Between 2011-12 and 2014-15, the full-time equivalent employees in FE Colleges fell by 12,300 FTEs.
Key findings from our analysis of the teaching staff data are:
Teaching staff are older than other staff (close to 40% of teaching staff are aged 50 or older). The average age of teaching staff in FE is 46 years.
30 Workforce reports for 2014-15 are available here: http://www.et-foundation.co.uk/news/etf-publishes-2014-2015-workforce-data/ 31 ONS UK labour market statistics: March 2017 available here: https://www.ons.gov.uk/employmentandlabourmarket/peopleinwork/employmentandemployeetypes/bulletins/uklabourmarket/mar2017 32 http://www.et-foundation.co.uk/wp-content/uploads/2017/03/ITE-data-report-new-brand.pdf

41/43 Education & Training Foundation
Annual median pay for college teachers is £32,000 and the average is £30,288, much below the average pay of £37,400 for school teachers33.
For the first time in a number of years the SIR captures information on teacher qualifications and continuous professional development (CPD). The data reveals that most teachers (around three quarters) hold a qualification34. The most commonly held teaching qualifications are Postgraduate Certificate of Education (PGCE) covering 32% of teachers, Certificate of Education covering 23% of teachers and Level 5 Diploma in Education and Training covering 11% of teachers.
A third of teachers report main subject area qualifications at QCF Level 6 with another quarter holding main subject area qualifications at QCF Level 7 or higher.
On average, teachers spend 15 hours on CPD although it is worth noting that a majority of teachers (over 60%) report spending no time at all on CPD.
The key differences in findings across provider types are:
Full-time working is considerably more common in independent training providers which are in line with the country average. In colleges more than half of staff are part-timers and in other training providers (including Local Authorities and Third Sector organisations) almost 70% of staff work part-time.
Women represent 63% of college staff, 65% of independent provider staff and 79% of other provider staff.
Independent training providers have the youngest workforce with more than half (ca. 60% of staff) aged under 45. The corresponding proportions are around 50% for colleges and 30% for other providers. The same pattern applies to teaching staff.
Annual median pay for teachers is £32,000 in colleges, £25,389 in independent training providers and £25,505 in other providers.
The key findings from our analysis of the characteristics of senior managers are:
Senior manager numbers have declined in line with the wider FE sector workforce and now account for around 1.4% of the workforce.
Senior managers are older than the general FE workforce with a median age of 51 compared with 46 for teachers and 45 for other staff. The age profile of senior managers has not change over the last four years.
Just over half (55%) of senior managers are women.
The vast majority of senior managers work full-time. This is the 33 https://getintoteaching.education.gov.uk/funding-and-salary/teacher-salaries 34 Around the quarter report holding no relevant teaching qualification

42/43 Education & Training Foundation
case for 93% of male senior managers and 91% of female senior managers. This pattern of working has not changes over the last four years.
Median pay for senior managers is £69,000 and there has been little change in that over the last four years.