future consumer limited · future consumer limited | investor update | q3 fy20 previous 20 next...
TRANSCRIPT

Investor Update | Q3 FY20 / 9M FY20
FUTURE CONSUMER LIMITED
FMC
G 2
.0N
EW R
ECIP
E OF C
ON
SUM
ER D
ELIGH
T

2Previous NextFUTURE CONSUMER LIMITED | INVESTOR UPDATE | Q3 FY20
Safe Harbour Statement
This investor presentation has been prepared by Future Consumer Limited (“FCL”) and does not constitute a prospectus or placementmemorandum or an offer to acquire any securities. This presentation or any other documentation or information (or any part thereof)delivered or supplied should not be deemed to constitute an offer.
No representation or warranty, express or implied is made as to, and no reliance should be placed on, the fairness, accuracy,completeness or correctness of such information or opinions contained herein. The information contained in this presentation is onlycurrent as of its date. Certain statements made in this presentation may not be based on historical information or facts and may be“forward looking statements”, including those relating to the general business plans and strategy of FCL, its future financial condition andgrowth prospects, future developments in its industry and its competitive and regulatory environment, and statements which containwords or phrases such as ‘will’, ‘expected to’, ‘horizons of growth’, ‘strong growth prospects’, etc., or similar expressions or variations ofsuch expressions. These forward-looking statements involve a number of risks, uncertainties and other factors that could cause actualresults, opportunities and growth potential to differ materially from those suggested by the forward-looking statements. These risks anduncertainties include, but are not limited to risks with respect to its hair care, its healthcare business and its skin care business.
FCL may alter, modify or otherwise change in any manner the content of this presentation, without obligation to notify any person of suchrevision or changes. This presentation cannot be copied and disseminated in any manner.


TABLE OF CONTENTS
JOURNEY FROM GOOD TO GREAT
BUSINESS UPDATE
FINANCIAL OVERVIEW
05
09
16

5Previous Next
JOURNEY FROM GOOD TO GREAT CONTINUES….
FOCUS IS ON GOOD GROWTH,
✓ “PROFITABLE” AND “SUSTAINABLE” QUALITY GROWTH
✓ FREE CASH FLOW GENERATION
✓ RETURN ENHANCEMENT

6Previous NextFUTURE CONSUMER LIMITED | INVESTOR UPDATE | Q3 FY20
Journey from “Good to Great”
Focus on higher share of value-add
products
Portfolio optimization with
create, grow & destroy strategy
Correct pricing to offset inflation /
reap market share gain benefit
Consolidation of vendors,
re-negotiating terms
Re-organize supply chain to ensure freshness and
reduce shrinkage/ expiry
Drivers for Sustainable and Profitable Growth along with Journey towards Free Cash
Identified and developed strong partnerships with global category leaders
Namkeens & Sweets Biscuits Personal Care Dairy Healthy Munching
Key Pillars for FMCG 2.0
Multiple CategoriesBrands span across food,home care, personal care, andbeauty
Data ScienceData that drives (almost)every decision and strategicdirection within the company
Integrated Value-chainOwnership of the entire valuechain enables velocity,launch, prototype, destroyand scale
Digital Distribution NetworkModern retail and digitalcommerce as the keydistribution platforms
Scale up of JV partnerships with
global FMCG players
Manufacturing Partnerships JV Partnerships

7Previous NextFUTURE CONSUMER LIMITED | INVESTOR UPDATE | Q3 FY20
Key Levers Driving Profitability and Return Enhancement
• Consolidation of vendor and negotiation of terms
• App based platform AGRIBID to drive Gross Margins s in COP
• Reverse auction of raw materials to drive efficiency in Processed Foods and HPC
Sourcing Efficiencies
• Supply chain reorganization to ensure freshness and reduction in loss / shrinkage
• Value engineering
• Building leaner cost structure
• Optimization of packaging
Costs Leadership
• Key JVs viz. Fonterra and Hain have become operational recently
• Scale up brands under these JVs is expected to boost consolidated profitability
JV Scale Up
• Premiumization of portfolio and mix correction
• Continuously Revisit tail and non-performing Brands
• Correct pricing to offset inflation / reap market share gain benefit
Portfolio Correction
• Cautious Capital Allocation
• Efficient working capital management
• Debt containment
• Value unlocking from assets delivering less than benchmark returns
Right Sizing of Balance
Sheet
Efficiency measures to drive profitability and enhance return profile
Reinforcing Accountability and Responsibility in Organization Design

8Previous NextFUTURE CONSUMER LIMITED | INVESTOR UPDATE | Q3 FY20
How are we Building Efficiencies ?
Pillar Principles
Creation
▪ Strategizing on entering new categories, where we have a distinct FMCG 2.0 voice and a right to win
▪ Creation of New SKUs basis data driven algorithms driven by FCL, Channel and customer priorities
▪ Value Reengineering and Simpler product design for savings in ingredients/ RM costs and PM costs
Operations
▪ Better demand sensing and forecasting
▪ Smart network design of supply chain- to reduce the distance travelled of inventory before it reaches consumer plates and deliver fresh
▪ Stock to cash norms for each SKU
Destruction▪ Rationalization of portfolio across the organization, building the core and continuously
reducing the tail
1
2
3

9Previous NextFUTURE CONSUMER LIMITED | INVESTOR UPDATE | Q3 FY20
Q3 FY20 and 9M FY20: Key Highlights
Key Achievements
- Achieved gross debt reduction of ₹696mn
- Generated positive cash flow post operations and investment of ₹654mn
- Achieved release of ₹315mn working capital during the quarter
- Crossed ₹1bn EBITDA during 9M FY20
- Achieved EBITDA margins of 4%, an expansion of 110 bps YoY
- Reported PAT before share of JV, associate, minority interest of ₹21mn in the quarter
- FMCG veteran Rajnikant Sabnavis joins as CEO effective 01st Jan 2020
Debt Reduction
Free Cash Flow
EBITDA
PAT
Other Key Updates
10Previous NextFUTURE CONSUMER LIMITED | INVESTOR UPDATE | Q3 FY20
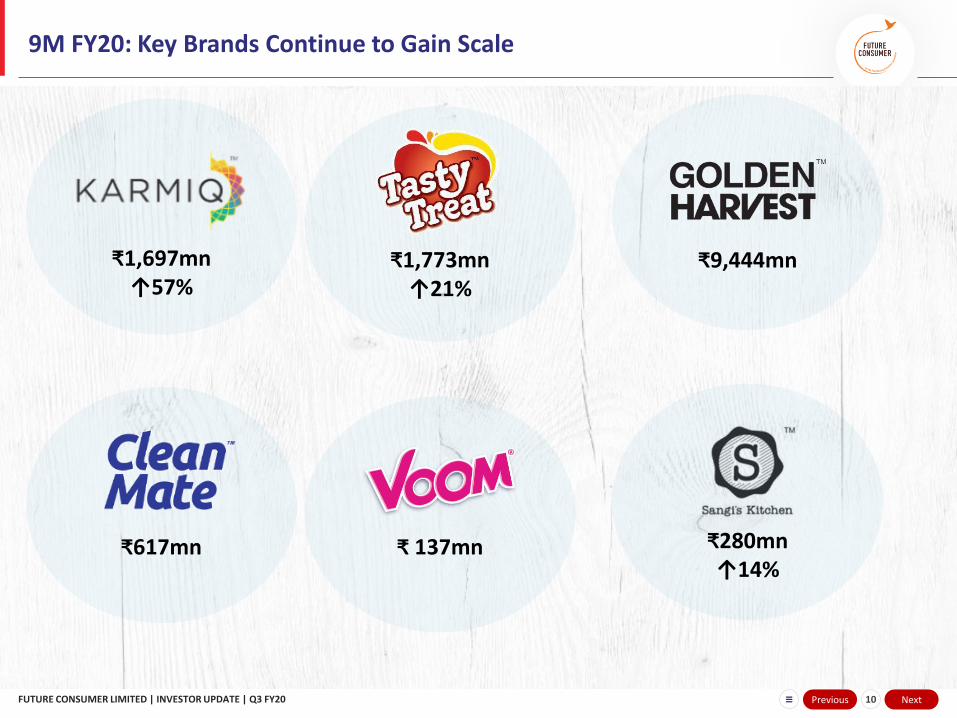
9M FY20: Key Brands Continue to Gain Scale
₹1,773mn↑21%
₹1,697mn↑57%
₹ 137mn
₹9,444mn
₹617mn ₹280mn↑14%

11Previous Next
BUSINESS UPDATE

12Previous NextFUTURE CONSUMER LIMITED | INVESTOR UPDATE | Q3 FY20
Continue to Focus on Mainstream Categories

13Previous NextFUTURE CONSUMER LIMITED | INVESTOR UPDATE | Q3 FY20
Announcement of Online Distribution Tie-up with Amazon
Leading Brands Sold
1st phase of collaboration
• Understanding the language of online distribution
• Optimizing presence and organizing the supply chain
• Preparing for full scale roll-out across key brands leveraging the platform

14Previous NextFUTURE CONSUMER LIMITED | INVESTOR UPDATE | Q3 FY20
Developing the Online Distribution with Amazon
• Initiated implementation of online distribution tie-up with Amazon for FCL’s portfolio of brands
• Largely offline presence of FCL will now extend to millions of customers of Amazon India’s marketplace
• Both the teams to work closely to develop marketing and promotion initiatives
• Amazon’s technical expertise and resources to increase the reach of our brands

15Previous NextFUTURE CONSUMER LIMITED | INVESTOR UPDATE | Q3 FY20
Visibility across Brands on Prime Now Platform with 2 Hours Delivery

16Previous Next
FINANCIAL OVERVIEW

17Previous NextFUTURE CONSUMER LIMITED | INVESTOR UPDATE | Q3 FY20
9M FY20 – Revenue Mix
− COP Foods with ₹2.7bn revenues continues to exhibit strong traction with 48% growth YoY
− Strong secondary sales growth of 19% on YoY basis
− Continued focus on SKU rationalization leading to cash flow generation and return enhancement
Key TakeawaysRevenue (₹ in Mn)
Processed Foods
Center of Plate
Home & Personal Care
Fresh Business
Rural Distribution
Intercompany
Total
(1,258)
808
2,319
8,393
1,979
3,779
14,913
30,933
Particulars
Others
Growth
3%
0%
26%
0.9x
9%
0.9x
2x

18Previous NextFUTURE CONSUMER LIMITED | INVESTOR UPDATE | Q3 FY20
Base Effect and Portfolio Rationalization Initiatives Impacting Sales, Underlying Secondary Sales Growth Continues to Remain Strong
Key Factors
Base Effect:
- Q3 FY19 included a base of ₹395mn in revenues due to 203 SKU launches
Portfolio Rationalization:
- Focus on core brands and categories
- SKU rationalization to clean the tail not delivering desired revenue / return (700 SKU’s rationalized)
Inventory Correction
- Optimization of secondary inventory
~ 649 mn
~ 481mn
>400mn

19Previous NextFUTURE CONSUMER LIMITED | INVESTOR UPDATE | Q3 FY20
Revenue Share across Distribution Channels
LARGE FORMAT CONTINUES TO DOMINATE THE SALES MIX
48%
22%
7%
23%
Channel Wise SalesMix 9M FY20
Large Format Stores
Small Format Stores
Rural Distribution
GT/Institutional/Others

20Previous NextFUTURE CONSUMER LIMITED | INVESTOR UPDATE | Q3 FY20
Focus on Sustainable Growth and Profitability Turnaround
Note: Charts on consolidated basis, Q3 FY20 financials are not comparable prior period on account of IND AS 116, Q3 FY20 Comparable Numbers: EBITDA ₹316mn, EBITDA Margin: 3.4%, EBIT: ₹175mn, EBIT Margin: 1.9%
Focus on expanding margins and achieving higher profitability with higher contribution of value -added products
62
178
291
373
1.1%
2.3%
2.9%
4.0%
0.0 %
0.5 %
1.0 %
1.5 %
2.0 %
2.5 %
3.0 %
3.5 %
4.0 %
4.5 %
0
50
100
150
200
250
300
350
400
Q3 FY17 Q3 FY18 Q3 FY19 Q3 FY20
EBITDA CAGR of 82%
EBITDA EBITDA Margin (%)
5,5167,847
9,912 9,240
Q3 FY17 Q3 FY18 Q3 FY19 Q3 FY20
Revenue CAGR of 19%
-26
72152
193
-0.5%
0.9%
1.5%
2.1%
-1.0%
-0.5%
0.0 %
0.5 %
1.0 %
1.5 %
2.0 %
2.5 %
-50
0
50
100
150
200
250
EBIT & EBIT Margin (%)
EBIT EBIT Margin (%)
-51
5985
35
Q2 FY17 Q2 FY18 Q2 FY19 Q2 FY20
Cash Profit
Q3 FY17 Q3 FY18 Q3 FY19 Q3 FY20Q3 FY17 Q3 FY18 Q3 FY19 Q3 FY20
Decline attributable to loss in JVs
Q3 FY17 Q3 FY18 Q3 FY19 Q3 FY20

21Previous NextFUTURE CONSUMER LIMITED | INVESTOR UPDATE | Q3 FY20
Geared to Achieve Higher Returns
(₹ in Mn, Unless specified otherwise )
Note: Charts on consolidated basis, Q3 FY20 financials are not comparable prior period on account of IND AS 116, Q3 FY20 Comparable Numbers: ROCE 4%, Adjusted ROCE 4.8%, , Fixed Asset Turnover 7x, adjusted ROCE (%) excludes Investments in JVs and Associates
49 51 58
FY 18 FY19 Q3 FY20
Net Working Capital (Days)
5
6 6
FY 18 FY19 Q3 FY20
Net Fixed Asset Turnover (x)
1.4%
3.8%
5.0%
1.6%
4.1%
5.1%
FY 18 FY19 Q3 FY20
ROCE (%), Adjusted ROCE (%)
ROCE (%) Adjusted ROCE (%)
0.57
0.75
0.47
FY 18 FY19 Q3FY20
Net Debt to Equity (x)
FY19FY 18 Q3FY20

22Previous NextFUTURE CONSUMER LIMITED | INVESTOR UPDATE | Q3 FY20
Significant Improvement in Standalone Profitability Metrices
(₹ in Mn, Unless specified otherwise )Profit & Loss A/C (Standalone )
Particulars Q3 FY20 Q2 FY20 Q3 FY19 9MFY20 9MFY19 FY19
Total Income from Operations 6,753 8,780 7,554 23,377 22,107 29,900
Gross Profit 1,053 1,332 1,065 3,585 3,155 4,240
Gross Margin (%) 15.6% 15.2% 14.1% 15.3% 14.3% 14.2%
Operating Cost -691 -920 -790 -2,448 -2,434 -3,220
Other Income 30 33 18 85 95 119
EBITDA 392 445 292 1,223 817 1,139
EBITDA (%) 5.8% 5.1% 3.9% 5.2% 3.7% 3.8%
Depreciation -130 -128 -92 -383 -253 -349
EBIT 262 317 201 840 564 790
EBIT (%) 3.9% 3.6% 2.7% 3.6% 2.6% 2.6%
Net Interest -63 -64 -50 -213 -115 -180
PBT Before Exceptional 199 253 151 626 449 610
Tax -52 -112 0 -220 0 188
PAT Before Exceptional 148 141 151 406 449 798
Exceptional Items 0 0 18 0 -192 -192
PAT 148 141 168 406 257 605
PAT (%) 2.2% 1.6% 2.2% 1.7% 1.2% 2.0%
Cash Profit 298 355 68 920 527 1,160
Q3 FY20 vs Q3 FY19:
− ~150bps expansion in gross margins
− EBITDA jumps 34% as margins reach 5.8% (an improvement of ~190bps)
− Cash Profit of ₹298mn, growth of over 4x on YoY basis
9M FY20 vs 9M FY19:
− Gross Margin expanded by 110bps
− EBITDA increased by 50% with margin expansion of 150bps
− PAT of ₹406mn with 58% growth
− ₹920mn cash profit with 74% growth
− Sales Growth ~ 6%
Note: Q3 / 9M FY20 financials are not comparable prior period on account of IND AS 116

23Previous NextFUTURE CONSUMER LIMITED | INVESTOR UPDATE | Q3 FY20
Consistently Trading the Path towards Profitability
(₹ in Mn, Unless specified otherwise )Profit & Loss A/C (Consolidated )
Particulars Q3 FY20 Q2 FY20 Q3 FY19 9MFY20 9MFY19 FY19
Total Income from Operations 9,240 11,208 9,912 30,933 28,433 38,806
Gross Profit 1,232 1,537 1,323 4,192 3,928 5,246
Gross Margin (%) 13.3% 13.7% 13.3% 13.6% 13.8% 13.5%
Operating Cost -887 -1,147 -1,052 -3,098 -3,207 -4,238
Other Income 28 34 20 84 107 147
EBITDA 373 424 291 1,178 827 1,154
EBITDA(%) 4.0% 3.8% 2.9% 3.8% 2.9% 3.0%
Depreciation -179 -178 -139 -536 -389 -532
EBIT 193 246 152 642 439 623
EBIT (%) 2.1% 2.2% 1.5% 2.1% 1.5% 1.6%
Net Interest -186 -185 -147 -572 -391 -568
PBT Before Exceptional 7 61 5 70 48 55
Tax 14 -113 -5 -163 -15 166
Profit/(Loss) After Tax 21 -52 1 -93 33 221
Share of Profit/(Loss) in Asso. & JVs & MI -111 -114 -55 -312 -176 -287
Exceptional Items 0 0 2 0 2 2
Consolidated PAT -90 -166 -52 -405 -141 -64
Consolidated Cash Profit 35 88 85 178 245 548
Q3 FY20 vs Q3 FY19:
− EBITDA jumps 28% as margins cross 4% (expansion of 110bps)
− PAT of ₹21mn before exceptional items in Q3 FY20 vs ₹1mn for Q3 FY19
− Share of Profit/(Loss) in Asso. & JVs & MI increased due to production delays on Hain and Fonterra
9M FY20 vs 9M FY19:
− Crossed ₹1bn EBITDA in 9MFY20 (42% increase yoy) largely driven by operating cost decline of 80 bps on comparable basis
− PBT before exceptional grew by 48% to ₹70mn
− Sales Growth ~ 9%
Note: Q3 FY20 financials are not comparable prior period on account of IND AS 116

24Previous NextFUTURE CONSUMER LIMITED | INVESTOR UPDATE | Q3 FY20
PAT Bridge – Q3 FY20 Standalone to Q3 FY20 Consolidated
Standalone PAT (-) Loss fromSubsidiaries
(-) Loss fromFonterra
(-) Loss from Hain (-) Other JVs andOther Impacts
Consolidated PAT
-29 -92 -112
-90148 -176 -63 -20
-90
20
(₹ in Mn, Unless specified otherwise )

25Previous NextFUTURE CONSUMER LIMITED | INVESTOR UPDATE | Q3 FY20
Impact of IND AS 116 Accounting (Blended Approach)
StandaloneConsolidated
Particulars Q3 FY20 IND AS 116 Q3 FY20 Q3 FY20 IND AS 116 Q3 FY20
Comparable Adjustment Reported Comparable Adjustment Reported
Revenue from Operations 9,240 - 9,240 6,753 - 6,753
Other Income 27 +1 28 30 - 30
COGS -8,008 - -8,008 -5,700 - -5,700
Rent & Other Operating Expenses -943 +56 -887 -741 +50 -691
EBITDA 316 +57 373 342 +50 392
Finance Cost -165 -21 -186 -45 -18 -63
Depreciation & Amortisation -141 -38 -179 -91 -39 -130
PBT 10 -3 7 206 -7 199
PAT -87 -3 -90 155 -7 148

26Previous NextFUTURE CONSUMER LIMITED | INVESTOR UPDATE | Q3 FY20
Capitalization of Balance Sheet Leading to Improvement in Leverage Ratios
(₹ in Mn, Unless specified otherwise )
ParticularsAs on
31-Dec-19 30-Sep-19 31-Mar-19
Shareholder's Fund 12,273 12,397 9,902
Minority Interest -29 -27 -24
Gross Debt 6,225 6,920 8,137
Less: Cash and Cash Equivalents 649 929 684
Net Debt 5,576 5,991 7,453
Lease Liabilities and debt component of CCDs 958 944
Less: Investment in JVs -1,344 -1,433 -1,415
Net Adjusted Capital Employed 17,435 17,872 15,916
Fixed Assets 6,160 6,213 6,194
Right to Use Assets 681 709
Goodwill and Intangibles 3,449 3,491 3,567
Increase in Net Current Assets 7,145 7,459 6,156
Total Net Assets 17,435 17,872 15,916
Balance Sheet (Consolidated )
− During Q3 FY20, achieved net working capital release of ₹315mn
− Net Debt Reduction in Q3 ₹415mn
− Capitalization of balance sheet leading to net debt reduction of ₹1,912mn
− Overall cash flow inflow of ₹2,975mn on account of CCDs and upfront payment for warrants
− Net debt / equity improved from 0.75x at Mar’19 to 0.47x in Dec’19 on comparable basis
Note: Balance Sheet for period ending Dec’19 and Sep’19 are not comparable with that of Mar’19 on account of IND AS 116

27Previous NextFUTURE CONSUMER LIMITED | INVESTOR UPDATE | Q3 FY20
Shareholder Information
45.27%
19.09%
35.64%
Shareholding Pattern (%)
Promoters Institutional Others
0
500
1,000
1,500
2,000
Apr-14 Dec-14 Aug-15 Apr-16 Dec-16 Aug-17 Apr-18 Dec-18 Aug-19
FCONSUMER FMCG Index Sensex
Stock Data (As on 30tTH JAN 2020)
Market Capitalization (₹) 44,858 Mn
Shares Outstanding ~192 Mn
Free Float 55%
Symbol (NSE/ BSE) FCONSUMER / 533400
Particulars OS (%)
Proterra 7.32
Verlinvest 7.80
Arisaig 6.72
IFC 5.25
Key Holders (As on 31th December 2019)Stock Chart (1st April 2014 – 30th Jan 2020)
While the FMCG Index grew at a CAGR of 9% during the period 1st April 2014 to 30th Jan 2020, FCL Market Cap grew at a CAGR of 31% over the same time period
CAGR of 31%
Sensex CAGR of 11%
FMCG CAGR of 9%
Note: CAGR is calculated using XIRR, Free Float calculated by excluding promoter group shareholding
(As on 31st December 2019)
Note: Shareholding is calculated on diluted basis
Particulars Oct-19 Nov-19 Dec-19
Volume in mn 11 15 12
Delivery % 48% 46% 53%Note: Shareholding classification as per Stock Exchange

Thank You
Registered Office:Future Consumer LimitedKnowledge House, Shyam Nagar Off JVLR,Jogeshwari(East), Mumbai 400 060Tel: +91 22 6644 2200
Web: www.futureconsumer.in Incase if any queries please contact: [email protected]
Corporate Office:Future Consumer LimitedEmbassy 247, Tower ‘C’, LBS Marg,Vikhroli (West), Mumbai 400 083 Tel: +91 22 6119 0000