future leaders recruitment report rekrutacja
TRANSCRIPT

Future leaders Promotion & Recruitment report
March 2015
* In this report you can find information about results of March
promotion and recruitment of AIESEC in Poland

Dear AIESEC in Poland,
With huge pleasure, we would like to inform you about results of March
2015 promotion and recruitment in AIESEC in Poland – our third Future
Leaders Recruitment. As members of AIESEC we spent a lot of time in
preparation to this process, we were promoting FL for long hours,
preparing a lot of assessement sheets, providing knowledge about
this process to LCs, but now we should be proud that we gave an
opportunity to so many young people who want to be part of our
amazing organization and achieve with us 3582 exchanges.
We want to thank all LCVP TMs and LCVP Marketings for your work,
engagement and effort during these intense months of preparation
and work. We are really proud of you !
Yours,
Ola & Kacper
National Recruitment Coordinator & Future Leaders Brand Manager

This Report containS Information About* :
Recruitment process
Result of FL campaign
Internal recruitment

OVERALL RESULTS
We achieved
98,5 % plans nationally of
recruitment new members
Further information on next pages

OVERALL RESULTS
We had 1296 applications
We allocated 671 new members, including 4 returnees
We allocated 214 TMP-TMPs
General we allocated
889 people

PROMOTION

National campaign & operations report

Task Force operations
Participants:
Designer: Małgorzata Pompka, LC Kraków
Copywriter: Paulina Pierzyńska, LC Poznań
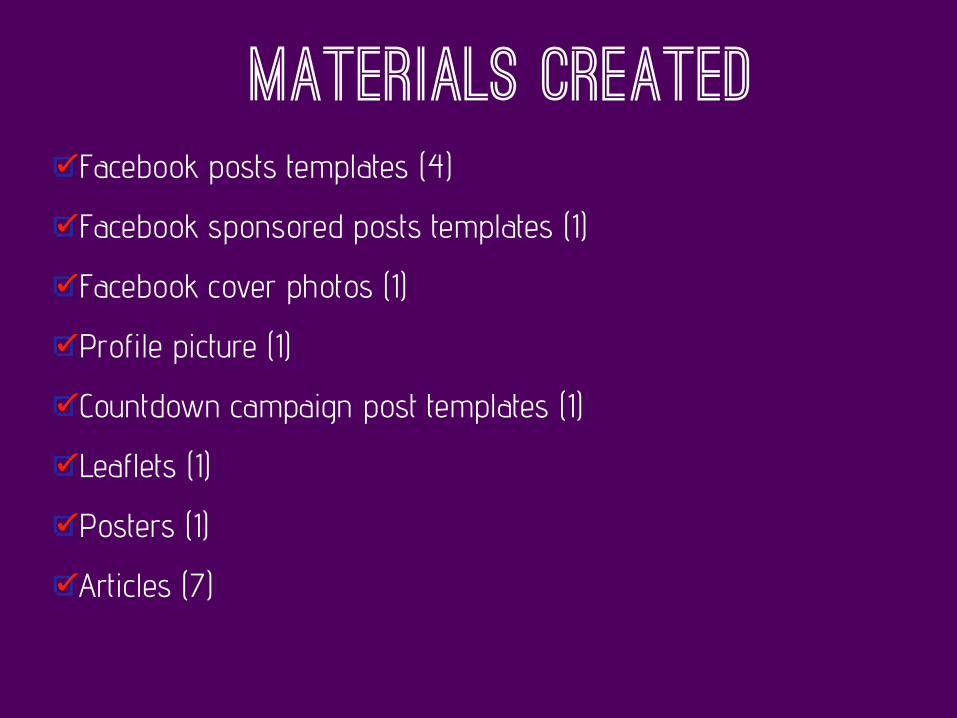
Materials created Facebook posts templates (4)
Facebook sponsored posts templates (1)
Facebook cover photos (1)
Profile picture (1)
Countdown campaign post templates (1)
Leaflets (1)
Posters (1)
Articles (7)

Message of the campaign
Z nami możesz więcej!
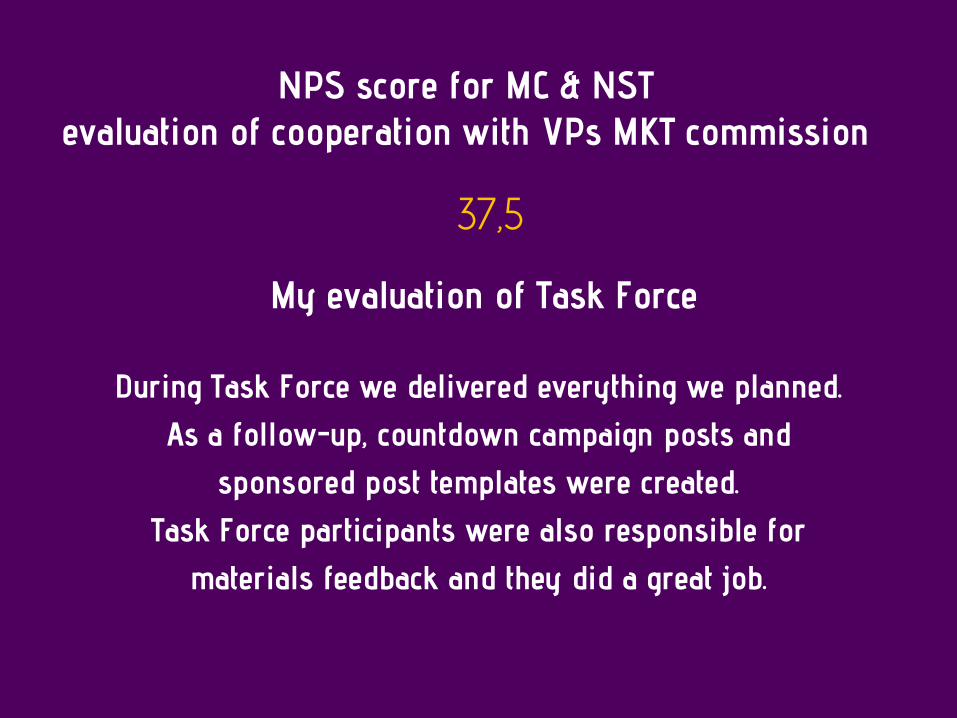
NPS score for MC & NST evaluation of cooperation with VPs MKT commission
37,5
My evaluation of Task Force
During Task Force we delivered everything we planned. As a follow-up, countdown campaign posts and
sponsored post templates were created. Task Force participants were also responsible for
materials feedback and they did a great job.

Results analysis

Performance analysis (compare results in tables & on charts)
October:
March:
App/eRecruiter eRecruiter/Landing Page App/Landing Page (overall CR)
Conversion Rates

March:

October:

March:

October:

March:

October:
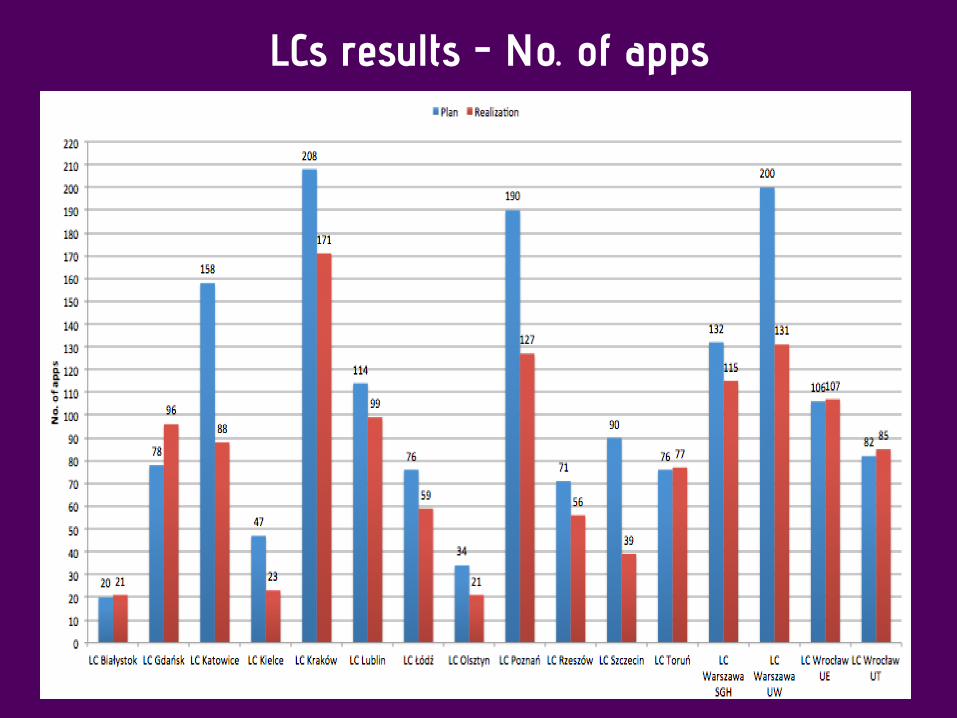
LCs results - No. of apps

LCs results-% of plan realization

LCs results Conversion Rates (CR) at different stages of application process

LCs results eRecruiter opens, Landing Page views and achieved apps result

LCs results Note that:
LC Warszawa UW and LC Olsztyn did not fill in the Landing Page views from their channels (LC Olsztyn did not use bit.ly to collect the data) - I calculated it as averave number, basing on national performance. That’s wht their Landing Page views statistics may be different from the real ones LC Wrocław UE, LC Wrocław UT, LC Poznań, LC Katowice and LC Warszawa SGH did not use landing page/stopper using landing page/promoted both landing page and eRecruiter links directly - so their data is probably not accurate.
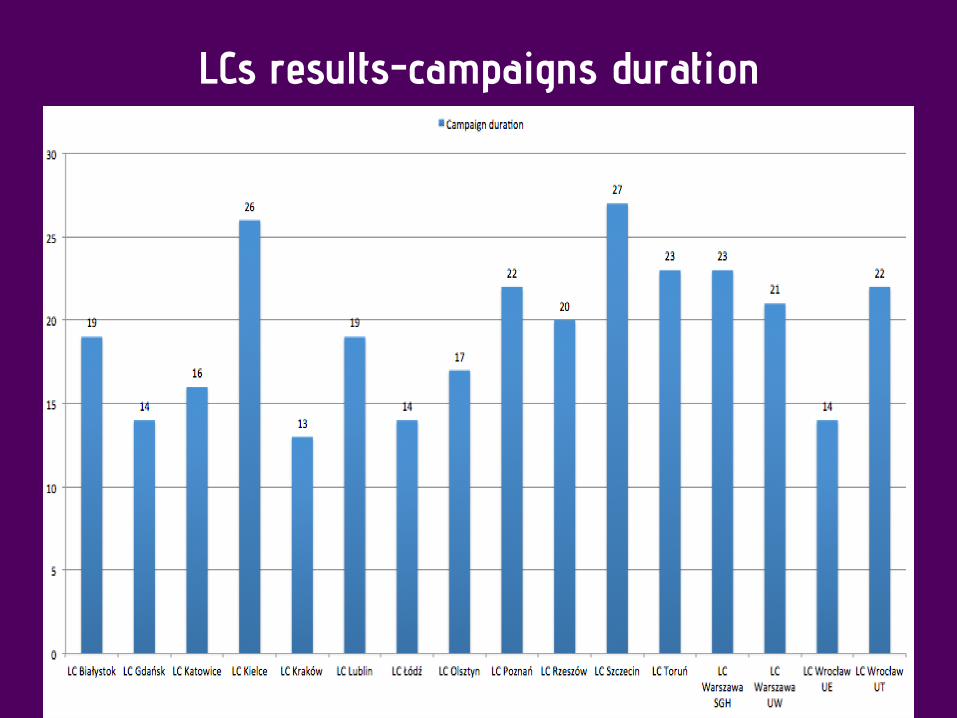
LCs results-campaigns duration

LCs results campaigns efficiency (average apps per day)

LCs results online & offline activities costs

Conclusions
LCs results: My only conclusion is - we can predict (and as an effect. plan) the traffic we need to generate fo get planned number of applications. If you do not have results - you need to improve the traffic on your channels, there is no other way to get resulst! As there was no exception from this rule (and conversions can confirm that) - you can plan it in advance (plan shares by your members, posts on your local FP etc.) to generate traffic. LCs online performance reflects overall performance.

National performance
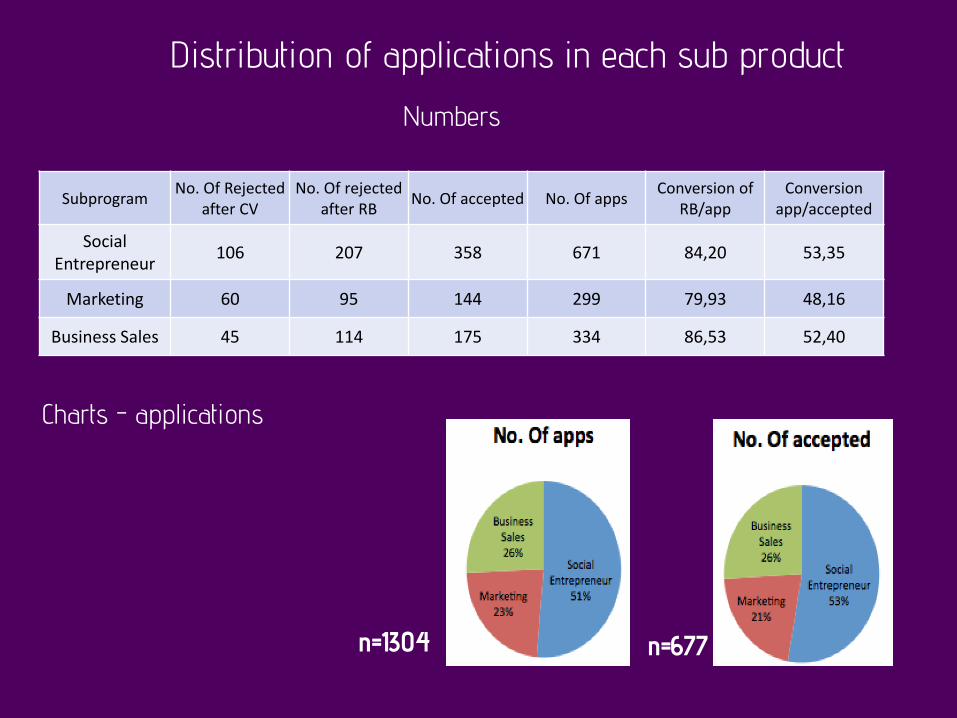
Distribution of applications in each sub product
Subprogram No. Of Rejected
after CV
No. Of rejected after RB
No. Of accepted No. Of apps Conversion of
RB/app
Conversion app/accepted
Social Entrepreneur
106 207 358 671 84,20 53,35
Marketing 60 95 144 299 79,93 48,16
Business Sales 45 114 175 334 86,53 52,40
Numbers
Charts - applications
n=1304 n=677

Targeting in each sub product
These charts give you a clue about proper targeting and communication of our subproducts. As LCs have different approach towards rejecting candidates after the application (only age is the common factor when rejecting candidates) wa cannot draw valuable conclusions about targeting nationally. In case the share of rejected after the RB is big, then we can do better with communique of the subproduct (in all 3 subproducts; we should focus on a way of communicating what each subproduct is, focus on its uniqueness) to get more candidates from ‚Rejected after RB’ to accepted.
n=671 n=299
n=334

Charts - conversions
As previously said, wa can’t draw proper conclusions from app/RB conversion charts due to differences in recruitment process in LCs. Most of apps we had from SE sub product, which also had the best conversion rates in terms of the no. of people who past RB/no. of application (second chart) It means we did a better job in terms of targeting the talents of SE than we did in other two sub products. The worst conversions we had in Marketing subproduct - as we need a lot of Marketing talent, we should approach these people in a different way as targeting, promotion channels and communique of the subproduct needs improvement.
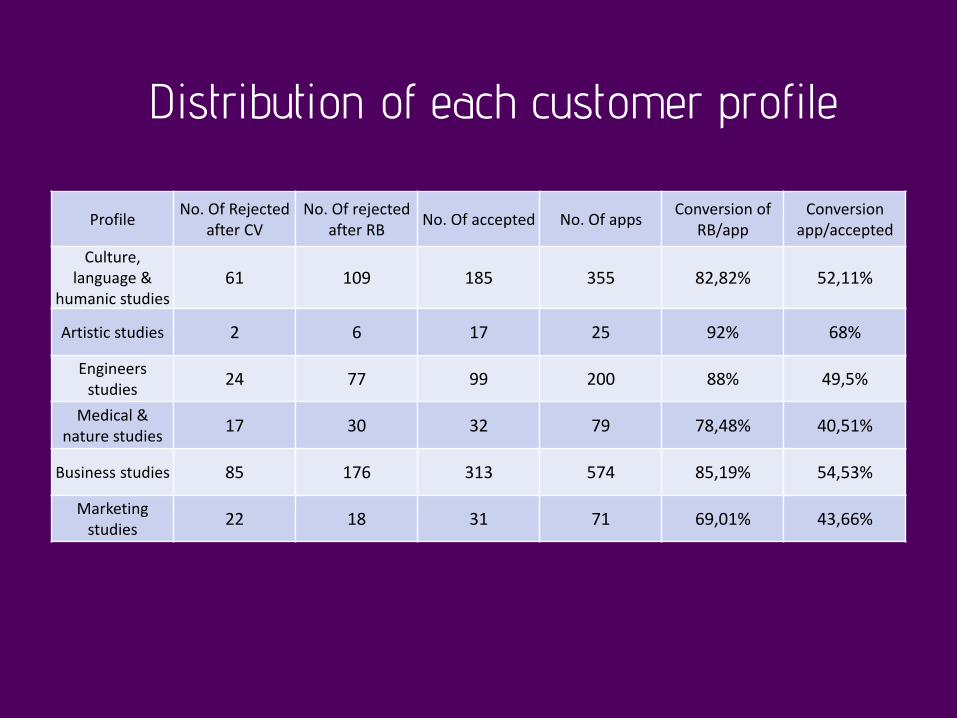
Distribution of each customer profile
Profile No. Of Rejected
after CV
No. Of rejected after RB
No. Of accepted No. Of apps Conversion of
RB/app
Conversion app/accepted
Culture, language &
humanic studies 61 109 185 355 82,82% 52,11%
Artistic studies 2 6 17 25 92% 68%
Engineers studies
24 77 99 200 88% 49,5%
Medical & nature studies
17 30 32 79 78,48% 40,51%
Business studies 85 176 313 574 85,19% 54,53%
Marketing studies
22 18 31 71 69,01% 43,66%
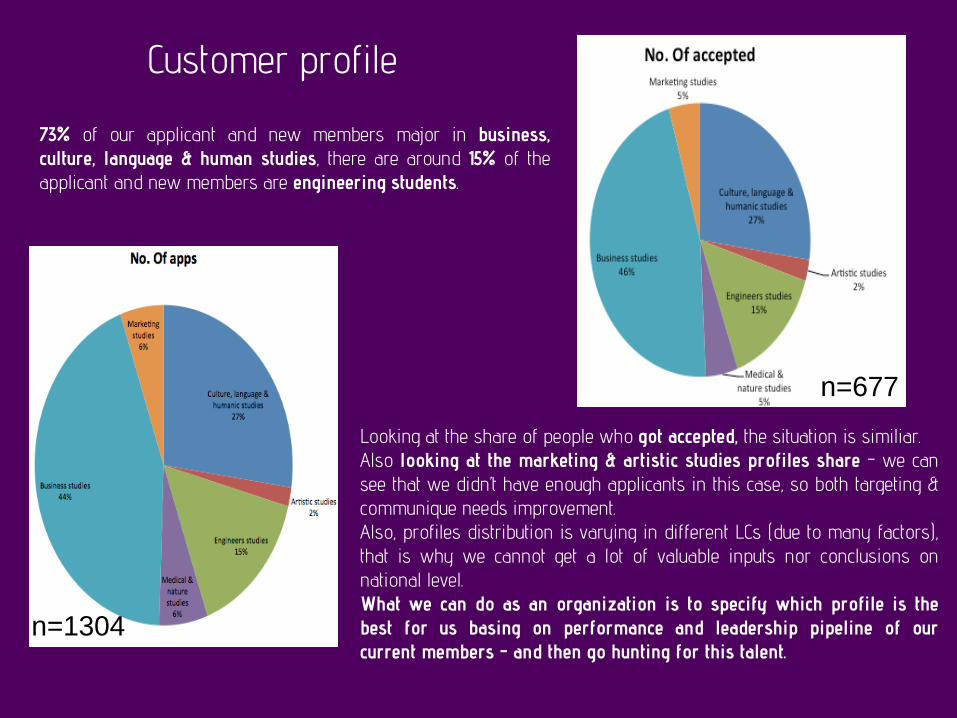
Customer profile
73% of our applicant and new members major in business, culture, language & human studies, there are around 15% of the applicant and new members are engineering students.
Looking at the share of people who got accepted, the situation is similiar. Also looking at the marketing & artistic studies profiles share - we can see that we didn’t have enough applicants in this case, so both targeting & communique needs improvement. Also, profiles distribution is varying in different LCs (due to many factors), that is why we cannot get a lot of valuable inputs nor conclusions on national level. What we can do as an organization is to specify which profile is the best for us basing on performance and leadership pipeline of our current members - and then go hunting for this talent.
n=1304
n=677
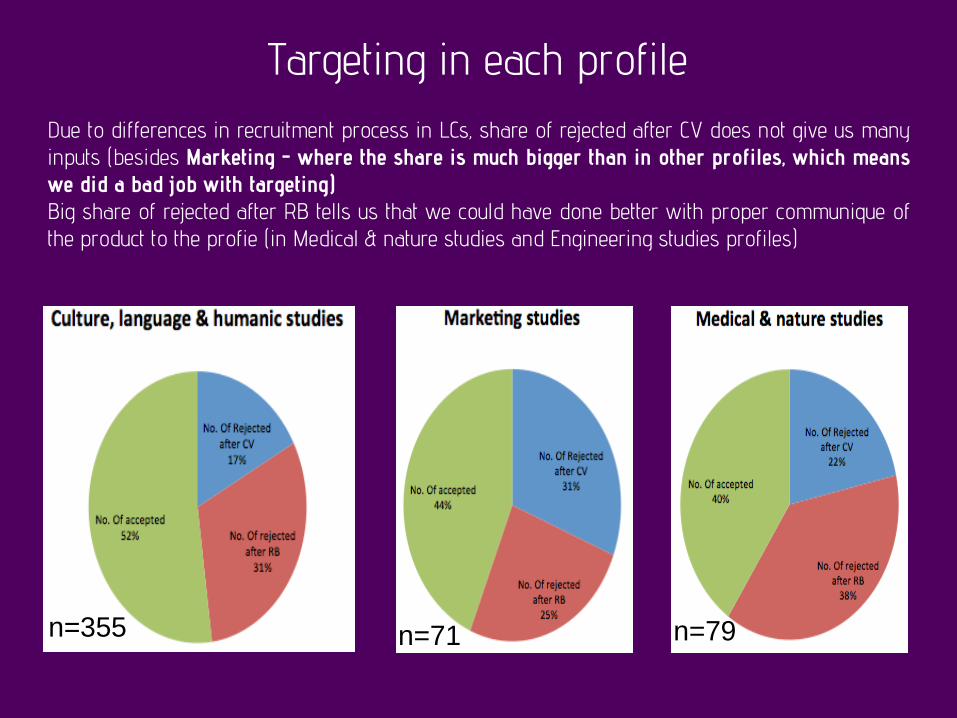
Due to differences in recruitment process in LCs, share of rejected after CV does not give us many inputs (besides Marketing - where the share is much bigger than in other profiles, which means we did a bad job with targeting) Big share of rejected after RB tells us that we could have done better with proper communique of the product to the profie (in Medical & nature studies and Engineering studies profiles)
Targeting in each profile
n=355 n=71 n=79
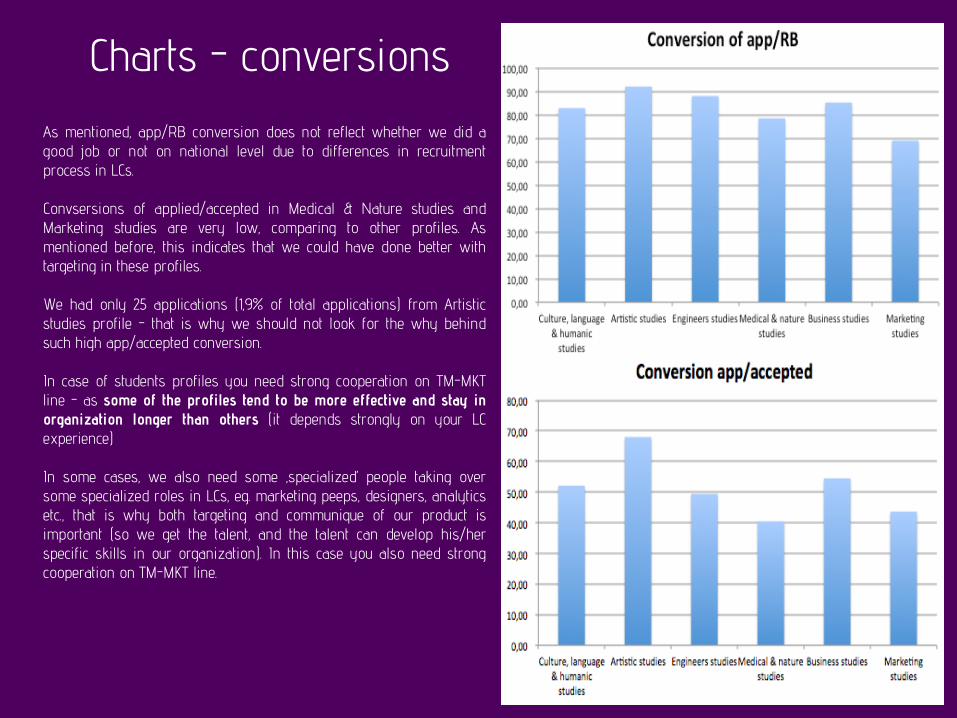
Charts - conversions As mentioned, app/RB conversion does not reflect whether we did a good job or not on national level due to differences in recruitment process in LCs. Convsersions of applied/accepted in Medical & Nature studies and Marketing studies are very low, comparing to other profiles. As mentioned before, this indicates that we could have done better with targeting in these profiles. We had only 25 applications (1,9% of total applications) from Artistic studies profile - that is why we should not look for the why behind such high app/accepted conversion. In case of students profiles you need strong cooperation on TM-MKT line - as some of the profiles tend to be more effective and stay in organization longer than others (it depends strongly on your LC experience) In some cases, we also need some ‚specialized’ people taking over some specialized roles in LCs, eg. marketing peeps, designers, analytics etc., that is why both targeting and communique of our product is important (so we get the talent, and the talent can develop his/her specific skills in our organization). In this case you also need strong cooperation on TM-MKT line.

Distribution of customer age
Age
No. Of Rejected after
CV
No. Of rejected after
RB
No. Of accepted
No. Of apps Conversion of
RB/app
Conversion app/accepted
Share of apps
>18 1 9 9 19 94,74% 47,37% 1,45%
18<x<19 2 18 9 29 93,10% 31,03% 2,21%
19<x<20 37 104 221 362 89,78% 61,05% 27,59%
20<x<21 31 96 191 318 90,25% 60,06% 24,24%
21<x<22 27 73 115 215 87,44% 53,49% 16,39%
22<x<23 30 60 67 157 80,89% 42,68% 11,97%
23<x<24 31 39 43 113 72,57% 38,05% 8,61%
24<x<25 22 14 16 52 57,69% 30,77% 3,96%
25<x<26 39 3 5 47 17,02% 10,64% 3,58%

Charts - conversions There are not many conclusions here. Besides the fact that basing on organizational needs - the younger people we have, the better it is for the organization Please remember the primary targets will be 1st or 2nd year student, who will be more likely to continue in the organization. In some cases we tend to recruit a bit older talent (3rd, 4th year of studies) for specific position or specific area in the LC. This is understandablec and is probably the why behind such high conversions in 21<x<22 and 22<x<23 groups of age.

Distribution of each channel Channel
No. Of Rejected after CV
No. Of rejected after RB
No. Of accepted No. Of apps Conversion of
RB/app
Conversion app/accepted
Fanpage AIESEC 33 68 83 184 82,07% 45,11%
FB groups 42 75 64 181 76,80% 35,36%
AIESEC Website 14 23 38 75 81,33% 50,67%
Posters 8 6 15 29 72,41% 51,72%
Leaflets 5 12 16 33 84,85% 48,48%
Radio 1 2 2 5 80,00% 40,00%
Press 1 0 1 100,00% 0,00%
Friend from AIESEC
61 140 304 505 87,92% 60,20%
Friend not from AIESEC
22 31 69 122 81,97% 56,56%
Event organized by AIESEC
7 9 22 38 81,58% 57,89%
AIESEC University/AIES
EC Native School
2 7 6 15 86,67% 40,00%
Other 12 35 38 85 85,88% 44,71%
GC/GT 4 7 20 31 87,10% 64,52%

Promotion channels 39% of applicants G2K about us from their friends in AIESEC. All online channels brouhgt us as many as 34% of all applications. This gives us 73% of all applicants.
Looking at the share of people accepted - it is similiar. 73% of all accepted people G2K about us from online channels and friends from AIESEC.
n=677
n=1304

Channel effectiveness
These 2 charts show us how efficient our channels were. First two are Facebook - fanpage & FB groups. Fanpage is a good channel for promotion. We did reach proper target with it (only 18% of rejected apps after application review). Share of applicants who were rejected after RB was big though - which means we need to improve communication on local fanpages. FB groups has big share of applications. Although a lot of people were rejected after RB - which means the communication was poor. In many cases people shared Future Leaders landing page directly. Recommendation for future is to share content from local fanpages (together with graphics) to make it more attractive and increase the reach of your fanpage.
n=184
n=181

Channel effectiveness
Website - a lot of people went through the website. As previously, the communication there was good as we can see on the chart. We also reached proper target, but we can work more on communication (as the share of people who got rejected after RB is big). Event proved to be very effective. Recommendation is to organize events to attract applicants with specific skills we need (eg. IT, marketing). Press - we had 1 applicant who marked ‚Press’ as the channel he/she G2K about Future Leaders (and the person didn’t eventually get accepted). It means that it is a channel to be explored.
n=75
n=1 n=38

Channel effectiveness Friends from AIESEC - the channel had the biggest share of applications and turned out to be the best one overall. It is important to internally educate members about the product. Still, I think we should aim to get at least 80% conversion from this channel. GT/GC - we had only 31. It has the best accepted/applied conversion of all channels we used - so we need to explore cooperation with LCVPs OGX (Integrateg Experience) more to get more applicants. Friends not from AIESEC provided us with a lot of valuable applicants - which is a surprise. This means that Future Leaders is getting more and more recognizable.
n=505
n=122 n=31

Channel effectiveness
Posters, leaslets - they have good conversions, but are not providing us with enough applicants. AIESEC University/AIESEC Native School - people who tahe part in these projects are generally a god target, so small share of applicants is a surprise and a thing to develop during the next campaigns. Radio - we had only 5 applicants, no conclusions.
n=15
n=29 n=33
n=5

Charts - conversions Friends from AIESEC provides us with the greatest amount of applications and with huge accepted/app ratio - which gives us the conclusion that education of our members is crucial. Also, targeting and building proper communication is important (see conversions of FB groups - many people applied and invited for RB but eventually not accepted in comparison of Fanpage - not as many people got invited for RB but way more people got accepted). Although, both need further development to reach at least 50%. GC/GT people are also a good investment, although we did not have many applicants from GC/GT. Development of IxP can provide us with many valuable members, so we need to develop this channel. Use of AIESEC University/AIESEC Native School participants is also a way to get more valuable applicants, so in the next campaign we can think about that. FB groups - this channel has a big share of applicants and very low conversions. LCs can analyze content posted/shared during their campaigns and make a good use of this channel during the next campaign as well.

Distribution of customer motivation
Motivation No. Of Rejected
after CV
No. Of rejected after RB
No. Of accepted No. Of apps Conversion of
RB/app
Conversion app/accepted
Teamwork 6 24 28 58 89,66% 48,28%
Self-development
84 186 313 583 85,59% 53,69%
Professional Experience
45 77 111 233 80,69% 47,64%
International Experience
48 83 159 290 83,45% 54,83%
I have lots of free time
4 8 8 20 80,00% 40,00%
Meet new people
24 38 58 120 80,00% 48,33%

Customer motivation 45% of applicants did so for self-development, which is the biggest share of customer motivation. Getting Professional Experience and International Experience gained respectively 18% and 22% of applicants.
This means two things. First is that now we have to provide them with the experience they applied for ;-) and another thing is that during future campaigns we can emphasise these more, to reach more valuable applicants. Suprise is that only 4% of people applied to gain team work experience - which is one of our unique values as an organization. In the future we also should emphasise it more.
n=1304
n=677

Motivation vs. success Generally, we can see that candidates with expectations matching uniqueness of AIESEC are more likely accepted. Motivation of candidates can give us a view on why they apply vs. what we, as an organization, can provide to them. Big shares of people rejected after RB can lead to a conclusion, that we cannot meet their expectations. Although, knowing market expectations now, we can emphasise more the things we do provide as an organization. n=290 n=233
n=58 n=583 n=20 n=120
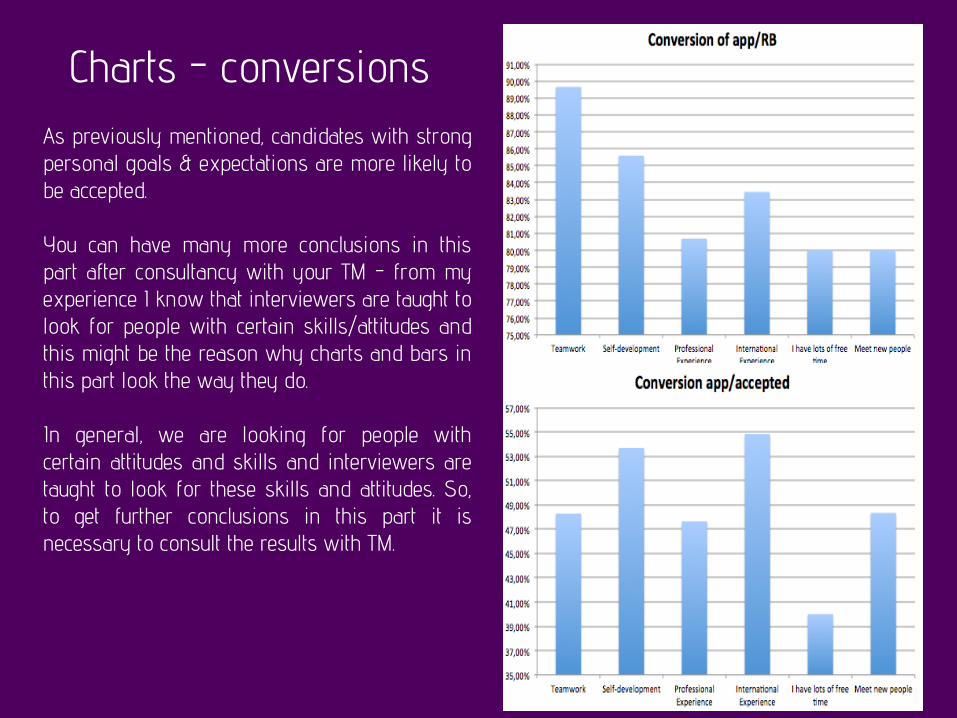
Charts - conversions As previously mentioned, candidates with strong personal goals & expectations are more likely to be accepted. You can have many more conclusions in this part after consultancy with your TM - from my experience I know that interviewers are taught to look for people with certain skills/attitudes and this might be the reason why charts and bars in this part look the way they do. In general, we are looking for people with certain attitudes and skills and interviewers are taught to look for these skills and attitudes. So, to get further conclusions in this part it is necessary to consult the results with TM.

Notifications The data in the analysis may be slightly
different from data in Recruitment Report released by NST Recruitment. Overally we got
1306 applications, and in the part with customer analysis we analyzed 1304
applications.
Overall error is only 0,15%.

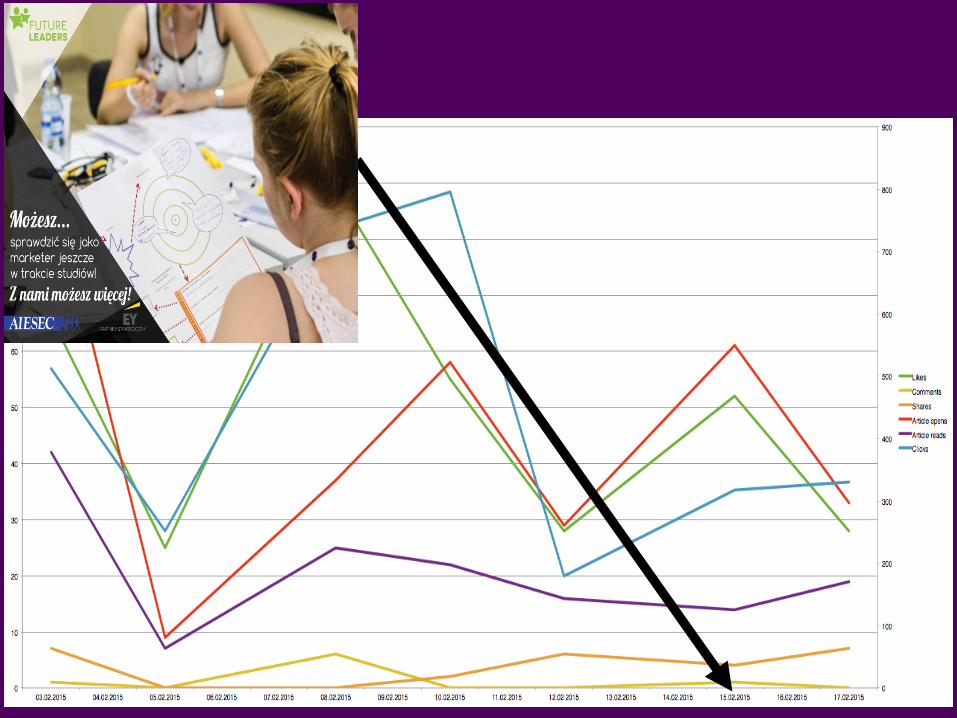
National campaign results
FB campaign results are presented here

National campaign on chart


Conclusions

Conclusions
Poor Comms education about Content Marketing
(and generally their poor preparation) due to:
Term shift
Lack of structures to support Comms
Generally lack of support to Comms
Lack of proper planning before the campaign
Comms tracking by NST (lack of setting clear goals and expectations)
Promotion timeline (during exam sessions period)

Conclusions We can predict (and as an effect. plan) the traffic we need to generate to get planned number of applications. If you do not have results - you need to improve the traffic on your channels, there is no other way to get resulst! As there was no exception from this rule (and conversions can confirm that) - you can plan it in advance (plan shares by your members, posts on your local FP etc.) to generate traffic. LCs online performance reflects overall performance. I cannot believe that only 9% of people who clicked on Landing Page applied for Future Leaders. I do not think there is something wrong with the product, butmarket is changing. We should ask external environment about what it needs - so we can provide it as an organization. Drops in GC and GT reflect that too. Why don’t we ask them? :D

RECRUITMENT

We achieved 98,5% of recruitment plans and 7 LCs achieved more than 100% (Gdańsk, Lublin, Łódź, Olsztyn, Toruń, Warszawa
UW, Wrocław UE). Only LC Szczecin achieved less than 70% of what
they planned.
94%
109% 97%
70%
95%
123% 114%
105%
72% 80%
60%
115%
97%
163%
106%
80%
% of recruitment plans achieved

ALLocation Plans vs Realization
0
20
40
60
80
100
120
Plan
Realization

Allocation Results per Future Leaders sub-program
94%
101% 101%
90%
92%
94%
96%
98%
100%
102%
Social Enter… Marketing Business Sales
Still we had the worst results in Social Entrepreneur sub-program, but in Business Sales and Marketing we achieved more
than 100% of our plans

We allocated in AIESEC 889 members.
70% female 30% male.
LC Łódź & Olsztyn allocated less than 20% of men
Only LC Szczecin allocated almost equally of
women and men
63% 66% 71% 59%
77% 77% 78% 84%
70% 72,50%
48% 62%
73% 79% 70% 75%
37% 34% 29% 41%
23% 23% 12% 16%
30% 28%
52% 38%
27% 21% 30% 25%
Women Men

Recruitment and allocation
To recruit 675 people
(new members + returnees)
we needed 325 members.
Most of the members was allocated
to
Social Enterprenuer program

Only 7 LCs haven’t had skip yet
( 43%) Rest LCs noted
1-4 skips till 25th March 2015
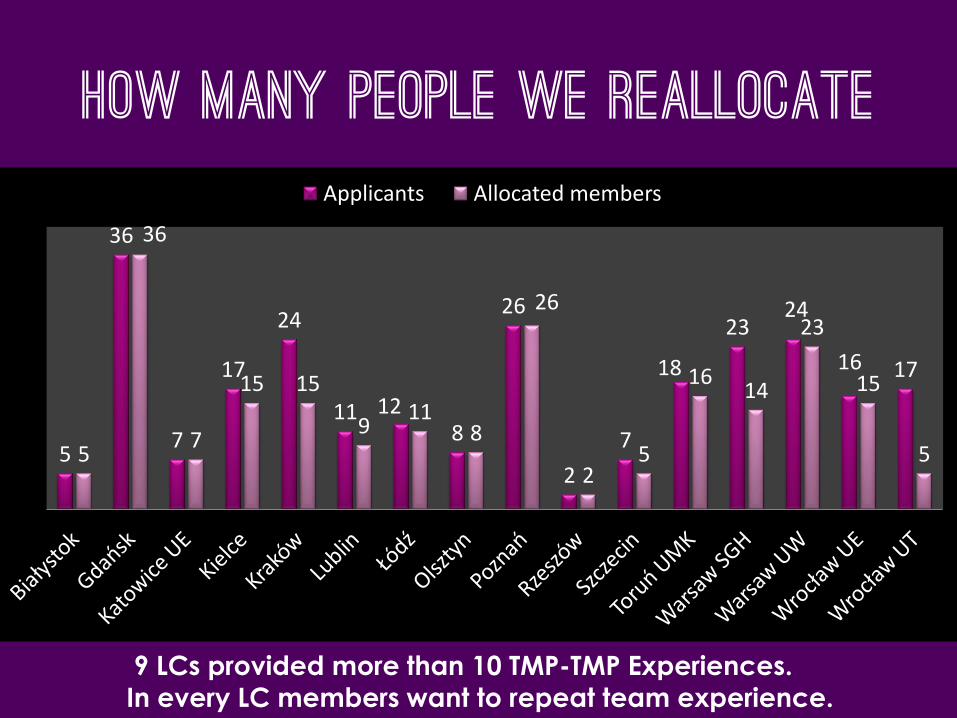
How Many people We Reallocate
5
36
7
17
24
11 12 8
26
2
7
18
23 24
16 17
5
36
7
15 15
9 11
8
26
2 5
16 14
23
15
5
Applicants Allocated members
9 LCs provided more than 10 TMP-TMP Experiences.
In every LC members want to repeat team experience.

Relation of new members to reallocation in recruitment
11
42
65
16
78 61
30 13
41 30 25
39 52
78
52 38
5
35 7
15
15
9
11
8
24
2 5
20
17
23
14
5
New Members Reallocation
We can notice that we based most on new members during recruitment

How Many returnees we recruited
0 0 0 0 0 0 0
1
5
2
0 0 0 0 0 0 0 0 0 0 0 0 0
1 1
2
0 0 0 0 0 0
Applicants Allocated returnees
Only 4 LCs provided Integrated Experience.
We didn’t conduct recruitment process for people who were on GT and GC
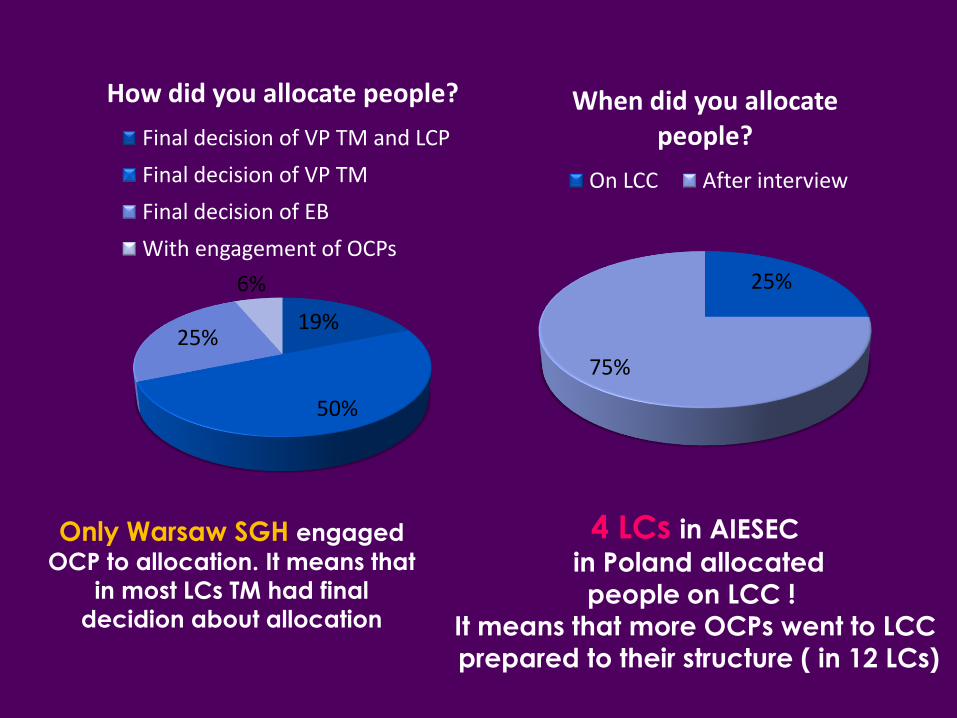
25%
75%
When did you allocate people?
On LCC After interview
4 LCs in AIESEC
in Poland allocated people on LCC !
It means that more OCPs went to LCC
prepared to their structure ( in 12 LCs)
19%
50%
25%
6%
How did you allocate people?
Final decision of VP TM and LCP
Final decision of VP TM
Final decision of EB
With engagement of OCPs
Only Warsaw SGH engaged
OCP to allocation. It means that
in most LCs TM had final
decidion about allocation

35%
65%
How long was Group Exercise?
30 min 30 min-60 min
23%
71%
6%
How long was average interview?
Less than 45 min 45 min- 1h 1h -1,5h
In every
LC Group Exercise lastsed
less than one hour
Most of LCs conducted interviews
less than one hour ! (In 77% LCs RBs lasted less than 45min
and 45 min-1 hour)
It means that whole recruitment process was well-planned
and materials created by MC helped LCs running recruitment.

Preparation to Recruitment
16
4 2 2
Training Simulation Webinar Others
How did you prepare people to recruitment process?
No of LCs which use each materials
11 10
15
3
12
2
What materials did you use during recruitment process?
No of LCs which use each materials
Every LCs organized training for assessors and
Only 4 LCs tried to prepare them in practice way.
During recruitment in most of cases used materials prepared by MC

How many people RESignED AFTER EACH ELEMENTS OF RECRiUTMENT PROCESS
0
10
20
30
40
50
60
70
Bia
łyst
ok
Gd
ańsk
Kat
ow
ice
UE
Kie
lce
Kra
ków
Lub
lin
Łód
ź
Ols
ztyn
Pozn
ań
Rze
szó
w
Szcz
ecin
Toru
ń U
MK
War
saw
SG
H
War
saw
UW
Wro
cław
UE
Wro
cław
UT
After application
After Group Exercise
After RB
After LCC
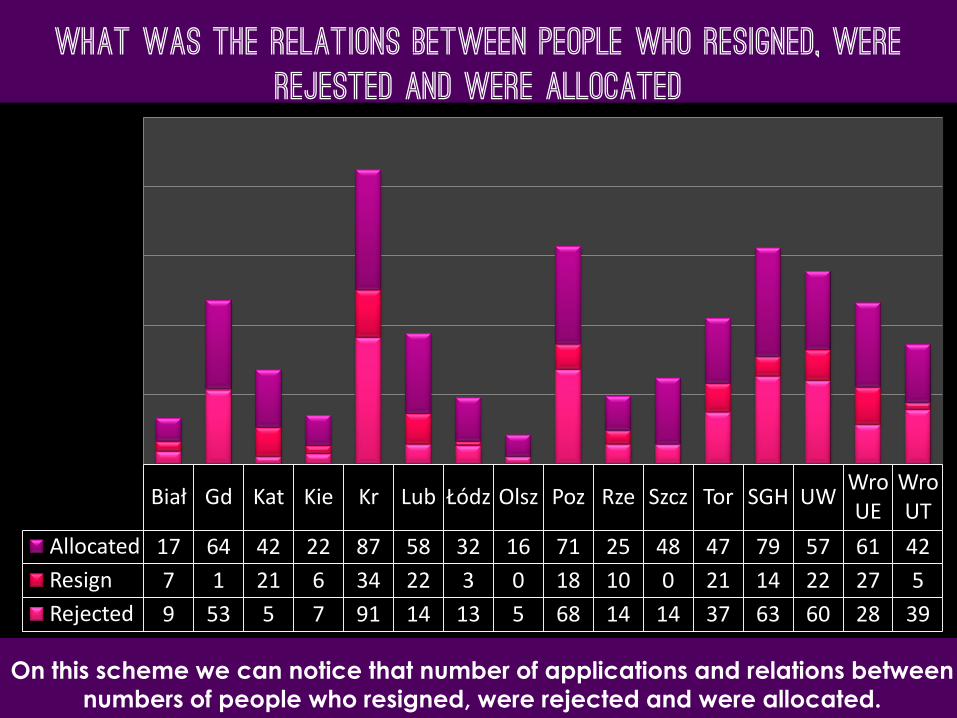
What was the relations between people who resigned, were rejested and were allocated
Biał Gd Kat Kie Kr Lub Łódz Olsz Poz Rze Szcz Tor SGH UW Wro UE
Wro UT
Allocated 17 64 42 22 87 58 32 16 71 25 48 47 79 57 61 42
Resign 7 1 21 6 34 22 3 0 18 10 0 21 14 22 27 5
Rejected 9 53 5 7 91 14 13 5 68 14 14 37 63 60 28 39
On this scheme we can notice that number of applications and relations between
numbers of people who resigned, were rejected and were allocated.
