future of research richard ingleton tns
TRANSCRIPT

3.14 X AXIS
6.65 BASE MARGIN
5.95 TOP MARGIN
4.52 CHART TOP
11.90 LEFT MARGIN
11.90 RIGHT MARGIN DO NOT ALTER SLIDE MASTERS – THIS IS A TNS APPROVED TEMPLATE
Future of Research
© TNS 2015
Future of Research A 21st Century Romance

3.14 X AXIS
6.65 BASE MARGIN
5.95 TOP MARGIN
4.52 CHART TOP
11.90 LEFT MARGIN
11.90 RIGHT MARGIN DO NOT ALTER SLIDE MASTERS – THIS IS A TNS APPROVED TEMPLATE
Future of Research
© TNS 2015
A 21st century romance…
The connected consumer
‘Connected’ research
3

3.14 X AXIS
6.65 BASE MARGIN
5.95 TOP MARGIN
4.52 CHART TOP
11.90 LEFT MARGIN
11.90 RIGHT MARGIN DO NOT ALTER SLIDE MASTERS – THIS IS A TNS APPROVED TEMPLATE
Future of Research
© TNS 2015
2 Social
3 Data mixing
The 3 ‘technologies’ driving the future of research
1 Mobile
15
3.14 X AXIS
6.65 BASE MARGIN
5.95 TOP MARGIN
4.52 CHART TOP
11.90 LEFT MARGIN
11.90 RIGHT MARGIN DO NOT ALTER SLIDE MASTERS – THIS IS A TNS APPROVED TEMPLATE
Future of Research
© TNS 2015
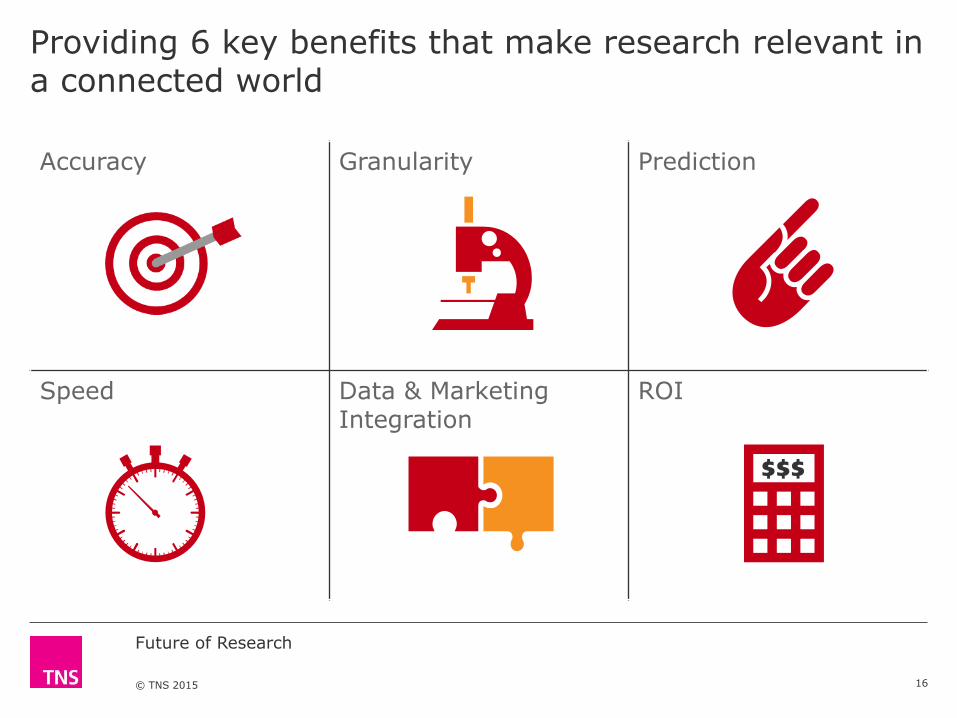
Accuracy Granularity Prediction
Speed Data & Marketing Integration
ROI
Providing 6 key benefits that make research relevant in a connected world
16
3.14 X AXIS
6.65 BASE MARGIN
5.95 TOP MARGIN
4.52 CHART TOP
11.90 LEFT MARGIN
11.90 RIGHT MARGIN DO NOT ALTER SLIDE MASTERS – THIS IS A TNS APPROVED TEMPLATE
Future of Research
© TNS 2015
1 Accuracy

3.14 X AXIS
6.65 BASE MARGIN
5.95 TOP MARGIN
4.52 CHART TOP
11.90 LEFT MARGIN
11.90 RIGHT MARGIN DO NOT ALTER SLIDE MASTERS – THIS IS A TNS APPROVED TEMPLATE
Future of Research
© TNS 2015
Accuracy: mobile gets us much closer ‘to the moment’ providing greater accuracy
1 17.6 10.6 14.0
2 7.1 9.1 9.2
3 34.6 30.0 45.9
4 3.8 24.2 0.1
5 1.7 2.5 2.1
6 7.0 9.5 10.7
7 1.2 2.8 0.9
8 1.6 2.4 1.3
9 0.7 1.8 0.5
10 24.7 7.1 15.4
Total 100 100 100
Industry share
Traditional survey
Mobile diary
Brands
What used in the past <time>? How much/how often/etc.?
‘In the moment’ record
Traditional Survey
0.49
Mobile Survey 0.88
R2
18

3.14 X AXIS
6.65 BASE MARGIN
5.95 TOP MARGIN
4.52 CHART TOP
11.90 LEFT MARGIN
11.90 RIGHT MARGIN DO NOT ALTER SLIDE MASTERS – THIS IS A TNS APPROVED TEMPLATE
Future of Research
© TNS 2015
Accuracy: And when we get closer to the moment, we can understand decision making much better
In reality few count at moment of purchase
Brand most important “in the moment” of purchase
Number of influences on purchase decision
Consumers make decisions quickly
3.8 influences mentioned per respondent
1.4 influences mentioned per purchase
The price Special offer
Well-known brand Drinks menu
Brand not available
Friends
Try something new
Complement food
Match the occasion
Drinks display
After the event Recruitment survey
In the moment mobile diary
Special offers, despite being a major tactical lever, are not cutting through.
0 20 40 60
19

3.14 X AXIS
6.65 BASE MARGIN
5.95 TOP MARGIN
4.52 CHART TOP
11.90 LEFT MARGIN
11.90 RIGHT MARGIN DO NOT ALTER SLIDE MASTERS – THIS IS A TNS APPROVED TEMPLATE
Future of Research
© TNS 2015
Accuracy: whilst social actually gives us a far more accurate and differentiated view on a brand’s positioning
0
0,1
0,2
0,3
0,4
0,5
0,6
Survey attribute
Social proxy
Brand 1 Brand 2
Correlation with changes in equity
20
3.14 X AXIS
6.65 BASE MARGIN
5.95 TOP MARGIN
4.52 CHART TOP
11.90 LEFT MARGIN
11.90 RIGHT MARGIN DO NOT ALTER SLIDE MASTERS – THIS IS A TNS APPROVED TEMPLATE
Future of Research
© TNS 2015
2 Granularity

3.14 X AXIS
6.65 BASE MARGIN
5.95 TOP MARGIN
4.52 CHART TOP
11.90 LEFT MARGIN
11.90 RIGHT MARGIN DO NOT ALTER SLIDE MASTERS – THIS IS A TNS APPROVED TEMPLATE
Future of Research
© TNS 2015
Granularity: getting closer to the moment helps us understand each potential selling ‘occasion’ with a far greater degree of granularity
22

3.14 X AXIS
6.65 BASE MARGIN
5.95 TOP MARGIN
4.52 CHART TOP
11.90 LEFT MARGIN
11.90 RIGHT MARGIN DO NOT ALTER SLIDE MASTERS – THIS IS A TNS APPROVED TEMPLATE
Future of Research
© TNS 2015
Granularity: and the context around occasions, as expressed in social, helps us understand these much better
23

3.14 X AXIS
6.65 BASE MARGIN
5.95 TOP MARGIN
4.52 CHART TOP
11.90 LEFT MARGIN
11.90 RIGHT MARGIN DO NOT ALTER SLIDE MASTERS – THIS IS A TNS APPROVED TEMPLATE
Future of Research
© TNS 2015
Granularity: whilst social lets us explode each occasion even further and identify consumer generated solutions
A mobile diary identifies a targetable moment
Sunday afternoon boredom N=150 cases
One Sunday afternoon of twitter data identifies many types of boredom across 28,000 tweets and discusses how to solve it
Movies Reading
Drawing
Snapchat
Homework Selfies
24

3.14 X AXIS
6.65 BASE MARGIN
5.95 TOP MARGIN
4.52 CHART TOP
11.90 LEFT MARGIN
11.90 RIGHT MARGIN DO NOT ALTER SLIDE MASTERS – THIS IS A TNS APPROVED TEMPLATE
Future of Research
© TNS 2015
3 Prediction

3.14 X AXIS
6.65 BASE MARGIN
5.95 TOP MARGIN
4.52 CHART TOP
11.90 LEFT MARGIN
11.90 RIGHT MARGIN DO NOT ALTER SLIDE MASTERS – THIS IS A TNS APPROVED TEMPLATE
Future of Research
© TNS 2015
1,71,81,92,02,12,22,32,4
Mar Apr May Jun Jul Aug Sep Oct Nov Dec Jan Feb Mar Apr May Jun Jul Aug
2012 2013
4,05,06,07,08,09,0
10,011,012,013,0
Actual Predicted
Prediction: with the sheer volume of real-time data available, we can now create synthetic measures to model equity and sales
Automotive Brand
CPG – Short Purchase Cycle
Mar Apr May Jun Jul Aug Sep Oct Nov Dec Jan Feb Mar Apr May Jun Jul Aug Sep Oct
2012 2013
26
3.14 X AXIS
6.65 BASE MARGIN
5.95 TOP MARGIN
4.52 CHART TOP
11.90 LEFT MARGIN
11.90 RIGHT MARGIN DO NOT ALTER SLIDE MASTERS – THIS IS A TNS APPROVED TEMPLATE
Future of Research
© TNS 2015
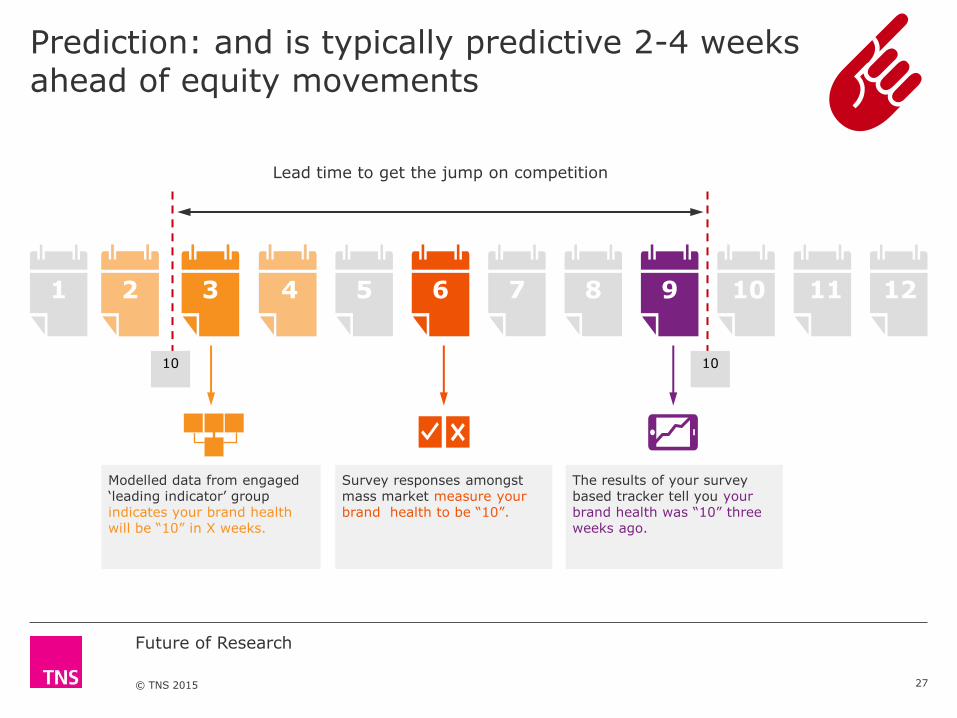
Prediction: and is typically predictive 2-4 weeks ahead of equity movements
Lead time to get the jump on competition
1 2 3 4 5 6 7 8 9 10 11 12
10 10
4 2
Modelled data from engaged ‘leading indicator’ group indicates your brand health will be “10” in X weeks.
2 3 4
Survey responses amongst mass market measure your brand health to be “10”.
6
The results of your survey based tracker tell you your brand health was “10” three weeks ago.
9
27

3.14 X AXIS
6.65 BASE MARGIN
5.95 TOP MARGIN
4.52 CHART TOP
11.90 LEFT MARGIN
11.90 RIGHT MARGIN DO NOT ALTER SLIDE MASTERS – THIS IS A TNS APPROVED TEMPLATE
Future of Research
© TNS 2015
4 Speed

3.14 X AXIS
6.65 BASE MARGIN
5.95 TOP MARGIN
4.52 CHART TOP
11.90 LEFT MARGIN
11.90 RIGHT MARGIN DO NOT ALTER SLIDE MASTERS – THIS IS A TNS APPROVED TEMPLATE
Future of Research
© TNS 2015
Speed: mobile drives brevity in survey design enabling automated solutions
week 1 week 2 week 3 week 4
24 hours 4 weeks
Definition Scripting and field
Data processing Modelling Deliverables Traditional concept
testing
Mobile concept testing
29

3.14 X AXIS
6.65 BASE MARGIN
5.95 TOP MARGIN
4.52 CHART TOP
11.90 LEFT MARGIN
11.90 RIGHT MARGIN DO NOT ALTER SLIDE MASTERS – THIS IS A TNS APPROVED TEMPLATE
Future of Research
© TNS 2015
Speed: with results in real-time, shifting the way we can manage our brands
Business gets real-time reports which highlight any unexpected changes
Consumer tells us each day what they eat/buy/see
Hello, you there? There’s a large uplift in buzz around Apple today
30

3.14 X AXIS
6.65 BASE MARGIN
5.95 TOP MARGIN
4.52 CHART TOP
11.90 LEFT MARGIN
11.90 RIGHT MARGIN DO NOT ALTER SLIDE MASTERS – THIS IS A TNS APPROVED TEMPLATE
Future of Research
© TNS 2015
5 Data & marketing integration

3.14 X AXIS
6.65 BASE MARGIN
5.95 TOP MARGIN
4.52 CHART TOP
11.90 LEFT MARGIN
11.90 RIGHT MARGIN DO NOT ALTER SLIDE MASTERS – THIS IS A TNS APPROVED TEMPLATE
Future of Research
© TNS 2015
Media audience Sales
ROI: data integration enables 1-to-1 targeting and measurement
Survey seed
Buy more
Buy the same
Buy less
38
3.14 X AXIS
6.65 BASE MARGIN
5.95 TOP MARGIN
4.52 CHART TOP
11.90 LEFT MARGIN
11.90 RIGHT MARGIN DO NOT ALTER SLIDE MASTERS – THIS IS A TNS APPROVED TEMPLATE
Future of Research
© TNS 2015
6 ROI
3.14 X AXIS
6.65 BASE MARGIN
5.95 TOP MARGIN
4.52 CHART TOP
11.90 LEFT MARGIN
11.90 RIGHT MARGIN DO NOT ALTER SLIDE MASTERS – THIS IS A TNS APPROVED TEMPLATE
Future of Research
© TNS 2015
Go to store
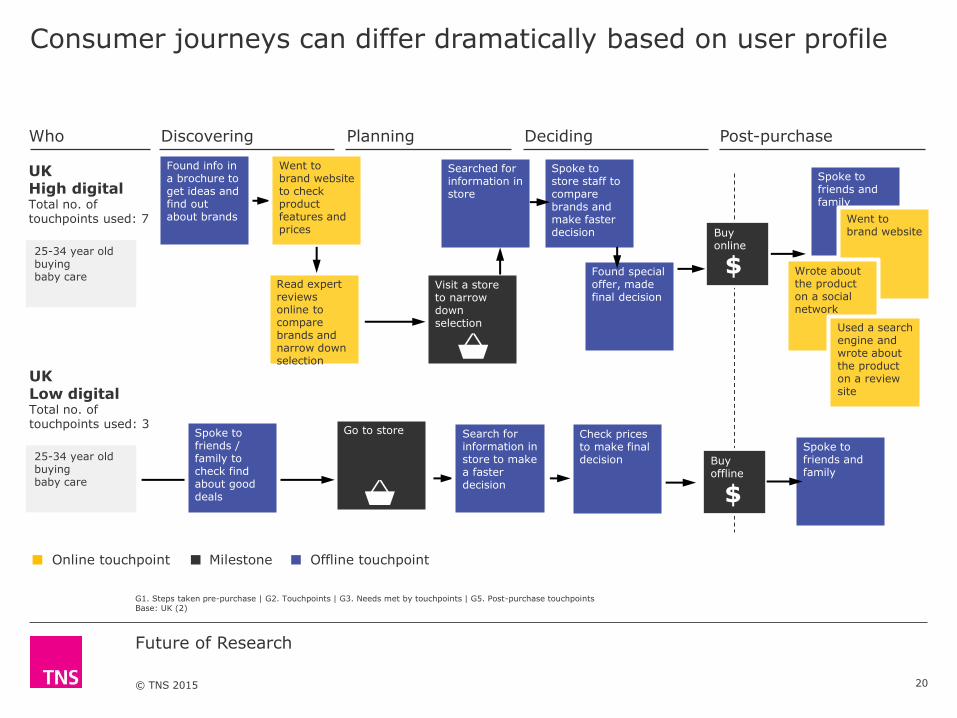
Consumer journeys can differ dramatically based on user profile
Buy offline
Milestone Online touchpoint Offline touchpoint
UK Low digital Total no. of touchpoints used: 3
Visit a store to narrow down selection
Post-purchase Discovering Planning Who Deciding
25-34 year old buying baby care
UK High digital Total no. of touchpoints used: 7
Buy online
Went to brand website to check product features and prices
Read expert reviews online to compare brands and narrow down selection
$
Spoke to friends and family
Found info in a brochure to get ideas and find out about brands
25-34 year old buying baby care
Search for information in store to make a faster decision
Spoke to friends / family to check find about good deals $
Searched for information in store
Spoke to store staff to compare brands and make faster decision
Found special offer, made final decision
Went to brand website
Wrote about the product on a social network
Used a search engine and wrote about the product on a review site
Check prices to make final decision
Spoke to friends and family
G1. Steps taken pre-purchase | G2. Touchpoints | G3. Needs met by touchpoints | G5. Post-purchase touchpoints Base: UK (2)
20

3.14 X AXIS
6.65 BASE MARGIN
5.95 TOP MARGIN
4.52 CHART TOP
11.90 LEFT MARGIN
11.90 RIGHT MARGIN DO NOT ALTER SLIDE MASTERS – THIS IS A TNS APPROVED TEMPLATE
Future of Research
© TNS 2015
We can then build specific journey profiles for each customer that can be used for customer engagement
Pre-store Occasion In store
56%
Relaxing at home
27%
With food at home
10%
Leisure out of home
Brand decisions made pre-store Brand decisions made in-store
73
Touchpoint interaction Mission Brands bought
29
46
21
Actively research the category
Saw some advertising
Did not research the category or see advertising
27
57
23
8
4
Weekly shop
Fill in
Meal
Specific trip
43
21
15
8
Brand X
Competitor
Competitor
Competitor
Bought on…
59 41
Full price Promotion
Go to
sto
re
Purc
hase
Shopper journey - Grocery %
23

Integrated thinking

3.14 X AXIS
6.65 BASE MARGIN
5.95 TOP MARGIN
4.52 CHART TOP
11.90 LEFT MARGIN
11.90 RIGHT MARGIN DO NOT ALTER SLIDE MASTERS – THIS IS A TNS APPROVED TEMPLATE
Future of Research
© TNS 2015
How does this all come together? Our vision is for a more flexible, iterative research architecture
Predictive spine Social and search
Slimmer survey Shorter, smarter surveys
Modular deep dives touchpoint evaluation, Qual etc.
Situational Equity Occasions
40

3.14 X AXIS
6.65 BASE MARGIN
5.95 TOP MARGIN
4.52 CHART TOP
11.90 LEFT MARGIN
11.90 RIGHT MARGIN DO NOT ALTER SLIDE MASTERS – THIS IS A TNS APPROVED TEMPLATE
Future of Research
© TNS 2015
A 21st century romance..!
‘Connected’ research
49