future of work in south africa€¦ · the developed, emerging and developing worlds varies given...
TRANSCRIPT

Human Sciences Research Council Lekgotla la Dinyakisišo tša Semahlale tša Setho Raad vir Geesteswetenskaplike Navorsing Umkhandlu Wezokucwaninga Ngesayensi Yesintu Ibhunga Lophando Ngenzulu-Lwazi Kantu
BRICS Research Centre
Future of Work in South Africa
The Road to 2030
By Krish Chetty, Human Sciences Research Council – BRICS
Research Centre
This study is prepared in partnership with:
Emerging Market Sustainability Dialogues
Tandem Research
Centro de Implementación de Políticas
Públicas para la Equidad y el Crecimiento
(CIPPEC)

2
1 INTRODUCTION
The world’s dependence on technology has permeated throughout society and impacts all sectors of the
economy. The implications of the rapidly advancing digital economy differ widely for the connected and
disconnected populations of the world. Importantly, the manner in which this impact is realised across
the developed, emerging and developing worlds varies given the country’s socio-political dynamics. This
impact further manifests disparately in a country of high inequality, such as South Africa. Multiple factors
indicate that South Africa’s digital divide follows from the trends of income and skills inequality pervasive
within the country. Recognising this divide is crucial when attempting to project the country’s current
technological and social trajectory and to thereafter define appropriate policies in line with this
projection.
This study aims to explain South Africa’s technological and social positions, given the country’s socio-
political history and present a view of where the country is likely to be by the year 2030. This prediction
is informed through the collective inputs of multiple research stakeholders interested in exploring the
country’s position in terms of digital transformation, the barriers it must overcome and the drivers of
change which can be leveraged to support reaching a position of better social cohesion and technological
advancement.
In early 2018, South Africa’s newly inaugurated President Cyril Ramaphosa, announced in his first State of
the Nation address, that the country will launch a Digital Industrial Revolution Commission, comprising of
key policy makers from across the government (Ramaphosa, 2018). This decision recognised the influence
that digital technologies are making across the world, which necessitates a broader and more coordinated
approach to managing and leveraging the impact of such technologies. Importantly, it is expected that the
commission will also engage broadly with civil society and the private sector, appreciating that public-
private partnerships are key to ensuring polices are crafted in a more inclusive manner. This presents an
opportunity for policy researchers in this space to engage directly with government. In light of this
opportunity, this study presents an introductory view of potential drivers of change. Further research is
required to explore these levers to better understand how best they can be applied.
Various government initiatives are underway which could benefit from further research into digital trends
specific to the South African context. For example, the Department of Trade and Industry has set up a
Future Industrial Production Unit which is currently exploring the digitisation priorities relevant to the
country’s National Development Plan and Agenda 2030. Accordingly, the department is working towards

3
implementing such initiatives in the short to medium term. The Department of Science Technology has
prioritised the Science, Technology, Engineering and Mathematics field expecting that these fields will be
a driver for economic growth and provide a knowledge base for the country to develop innovative
solutions to the problems of poverty (Department of Science and Technonlogy (DST), 2017). Given this
expectation, close consideration is required of how such initiatives can be constructed in a manner which
fosters inclusive development. The Department of Higher Education and Training will be convening a
multi-sectoral task team to investigate what research, teaching and applications of emergent technologies
are needed to develop the capabilities of the higher education sector (Gerber, 2018). Further, the
Department of Telecommunications and Postal Services is managing inter-departmental processes via a
Digital Transformation Committee and is supported by the Department of Science and Technology and
the Department of Trade and Industry, to explore policy options pertaining to the influence of
digitalisation (Department of Telecommunications and Postal Services, 2017). The intention of this
committee is to identify pathways for the country to achieve digital transformation by promoting a digital
society and a productive knowledge economy by 2030. The Academy of Science of South Africa, via its
Humanities Standing Committee, is commissioning a study on the 4IR, and will also explore opportunities
for centralising the humanities sector within digitalisation research. The Department of International
Relations and Cooperation is coordinating multilateral research engagements which prioritise the 4th
Industrial Revolution’s influence on society, where for example, amongst other regional and global
initiatives, themed the recent South African lead BRICS 2018 Summit as “BRICS in Africa: Collaboration for
Inclusive Growth and Shared Prosperity in the 4th Industrial Revolution” (BRICS Heads of State, 2018).
The National Technology Implementation Platform under the stewardship of the Department of Trade
and Industry is developing a fully-fledged 4IR programme with a goal of promoting the competitiveness
of the manufacturing sector in the country (SA Government News, 2018).
Given these multiple initiatives underway, evidence-based research is key to ensuring that the policies
implemented within the country follow from our local context and in South Africa, we guard against
constructing policy informed by international policy trends, which may be inappropriate for this country’s
unique context. The impact and benefits attributed to technological change in the developed world
cannot be assumed to be applicable in the South African context. Although, there are various debates
whether the world is indeed transitioning through the 3rd, 4th or 5th Industrial revolution, the impact of
technological change has direct implications for the way businesses and society function, resulting in
potentially radical labour market changes. Further, considering the influence of inequalities within the

4
economy, low, middle- and high-income households will experience different levels of technology impact
based on their varied capabilities. South African policy must be cognisant of these realities.
The extent of labour market consequences arising from an industrial revolution remains unknown,
particularly at domestic levels. For this reason, it is important to examine the labour market consequences
of the ‘fourth industrial revolution’ within the history of South Africa. South Africa’s internal dynamics are
unique and follow from an unjust and divided past. In a country which is recognised as one of the most
unequal in the world, international trends pertaining to digital diffusion, the means of access, digital skills
and the influence of cultural norms do not apply.
The questions that emerge, particularly for South Africa, include whether technological advancement
could improve or impede social cohesion. This requires that we ask whether the narratives pertaining to
the benefits of technology leapfrogging are applicable, particularly within the rural areas of the country,
and are the digital services offered and assessible to poor communities sufficient to replace the traditional
alternative service. In this light of these questions and the South African context, this study explores the
relationship between social cohesion and technological advancement, and the possible implications it has
for South Africa’s future labour market.

5
2 APPROACH
The South African research team adapted the Delphi technique in collecting inputs from researchers and
industry experts in a structured manner. To do so, an online forum was set up using Google Groups. This
forum was divided into 5 partitions for, viz.: Scenario 1 - Low Social Cohesion and Low Technology
Advancement, Scenario 2 - Low Social Cohesion and High Technology Advancement, Scenario 3 - High
Social Cohesion and Low Technology Advancement, Scenario 4 - High Social Cohesion and High Technology
Advancement and lastly, a partition dedicated to collecting general information from the study’s
participants related to technological change and the Digital Divide.
Figure 1 - 4 Scenarios - Social Cohesion vs Technology Advancement
Each of the 4 scenarios, asked 10 open-ended questions, specific to the scenario. This included questions
pertaining to (1) the description of the world and South Africa specifically in 2030, (2) an exploration of
the country’s transition from its current circumstance to the outcome identified in the scenario, (3) a
discussion of labour productivity in particular sectors, (4) an exploration of the disparities in the workforce
by 2030, (5) an examination of employment conditions and how they evolved by 2030, (6) a discussion of
how the economy evolved, (7/8) an examination of worker and employer policies required in such a
scenario, (9) an exploration of the requirements of workers of the future and lastly (10) a discussion of
employer needs in 2030. Each of these questions were scenario specific and respondents were urged to
Technology Advancement
Soci
al C
oh
esio
n
1. Low Social Cohesion, Low Technology Advancement
2. Low Social Cohesion, High Technology
Advancement
3. High Social Cohesion, Low Technology Advancement
4. High Social Cohesion, High Technology
Advancement

6
imagine a South Africa in 2030 that would manifest such changes and attempt to identify the drivers of
such change. Some respondents preferred to concentrate their inputs on the scenario they considered
most likely, whilst others imagined how such outcomes could potentially become a reality.
The online Future of Work forum was launched at a Monitoring and Evaluation Community of Practice
meeting, held quarterly by the Council for Scientific and Industrial Research. The Community of Practice
brought together technology and data collection experts from the government and business sector. The
launch of the forum involved a presentation and discussion of key issues affecting South Africa in terms
of the current Digital Divide and its potential impact on the country in reaching any of the four scenarios
mentioned above. These experts were invited to respond to the questions within the forum and also invite
their colleagues to participate. Thereafter, additional experts from the research and business sectors were
invited to contribute to the discussion. In addition, a follow up online Q&A session was held to answer
questions participants had and to also further the discussion. The respondents’ inputs are captured on
the online forum, whilst other points mentioned during discussions (but not captured online) were
recorded and also contribute to the output of the study. Furthermore, discussions with researchers from
the Human Sciences Research Council, Global Economic Governance (GEG) Africa and Nelson Mandela
University were held to test the views of the online group. These discussions were documented and
contribute to the findings captured within this report.

7
3 SOCIAL COHESION IN SOUTH AFRICA
In the context of this study, a loose and inclusive definition of Social Cohesion is adopted to ensure that
the study considers as broad a range of social factors applicable to South Africa. As a broad umbrella term
to describe social conditions within South Africa, this term refers to a multitude of factors such as living
conditions, access to services, income inequality, poverty, employment opportunities, wellbeing, crime,
violence, gender conflicts, mistrust across the population and feeling secure. Such a broad definition is
necessary as technology advancements have the potential to influence all aspects of society, in ways
possibly not understood at this moment. Furthermore, these factors are interconnected and are not easily
distinguishable.
To better understand these factors, consider the following:
3.1 INEQUALITY
Considering South Africa’s Gini-coefficient of 0.63 as reported by the World Bank in 2017, South Africa is
recognised as one of the most highly unequal countries in the world (The World Bank, 2018). In its review
of the South African Economy, the World Bank advises that the country must focus on education centric
policies to overcome the effects of inequality proposing that through an improved education platform,
the workforce would support growth via increased competition and skilled migration. Income inequality
in South Africa, is possibly the most difficult challenge the country has to overcome. The UN Human
Development Report (United Nations, 2010) and the UN Habitat study of 2010/2011 titled “State of the
World Cities” referred to income inequalities at city level in identified that the top 9 most unequal cities
were found in South Africa (UN Habitat, 2010). These statistics reflective the pervasive nature of inequality
in the country.

8
Figure 2 - Top 10 most unequal cities in the world.
Source: UN HDR 2010 & UN Habitat 2010/2011
Figure 3 - Urban Inequalities (consumption/income) in selected cities and countries in Africa (1993-2007)
Source: UN Habitat 2010/2011

9
Bhorat & Van Der Westhuizen (2012) highlight these trends in their study and noted that income
inequality in the country was widening the gaps between rich and poor. The key determinants of these
trends were the historic inequities within South African society, and inability of the country's policies to
adequately address these challenges. The authors note that these trends 'threaten the survival of
democracy' and that the current growth pattern of the country will not address these inequalities and
may only result in modest gains. The trends suggest that inequalities are widening across racial lines which
tends to exacerbate the racial tensions conceived during South Africa’s Apartheid era. Further, it is noted
how inequality impedes voter participation, political engagement and increases the rate of crime.
Similarly, the Mapungubwe Institute for Strategic Reflection’s study referred to the consequences of
poverty on society and noted the ills which accompany high inequality and outlined crime, poor education
and teenage pregnancy as such consequences (Netshitenzhe, 2013). The Mapungubwe study noted that
one should consider determinants such as the access that the poor have to assets, services and
opportunities, and social capital. Thus, if nothing is done to promote such determinants, despite the
already high levels of inequality, it could worsen.
One of the most urgent and dire consequences of inequality, is the impact it has on violent crime.
Wilkinson (2004) reports that inequality is a predictor of violent crime in a country. In his study, he
describes how such disparities directly influence the health of society. Neglecting the effects of inequality,
results in a divided population which becomes more insensitive to the plight of the disadvantaged, which
in turn has socially corrosive effect. The net effect of this results in those afflicted by poverty finding
property crime more attractcive and ultimately profitable as a livelihood. The disparities between rich and
poor emphasises the frustrations experienced by the poor, exacerbates the hostility between such income
groups and permeates a feeling of hopelessness. Increased experiences of violent crime further
undermines trust amongst people, impedes community engagements and over time destroys the
functioning of institutional and social structures. In South Africa, income inequality is closely aligned to
racial categories, where there efforts of the post-Apartheid government have had a limited impact on
reducing poverty. Hence, racial tensions remain high. In reviewing income inequality, wealth inequality
and the reported murder rate, in 2018, it was reported that the murder rate has increased by 6% to 36%,
from a low point in 2011. The steady incline corresponds to the stagnant income inequality Gini co-
efficient of almost 0.7% which shows no impetus of decreasing considering the country’s policy outlook
in the short to medium term. In addition, given a calculated wealth inequality co-efficient of 0.95, it was
found that 10% of the country’s population control at least 90 to 95% of all wealth, highlighting the
country is actually more unequal than expected if one only considers income inequality (Orthofer, 2016).

10
By reflecting on such statistics, it is indicative that the rising levels of violent crime is related to a frustrated
and hopeless population.
Figure 4 – Murder rate vs Income inequality and Wealth inequality
Source: Murder rate sourced from the South African Crime Statistics (South Africa Police Services, 2018);
Wealth Inequality sourced from Orthofer (2016); Income Inequality sourced from The Chartbook of
Economic Inequality (2014)
Income inequalities also closely correspond with access to digital tools and the internet in South Africa.
Using data from the General Household Survey (GHS) of 2015, it is found when internet access is viewed
in terms of monthly income bands, 84% of those in the highest income quintile have internet access in
contrast, to those in the lowest quintile where less than 35% have such access (Statistics South Africa,
2017a). The challenge this highlights, is that poorer households have insufficient disposable income to
spend on internet access and must first attend to their basic necessities.
Table 1 - internet access per monthly income band
Internet Connection / South African Household/ Income Band (ZAR)
Below 1500 (ZAR) 34.7%
Between 1501 – 3500 (ZAR) 40.6%
Between 3501 – 7500 (ZAR) 56.6%
Between 7501 – 12500 (ZAR) 72.6%
Above 12501 84.2%
Source: GHS 2015, Statistics South Africa
0
10
20
30
40
50
60
70
80
90
100
Murder rate vs Income Inequality and Wealth Inequality
Wealth Inequality Murder Income Inequaity

11
The study’s respondents referred to these trends and identified the link between income inequality and
technology diffusion in the country as a central driver of change. Respondents noted that if the country
does not recognise how the current policy environment drives these trends, inequality would worsen,
resulting in the shrinking of South African middle-income earners and growth amongst poor which would
in-turn exacerbate feelings of mistrust and discontent.
3.2 POVERTY
Since 2012, poverty in South Africa can be described in 3 different categories, viz food poverty, lower-
bound poverty and upper-bound poverty. Food poverty is calculated by following a cost-of-basic-needs
approach, by assuming people in this group only have the financial means to afford a selection of basic
foods. Those included within the lower-bound poverty group earn sufficient income to afford the selection
of basic foods in addition to a selection of basic non-food items. People in this group are not completely
able to afford an adequate amount food and non-food items and must therefore sacrifice some non-food
items. The upper bound poverty line is calculated based on an assumption of the cost of an adequate level
of food and non-food items to sustain one’s self. Each year, these poverty lines are adjusted based on the
annual inflation rate (Statistics South Africa, 2017b). For perspective, as at April 2015, the food poverty
line amounted to $1.22 per day, the lower bound poverty line equalled $1.79 per day and the upper bound
poverty line was approximately $2.75 per day.
Figure 5 – Levels of Poverty in South Africa (2006, 2009, 2011, 2015)
Source: Statistics South Africa (2017b)
Generally, poverty trends in terms of race and gender have remained relatively stable. The African
population group has had the largest proportion of people living below the lower-bound poverty line with
66.0062.1
53.2 55.551
47.6
36.440
13.416.7
11 13.8
0.00
10.00
20.00
30.00
40.00
50.00
60.00
70.00
2006 2009 2011 2015
Levels of Poverty in South Africa
Upper Bound Poverty Lower Bound Poverty Food Poverty (Extreme)

12
44.8% of males and 49.2% of female living in poverty. In contrast, the proportion of the White population
group living in poverty amounted to approximately 0.5% for both males and females in 2015 (Statistics
South Africa, 2017b). As discussed, these stark discrepancies tend to further exacerbate racial tensions
within the country. From a household perspective, 40% of households in 2015 lived below the upper-
bound poverty line, which was also an increase of 1.7% from 2011. In addition, half of female headed
households lived below the upper-bound poverty line, in contrast to 33% of male headed households. In
addition, the most vulnerable age groups are households headed by youths between 0 and 17 years old,
as well as the elderly above 65 years of age. The 0 to 17 age group reflected 59% of such households living
below the upper-bound poverty lines, whilst 45.6% of those households headed by persons 65 years and
older experienced living below the upper-bound poverty line. This percentage has decreased substantially
from 2006 where 68% of such households lived under the upper-bound poverty level, indicating the value
of old-age social protection programmes.
Poor households (upper-bound poverty) on average earn approximately R46,000 per annum and spend
an average of R31,000 per annum. On average these poor households direct 64% of their expenditure to
basic necessities such as food, housing and transport. The remaining 36% of expenditure is directed to
miscellaneous priority items for the household. It is also important to note the average household size is
5.1 for poor households, which is more than twice the household size of non-poor households with an
average size of 2.4 (Statistics South Africa, 2017b). Given the size of the household, competing interests
in the household often lead to many poor households not finding internet access as relevant or necessary
expenditure.

13
Figure 6 – Levels of Poverty in South Africa (2006, 2009, 2011, 2015)
Source: Statistics South Africa (2017b)
3.3 UNEMPLOYMENT
As at June 2018, the conservative unemployment rate in South Africa was 27.2% whilst the expanded
unemployment rate (which includes the not-economically active) amounted to 37.2% of the population
(Statistics South Africa, 2018). A shrinking middle class and high rate of inequality is rooted in the country’s
poor employment opportunities, particularly amongst the youth. Youth unemployment (using the
conservative estimate) is much higher than the average across age groups and compared to adults. As at
2018, 39% of youth were unemployed. This is coupled with a poorly performing education system where
it was noted that as at 2011 approximately only 29% of adults had completed formal secondary schooling.
Thus, the majority of adults had dropped out of school before completion.
South Africa’s high rate of youth unemployment is closely linked to the country’s poorly performing
education system. South Africa’s schools have been categorised into quintiles based on a variety of factors
but largely underpinned by the surrounding community’s average income. Often schools in poorer areas
have produced weaker results and are impacted with higher levels of learners dropping out from school.
As described in the diagram below, these environmental factors lead to learners living in poorer areas
either not finding any work or filling low skilled and non-productive jobs. In contrast, learners from more
affluent areas tend to produce better results after receiving better schooling, thereafter gain access to
tertiary education and enter into more productive jobs, given their qualifications. Such trends perpetuate
33.5%
21.4%10.2%
25.8%
9.2%
Poor Household Expenditure
Food
Housing
Transport
Other
Miscellaneous

14
a cycle of hereditary poverty linked to the poorly performing education system and unemployment trends.
Breaking this cycle will be key, to improving the country’s state of social cohesion (Spaull, 2015).
Figure 7 – The links between society, the education System and the labour market
Source: Spaull (2015)
In addition, not all learners who complete school have received adequate training to work with digital
tools. The study participants also noted the following challenges which are experienced in the current
education system.
1) A lack of alignment between the school curriculum and university prerequisites, pertaining to subjects
which are ICT related.
2) A lack of alignment between skills offered by tertiary education facilities and training programmes, in
comparison to the needs of employers.
3) A lack of recognition for some certifications of achievement, despite the value and effort in acquiring
such an award.

15
4) There is limited effort by government to absorb/educate the large number of school dropouts and
unemployed.
5) More productive jobs are filled by the more affluent portions of the population who are able to afford
private training targeted to the needs of employers.
Ultimately, the benefits of internet connectivity or technology advancement are largely available only to
the minority of the population, whom have the financial means, have attended schools with greater
technology adoption and are able to apply their skills in the work environment. Without a concerted effort
by policy makers to address these disparities, the inequalities in technology access will worsen. These
trends are foreseen to harmfully impact employment opportunities in the country. The more difficult it is
to access the internet or digital tools within schools, the less effective will be South Africa’s education
system. This impacts the extent to which learners can contribute innovatively to new fields of technology
and the competitiveness of the country’s businesses and future innovation prospects.
3.4 THE NEOLIBERAL POLICY APPROACH
During the discourse of the Thabo Mbeki presidency, South Africa consolidated the Growth, Employment
and Redistribution (GEAR) policy, which adopted a series of measures including fiscal austerity, export
oriented production and public sector privatization. The policy replaced the Reconstruction and
Development Programme (RDP) instituted during the initial years of the Nelson Mandela presidency. The
expectation was that the policy would promote an economic growth target of 6% annually and the
creation of 400,000 jobs per annum (Department of Finance, 2002). In hindsight, these targets were not
reached.
The study participants strongly criticized the neoliberal policy approach of GEAR, stating that the policy
framework has consequently negated the country’s developmental trajectory. The challenge of pervasive
inequality in the country can be attributed to this policy, which assumed social benefits would result as a
by-product of business growth. In implementing the policy framework, the country began to emphasise
the export of goods of services, free trade and arguably neglected of social service provision. The gains
experienced by businesses have not translated into benefits received by the labour force in terms of
greater employment opportunities, improved education performance or a reduction in poverty. In fact, in
actual terms, the opposite has been found to be true, despite claims from the ruling party that the
introduction of such policies could be seen to be a new vehicle which should fulfil the developmental aims
proposed by the RDP approach.

16
To provide further context to this argument, the RDP was able articulate the aspirations of a unified and
developmental South Africa. Growth and development would be promoted through a mixed Keynesian
framework advocating for both development through reconstruction programmes and growth through
market mechanisms. However, once the RDP had been replaced by GEAR, the developmental agenda was
minimised, and a series of initiatives were introduced such as relaxed exchange controls, trade
liberalization flexible labour market controls and interest rate-based market stabilization monetary
policies. Such policies allowed the private sector to take economic control. This happened at the expense
of the poor, where the net effect was a transfer wealth from the poor to the already rich. Ultimately,
these trends perpetuated and worsened the effects of inequality (Sebake, 2017).
Steven Klees argues that the South African policy approach of GEAR resembles that of Reagan’s United
States and Thatcher’s United Kingdom in the 1980s (Klees, 2014). Klees, citing the work of Vally and
Motala, states the only common ground that left-leaning policy advocates share with neoliberal views is
the emphasis on effective education programmes. However, as supported by Klees, the neoliberal view
of privatising social functions promoted deeper inequalities which has led to the current employment
crisis.
It was argued by the study participants, that under the current policy approach, businesses have no
incentive to promote skills development and employment creation programmes. Accordingly, one can
expect that technology advancement and automation in particular, will have a destructive effect on the
labour market within the manufacturing and services sector. A policy change is needed to incentivise skills
development and public private partnerships in a manner which can grow the labour force in areas of
most need. If the policy framework is left unattended, businesses will find a new state of equilibrium
through an emphasis on exports, outsourcing and limited local employment.
3.5 OLIGOPOLISTIC COMPETITION IN SOUTH AFRICA
Oligopolistic competition occurs when products/services are traded in an environment where the barriers
to entry are very high. Given the low state of competition in such a market, the existing companies have
the power to dictate the pricing of the traded goods/services, whilst continuing to dominate the market,
despite possible exorbitant pricing. Such a situation aptly describes various sectors of the South African
economy, such as banking, retail, insurance, transport, telecommunication and manufacturing (Pienaar,
2017).

17
The Competition Commission in South Africa is tasked to find solutions to de-concentrate control of
certain sections of the economy and to identify reasons for the high barriers to entry. Despite this
requirement, the Competition Commission has little powers to challenge the status-quo in South Africa
(Ntingi, 2017). Theron identifies the following reasons within the South African economy why oligopolies
are able to manifest. These includes a difficult regulatory requirement, unorganised and uninformed
consumers and economies of scale favouring the early entrants to the market (Theron, 2006).
In review of the country’s economy, the World Bank argues South Africa’s poor economic performance is
linked to limited innovation following from an uncompetitive market. The World Bank further declares
that innovative practices in the gold mining, social housing and machinery equipment sectors will have
productivity gains together with positive impacts on job creation. Similarly, innovations introduced within
public transportation, energy, food, beverages and textiles is expected to reduce the effects of poverty
(Creamer, 2017).
Advocating for the benefits of innovation is not new within South Africa. Blankley and Moses in 2009
highlighted the acceptance that innovation is vital for economic growth and competition across the global
economy (Blankley & Moses, 2009). However, in 2016, the Centre for Competition Regulation and
Economic Development at the University of Johannesburg, continues to argue for revisions to competition
law to breakup cartels in order to facilitate the lowering of pricing of products for consumers. The centre
calls for regulating within the aim of promoting competitive rivalry, amending the Competition Act and
promoting sources of venture capital for small business which the centre believes can restructure the
economy. Furthermore state sponsored monopolies in the form of Telkom and SAA have gravely harmed
broadband rollout and air-transport in the country respectively (Roberts, 2016).
The study participants have argued that positive change in terms of market competition is unlikely whilst
there are no incentives to drive the de-concentration of markets in the country. Further the group argues
that neoliberal policies in effect promote and consolidate the gains of big business and make it harder for
small business to gain entry or compete. Given the pessimistic outlook of the study participants, it is
unclear which lever could be manipulated to promote competition and innovation in the country.

18
4 TECHNOLOGY ADVANCEMENT IN SOUTH AFRICA
For digital technologies to benefit from a strong foundation able to sustain innovations, there is a school
of thought that argues that the Maslow Hierarchy of Needs, aptly describes the necessary foundation
required for technologies to be built upon. Within such a framework, innovation is only possible if the
business is well supported. To this end Jim Link describes the 5 levels of the Maslow framework from a
business and technology perspective. This framework is useful in helping one understand a scale
necessary to project technology advancement. On such a scale, basic technologies fall within the
physiological and safety space, whilst, more advanced technologies such activities which fall within the
belonging, esteem and self-actualisation space.
• In describing the physiological level for digital need, Link compares this to foundational
requirements of access, such as access to digital tools and networking capability which provides
one the basic necessities to function within a digital environment. Such requirements are
comparable to basic needs such as food, air and water for survial.
• The safety level refers to one’s ability to feel safe within the work environment. This includes
network security processes and identity protections which allow a worker to feel safe when
conducting their duties.
• The belonging level includes technologies which allow workers to connect with their peers and
those outside of their organisation in secure manner. This involves technologies which support
communication and collaboration when in-person contact is not feasible.
• The esteem level refers to a worker’s ability to build their own technical capabilities such as digital
skills, to ensure they are able to deliver on their duties in a changing work environment.
• At the top of the Maslow pyramid we find the self-actualisation level which supports the
employees to ably carry out all their duties in a meaningful and creative manner. It is within this
space that digital innovations thrive, but can only happen if the foundational systems are in place
to support the employee (Link, 2018).

19
Figure 8 – Applying the maslow hierarchy of needs to Digitalisation
Source: Forbes – Jim Link (2018)
Within the innovation space, businesses are able to adopt new digital tools in innovative ways to promote
the efficiency and effectiveness of the product/service that they offer. Hinchcliffe (2014) notes that digital
tool advancements available in the home, actually outpace those that are available and adopted within
the workspace. This is because businesses are finding it more difficult to adopt the bleeding edge devices
and change their existing building models. Given this lead time, before some technologies are adopted,
businesses have a short amount of time to react to the potential innovative opportunities available from
new technologies. Thus, technologies which are adopted by businesses in the innovation space include
the types of devices which can be utilised by workers, the applications appropriate to those devices and
the business models which are thereafter changed to leverage these new applications. The more
innovative businesses/entrepreneurs are able to develop an altogether new device/application given their
knowledge of the environment and their understanding of what technologies could offer their particular
sector.

20
Figure 9 – Tools for the future of digital work
Source: Enterprise Irregulars, Hinchliffe (2014)
In terms of South Africa’s infrastructure as a country, the World Economic Forum released the Network
Readiness Index wherein it ranked South Africa as 65th out of 139 countries. South Africa scored of 4.2 out
of a maximum 7 points which followed from a strong mobile network coverage and internet bandwidth
but also very weak social impact. Social impact is informed by factors such as internet access in schools,

21
ICT use in government efficiency, ICT’s role in the provision of basic services and e-participation in the
country (The World Economic Forum, 2016).
In terms of technology access, the Independent Communications Authority of South Africa (ICASA),
reports that in 2016, 87% of households had access to either a cellular phone or landline. Furthermore,
59% of households have a household member who is able to access the internet from some location (be
it at home, work, library, internet café, etc), whilst only 9.5% of households had internet access in the
household (Independent Communications Authority of South Africa, 2018).1
Table 2 – Internet access by place of access, geotype and province (2016)
Source: ICASA (2018)
Certain government services in South Africa have been made available online. These include filing taxes,
car registration, driver’s license renewal and the online purchasing of credits for electricity and water in
some cities. Not all the services have been successfully implemented, but in 2011, it was noted that 99%
of submitted tax returns, were made online, indicating a demand for functional e-government services
(McKinsey&Company, 2014). However, at the same time, Research ICT Africa, reports that the policy
environment is not conducive to investment or competition within the communications sector.
1 It is important to note that the access statistics reported by ICASA differ from those reported in the General Household Survey, produced by Statistics South Africa

22
Bottlenecks in regulation and policy making constrains the growth of the communications sector. In
addition, the telecommunications sector is seeing a transition from voice services to data services,
impacting the business model of the sector (Gillwald, Moyo, & Stork, 2012).
Some of the other challenges reported by Research ICT Africa pertaining to the adoption of ICT in South
Africa include poor institutional arrangements supporting regulators such as ICASA and USAASA; limited
rollout of undersea cables and the limited capacity/strength of the national backbone for bandwidth;
leased line rental for bandwidth remains due to no competition; high mobile and fixed line retail prices
and spectrum allocation bottlenecks; and the weak financial performance of Telkom (Gillwald et al., 2012).
Given, these challenges one finds that South Africa is a net importer of ICT goods and services, with the
size of the net importation of these goods/services increasing by 100% between 2014 to 2017
(Department of Telecommunications and Postal Services, 2017). Consequently, the opportunities to lead
in terms of new innovations across sectors is limited, if services and products are consumed from
international sources. Recognising that local competition is weak, and barriers to market entry are high,
innovative entrepreneurs find it difficult to break into the ICT sector. Following this line of thought, PwC
notes the rapidly changing space in the manufacturing sector but notes that real gains are only
experienced by a select few due to the limited competition. PwC has found this trend occurs
internationally and locally within in South Africa. PwC describes those leading digital transformation of
the sector as ‘Digital Champions’ who can innovate and apply new solutions, with the market’s choices
becoming more limited in terms of which products/services they consume. PwC believes for South African
businesses to succeed, their business models must connect the strategic, operational, technological and
people related capabilities to which they have access (Camarate, 2018). In addition to such an internal
approach for businesses, it is also vital at the macro level to promote greater innovations, that
competition law must be revised and the barriers to entry should be lowered.
To digitally transform the South African economy, the Centre for Competition Regulation and Economic
Development believes that transformation in the country will follow an evolutionary model and not a
revolutionary one. This follows from the aforementioned reasons such as the dependence on product and
service that the country experiences in general and not only in the ICT sector. The Centre further believes
that policy makers must analyse the economy carefully and identify root industries which will drive
economic growth. This includes the production of materials such as plastics and metal casings which are
used in other sectors (Mondiliwa, 2018). Nimrod Zalk from the Department of Trade and Industry also
advises that an emphasis on manufacturing and industrialisation is necessary for the stronger growth of

23
the economy in the long term. In the post-Apartheid era, South Africa has undergone a period of de-
industrialisation, led by the reliance on product/service imports, but to promote growth, a diversified and
re-industrialised manufacturing sector is essential (Ngulube, 2014).
Experts in this area believe technological advancement and transformation will come from greater
investment in cross-sector knowledge sharing activities, the development of technical and
entrepreneurial skill, a revitalised regulatory system and innovative systems which support elements of
design, data analysis and the broader incorporation of Science, Technology, Engineering and Mathematics
(STEM) across sectors (Mondiliwa, 2018).
The study participants also argued that the emphasis of investment in the STEM field of research should
also be targeted toward foundation and primary school education of science and mathematics. At the
lower levels, these are the subjects with the poorest performance and interventions are required whilst
learners are still in school and not only targeted towards those who are completing tertiary studies in this
field. It is believed that the Science and Technology Ten Year Plan is exclusionary in the manner in which
science graduates are promoted and receive benefits. Such graduates have already built their capabilities
above that of the unskilled and poor. The current programme is further promoting inequality.
For each initiative that is supported, the central question that must be asked, is who benefits from the
initiative. If the local economy and entrepreneurs are able to receive the primary benefits of such
investments, it is expected that innovations will flourish.

24
5 SCENARIO 1 – PESSIMISTIC OUTLOOK
The first and most likely scenario to persist as adamantly argued by the study participants was that of a
negative outlook for the future leading to 2030. In this scenario, the participants discussed the social and
technological prospects for the country and imagined which position the country could reach by 2030.
Given the afore mentioned social and technological challenges due to our current policies, the participants
found it difficult to imagine that the country could transition from a state of low social cohesion and low
technology advancement. At best, it was suggested that some businesses could leverage some of the
benefits of new technologies, without innovating locally, and therefore move close to the midpoint of low
and high technology advancements.
The arguments in support of this position were the following:
The current ideological neoliberal policy framework, as adopted in South Africa, does not support socially
constructive policies which could support levels of greater digital inclusion, education and skills
development. The influence of business on the South African economy is too strong and therefore does
not support a sufficient level of development necessary to progress socially or technologically. It is in the
interests of businesses to maintain the current status-quo, which support the large outflow of profits from
the economy, due to the emphasis on imports and an unbalanced liberalised trade framework. The
distorted levels of high inequality are consequent of this policy framework.
The economy will remain to be highly concentrated, and it is expected that this concentration will worsen
over time. Such oligopolistic competition does not promote innovation, but rather fosters a dependence
on existing market players. There is a need for greater competition which needs to be inculcated at the
policy level. Small business will struggle to compete in the market due to the high barriers of entry.
It is expected that the business sector will adapt to the levels of skills and infrastructure in the economy.
Businesses are well placed to mobilise and adapt to the environments they find themselves in. The market
has no incentive to change the current trajectory and attempt more creative approaches to absorb greater
numbers of the workforce and respond to the problems of poverty and inequality. Subsequently, existing
monopolies will continue to reap profits in an unchallenged manner. In this environment it is expected
the conditions under which the poor, unskilled and unemployed find themselves will remain largely
unchanged. With the shrinking of the middle class expected to follow, and greater numbers moving into

25
poverty, it is also expected tensions between rich and poor will grow with an expected increase in the
quantity of service delivery protests.
Given this unbalanced trade framework, businesses are unable to compete with international mega-
corporations whom have the opportunity to transact within the borders of the country tax-free, whilst
local small-businesses do not receive such exemptions. The range of goods exported since 1994 remains
largely unchanged and opportunities for expanding exports to international markets are not currently
apparent. Furthermore, local production is minimised due to the country’s dependence on imports.
By emphasising services above manufacturing, the country does not develop its productive capacities.
This has become more difficult for South African based firms to compete in international markets due to
the high barriers to entry in most sectors. Thus, the challenge for local small businesses also applies to the
large corporates attempting to enter foreign markets. The additional challenge that the country must be
wary of is that of buying into the international leapfrogging narrative which argues for the promotion of
digital services, at the expense of physical infrastructure investments. Physical infrastructure remains
necessary to ensure a suitable foundation is laid to promote the future industrial capabilities of the
country in a more inclusive manner.
Further, the impact of digital disruption on work opportunities only accelerates the existing trajectory of
forces impacting the labour market. If businesses follow an evolutionary business model within the
current low competition, low innovation economy, it was expected that greater products/services would
be outsourced to companies beyond the country’s borders, which, for example, would continue the
decline of factory-based workers. The influence of digital disruption simply brings quickens the pace of
this transformation.
The South African Government’s approach to policy making will remain fragmented and convoluted,
inhibiting the effectiveness of policy proclamations. A coordinated policy making framework is needed to
ensure that all role players recognise the importance of this initiative and the need to efficiently use
resources to deliver policy change. Furthermore, progressive policies are irrelevant if they are not
supported by an enabled regulatory environment and effective implementation programme.

26
6 SCENARIO 2 – OPTIMISTIC OUTLOOK
Despite an unlikely prediction, the study participants examined a potential scenario, where the current
policy framework in the country was radically transformed in a manner which promoted inclusive growth
supporting strong social cohesion and the strong adoption of new innovative technologies. This scenario
in many ways can be considered a mirror image of Scenario 1, whereby the policy approach is reversed,
the emphasis on imports is replaced with an emphasis on exports, worker rights are promoted,
competition is high and enabling innovative practices to take a strong foothold.
To reach such a state, the following initiatives are required:
To support a more inclusive growth trajectory, the country needs to firstly abandon a purely neoliberal
policy making approach. This requires the country to take a brave stance in opposition to the international
capitalist norm. Manuel and Luna (2007) outline 3 alternatives to the pure neoliberal framework such as
pure Keynesianism, real Socialism or a 21st Century approach to Socialism. Progressive alternatives are
required which clearly identify the economic and human development goals that a country wishes to
inculcate. Pure Keynesianism still promotes the pursuit of profit, but not through the exploitation of
labour and a reliance on neoliberal austerity programmes. Such a capitalist model which supports worker
protections is favourable to the current approach which reinforces inequality and denies poor basic
human dignities. There is also a need to funnel the existing wealth of the country to the sectors in the
greatest need and also the sectors with the greatest potential to have the widest benefit to the country,
in the long run (towards 2030). Thus, there is a need for more distributive policies.
Under such an ideological shift, structural transformation can become a reality. This would involve
addressing structural weaknesses pertaining to competition, industrialisation, the means of production,
employment creation, social protections, community engagement, high inequality and unsustainable
levels of poverty. Bell, Goga, Mondliwa and Roberts (2017) argue that meaningful participation must
begin with investments in capabilities. Greater capabilities will lead to a more skilled and productive
labour force, who are enabled to compete in local and international markets. Such investments into
capabilities must be incentivised by government to ensure businesses adopt such programmes.
The promotion of manufacturing is central to due to its interdependencies across sectors such as the
motor industry, agriculture and mining, amongst others. By developing the means of production, the
country has a better opportunity to take advantage of technology driven growth. The industries which can

27
be leveraged based on current comparative advantages are within the Metals, Machinery and Equipment,
Automotive Vehicles and Components and Agriculture and Agro-processing sub-sectors. South Africa
possesses indigenous forms of knowledge unique to the country and environment which can be taken
advantage of. Partnerships and business models which support such partnerships between organisations
with expert levels of knowledge will help build a broad coalition for reindustrialisation. Further,
collaboration between government, business and labour will help drive industrial development.
Altruistic technology implementations can make a tangible impact on social cohesion, if such
products/services are delivered with an intention to solve a particular social challenge and not solely to
produce profits. Various examples exist where innovative technology uses can impact communities and
promote levels of human development. For example, services such as mobile banking, mobile health care,
agriculture data centres coupled with call centres to farmers expert advice and e-education programmes
have been implemented with strong results internationally (Davis, 2013). Various other examples exist
highlighting how technology can be socially beneficial and innovative usage of such services can
complement the existing traditional programmes and support an unserved and underserved portion of
society when it comes to service delivery. Innovative technology uses will also take into consideration
options to incorporate technologies which reside within Maslow’s ‘Self Actualisation’ level (discussed
earlier), however, in adopting such technologies, sufficient investment is required to ensure that the
foundational levels of technology are in place, affording innovators the space and opportunity to leverage
new technologies.
Regional development and integration will help drive growth in the SADC and Sub-Saharan Africa region
and across the African continent. With greater development of our neighbouring countries, new
opportunities for growth would emerge. Again, in this instance, leveraging indigenous knowledge will be
beneficial when building such relationships.
Competition law reforms are adopted which lower the barriers to entry for small businesses.
Furthermore, such reforms enable a level playing field allowing local business owners to compete against
international corporates who pay relevant import trade tariffs where necessary, which benefit the
country. Local trade protectionist policies are needed where for example, currently Amazon does not pay
VAT on trade conducted locally as opposed to a South African retailer who must pay tax on business
conducted within the country. Thus, a SA competitor finds it much harder to compete against such
megalithic corporations.
28
With increased healthy competition amongst businesses, innovations will provide the value add that
businesses require for success. Innovation is also fostered through skills development programmes which
are instituted based on the technological demands of businesses. Such programmes must be responsive
to the needs of the labour market, which also requires a re-examination of how a skills development
programme is formed and how students receive necessary certification for undergoing such training.
When developing the innovation programme, it is important that entrepreneurs are supported in the
manner they receive funding whilst also benefiting from a safety net which allows innovators the
opportunity to fail and attempt a new idea.
With the advent of looser employer/employee relations, following from the emergence of the platform
economy, there is a need for stronger labour protections. Labour is too closely coupled with government
in the current power dynamic. This is at the expense of the labour force. Labour must remain resistant to
neoliberal policies and should oppose such initiatives more strongly.
Inclusive platform economies promoting partnerships between experts and people in need will assist in
driving growth, talent development and productivity. However, such platforms should be developed in
such a manner to ensure that the service can manage such partnerships in a sustainable manner. For
example, a jobs recruitment platform could be constructed which engages employers, employees, trainers
and funders. Such a platform could promote the development of workers capabilities whilst developing a
sustainable revenue sharing model allowing all stakeholders to be sufficiently compensated for their
contributions. Such a model transforms existing placement platforms which concentrate on providing low
skilled workers access to low productive jobs without including opportunities for such workers to develop
their capabilities, with the aim of accessing more productive jobs in future.

29
7 POLICY DRIVERS AND KEY FACTORS
During discussions with the study participants, the following drivers and key factors were identified which
would influence change, by affecting social cohesion and technological advancement.
7.1 POLICY COHERENCE
A coherent and coordinated policy approach across the multiple arms of government is essential for social
and technological development. In addition to replacing the existing neoliberal policy framework, it is
important that each department and agency of government clearly understands their mandate. Given
that technological advancement impacts all sectors of the economy, it is still necessary to ensure that
government departments/agencies are able to coordinate their activities in an efficient manner,
particularly when such initiatives fall into a common space shared by multiple stakeholders. For example,
skills development is widely recognised as a driver of change, with multiple departments instituting
training programmes. In such areas, shared programmes are needed to ensure duplication and regulatory
interference is minimised.
When constructing policies, it is important to form a holistic approach which considers policy from the
top-down and also bottom up perspectives. From the top-down, policies are crafted from the perspective
of the central government, which adopts a broad inclusive framework, whilst the bottom-up perspective,
is crafted from the community level, ensuring there is broad consultation and engagements, recognising
how community factors differ at the local level. Thus, a policy implementation framework must consider
the local environment and be refined to account for factors pertinent to a particular community.
Consultation is also required to ensure that knowledge is shared amongst all stakeholders. Cross-sectoral
engagements are beneficial as they promote knowledge sharing.
As discussed in the previous section, policies should concentrate on the following concerns:
• Reducing the barriers to entry for new business entrants and promoting competition
• Promoting innovation
• Promoting regional integration
• Promoting industrial development with a focus on manufacturing

30
7.2 ACCESS AND AFFORDABILITY OF DIGITAL INFRASTRUCTURE
The National Integrated ICT White Paper of 2016 refers to the country’s National Development Plan which
states that the country envisions a connected information society and a vibrant and inclusive knowledge
economy. Infrastructure is essential backbone required to reach this goal, and access to this infrastructure
will help drive further digital inclusion. However, as noted in the ICT White Paper, networks, services,
devices, applications and content must be accessible to all sectors of the population (Department of
Telecommunications and Postal Services, 2016). This policy requires an interconnected approach in
developing the physical network infrastructure backbone of the country in the form of underground and
undersea cabling and through the management and allocation of the spectrum in support of mobile
networks. Further the services that are offered, must be cognisant of the capacity of the network as well
as the devices that all people have access to. In particular, government services made online, need to be
delivered in an inclusive manner understanding the functionality of the such devices. Furthermore, the
applications offered must be designed in a manner which is compatible with the limitation of the device’s
interface. In South African society, where more than half of the population uses 2G phones which support
the USSD interface, more services should be tailored inline with this level of sophistication. In addition,
the content created must also be compatible with the devices that people access.
In line with these considerations, access is also closely associated with issues of affordability, pricing, the
type of device and the relevance of the content. At the international level, the challenges of limited
internet access in South Africa is shared by a number of our G20 partners. For example, South Africa,
China, India and Indonesia all experience low internet access. South Africa, India and China have
approached 50% internet access as at 2015, with steady growth over the previous 5 years (Internet World
Stats, 2017). Furthermore, approximately a third of the World’s disconnected population reside within
the G20, reflecting the burden these country’s carry in addressing issues of the digital divide.
31
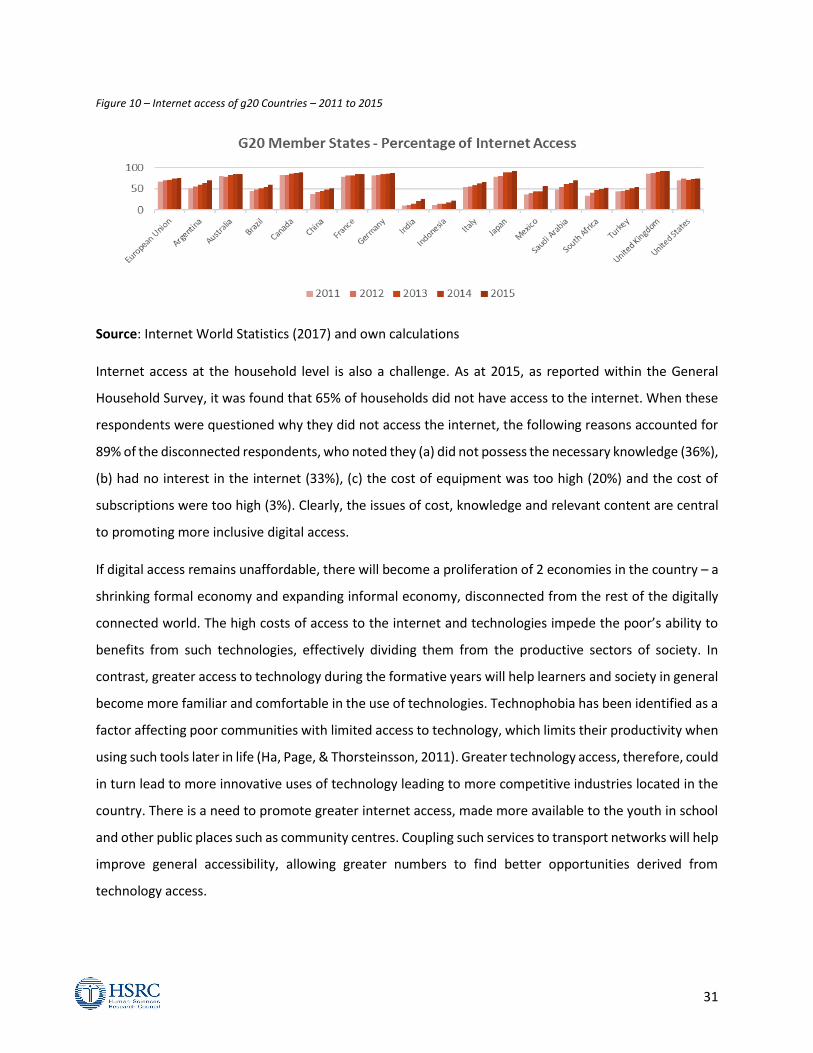
Figure 10 – Internet access of g20 Countries – 2011 to 2015
Source: Internet World Statistics (2017) and own calculations
Internet access at the household level is also a challenge. As at 2015, as reported within the General
Household Survey, it was found that 65% of households did not have access to the internet. When these
respondents were questioned why they did not access the internet, the following reasons accounted for
89% of the disconnected respondents, who noted they (a) did not possess the necessary knowledge (36%),
(b) had no interest in the internet (33%), (c) the cost of equipment was too high (20%) and the cost of
subscriptions were too high (3%). Clearly, the issues of cost, knowledge and relevant content are central
to promoting more inclusive digital access.
If digital access remains unaffordable, there will become a proliferation of 2 economies in the country – a
shrinking formal economy and expanding informal economy, disconnected from the rest of the digitally
connected world. The high costs of access to the internet and technologies impede the poor’s ability to
benefits from such technologies, effectively dividing them from the productive sectors of society. In
contrast, greater access to technology during the formative years will help learners and society in general
become more familiar and comfortable in the use of technologies. Technophobia has been identified as a
factor affecting poor communities with limited access to technology, which limits their productivity when
using such tools later in life (Ha, Page, & Thorsteinsson, 2011). Greater technology access, therefore, could
in turn lead to more innovative uses of technology leading to more competitive industries located in the
country. There is a need to promote greater internet access, made more available to the youth in school
and other public places such as community centres. Coupling such services to transport networks will help
improve general accessibility, allowing greater numbers to find better opportunities derived from
technology access.

32
Figure 11 – Household Internet access of in south africa (2015)
Source: GHS 2015, Statistics South Africa
Figure 12 – reasons for not accessing the internet at home
Source: GHS 2015, Statistics South Africa
When one reviews mobile phone usage trends, one finds that the majority of the population (55%) in
South Africa actually use 2G phones, with limited functionality, as compared to with 34% who possess the
more advanced smart phones. This is in contrast to the trends experienced in the USA in 2015. If greater
33%
36%
3%
20%
3%0% 1%
4%
Reasons for not having internet access at homeLack of interest/no need
Lack of knowledge/skills/confidenceHave access to internet elsewhere
Cost of equipment too high
Cost of subscription too high
Concern about exposure toinappropriate or harmful contentsDo not know
Unspecified
8%
16%
5%
6%
65%
From home From cell phone
From work From elsewhere
No access to internet
Household Access to the Internet
33
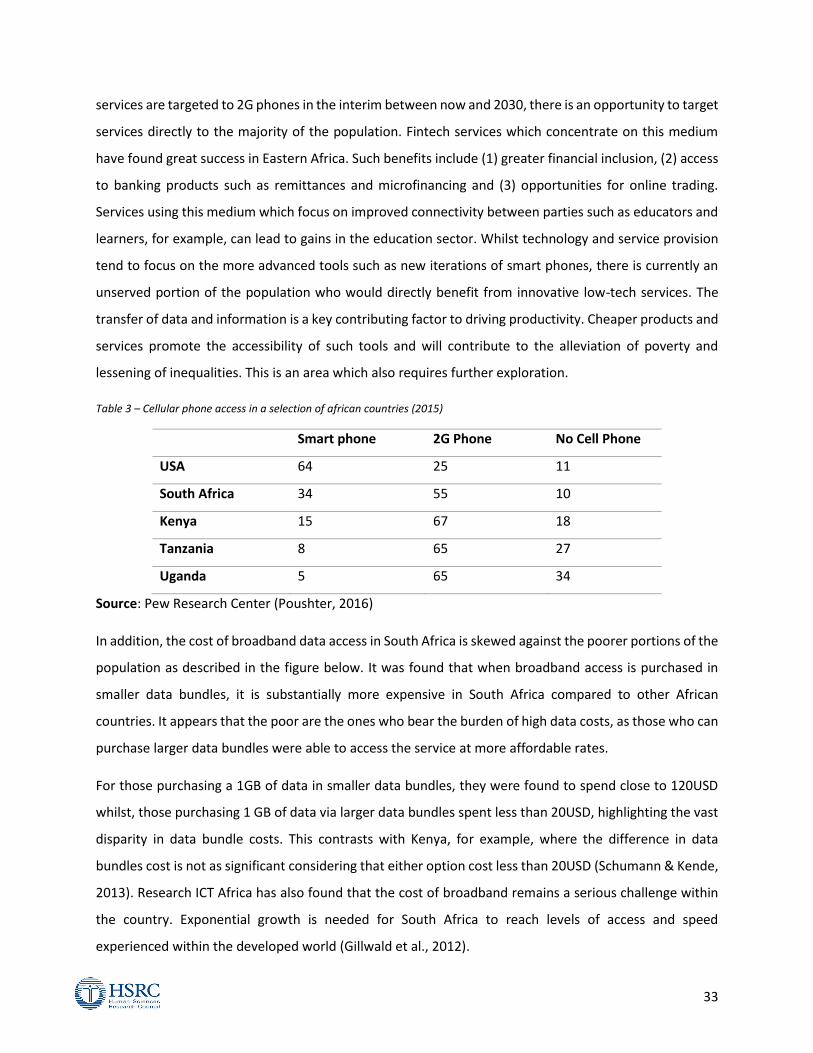
services are targeted to 2G phones in the interim between now and 2030, there is an opportunity to target
services directly to the majority of the population. Fintech services which concentrate on this medium
have found great success in Eastern Africa. Such benefits include (1) greater financial inclusion, (2) access
to banking products such as remittances and microfinancing and (3) opportunities for online trading.
Services using this medium which focus on improved connectivity between parties such as educators and
learners, for example, can lead to gains in the education sector. Whilst technology and service provision
tend to focus on the more advanced tools such as new iterations of smart phones, there is currently an
unserved portion of the population who would directly benefit from innovative low-tech services. The
transfer of data and information is a key contributing factor to driving productivity. Cheaper products and
services promote the accessibility of such tools and will contribute to the alleviation of poverty and
lessening of inequalities. This is an area which also requires further exploration.
Table 3 – Cellular phone access in a selection of african countries (2015)
Smart phone 2G Phone No Cell Phone
USA 64 25 11
South Africa 34 55 10
Kenya 15 67 18
Tanzania 8 65 27
Uganda 5 65 34
Source: Pew Research Center (Poushter, 2016)
In addition, the cost of broadband data access in South Africa is skewed against the poorer portions of the
population as described in the figure below. It was found that when broadband access is purchased in
smaller data bundles, it is substantially more expensive in South Africa compared to other African
countries. It appears that the poor are the ones who bear the burden of high data costs, as those who can
purchase larger data bundles were able to access the service at more affordable rates.
For those purchasing a 1GB of data in smaller data bundles, they were found to spend close to 120USD
whilst, those purchasing 1 GB of data via larger data bundles spent less than 20USD, highlighting the vast
disparity in data bundle costs. This contrasts with Kenya, for example, where the difference in data
bundles cost is not as significant considering that either option cost less than 20USD (Schumann & Kende,
2013). Research ICT Africa has also found that the cost of broadband remains a serious challenge within
the country. Exponential growth is needed for South Africa to reach levels of access and speed
experienced within the developed world (Gillwald et al., 2012).

34
Figure 13 - Cost of broadband access in african countries (2012)
Source: Analysys Mason (2012)
7.3 DIGITAL SKILLS
Managing digital skills development has been identified as a clear lever to manage the diffusion of digital
skills amongst the population. Such training must be targeted to the needs of the population and be
revised in a responsive manner, reacting to the changes in the labour market. There is a need to ensure
the supply of digital skills are suitably aligned to the demands of employers. Education programmes must
be designed in a manner that provides suitable recognition for skills and experience attained. In addition,
often experience is an ignored driver of accessing employment, with many graduates struggling to secure
employment due to their lack of formal experience in a business setting. The idea of nanodegrees was
touted by some respondents as a novel means to adapt the curricula of tertiary education to the needs of
employers. The nanodegree would not replace established university programmes but complement the
existing offerings to students. Such options should be further explored.
Reversing the current trends in the education sector in South Africa, is vital to address unemployment and
improve the quality of life of future generations. Without addressing the supply of skills, businesses are

35
likely to become less innovative, less competitive and ultimately less productive. Not addressing these
challenges will condemn the next generation to a repeat the inter-generational cycle of poverty.
As described in the table below, the following multidisciplinary skills must be promoted to allow a new
entrant to the labour market the opportunity to get access to an entry level position. By being able to
apply skills pertaining to information, computer, media, communication and technology disciplines, to
specific business problems, it is expected that learners will be able to provide greater value to employers,
making them more attractive for hiring (Chetty, Aneja, Mishra, Gcora, & Josie, 2018).
Table 4 – Digital Skills framework – progressing from Literate to Fluent and Master
Skill Set Literate Fluent Master
Information Finding, evaluating,
organising, using content;
Understanding the need
for information;
identifying what type of
information is needed
Synthesising, creating
information
Computer Competence in using
hardware and software
tools; understanding
access controls;
Ability to publish and
communicate using
available tools;
Using spreadsheets and
word-processors
Using IT tools for research
and scholarship,
Ability to evaluate the
benefits of new
technologies
Media Access, navigating and edit
text, sound, image and
video media;
Communicate via media
platforms
Understanding graphic
design principles, the
combination of visuals and
text, the use of sound;
The nature of web
authorship;
Critical analysis and
evaluation of mass media;
Production of multi-media
content;

36
Skill Set Literate Fluent Master
Integrating and
comprehending sensory
experiences
Communication Using and constructing
hyperlinks between
documents and/or images,
sounds, movies, semiotic
languages used in email,
online chat space or in
instant messaging
Producing ‘non-linear’
texts, navigating three-
dimensional worlds online
and so on
Ability to critically analyse
and evaluate ‘non-linear’
texts and three-
dimensional worlds online
Technology Ability to use technology
within life situations
Communicating and
negotiating meaningful
content through the
medium of encoded texts
within contexts of
participation
Ability to adopt, adapt,
invent, and evaluate
technology to positively
affect his or her life,
community, and
environment
Source: Chetty, Aneja, Mishra, Gcora, & Josie (2018)
In addition to progressing from a literate level to a level of mastery, one’s training in these skills must also
capture three key perspectives, viz., the cognitive, technical and ethical perspectives. The cognitive
perspective relates to the manner in which you synthesise, evaluate and create using the skills you
possess. The technical perspective relates to how one accesses, uses, navigates and develops new content
whilst the ethical perspective pertains to what constitutes the appropriate usage of such a skill (Chetty,
Qigui, Gcora, Josie, & Li, 2018).
Table 5 – Digital skills framework – incorporatiing the cognitive, technical and ethical perspectives
Cognitive Technical Ethical
Information
(Digital Content)
Synthesis Access, Usage Appropriate
Usage

37
Cognitive Technical Ethical
Computer
(Hardware and software)
Evaluate Usage Appropriate
Usage
Media
(Text, sound, image,
video, social)
Critique, Create Navigation Assess
truthfulness
Communication
(non-linear interaction)
Critique, Create Develop and use content Appropriate
Usage
Technology
(Tools for life situations)
Invent, evaluate tools Usage Appropriate usage
Source: Chetty, Qigui, Gcora, Josie, & Li (2018)
In developing digital skills training programmes, it is important to recognise the fluid nature of digital skills.
Skills deemed relevant to businesses this year, can possibly be replaced in the next year. Therefore, it is
important that the skills development framework can be reconfigured and adapted in an agile manner.
This requires ensuring that digital training stakeholders work together to ensure that the demands of
labour market are met by the supply of skills from training institutions (Chetty, Aneja, et al., 2018).
Training is required not only for those within the school system, but also those that are currently working
or had left school early. Retraining is necessary, due to the rapid advancements of technology.

38
Figure 14 – Balancing the supply and demand for digital skills
Source: Own work
7.4 THE INFLUENCE OF SOCIO-CULTURAL NORMS
Socio-cultural factors cannot be excluded when developing a digital policy implementation programme.
These factors influence how people engage in training programmes and respond to community
engagement initiatives. For example, the digital gender divide is reflected across statistics of women’s
access to digital technologies, training programmes and various services. It is necessary that policy makers
are aware of the entrenched social attitudes which are pervasive at a community level, and implement
programmes which account for such challenges (Chetty, Aneja, et al., 2018).
For example, if a training facility is frequented largely by males, it is possible that the community attaches
negative connotations of promiscuity to women who visit such facilities, not recognising the value that
the training programme offers in building one’s skills. In India, where such scenarios are prevalent, the
approach has been to hold training programmes which are managed and delivered by women at times
appropriate for a woman to attend given their challenges of ‘time poverty’. To ensure that such
programmes are successful, they must be tailored in line with the actual challenges experienced by
woman in such areas (Asian Development Bank, 2015).
Supply Demand

39
Furthermore, various services afforded to men may not reach women. For example, formal bank account
access in the SADC region reflects that males have a larger number of such accounts, whilst females access
informal bank accounts to a greater extent than men. The underlying reasons for such trends needs to be
examined to understand, what factors stand in the way of woman accessing services where they are
available (Fanta & Mutsonziwa, 2016).
Figure 15 – Formal bank account ownership (left) vs informal account ownership (right) by gender
Source: Finmark Trust (Fanta & Mutsonziwa, 2016)
7.5 LEVERAGING DATA
Data is often described as the ‘new oil’ which drives the digital economy. The ability to extract, store and
analyse data in a manner supporting new and useful insights, drives new business opportunities and
economic growth. Further, the manner in which an organisation is able to leverage these insights can
determine how successful and relevant their business continues to be. The increasingly complex
technology eco-system within which businesses must operate further complicate the manner in which
useful insights can be produced. This complexity can also be seen as an opportunity for small businesses
to compete against large corporates and produce new knowledge and innovative products/services which
are best placed to succeed in the new digital economy. If one considers the world’s largest platforms such
as Google, Amazon, Facebook, Uber, Whatsapp, WeChat and Alibaba, the common denominator across
these platforms is their ability to process data and turn it into useful products and services.
Processing data and statistical trends has always influenced the manner in which an entire sector
operates, for example, agriculture advances are driven by data trends. Data driven innovation in essence
improves business and government efficiency and further has a transformative social quality depending
on how the data is applied (Andrade, Hemerly, Recalde, & Ryan, 2014). Despite the wealth of data which
is produced on a daily basis through connected devices or big data sources, it is also equally important to

40
understand the existing data gaps which prevent us producing relevant insights for those that are not
currently connected. Big data extracted from social networks, for example is produced from those with
internet access and predominantly use a smartphone to do so. Those without access to the internet or a
smartphone are generally excluded. Thus, the trends produced via such sources are biased towards those
with greater financial means to connect to such services. Ultimately, the trends extracted from big data
sources do not portray the concerns or needs of the disconnected population. In going forward, finding
the means to gather data in real-time of those currently offline, will help expose the underlying trends of
the disconnected, and will help produce content more relevant to their requirements. This would help the
current disconnected overcome beliefts that the internet and the digital services have no relevance for
them.
To leverage these trends, there is a need to promote data intensive occupations across all sectors. Data
scientists possess the rare ability to make sense of this vast array of information, and notably the
profession was described as the sexiest job of the 21st Century by the Harvard Business Review (Davenport
& Patil, 2012). The shortage of data scientists, whom are able to merge computer science and statistical
training in a single field, has been found to be a constraint in many sectors within the United States as
well as locally.
7.6 LEAPFROGGING – BALANCING INFRASTRUCTURE DEVELOPMENT AGAINST E-
SERVICES
When we consider leapfrogging implications, we must ensure we do not conflate manufacturing with
services. It is important that we don’t bypass manufacturing in the belief that e-services will provide a
strong basis for development. If we learn from the Indian and Chinese economic model, India promoted
services for the last 2 decades whilst China emphasised manufacturing. By promoting manufacturing, the
country has built a strong foundation to absorb large portions of the population who were low skilled and
poor. This moved a high portion of the country out of poverty. India, in contrast, promoted services, and
has a weak industrial foundation which has not absorbed much of the workforce, ensuring that much of
the population did not benefit from the investment into the services sector. Viswanathan (2017) explains
the challenges that manufacturers experience in India, and many of them follow from an unstable
infrastructure backbone in the country, which is not the norm in China. For example, power availability,
transport network and access to skill labour are not reliable within the country.

41
The study participants firmly believe that promoting services at the expense of manufacturing leaves the
population in state of precariousness. Furthermore, the country does not have the appropriate level of
digital skills to adequately benefit or contribute to the services sector. Accordingly, one must consider the
idea of leapfrogging very carefully when constructing policy. There are benefits to the rollout of digital
services, but one must recognise the weaknesses of certain digital services which cannot replace physical
infrastructure. Thus, the leapfrogging benefits must be critiqued in light of the expected benefits. Such
initiatives should run in parallel to longer term infrastructure development initiatives. Planning
strategically is difficult but necessary.
7.7 GREATER LABOUR PROTECTIONS
Within South Africa, there is a need for stronger labour protections. Currently, the labour unions are too
closely coupled with government through the tripartite alliance of the African National Congress (ANC),
the Communist Party and the Congress of South African Trade Unions (COSATU). Theoretically, one
assumes that the Communist Party and COSATU would provide the necessary checks to ANC led policy
making in the country. In practice, the opposite is found to be true, whereby from an outside perspective,
the unions have had little influence to counter the neoliberal policy direction of the country. Going
forward it is necessary that labour unions play a stronger role and remain resistance to policies which
impede the developmental agenda of the country.
A consequence of digitalisation and the Gig-Economy is the greater precarity of work. It is expected that
salaries will become more infrequent and less dependable. There is a need for stronger worker
protections to stabilise the receipt of salaries. Income will become less dependable resulting in more
people becoming more precariously positioned. Furthermore, it is also expected that workers will be
under pressure to assume greater risks such as the insurance of the assets used to fulfil the core function
of the business. In such scenarios, stronger labour protections are required, to ensure that production
and profits are not promoted at the expense of worker rights. These social challenges may not be unique
to the digital economy, but as the pace of change is rapid, these inherent weaknesses and loopholes in
public policies are exposed at a faster rate.
7.8 OPPORTUNITIES FOR FINANCIAL TECHNOLOGIES
Greater financial inclusion has been widely recognized as a means to assist individuals cope with poverty,
manage expenditure and to start small business enterprises. At the macro level, it assists to boost

42
economic growth through mobilizing greater levels of savings. In addition, greater numbers are drawn
into the formal economy which assists the country in raising tax revenue (Jha, Amerasinghe, & Calverley,
2014). The World Bank supports these points and highlights the importance of Financial Inclusion for
policy makers world-wide considering its potential impact on poverty and prosperity (World Bank Group,
2014).
Given the benefits for the poor, traditional banking facilities present numerous obstacles for indigent
populations, limiting their ability to be formally banked. Various studies highlight these factors as financial
literacy, high transaction fees (particularly with low value transactions), a lack of formal financial products
suited for the needs of low income earners, distances to banks and the high cost of transport and national
policies which inhibit financial inclusion(Plan UK, Barclays, & Care International UK, 2011). The banking
sector has grappled with these challenges and have developed various complex strategies to bridge the
gap between financial exclusion and inclusion. Many of these traditional programmes have been
ineffective, however recent advances in Fintech offer novel opportunities to bridge this gap and provide
practical solutions to combat poverty.

43
8 CONCLUSION
Digitalisation is accelerating the pace of change. Unresolved challenges within policy are revealed much
faster, exposing the weaknesses of government processes in the manner it is able to respond to such
requirements. Although the study’s respondents hold a pessimistic outlook for South Africa’s future
position, opportunities do exist to allow the country to compete internationally with the developed world.
To reach the state of high social cohesion and high technology advancement, the drivers of change
referred to in this paper must be explored in a much deeper manner. The paper seeks to provide an
overview of the key issues that policy makers must consider when constructing a pathway for the country
to deliver on the goals that the New Development Plan has set for 2030. In summary these priorities are:
• Promote industrial development
• Ensure manufacturing in key sectors is promoted.
• Promote higher competition and innovation within the economy
• Support regional development and integration
• Ensure a coordinated policy making environment exists
• Promote digital access and affordability
• Promote a well aligned supply of digital skills in line with the needs of employers
• Promote data scientists and the manner in which data is leveraged by local businesses
• Ensure labour protections are in place.
• Explore opportunities for FinTech

44
9 REFERENCES
Andrade, P. L., Hemerly, J., Recalde, G., & Ryan, P. (2014). From Big Data to Big Social and Economic Opportunities: Which Policies Will Lead to Leveraging Data-Driven Innovation’s Potential? Retrieved from http://www3.weforum.org/docs/GITR/2014/GITR_Chapter1.8_2014.pdf
Asian Development Bank. (2015). Balancing the Burden? Desk Review of Women’s Time Poverty and Infrastructure in Asia and the Pacific. Retrieved from https://www.adb.org/sites/default/files/publication/177465/sdcc-balancing-burden.pdf
Bell, J., Goga, S., Mondliwa, P., & Roberts, S. (2017). Structural Transformation in South Africa : Moving towards a smart , open economy for all 1. Retrieved from https://static1.squarespace.com/static/52246331e4b0a46e5f1b8ce5/t/5addd33103ce64e683a2284d/1524486967239/Executive+Summary+Structural+Transformation+in+South+Africa.pdf
Bhorat, H., & Westhuizen, C. van der. (2012). POVERTY, INEQUALITY AND THE NATURE OF ECONOMIC GROWTH IN SOUTH AFRICA NOVEMBER 2012 POVERTY, INEQUALITY AND THE NATURE OF ECONOMIC GROWTH IN SOUTH AFRICA. Development Policy Research Unit Working Paper, 12(151). Retrieved from http://www.humanities.uct.ac.za/sites/default/files/image_tool/images/36/DPRU WP12-151.pdf
Blankley, W., & Moses, C. (2009). How innovative is South Africa ? South African Journal of Science, 105(January/February), 15–18. Retrieved from http://www.scielo.org.za/pdf/sajs/v105n1-2/a1010502.pdf
BRICS Heads of State. (2018). BRICS in Africa : Collaboration for Inclusive Growth and Shared Prosperity in the 4th Industrial Revolution. Retrieved from http://www.dirco.gov.za/docs/2018/brics0726.pdf
Camarate, J. (2018). South Africa falling behind with digital transformation. Retrieved from https://www.pwc.co.za/en/press-room/south-africa-falling-behind-with-digital-transformation.html
Chetty, K., Aneja, U., Mishra, V., Gcora, N., & Josie, J. (2018). Bridging the digital divide in the G20: skills for the new age. Economics EJournal, 12(24). Retrieved from http://www.economics-ejournal.org/economics/journalarticles/2018-24
Chetty, K., Qigui, L., Gcora, N., Josie, J., & Li, W. (2018). Bridging the digital divide : measuring digital literacy. Economics EJournal, 12(23), 1–20. Retrieved from http://www.economics-ejournal.org/economics/journalarticles/2018-23
Creamer, T. (2017, September). World Bank blames lack of innovation for South Africa’s dismal productivity performance. Creamer Media’s Engineering News. Retrieved from http://www.engineeringnews.co.za/article/world-bank-blames-lack-of-innovation-for-south-africas-dismal-productivity-performance-2017-09-19
Davenport, T. H., & Patil, D. J. (2012). Data Scientist : The Sexiest Job. Harvard Business Review, (October). Retrieved from https://hbr.org/2012/10/data-scientist-the-sexiest-job-of-the-21st-century
Davis, S. (2013). Can Technology End Poverty? Harvard Business Review. Retrieved from https://hbr.org/2013/03/can-technology-end-poverty?cm_sp=Article-_-Links-_-Comment
Department of Finance. (2002). GROWTH , EMPLOYMENT AND REDISTRIBUTION - A Macroeconomic

45
Strategy. Retrieved from http://www.treasury.gov.za/publications/other/gear/chapters.pdf
Department of Science and Technonlogy (DST). (2017). Department of Science and Technology Annual Report 2016/2017. Retrieved from https://nationalgovernment.co.za/department_annual/199/2017-department:-science-and-technology-(dst)-annual-report.pdf
Department of Telecommunications and Postal Services. (2016). National Integrated ICT Policy White Paper. Retrieved from https://www.dtps.gov.za/images/phocagallery/Popular_Topic_Pictures/National_Integrated_ICT_Policy_White.pdf
Department of Telecommunications and Postal Services. (2017). National e-Strategy - Digital Society South Africa. Retrieved from https://www.dtps.gov.za/images/phocagallery/Popular_Topic_Pictures/National-e-strategy.pdf
Fanta, A. B., & Mutsonziwa, K. (2016). Gender and financial inclusion: Analysis of financial inclusion of women in the SADC Region (2016 No. 1). Retrieved from http://www.finmark.org.za/wp-content/uploads/2016/08/gender-and-financial-inclusion.pdf
Gerber, J. (2018). Higher education getting ready for “Fourth Industrial Revolution” - Pandor. Retrieved July 20, 2018, from https://www.news24.com/SouthAfrica/News/higher-education-getting-ready-for-fourth-industrial-revolution-pandor-20180518
Gillwald, A., Moyo, M., & Stork, C. (2012). Understanding what is happening in ICT in South Africa (No. 7). Retrieved from https://www.researchictafrica.net/publications/Evidence_for_ICT_Policy_Action/Policy_Paper_7_-_Understanding_what_is_happening_in_ICT_in_South_Africa.pdf
Ha, J., Page, T., & Thorsteinsson, G. (2011). A Study on Technophobia and Mobile Device Design A Study on Technophobia and Mobile Device Design. International Journal of Contents, 7(2). http://doi.org/10.5392/IJoC.2011.7.2.017
Hinchcliffe, D. (2014). The new digital workplace : How enterprises are preparing for the future of work Select Month. Enterprise Irregulars. Retrieved from https://www.enterpriseirregulars.com/78591/new-digital-workplace-enterprises-preparing-future-work/
Independent Communications Authority of South Africa. (2018). 3rd Report on the state of the ICT sector in South Africa. Retrieved from https://www.icasa.org.za/uploads/files/State-of-ICT-Sector-Report-March-2018.pdf
Internet World Stats. (2017). Internet Usage Statistics. Retrieved July 20, 2018, from https://www.internetworldstats.com/stats.htm
Klees, S. J. (2014). Neoliberal policies destroy human potential and devastate education.
Link, J. (2018). How Digital Disrupted Maslow’s Hierarchy Of Needs. Forbes. Retrieved from https://www.forbes.com/sites/forbeshumanresourcescouncil/2018/07/30/how-digital-disrupted-maslows-hierarchy-of-needs/#c5f480a60d57
Manuel, V., & Luna, I. (2007). From Neoliberalism to Possible Alternatives. Economía Informa, 395, 35–49. http://doi.org/10.1016/j.ecin.2015.10.004

46
McKinsey&Company. (2014). Offline and falling behind: Barriers to Internet adoption. Retrieved from https://www.mckinsey.com/~/media/McKinsey/Industries/High Tech/Our Insights/Offline and falling behind Barriers to Internet adoption/Offline_and_falling_behind_barriers_to_internet_adoption_full report_FINAL.ashx
Mondiliwa, P. (2018). Structural Transformation in South Africa & implications for digital transformation. GEG Africa - UNECA Workshop on Digital Transformatio in Africa.
Netshitenzhe, J. (2013). Why inequality matters: south african trends and interventions. Retrieved from http://www.mistra.org.za/Library/ConferencePaper/Documents/Why Inequality Matters-South African Trends and Interventions.pdf
Ngulube, B. (2014). WHAT IS THE FUTURE OF MANUFACTURING IN SOUTH AFRICA ? Retrieved from https://www2.deloitte.com/content/dam/Deloitte/za/Documents/manufacturing/za_what_is_the_future_of_manufacturing_summary_20082014.pdf
Ntingi, A. (2017). Breaking up South Africa’s cartels. Retrieved July 20, 2018, from https://www.pressreader.com/south-africa/finweek-english-edition/20170309/281517930903870
Orthofer, A. (2016). Wealth Inequality in South Africa : Insights from Survey and Tax Data. REDI 3x3 Working Paper, 15. Retrieved from http://www.redi3x3.org/sites/default/files/Orthofer 2016 REDI3x3 Working Paper 15 - Wealth inequality.pdf
Pienaar, D. (2017). Gaining a competitive advantage in an oligopolistic market.
Poushter, J. (2016). Smartphone Ownership and Internet Usage Continues to Climb in Emerging Economies. Retrieved from http://assets.pewresearch.org/wp-content/uploads/sites/2/2016/02/pew_research_center_global_technology_report_final_february_22__2016.pdf
Ramaphosa, C. (2018). 2018 STATE OF THE NATION ADDRESS. Retrieved from https://www.parliament.gov.za/storage/app/media/1_Stock/Events_Institutional/SONA_2018/docs/2018_SONA_Pamphlet_Final_v2MAIL.pdf
Roberts, S. (2016). An Agenda for Opening up the South African Economy : Lessons from Studies of Barriers to Entry. Retrieved from https://static1.squarespace.com/static/52246331e4b0a46e5f1b8ce5/t/589057b65016e1497f652286/1485854652883/Agenda%2Bfor%2BAction_Overarching.pdf
SA Government News. (2018). New face of manufacturing sector. Retrieved July 20, 2018, from https://www.sanews.gov.za/south-africa/new-face-manufacturing-sector
Schumann, R., & Kende, M. (2013). Lifting barriers to Internet development in Africa : suggestions for. Retrieved from http://www.analysysmason.com/Research/Custom/Reports/Internet-development-Africa-May2013/
Sebake, B. (2017). Neoliberalism in the South African Post-Apartheid Regime: Economic Policy Positions and Globalisation Impact. Retrieved from http://ulspace.ul.ac.za/bitstream/handle/10386/1860/sebake_neoliberalism_2017.pdf?sequence=1&isAllowed=y
South Africa Police Services. (2018). South African Crime Statistics. Retrieved from https://www.saps.gov.za/services/crimestats.php

47
Spaull, N. (2015). Schooling in South Africa: How low-quality education becomes a poverty trap. In A. De Lannoy, S. Swartz, L. Lake, & C. Smith (Eds.), South African Child Gauge 2015. Children’s Institute, University of Cape Town. Retrieved from http://www.ci.uct.ac.za/sites/default/files/image_tool/images/367/Child_Gauge/South_African_Child_Gauge_2015/Child_Gauge_2015-Schooling.pdf
Statistics South Africa. (2017a). General Household Survey 2015 - Statistical Release. Retrieved from https://www.statssa.gov.za/publications/P0318/P03182015.pdf
Statistics South Africa. (2017b). Poverty Trends in South Africa An examination of absolute poverty between 2006 and 2015. Retrieved from https://www.statssa.gov.za/publications/Report-03-10-06/Report-03-10-062015.pdf
Statistics South Africa. (2018). Quarterly Labour Force Survey 2018 Quarter 2 - Statistical Report. Retrieved from http://www.statssa.gov.za/publications/P0211/P02112ndQuarter2018.pdf
The Chartbook of Economic Inequality. (2014). Economic Inequality in South Africa. Retrieved July 20, 2018, from https://www.chartbookofeconomicinequality.com/inequality-by-country/south-africa/
The World Bank. (2018). South African Economic Update. Retrieved from http://pubdocs.worldbank.org/en/798731523331698204/South-Africa-Economic-Update-April-2018.pdf
The World Economic Forum. (2016). South Africa Network Readiness Index. Retrieved from http://www3.weforum.org/docs/GITR2016/WEF_GITR_South_Africa_2016.pdf
Theron, N. (2006). The Competitiveness of the SA Mobile Market - Will the entry of Virgin Mobile increase competition? Retrieved from https://econex.co.za/wp-content/uploads/2015/04/econex_researchnote_4.pdf
UN Habitat. (2010). State of the World’s Cities 2010/2011 - Bridging the Urban Divide. Retrieved from https://unhabitat.org/books/state-of-the-worlds-cities-20102011-cities-for-all-bridging-the-urban-divide/
United Nations. (2010). Human Development Report 2010 The Real Wealth of Nations : Pathways to Human Development. Retrieved from http://hdr.undp.org/sites/default/files/reports/270/hdr_2010_en_complete_reprint.pdf
Viswanathan, B. (2017). Why Is Manufacturing More Expensive In India Than In China? Forbes. Retrieved from https://www.forbes.com/sites/quora/2017/12/13/why-is-manufacturing-more-expensive-in-india-than-in-china/#4664818c6301
Wilkinson, R. (2004). Why is violence more common where inequality is greater? Annals of the New York Academy of Sciences, 1(12). http://doi.org/10.1196/annals.1330.001