future spreads: theory and praxis - university of northampton
TRANSCRIPT

This work has been submitted to NECTAR, the Northampton ElectronicCollection of Theses and Research.
Thesis
Title: Futures spreads: theory and praxis
Creators: Perchanok, K.
Example citation: Perchanok, K. (2012) Futures spreads: theory and praxis.Doctoral thesis. The University of Northampton.
Version: Accepted version
Note: Integration document only - publications redacted
http://nectar.northampton.ac.uk/4963/
NECTAR

Future Spreads: Theory and Praxis
Submitted for the Degree of Doctor of Philosophy At the University of Northampton
2012
Kirill Perchanok
Director of Studies: Professor Nada Kakabadse
1st Supervisor: Professor Nada Kakabadse
2nd Supervisor: Dr Tony Muff
© Kirill Perchanok
This thesis is copyright material and no quotation from it may be published without proper acknowledgement.

Page 2 of 576
Abstract
Many professional traders, hedgers, and institutional investors utilise spread trading to
engage in the futures market. Most of the literature dedicated to futures spreads was
published between the late 1970s and early 1990s, and has partly lost its relevance. This is
because of the emergence of new financial instruments, changed relationships and
regulations within the financial industry and, furthermore, the advent of round-the-clock
electronic trading which has increased the number of players and liquidity of futures
markets many times over (Hull, 2006). Hence, there is a need to explore futures spreads
from a contemporary perspective.
The six publications which form the basis of this PhD examine futures spreads from different
perspectives. They address questions surrounding spreads systematisation, classification and
analysis. The thesis develops a new framework for futures spreads analysis which has practical
application as an investment tool.
This thesis makes a contribution to theory and practice in the area of futures spreads.
The research results could find wide application in the futures industry and of interest to the
research community.

Page 3 of 576
Acknowledgments
I would like to thank Professor Nada Kakabadse, who supervised the process of writing
this PhD by publication integration document. The help and guidance I received during
the writing process is much appreciated and gratefully acknowledged. Her contribution to
Chapters Three and Four in the form of very valuable thoughts, advice and insights
deserves special mentioning.
I am very thankful to my wife Irina. She supported me at all stages of this difficult and
demanding research and writing process. Her encouragement helped me to withstand all
the challenges on this path.
I am also thankful to my parents and especially my mother who always wanted me to become a
highly educated person.
I would like to thank my grandmother for being a live example of human spiritual strength and
readiness to help other people.

Page 4 of 576
Outputs and Dissemination from this Thesis
Refereed Articles
Perchanok, K. and Kakabadse, N. (2012) Causes of Market Anomalies of Crude Oil Calendar
Spreads: Does Theory of Storage Address the Issue? Journal of Futures Markets (under
review).
Perchanok, K. and Kakabadse, N. (2012) Futures Spreads Trading: A Framework for
Effective Analysis. The Journal of Derivatives (under review).

Page 5 of 576
Contents
Chapter One: Introduction 1.1 Introduction 7 1.2 Study Justification 7 1.3 Study Context 8 1.4 Theoretical Foundation and Research Relevance 8 1.5 Research Aim and Objectives 9 1.6 Research Objectives of the Original Studies
that Underpin the Thesis 14 1.7 Thesis Structure 15 1.8 Summary of Chapter One 16
Chapter Two: List of Publications with Paper Summaries 2.1 Introduction 17 2.2 Publications and Summaries 17 2.3 The Inter-Relatedness of the Publications 22 2.4 Summary of Chapter Two 25
Chapter Three: Understanding the Causes of Market Anomalies of Crude Oil Calendar Spreads
3.1 Introduction 26 3.2 Literature Review 26 3.3 Market Behaviour: Contango and Backwardation 28 3.4 Analysis of Crude Oil Calendar Spreads
from the End of 2008 to Mid 2010 34 3.5 Tentative Explanation 42 3.6 Conclusion 47 3.7 Summary of Chapter Three 48
Chapter Four: Development of a Framework for Effective Analysis for Future Spreads Trading
4.1 Introduction 49 4.2 Literature Review 49 4.3 Short Discussion about Efficient Markets Hypothesis (EMH) and
Usefulness of Analysis Performing 52 4.4 Use of Fundamental Analysis in Working with Futures Spreads 55 4.5 Use of Seasonality Analysis in Working with Futures Spreads 60 4.6 Use of Technical Analysis in Working with Futures Spreads 64 4.7 Use of Comparative-Historical Analysis in
Working with Futures Spreads 70 4.8 Critics of Regression-Correlation Analysis in Relation to Spreads 71

Page 6 of 576
4.9 Framework of Co-integration of Different Analysis Types 73 4.10 Conclusion 81 4.11 Summary of Chapter Four 81
Chapter Five: Contribution to Knowledge 5.1 Introduction 82 5.2 Achievement of Thesis Aim and Objectives 82 5.3 Contribution to Knowledge 83
5.3.1 Summary of Contribution 83 5.3.2 How Each Publication Contributed to Theoretical, Practical and Methodological Knowledge 84
5.4 Limitations of the Research 88 5.5 Opportunities for Further Research 88 5.6 Personal Experience of the PhD Research Process:
A Reflective Journey 89 5.7 Summary of Chapter Five 90
References 91
Appendix I: Publications One to Six 103
Appendix II: Co-author Acknowledgements of Contribution 559
Appendix III: Journal Standings 561
Appendix VI: Publication Impact 571

Page 7 of 576
Chapter One: Introduction
1.1 Introduction
The research presented here was conducted between 2008 and 2012. This thesis is based on two
published books and four published articles dated between 2011 and 2012. The introductory
chapter presents the research aims, delineates the scope of this research, establishes its prime
objectives and outlines the structure of this document.
1.2 Study Justification
After I became interested in this subject of futures spreads, I tried to find all available
literature in this regard. To my surprise, only a few books and articles were available that
were devoted to this topic, as compared to the thousands of books that are dedicated to the
stock market. It is a negligibly small number for such a broad subject. Most of the
literature on futures spreads was published during the period extending from the late 1970s
to the early 1990s and are partially no longer relevant today. This is because many new
futures contracts have appeared, which had not existed at that time, and many of the
fundamental factors and interrelations have changed. Moreover, round-the-clock electronic
trading has appeared, as a result of which the number of participants has grown and the
futures market liquidity has repeatedly increased (Hull, 2006). It became clear to me that a
need existed for taking a look at the subject of futures spreads from a modern point of
view.
There are several publications dedicated exclusively to the seasonal analysis of spread
behaviour and its use in formulating trading strategies, which does not constitute the full
investigation of the topic as I saw it. In my view, it was necessary to explore a more
comprehensive approach to the question of using spreads as an investment tool.
Ultimately, it became clear that even simple tasks such as structuring and plotting graphs
are not so easy in the case of spreads. Awareness of the problems described above served
as the principal motive for undertaking the research.

Page 8 of 576
1.3 Study Context
There are various financial market segments. The derivatives market is one of these
segments, and a very large one. The futures market is a part of the derivatives market.
There are many futures, which have different underlying asset classes (Moles, 2004). I
concentrated on the study of futures spreads based on various types of commodities and
equity indices. There is a wide variety of different commodities that are traded in futures
markets. By the volume of transactions, oil and gold futures are principals in these groups.
However, I focused my study mainly on oil and metal futures. The main difference
between these two markets and the stock market is that the price is formed as a result of
supply and demand balancing and not by an investor’s assessment of the company’s
performance. Given the huge turnover volume of the petroleum and precious metals
markets, the price manipulation using insider information is almost not possible. However,
these markets are the subject to the application of large speculative capital, which also has
notable impact on the outright prices. At the same time, a significant number of speculators
utilise in their work futures spreads (Schap, 2005). This has greatly increased spreads
volatility in recent years, increasing both the potential risks and opportunities, offered by
this tool. This makes, in my opinion, futures spreads an interesting and important subject to
research.
1.4 Theoretical Foundation and Research Relevance
The work involved reviewing a wide variety of literature dedicated not only to futures
spreads, but also to futures pricing, fundamental and technical analyses, and capital
management.
Traders deal in futures contracts on a futures exchange. The exchange offers traders, and
via them, the public, a place to buy and sell contracts. Working (1962) identified three
“chief merits” of futures markets which are in the public interest on three accounts. First,
futures markets reduce price variability in cash markets. Second, futures markets provide
“usefulness to handlers of the commodity”. Third, futures markets provide market
information concerning prices to the public (Working, 1953).
Page 9 of 576
Fama and French (1988) used the theory of storage model to explain the behaviour of
futures prices in industrial commodities such as steel, copper and zinc. They showed that
the model can predict the behaviour of metal prices, including normal backwardation.
However, this theory did not allow the assessment of the futures which are based on
various financial assets including stocks, stock indexes and bonds. Numerous authors
(Duffie, 1989; Hull, 2006) have discussed financial futures pricing models. Pricing of
futures based on fixed income securities is an even more complex question which Fabozzi
(2005) addresses.
Practical application of spreads assumes understanding of the mechanics of their
functioning which is based on such concepts as relative price change of one future contract
in relation to another. Works of authors such as Schap (2005), Smith (2000) and Ross
(2006) have contributed to it. Using futures spreads in practice raises a number of issues
related to the structuring of spreads to the investor. Schap (2005) addressed these issues.
Working with spreads requires evaluation of mechanisms that cause the value of the spread
to change. We can analyse these mechanisms by utilising three main types of analysis:
fundamental, technical and seasonal. The research pays close attention to fundamental
analysis based on concepts such as supply and demand, balance between supply and
demand, and supply and demand elasticity. Fundamental analysis examines changes in
fundamental factors that affect the underlying assets. The following authors explored these
issues: Parkin et al. (2005), McConnell et al. (2008). Seasonal analysis is based on a cyclic
nature of temperature, weather, production, and life processes. Many seasonal patterns are
formed by human behaviour. Moore et al. (2006), Ross (2006) and Bernstein (1990)
undertake the study of these patterns in relation to futures spreads. Technical analysis is
one of the most used tools to prognose price movements. This analysis concentrates on the
behavior of price itself, studying primarily historical data and charts configuration. Murphy
(1999), Schwager (1995) and DeMark (1994) cover the technical analysis of futures
markets in their work. Many indicators were developed for the purposes of technical
analysis. One of the most popular is the RSI which Wilder (1978) developed and
described.

Page 10 of 576
1.5 Research Aim and Objectives
Eight years of independent studies reported in six publications (two books and four
articles) underpin this study that proposes new approaches to the work with futures
spreads. The study aims to build and develop a coherent framework for identifying key
factors affecting futures spreads behaviour, which in turn will provide the possibility for
spreads effective use as an investment tool.
Specifically, the thesis objectives are to:
1. Systematise, classify and describe spreads based on the most liquid metal, energy
and index futures contracts.
2. Develop a spread analysis methodology using technical, fundamental, seasonal and
historical comparison analyses.
3. Develop approaches to designing trading strategies based on the use of spreads as
an investment tool.
4. Develop a framework for implementing a practical task of using futures spreads as
an investment tool.
The author based both the thesis’ aims and objectives on his current research and his published
research in two books and four peer reviewed journal articles. The overall research theme in
these separate, but linked studies, is exploratory in nature (see Chapter Two, Table l). The
primary purpose was to gain a deeper understanding of spreads behaviour in order to apply
this theoretical knowledge for practical purposes. The author achieved this through an
investigation of the key factors influencing them.
The first objective focused on systematisation, classification and description of futures
spreads. There are many different spreads, and in order to explore them further it was
necessary to form the groups.
Four major spreads types can be identified:
− Intramarket (Working, 1933; Kawaller et al., 2002; Schap, 2005). A spread
involving simultaneous futures contracts buying and selling for the same

Page 11 of 576
commodity, but with different delivery months is called an intramarket
spread (Working, 1933; Kawaller et al., 2002; Schap, 2005). Probably the
most common spread type, we often call this a calendar spread (Schap,
2005).
− Intermarket (Elfakhani and Wionzak, 1997; Butterworth and Holmes,
2002). Intermarket spreads are comprised of futures that, whilst having the
same underlying commodity, dealers quote and trade on different exchanges
(Butterworth and Holmes, 2002).
− Intercommodity (Wahab et al., 1994; Schap, 2005) spreads. A spread
involving the simultaneous purchase and sale of futures contracts for
different, but related commodities is called an intercommodity spread
(Wahab et al., 1994; Schap, 2005). Thus, it represents a structure consisting
of futures contracts based on different, although more or less economically
related commodities, whose pricing positively correlates. Futures for the
same delivery months typically comprise these spreads which traders quote
on the same exchange, even though other, more complex options are also
possible.
− Processing spreads. This is a more complex spread category that represents
a sort of “paper” replication of the production process and comprises of:
Crack spreads (Haigh and Holt, 2002; Schap, 2005);
Crush spreads (Rechner and Poitras, 1993; Simon, 1999; Schap, 2005);
Spark spreads (Errera and Brown, 1999).
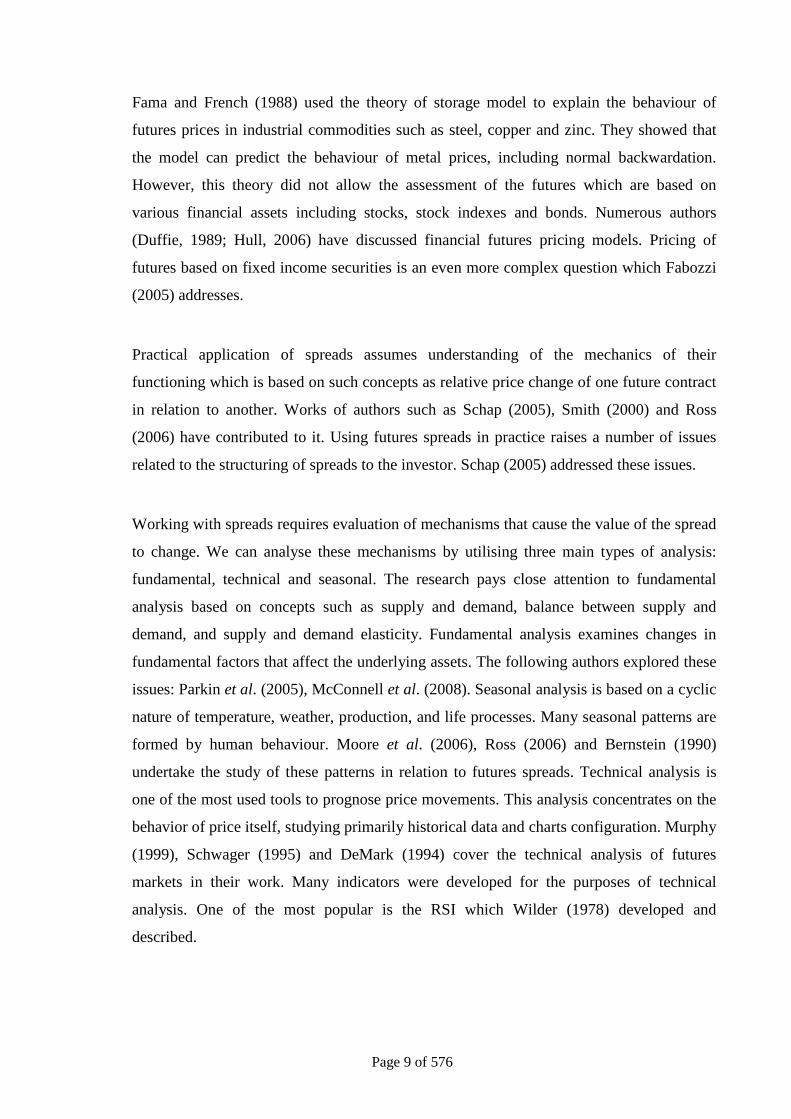
The empirical evaluation of the different spread classes (types) by trade volume and
variety is graphically represented on a Diagram 1.
Page 12 of 576
Diagram 1: Empirical evaluation of the different spread classes (types) by trade
volume and variety.
The above-mentioned spread types are large classes. Within these classes (types), spreads
can be divided into different groups based on the underlying futures. This division into
classes and groups allows us to create a coherent system of analysis of key factors
influencing both the class and the group as a whole and each individual spread within the
group.
For example, there is the class - calendar spreads and the group - financial and energy
spreads. The influence of supply and demand balance, as the determining factor is the key
to energy spreads and practically irrelevant to the financial spreads. Thus, such a
classification best allows us to develop a methodology for spread analysis, which is the
next research objective.
Intramarket spreads (calendar spreads) Intercommodity spreads
Intermarket spreads
Low
Low High
Hig
h
Variety
Vol
ume
Processing spreads: − Crack spreads − Crush spreads − Spark spreads
Not Applicable

Page 13 of 576
Publications 1, 3, 4 and 6 address this objective.
The second objective pays close attention to methods of spread analysis. Spread analysis
is a key to understanding their behaviour and the basis, which allows practical use of
different spread types. There are different spread analysis types, but research findings
(Publications 1, 2) concluded that the most effective for this purpose are the following four
types: fundamental, seasonal, technical and comparative-historical.
Fundamental analysis is based on the following principle: any economic factor which
reduces the supply or increases the demand will increase the price. Vice versa, we see that
any factor which increases the supply or reduces the demand usually leads to stock
accumulation and a fall in prices (Schwager and Turner, 1995; Thomsett, 2006).
Fundamental factors play an important role not only in the case of spreads, but also in the
case of outright futures positions, currencies and shares. Whatever segment of the market
that we may mention, in the long run, these fundamental factors will play a determining
role. However, there is certain difference between spreads and other investment
instruments. In fact, fundamental factors impact spreads much more strongly than other
instruments. Furthermore, fundamental factors also affect spreads much more quickly.
Seasonal analysis is based on life processes and on methods which statistical analysis
employs (Bernstein, 1990; Moore et al., 2006). Essentially, when analysing analogous
historical periods, investors attempt to find recurring patterns, and if they identify the high
recurrence of certain behaviour which prices previously prices exhibited, they assume that
such behaviour is likely to occur in the future. Hence, the longer the selected time span for
analysis, the more credible the analysis pattern and, consequently, the more reasons to
expect that this pattern will repeat itself in the future.
Technical analysis is the study of market dynamics with the purpose of forecasting future
price trends, focused on investment decision-making. (Murphy, 1999) As applied to the
futures market, the term “market dynamics” captures two information sources available to
a technical analyst, namely, transaction prices and transaction volumes. In investigating
price movement and trade volume dynamics, technical analysis puts aside the issuer and
the environment where it operates, that is, knowing the reasons behind price movements is
Page 14 of 576
not absolutely necessary in a technical analysis.
Comparative historical analysis is based on the assumption that under similar
circumstances (fundamental factors) futures prices or spreads should behave in a similar
way (Smith, 2000). It suggests searching for situations in the past that would be similar to
the current one, tracing price behaviour in that historical period, and predicting the
development of the current situation on this basis. Comparative historical analysis
combines fundamental, technical and seasonal analyses.
Publications 1 and 2 address this objective.
The third objective concentrates on the fairly complicated process of designing trading
strategies. Furthermore, this process requires a considerable creative effort, as well as
patience for strategy testing. Once one has tested the designed strategy, one must analyse
the obtained results and optimise the strategy, if necessary. The above considerations also
hold true for designing trading strategies that use spreads as an instrument. However,
dealing with spreads requires a somewhat more profound approach than dealing with
outright positions. The basic difference is that in the former case it is necessary to evaluate
the price behaviour of several positions rather than one. Since the spread is a more
complex instrument, it is much harder to analyse and create trading strategies based on
spread. It is very hard to perform strategy backtesting for spreads using software
applications, such as Tradestation, Amibroker and others. Whilst many of these
applications provide the ability to manage a set of several financial instruments, the
backtesting of spreads, due to their nature, is almost impossible. So, dealing with spreads
will inevitably require the use of other analysis types and has its inherent limitations.
Publications 1 and 2 address the third objective.
Despite the fact that there is some literature dedicated to spreads, most of it focuses on the
practical side of working with them (notable exceptions include Billingsley and Chance,
1988; Board and Sutcliffe, 1996; Butterworth and Holmes, 2002; Kawaller et al., 2002).
There is almost no literature that examines the theoretical aspect of spread functioning
which builds a theoretical framework for implementing a practical task of using spreads as

Page 15 of 576
an investment vehicle. The research’s final objective was to develop such a framework,
which based on the findings of various types of analysis, will identify the main factors that
lead to spreads movement, as well as using this framework to prognose in practice future
spread value changes.
1.6 Research Aims and Objectives of the Original Studies that Underpin the
Thesis
Now, as I have explained in detail the general thesis objectives, it is meaningful to mention
the study objectives of each individual publication that constitute this thesis.
Publication 1 aimed to:
− Systematise, classify and describe spreads based on the most liquid metal, energy and
index futures contracts;
− Develop a spread analysis methodology using technical, fundamental, seasonal and
historical comparison analyses; and
− Develop approaches to designing trading strategies based on the use of spreads as an
investment tool.
Publication 2 intended to:
− Investigate the possibility of applying the RSI indicator to futures spreads.
Publication 3 attempted to:
− Provide an in-depth investigation of the platinum/gold spread; and
− Understand fundamental factors affecting this spread.
Publication 4 endeavoured to:
− Conduct an in-depth investigation of the crude oil calendar spread; and
− Understand fundamental factors affecting this spread.
Publication 5 ventured to:
− Understand the causes of abnormal contango on the WTI crude oil market; and
− Test the theory of storage and cost of carry model as the tool to explain enormous
contangos.

Page 16 of 576
Publication 6 undertook to:
− Provide an in-depth investigation of the spark spread; and
− Understand fundamental factors affecting this spread.
1.7 Thesis Structure
An integration document accompanies the six publications within the final thesis. The
integration document comprises five chapters, references and four appendices.
• Chapter One establishes the aims, objectives and research themes.
• Chapter Two lists the refereed publications and gives a brief summary of each, cross-
referencing them to other closely related publications.
• Chapter Three explores the causes of market anomalies of crude oil calendar spreads,
discusses the theory of storage and provides a literature review.
• Chapter Four discusses different types of spreads analysis. It develops a framework for
effective analysis for future spreads trading and provides a literature review.
• Chapter Five explores whether the research met the original aims and objectives, and
its contribution to knowledge and understanding of questions surrounding futures
spreads. It sets out implications for practitioners, together with both the research
limitations and the opportunities for further research in the field.
• The thesis lists full references to all cited works.
• Appendix I comprises the six publications.
• Appendix II presents co-author affirmations of the author's contribution.
• Appendix III demonstrates the standing of the journals in which this research is
Page 17 of 576
published, showing the relevant editorial review policy.
• Appendix IV contains assessments of the publications’ impact.
1.8 Summary of Chapter One
This chapter has identified the research aims that informed the six submitted
publications and the development of this thesis. It sets outs the underlying research themes
which informed the various studies and which appear in the final framework. In doing so, it
demonstrates the coherence and consistency between research aims and the development of
the thesis.
The next chapter summaries each of the six publications and demonstrates the extent of
their inter-relatedness. In the interests of readability, the thesis adopts a similar format to
this chapter whereby each chapter opens with an introductory statement and closes with a
chapter summary.

Page 18 of 576
Chapter Two: List of Publications with Paper Summaries
2.1 Introduction
This chapter identifies the six publications submitted for the thesis (see Table 1 below). Of
the six publications, two are critically peer-reviewed books and four are articles in critically
peer-reviewed journals. All articles and one book are sole-authored and one book is co-
authored. The current author was the sole or joint initiator of all of the related research projects,
making a contribution, as certified by the co-author, of 70%. Appendix I contains the
complete transcripts of each publication. A summary of all publications is provided in this
chapter, followed by a discussion of the inter-relatedness of the publications, and a chapter
summary.
2.2 Publications and Summaries
As Table 1 indicates, this thesis comprises six submitted publications for assessment. They
all represent detailed research works dedicated to the different aspects related to
futures spreads. These works explore such issues as spreads description, development
of spread analysis methodology and approaches to practical application of spreads as
an investment tool.

Page 19 of 576
Table 1: Publications that form the basis for this thesis
No Publications Appendix
1
Perchanok, K. (2011) Futures Spreads: Classification, Analysis, and Trading (Russian). Moskow: Dashkov & Co (Russia), ISBN: 978-5-394-01316-4 English version, Futures Spreads: Classification, Analysis, and Trading. Charleston: CreateSpace, ISBN: 978-1-466-29016-7
I.1
2 Perchanok, K. and Hrytsyuk, I. (2011) The Encyclopedia of the Indicator RSI (Relative Strength Index). Charleston: CreateSpace, ISBN: 978-1-466-29030-3
I.2
3 Perchanok, K. (2011) Platinum/Gold Spread. Futures Magazine, November, pp. 36–38, ISSN 0746-2468 I.3
4 Perchanok, K. (2011) Crude Oil Calendar Spreads. Futures & Options Magazine, 10, October, pp. 74–79, ISSN 2220-1092 I.4
5 Perchanok, K. (2011) Anomalies in the Behavior of Crude Oil Calendar Spreads. Modern Science: Actual Problems of the Theory and Practice, October, ISSN 2223-2974
I.5
6 Perchanok, K. (2012) Trading Power to Spark Profits (Spark Spread). Futures Magazine, February, pp. 32–34, ISSN 0746-2468
I.6
Publication 1: Perchanok, K. (2011) Futures Spreads: Classification, Analysis,
and Trading (Russian). Moskow: Dashkov & Co (Russia), ISBN: 978-5-394-
01316-4.
English version, Futures Spreads: Classification, Analysis, and Trading.
Charleston: CreateSpace, ISBN: 978-1-466-29016-7 (Appendix I.1)
This book explores in detail the futures spreads, provides their systematisation and analysis
methodology. It consists of seven sections. Because each section represents a relatively
large and in-depth study of a number of issues surrounding spreads, it is necessary to
mention their contents in detail. The first section deals with the basic concepts of futures
markets. Chapter 1 gives an idea of the futures spreads and explains the book’s premise.
Chapter 2 introduces the reader to the futures market history and refreshes the reader’s
memory about the basic concepts used in futures markets.
The second section centres on calendar spreads. Chapter 3 describes such concepts as

Page 20 of 576
“backwardation market” and “contango market”. The remaining chapters of this section
examine a variety of calendar spreads favoured by professional futures traders. Special
emphasis is placed on calendar spreads in the energy market. The final chapter of this
section contains an in-depth study of WTI calendar spreads. This study presents a number
of new interesting ideas and offers a different view on pricing in the crude oil futures
market.
The third section focuses on intercommodity spreads. It describes not only commodity
spreads, but also financial futures spreads. Especially noteworthy in this section is the
chapter dedicated to index spreads, as index futures are the most actively traded and index
spreads are an indispensable part of the professional investment business.
The fourth section examines in detail two interesting volatile intermarket spreads:
NYMEX/ICE heating oil and WTI/Brent spreads. These spreads are very popular with
professional traders, with trading volumes on WTI/Brent spreads continuously increasing.
However, these spreads have received little, if any, coverage in the literature. An in-depth
analysis of the primary causes affecting the behaviour of these spreads was conducted. In
particular, it was found that the following main factors influence the behaviour of the
NYMEX heating oil / ICE gasoil spread: seasonality, freight costs and weather conditions.
In the case of NYMEX WTI crude oil / ICE Brent oil spread, the most influential factors
are: behaviour of prices of futures for both oils, freight costs, and market sentiment.
The fifth section is devoted to processing spreads. Whilst researchers have studied crack
and crush spreads fairly well, the spark spread has only received modest consideration in a
few sources. Despite its recent emergence, this spread has quickly become a must-have
tool for energy traders. The special emphasis is placed on fundamental factors affecting
each particular spread. Rather than limiting myself to just enumerating such factors, I try to
carefully explore how each of them impacts the spread in question. In fact, all the
described spreads are subjected to in-depth, fundamental analysis.
The sixth section is dedicated to the analysis of spreads, describing in detail how traders
conduct fundamental, technical, seasonal and comparative historical analyses.

Page 21 of 576
The seventh section focuses on spread trading, providing a detailed description of
approaches to designing spread trading strategies. The final chapter is a case study of a
spread trade; actually, it sums up the material discussed in the book.
Publication 2. Perchanok, K. and Hrytsyuk, I. (2011) The Encyclopedia of the
Indicator RSI (Relative Strength Index). Charleston: CreateSpace, ISBN: 978-1-
466-29030-3 (Appendix I.2)
This book takes a different approach, and instead analyses the relationship between the RSI
values and the price movement of the underlying asset. In essence, the book examines the
RSI overbought/oversold indicators and the price of the asset, and then analyses the
relationship between RSI and the asset price changes within a time interval. When the RSI
leaves the overbought/oversold area, the underlying asset price change may move counter
to the dominant trend originally behind the initial growth or decline of the RSI.
The book describes financial instruments by category and type: commodity futures, metals
futures, agricultural futures, FOREX, shares index, and spreads and futures for bonds and
shares. With the underlying assumption that the price behaviour of different financial
instruments varies, the book aims to test the relationship between the price change and the
RSI indicator for each financial instrument.
Sections two through nine are dedicated to individual financial instruments. Each section
provides a description of the specific financial instrument as well as the structure of using
the RSI indicator for each category of financial instrument. The section on futures spread
deserves special mention, as the existing literature on futures spread tends not to utilise the
RSI indicator to estimate spread price movements. I suggested a new method of analysing
the RSI, which may be used for underlying assets of any type, and specifically could be
useful in case of futures spreads. In depth study of possibility to employ RSI in the work
with futures spreads is absolute novelty in the literature.
Publication 3. Perchanok, K. (2011) Platinum/Gold Spread. Futures Magazine,
November, pp. 36–38, ISSN 0746-2468 (Appendix I.3)

Page 22 of 576
This article discusses platinum-gold spread. The main idea behind this spread is to profit
from the different behaviours of gold and platinum prices. First of all, this spread is of
interest to the speculators and, to a lesser extent, to the hedgers. The article discusses in
detail following issues: principles of spread structuring, and weighing of the positions by
size and the mechanics of its functioning. The biggest part of this paper is devoted to an in-
depth analysis of fundamental factors influencing this spread.
Publication 4. Perchanok, K. (2011) Crude Oil Calendar Spreads. Futures &
Options Magazine, 10, October, pp. 74–79, ISSN 2220-1092 (Appendix I.4)
This article discusses in detail crude oil calendar spreads Light Sweet Crude Oil (WTI)
(NYMEX). A spread involving simultaneous buying and selling of futures contracts for the
same commodity, but with different delivery months, is known as intramarket spread. The
spread of this type is very often called calendar spread. This is probably the most common
type of spreads. This spread also is of great interest for both speculators and hedgers. The
paper discusses questions surrounding principles of spread structuring, weighing of the
positions by size, functioning mechanics and a method to calculate investment results. The
biggest part of this article is devoted to an in-depth analysis of fundamental factors
influencing this spread.
Publication 5. Perchanok, K. (2011) Anomalies in the Behavior of Crude Oil
Calendar Spreads. Modern Science: Actual Problems of the Theory and Practice,
October, ISSN 2223-2974 (Appendix I.5)
The article discusses crude oil calendar spreads Light Sweet Crude Oil (WTI) (NYMEX).
Since the beginning of trading in these futures, the market has never seen a situation when
contango values exceed carrying charges many times over. However, since 2008, the
market began to observe anomalous calendar spreads behaviour, which this article
describes. It also analyses the causes of such anomalies.
Publication 6. Perchanok, K. (2012) Trading Power to Spark Profits (Spark
Spread). Futures Magazine, February, pp. 32–34, ISSN 0746-2468 (Appendix I.6)

Page 23 of 576
This article deals with one of the least described in the academic and practitioner literature-
processing spreads. This spread is called spark spread. The key idea behind this spread is
to make use of derivatives to trace electricity generation economics. Just as a generator
buys natural gas to produce and sell electric power at a certain gross margin, this process
will be similarly replicated at the "paper" level through purchase of natural gas futures and
sale of electricity futures. This spread is primarily of interest to hedgers, i.e. power
generating companies that wish to fix their margin by selling electricity futures and buying
natural gas futures. Speculators, too, may find the spark spread very interesting due to high
volatility of electric power and gas prices. The article discusses in detail the following
issues: principles of spread structuring, and weighing of the positions by size, the
mechanics of its functioning. The biggest part of this publication is devoted to an in-depth
analysis of fundamental factors influencing this spread.
2.3 The Inter-Relatedness of the Publications
The publications represent the author’s investigative and career-related journey into futures
spreads trading.
The publications are interrelated around the theme of futures spreads, which Figure 1
illustrates in the context of the background literature, methodological approaches and the
development of new approaches (framework) of their practical application as the essential
part of the thesis.
Figure One sets forth the interrelationships.
The publications are closely linked. The first publication was the basis for all the others. All the
issues coined and discussed in the book found further, wider and deeper development in the
subsequent publications. Each of them expanded the original research on different aspects
surrounding futures spreads.
Publications 1, 3, 4, 5 and 6 are focused on the spreads systematisation, classification and
description. Publication 1 describes a wide variety of spreads including intermarket,
intramarket, intercommodity and processing spreads. This publication lays the ground for their
Page 24 of 576
classification and grouping. The next publications concentrate on the individual spreads and
their deeper study. Appropriate systematisation and classification formalise existing
approaches to this issue and more importantly, allows us to identify major fundamental factors
affecting each particular spread. Broad description helps to understand the nature of a spread.
Publications 1 and 2 concentrate on the development of spread analysis methodology. Spread
analysis is a key to understanding their functioning and the basis, which allows practical
use of different spread types. It is essential for any researcher and practitioner to realise
which analysis types they can apply to spreads. In my study, I emphasised attention on the
four which I considered most effective: fundamental, seasonal, technical and comparative-
historical. To conclude appropriate futures spreads analysis, one must understand also how
spot and futures prices in commodity markets are linked. Publications 1 and 5 discuss this
question.
After I describe, systemise and group spreads I conclude with the appropriate analysis and
identify major fundamentals factors impacting each particular spread. This allows us to start to
consider how to apply these results in practice. Publications 1 and 2 discuss the development of
approaches to designing trading strategies based on the use of spreads.
The overall ontological approach which the published papers follow is that of critical
realism allowing the reader to adopt an ontological position encompassing both positivist and
interpretivist epistemology (Cupchik, 2001). This enables one to use both material facts and
patterns interpreted through human activity, within the context of an epistemology spanning
both quantitative and hermeneutic traditions. This approach is consistent with the existing
body of research within futures pricing theory, fundamental and seasonal analysis, technical
analysis, spreads structuring and mechanics, within each of which seminal contributions reflect
both the positivist and interpretivist paradigms, and, in turn, use quantitative and qualitative
research methods (Buckley, 2002; Barnes, 2001; Creswell, 2003; Wright and Ricks, 1994).
In particular, the author has employed a range of research methods in the submitted
publications, including:
− Fundamental analysis essentially comes down to applying a few basic economic
concepts. The balance between supply and demand plays the decisive role in the

Page 25 of 576
pricing of different commodity groups. The determination of fundamental factors
affecting particular spreads takes place by periodically referring to macroeconomic
concepts.
− The Dow Theory and technical analysis methods. Technical analysis is an important
tool for studying financial markets and is one of the key mechanisms for making
trading decisions in the futures market. Financial scholars and practitioners have
developed and described in detail dozens of tools to assist in decision-making. This
work uses some of them.
− Analysis and evaluation of statistical data published by various government agencies,
including the EIA, the Federal Reserve System, data from the ECB Statistical Data
Warehouse, the International Monetary Fund and the US Department of Agriculture.

Page 26 of 576
Figure One
Theoretical Foundations
Publications Research Methodology
Context
Futures pricing theory Fama and French, 1988; Duffie, 1989; Fabozzi,
2005; Hull, 2006
Fundamental and seasonal analysis
Bernstein, 1990; Parkin et al., 2005; Moore et al.,
2006; Ross, 2006; McConnell et al., 2008;
Technical analysis Wilder, 1978; DeMark, 1994; Schwager, 1995;
Murphy, 1999
Spreads structuring mechanics
Smith, 2000; Schap, 2005; Ross, 2006
Spreads description, classification
1. Perchanok, 2011 3. Perchanok, 2011 4. Perchanok, 2011 5. Perchanok, 2011 6. Perchanok, 2012
Development of spread analysis methodology
1. Perchanok, 2011 2. Perchanok and Hrytsyuk, 2011 5. Perchanok, 2011
Development of approaches to designing trading strategies based
on the use of spreads 1. Perchanok, 2011 2. Perchanok and Hrytsyuk, 2011
New framework of practical application of futures spreads as an investment tool
Scientific/positivist approach
Black, 1999; Blaikie, 2003
Hermeneutic/inter-pretivist approach
Ryan et al., 2002

Page 27 of 576
2.4 Summary of Chapter Two
This chapter summarised six publications. Two critically peer-reviewed books and four
articles investigated different aspects of futures spreads. Five broad findings emerged:
• Spreads are a much more sophisticated tool than futures.
• All analysis types must be used for successfully applying spreads as an
investment vehicle.
• Fundamental factors are the main driving force in spread behaviour.
• Some of the traditional futures spreads pricing models must be revised and
amended due to the recent changes in the market (specifically, the cost of carry
model).
• Increased number of algorithmic programs as the market participants leads to the
increasing importance of technical analysis methods for the successful use of
spreads as an investment instrument.
The publications were summarised to show how they linked together as a coherent and sustained investigation of different issues surrounding futures spreads. Their interrelatedness was shown in relation to the underlying themes of spreads classification, systematisation, analysis and practical application. Building on these areas, the following chapters critically explore in detail the background literature to the publications and to the thesis.

Page 28 of 576
Chapter Three: Understanding the Causes of Market Anomalies of Crude
Oil Calendar Spreads
3.1 Introduction
One of the theoretical foundations of my thesis is the issues surrounding price formations
on the futures markets. The theory of storage is a cornerstone theory which addresses some
of these issues. This theory also plays an important role for the market of crude oil
calendar spreads.
Beginning with the 2008 financial crisis, crude oil futures market participants began to
observe situations where contango spread values exceeded carrying charge amounts many
times over and lasted relatively long. The chapter describes these unusual occurrences on
the example of the behaviour of crude oil calendar spreads and analyses the causes for such
anomalies. Moreover, most researchers have focused on studying the market in a state of
normal backwardation, paying much less attention to the market in contango. The recent
appearance of “wild” contangos of anomalous dimensions in the futures markets shows
that the theory of storage and the cost of carry model requires revision in order to align the
model’s theoretical foundation with the empirical observations. This chapter’s main aim is
the desire to draw attention to the need for updating the theory of storage and the cost of
carry model. In addition, the chapter also examines the causes of the phenomenon of
“wild” contangos in the futures markets.
This chapter demonstrates the standing of my research in relation to other works in this
field.
3.2 Literature Review
The theoretical foundation for modelling the price dynamics of crude oil futures and spot
markets is based on the theory of storage and the co-integration of these two markets via
arbitrage. The theory of storage (Working, 1948, 1949; Brennan, 1958; Telser, 1958;
Williams, 1986) has played a dominant role in explaining the pricing relationship between

Page 29 of 576
futures and spot markets, as well as the relationship between futures of different maturities.
The theory of storage states that the price difference between the price of purchasing the
commodity today (spot) and futures (i.e. the basis) or the difference between two futures
contracts (i.e. the spread) depends on three elements: (1) the cost of storage; (2) the
convenience yield; and (3) the risk premium for holding inventory (Ates and Wang, 2007).
The magnitude of the convenience yield depends on the level of inventory and demand
shocks.
Most of the previous work (Brennan, 1958; Gray and Peck, 1981; Fama and French, 1987,
1988; Ng and Pirrong, 1994; Pindyck, 1994; Gao and Wang, 2005) applied the theory of
storage to explain the intermarket dynamics of spot and futures prices and their relative
volatility for non-energy storable commodities. In general, the results suggest that
intermarket behaviour of price dynamics and relative volatility are consistent with those
implied from the theory of storage.
Different authors, including Cho and McDougall (1990), Ng and Pirrong (1996) and
Susmel and Thompson (1997), have researched the application of the theory of storage for
modeling price variations in energy commodities. In particular, Cho and McDougall
(1990) examined the relationship between variation in the basis and the level of inventory
in the crude oil, gasoline and heating oil markets.
As an integral part of the theory of storage that allows modelling price formations on
futures markets could be used the cost of carry model (Moles, 2004; Hull, 2006).
Theoretically, the equilibrium futures price should be equal to the spot price, plus the cost
of carry, which is defined as the sum of the cost of storage, plus the interest rate (Chance,
1991). According to the cost of carry model, the basis (basis = spot price – futures price)
cannot exceed the cost of carrying the physical commodity, which mainly consists of
financing and storage costs. Thus, when the basis is equal to the cost of storage, the market
is said to be at full carrying charges. According to the theory of storage, the futures market
seldom reaches a “full carry” situation because any excess of this value will create
opportunities to implement arbitrage strategies (i.e. strategies that are practically risk-free
for the investor and that are based on a temporary market imbalance), (Hull, 2006). Later, I

Page 30 of 576
will describe in greater detail the arbitragers’ role. Moreover, some researchers, including
Anand (2000), argue about the impossibility of full carry markets.
In 2008, crude oil futures market participants began to observe situations where the
contango spread values exceeded the carrying charge amount many times over. This lasted
relatively long(first time-about three months). This chapter illustrates these unusual
occurrences on the example of the behaviour of crude oil calendar spreads and analyses the
causes for such anomalies.
Starting with Working (1948, 1949) onwards, the majority of scholars have focused on
studying the market in a state of normal backwardation (i.e. when the basis is positive),
paying much less attention to the market with a negative basis, (i.e. contango). The recent
appearance of “wild” contango of anomalous dimensions in the futures markets shows that
the theory of storage and the above mentioned cost of carry model require a revision in
order to align its theoretical foundation with empirical observations (Publications 1, 5). The
desire to draw attention to this issue was the main purpose of this chapter. In addition, the
author set the task of understanding the causes of this phenomenon.
The chapter is structured as follows: the first part discusses the theoretical foundation of
contango and backwardation concepts, as well as the role of arbitrageurs in the co-
integration of futures and spot market. The second part concentrates on analysis of crude
oil calendar spreads from the end of 2008 to mid 2010. The third part contains results and
the fourth part – conclusions.
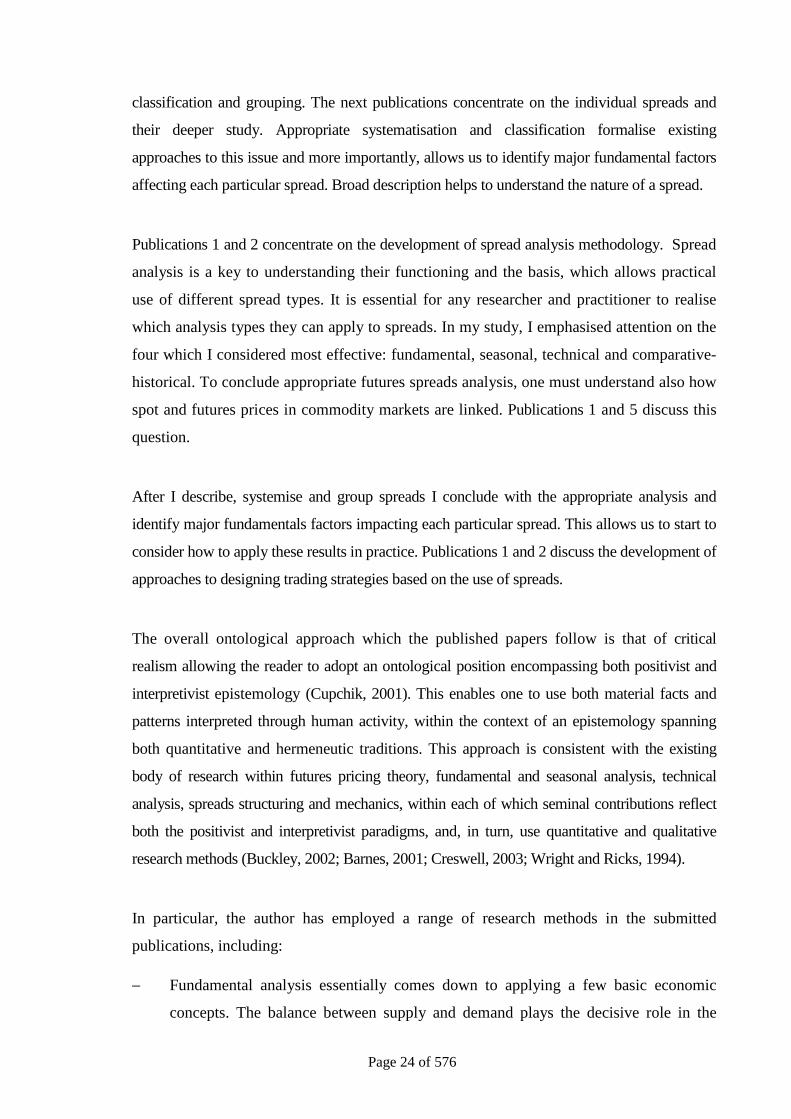
3.3 Market Behaviour: Contango and Backwardation
Contango is a price situation in which futures prices exceed spot prices (prices in the
physical market). Accordingly, backwardation is a market condition in which spot prices
exceed futures prices. So, if a market is in contango, the basis will be negative as the
futures price will be higher than the spot price, while in a backwardation market the basis
will be positive as the spot price will exceed the futures price (Moles, 2004; Publication 1).
Figure 2 graphically illustrates contango pricing.
Page 31 of 576
Source: Publication 1; Moles (2004)
Figure 2: The basis is negative and the market is in contango.
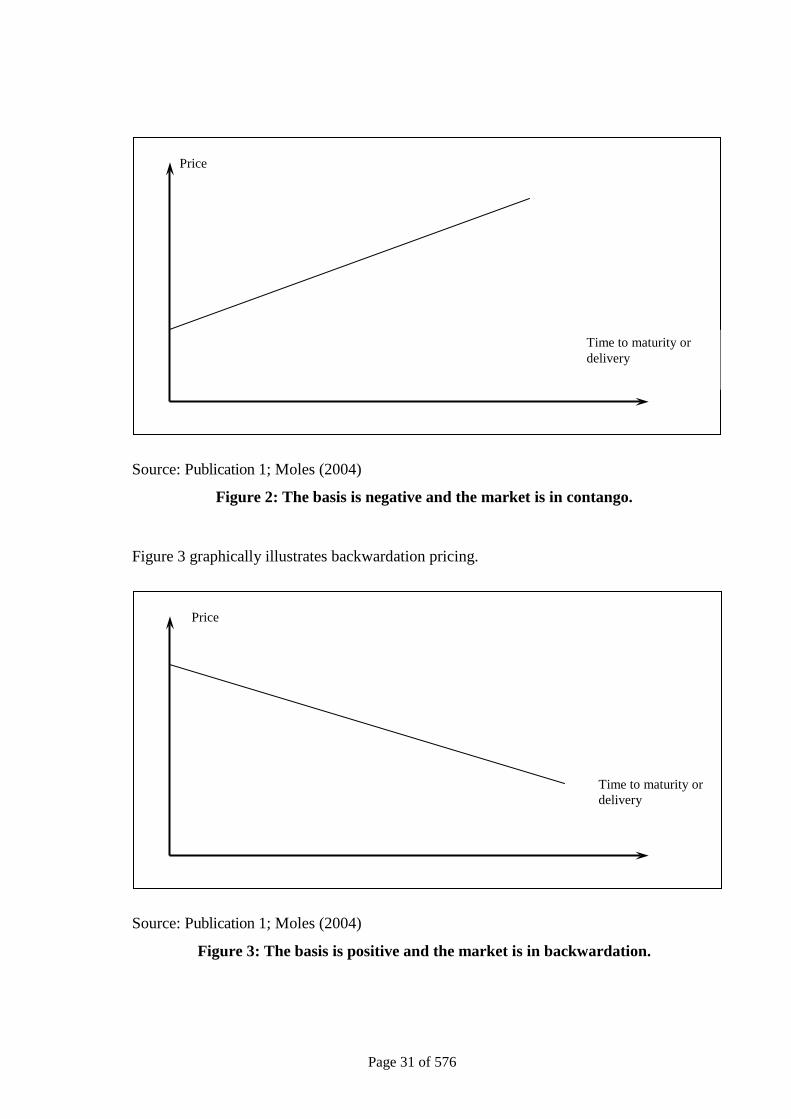
Figure 3 graphically illustrates backwardation pricing.
Source: Publication 1; Moles (2004)
Figure 3: The basis is positive and the market is in backwardation.
Time to maturity or delivery
Price
Price
Time to maturity or delivery

Page 32 of 576
To better understand this, let us refer to the futures pricing theory and, in particular,
examine commodity markets. So, according to the cost of carry model for pricing futures,
the relationship between the futures price and the spot price can be expressed by the
following equation: (Black, 1976; Hull, 2006)
rTeSF 00 = , (1)
where 0F is the futures price, 0S is the spot price, e is exponential, r is the risk-free rate,
and T is time to contract maturity.
This formula reflects the futures price when no other expenses are incurred except
financing costs. Since we are speaking about commodity futures, it is evident that in
addition to certain financial carrying costs there will be some storage costs. Therefore, to
account for these storage costs, the equation is expanded (1). As a result, we obtain the
following formula:
TureSF )(00
+= , (2)
where u is the annual storage cost that is proportional to the spot price.
By using this formula we can easily compute the futures price based on the known spot
price, risk-free rate, carrying costs and time between the spot price and the futures price.
Thus, if the futures price is equal to the theoretical price derived from the equation (2), a
market is in “full carry”, i.e. the futures price fully reflects the costs of storing and
financing the commodity. However, this is not always the case, and futures prices are often
below “full carry”. Moreover, commodity markets often become “inverted”. Whereas the
situation in a contango market is more or less clear, for a backwardation market, the above
equation (2) seems slightly inaccurate. The formula should be expanded (2) by adding a
convenience yield (Kaldor, 1939; Brennan, 1958; Telser, 1958). As a result, the formula
(2) will look as follows:

Page 33 of 576
TyureSF )(00
−+= , (3)
where y is the convenience yield.
The introduction of the convenience yield concept helps to understand how price formation
occurs in a backwardation market. If r+u, i.e. storage costs plus financing costs, is greater
than the convenience yield у (r+u>y), then the market will be in contango. If the
convenience yield exceeds full carrying cost, i.e. y>r+u, then the market will be in
backwardation.
So, what does convenience yield mean? Convenience yield is the benefit of holding
physical goods in the spot market. The essence of this concept is probably easier to explain
with an example. Let’s assume that, in anticipation of a sharp increase in demand for
heating oil, a petroleum product trader will prefer holding a physical commodity rather
than futures contracts for heating oil. For instance, this may take place when unusually
cold weather sets in at the end of winter, when heating oil inventories are nearly exhausted
and heating oil spot prices may surge, shifting the market from contango to backwardation.
Another example is a drastic rise in wheat prices caused by loss of a major part of a futures
crop due to drought, heavy rains or other natural calamities. In other words, the
convenience yield can be described as the benefits of holding the commodity in the spot
market (Brennan, 1986; Publication 1).
Studies based on the storage model relate the convenience yield directly to the level of
inventories (Fama and French, 1988). Generally, the theory of storage suggests that the
marginal convenience yield falls with inventory, but at a decreasing rate (Brennan, 1958;
Telser, 1958; Fama and French, 1988). At low levels of inventory, the marginal
convenience yield is larger than carrying costs and the spot – futures price spread is
positive. As the level of inventories goes up, the marginal convenience yield falls towards
zero and the spot – futures price spread becomes negative and converges towards the cost
of carry. Pindyck (1994) suggests a convex relationship between the convenience yield and
stock levels with the marginal convenience yield rising rapidly as inventories approach
zero and remain close to zero over a wide range of moderate to high stocks. Some models
consider a non-linear relationship with the marginal convenience yield rising at low level

Page 34 of 576
of inventories and then declining in a non-linear manner to zero. At sufficiently high
inventory levels, the marginal storage becomes increasingly expensive as storage facilities
reach full capacity levels and the marginal benefit from adding stocks becomes zero
(Larson, 1994).
Note that the convenience yield only applies to commodity markets where the physical
commodity can appear to be in short supply, causing a short-term rise in prices. Normally,
this concept does not apply to financial markets. Take, for example, stock index futures. It
is obvious that there can be no shortage or short supply (Publication 1).
The following conclusions can be drawn about the features of the contango and
backwardation markets. The carry in a contango futures market nearly covers all storage
costs, encouraging market players to hold the commodity and sell it in the future rather
than in the spot market. On the contrary, the price situation in a backwardation market
encourages withdrawal from storage and sale of commodities in the spot market at current
prices. Empirically, this means that in a contango market players expect future prices to
increase above current prices, while in a backwardation market current prices exceed
possible future prices (Publication 1).
Now that I have discussed the relationship between futures and spot prices in detail, let us
briefly discuss what contango and backwardation markets mean for spreads. In a contango
market, contracts for near-month delivery are cheaper than contracts for more distant
months. In a backwardation market, the situation is the opposite (Schap, 2005; Publication
1).
A description of the concept of contango and backwardation would be incomplete without
mentioning the theoretical role of arbitrageurs and arbitrage strategies, through which
futures and spot market co-integration occurs. Hull (2006) describes such strategies in
detail.
If we turn to formula (2) and assume that U - storage cost is disproportionate to the spot
price, then we obtain the following formula:

Page 35 of 576
rTeUSF )( 00 += , (4)
Consumable commodities, rather than investment assets, usually do not bring interest, but
may require significant storage costs. Consider the arbitrage strategies which are used to
calculate the futures prices of goods on the basis of spot prices. Assume that (4) is not
satisfied and the inequality is valid
rTeUSF )( 00 +> , (5).
To take advantage of this opportunity, the arbitrageur could use the following strategy:
1. Get a loan of US +0 under the risk-free interest rate and buy one unit of
the commodity by paying the cost of storage.
2. Conclude a forward contract to sell the commodity unit.
If we think of a futures contract as a forward, this strategy will lead through a period of
time t to a profit equal to rTeUSF )( 00 +− . This strategy can be easily implemented for
any product. However, if the arbitrageur will do so, the price of 0S will grow and the price
of 0F will fall until the inequality (5) does not change its sign. Consequently, (5) can not
hold indefinitely.
Suppose further that
rTeUSF )( 00 +< , (6).
Investors tend to use many types of investment assets such as gold or silver solely for
investment. If the case of the inequality (6), the arbitrageur can implement the following
strategy:
1. Sell the commodity to compensate the cost of storage, and invest under a
risk-free rate.
Page 36 of 576
2. Conclude a forward contract to purchase the commodity.
As a result, at the contract’s expiration the arbitrageur will make a profit, which is
00 )( FeUS rT −+ exceeds the investor’s profits who just held the stored commodity.
Consequently, (6) can not hold indefinitely. So, because of (5) and (6) cannot happen for a
long time, we conclude that rTeUSF )( 00 += .
For commodities unused for investment purposes, these arguments are unfounded.
Individuals and companies storing goods in warehouses do so because of their consumer
value rather than their investment attractiveness. They are reluctant to sell physical goods
and avoid buying forward contracts, because they cannot spend forward contracts.
Consequently, there are no barriers to inequality (6). Thus, for the consumed commodity
can be asserted that
rTeUSF )( 00 +≤ , (7).
If the cost of storage is directly proportional to the spot price, the inequality
TureSF )(00
+≤ , (8).
3.4 Analysis of Crude Oil Calendar Spreads from the End of 2008 to Mid 2010
Trading in Light Sweet Crude Oil (WTI) futures takes place in New York on the NYMEX
Exchange. The contract size is 1000 barrels (42000 gallons), minimum price increment:
$0.01 per barrel ($10.00 per contract), ticker: CL. More detailed specifications of this
contract can be found on the CME Group (2012) website.
A spread involving simultaneous buying and selling of futures contracts for the same
commodity, but with different delivery months, is known as intramarket spread (Working,
1933; Kawaller et al., 2002; Schap, 2005; Publication 4). The spread of this type is very
often called a calendar spread (Schap, 2005). This is probably the most common spread
Page 37 of 576
type. According to the convention adopted by the CME (CME Group, 2012), the purchase
of a crude oil calendar spread would mean buying a nearby contract and selling a distant
contract; whereas, a spread sale would mean buying a distant month contract and selling a
nearby one.
For a long time researchers expected that the oil market should trade in backwardation
most of the time, meaning that the price of the front month’s futures contracts should be
higher than the price of more remote contracts. For example, Litzenberger and Rabinowitz
(1995) report that from 1984 to 1992, backwardation in the crude oil markets occurred
over 70% of the time. Using futures data on crude oil, heating oil and gasoline from
roughly the same period, Edwards and Canter (1995) reported that energy markets show a
high frequency of backwardation.
There are several theoretical arguments for backwardation that are common in energy
markets. One argument based on the theory of storage points to the role of the convenience
yield (Working, 1948; Brennan, 1958). Convenience yield exists because inventories
provide holders with consumption/production flexibility. Markets are in backwardation if
the convenience yield, net of storage costs, exceeds the interest rate. This is likely to
happen when the supply level is low and thus, spot energy prices are high (Charupat and
Deaves, 2003).
From the perspective of the theory of storage argument, energy markets have
characteristics that make them prone to short supply and thus, backwardation. A shortage
of storage facilities, an uncertainty in OPEC production decisions and, especially for
heating oil and gasoline, seasonal spikes in demand, all contribute to the markets generally
being in short supply. Therefore, it is reasonable to expect backwardation to be the norm in
energy markets. Figure 4 shows a chart of crude oil two-month spread over the period from
1997 to 2010.

Page 38 of 576
-10,00
-8,00
-6,00
-4,00
-2,00
0,00
2,00
4,00
02.0
1.97
02.0
1.98
02.0
1.99
02.0
1.00
02.0
1.01
02.0
1.02
02.0
1.03
02.0
1.04
02.0
1.05
02.0
1.06
02.0
1.07
02.0
1.08
02.0
1.09
02.0
1.10
Source: U.S. Energy Information Administration (2012a)
Figure 4: Chart of Crude Oil Calendar Spread between Two Consecutive Months.
The above chart illustrates that the spread values were both positive and negative during
this period; in fact, the market actually alternated between contango and backwardation.
Moreover, the market was in contango more than 50% of the time. Another interesting fact
is that between 1997 and 2008, the average value of this spread was close to zero and the
spread represented a fairly stable price structure, fluctuating within a range of max +2 and
min -2, with long contango periods giving way to equally long periods of backwardation.
In the second half of 2008, the market went into contango, and beginning from mid-
October 2008, we could see a sharp widening of the spread, which reached a local peak on
December 19, when the spread between the front month and the next one future contracts
was $-8,49 per barrel. During several days preceding the expiry date of the nearest month
futures contract, the spread narrowed dramatically to almost $-2,82. Towards the end of
December 2008, and the beginning of January 2009, we could again see the spread sharply
widen to $-8,14 and reach the local peak on January 15 (see Figure 5).

Page 39 of 576
-10,00
-8,00
-6,00
-4,00
-2,00
0,00
2,00
4,00
02.09
.08
16.09
.08
30.09
.08
14.10
.08
28.10
.08
11.11
.08
25.11
.08
09.12
.08
23.12
.08
06.01
.09
20.01
.09
03.02
.09
17.02
.09
03.03
.09
17.03
.09
31.03
.09
14.04
.09
28.04
.09
12.05
.09
local peak on 19.12.2008 local peak on 15.01.2009
Source: U.S. Energy Information Administration (2012a)
Figure 5: Chart of Crude Oil Calendar Spread between Two Consecutive Months
over the Period from September 2008 to May 2009.
Then, we see an abrupt return to the initial position over a short time before the expiry of
the nearby contract. This scenario repeats itself once again in February 2009. The spread
spent all of 2009 in contango.
In December 2008, and at the beginning of 2009, the spread sharply widens on the back of
aggressive reductions in oil prices (see Figure 6).

Page 40 of 576
Source: eSignal
Figure 6: Chart of Oil Prices between 1994 and 2010.
As mentioned in the introduction, in the accordance with the cost of carry model, the basis
(basis = spot price – futures price) cannot exceed the cost of carrying the physical
commodity, which mainly consists of financing and storage costs (Hull, 2006). Thus, when
the basis is equal to the cost of storage, the market is at full carrying charges. According to
the theory of storage (e.g. cost of carry model), the futures market seldom reaches a “full
carry” situation because any excess of this value will create opportunities to implement
arbitrage strategies (arbitrage strategies are defined as strategies that are practically risk-
free for the investor and that are based on a temporary market imbalance). Therefore, the
situation which occurred between December 2008, and February 2009, was, in fact, such
an imbalance. According to the existing theory of storage, arbitrageurs should have quickly
erased the discrepancy by actively purchasing nearby futures and selling distant ones
simultaneously. Thus, the arbitrageur accepts delivery under the purchased contract, pays
all storage and financing costs, and makes delivery under the back month expiration
contract (Publications 1, 5).
Arbitrage profit is equal to the difference between the value of two futures contracts and
the actual cost of storage. Theoretically, it constitutes a risk-free profit. The presence of
arbitrage opportunities should also limit the upside of contango, both in volume and in
time. Despite the theoretical model, a market imbalance is observed, whereby the spread
value exceeds full costs by several times. This situation lasted a few months in 2008, 2009

Page 41 of 576
and 2010, which is not at all characteristic for arbitrage models. I tried to find an
explanation for this phenomenon in several different sources.
Many authors (Cho and McDougall, 1990; Ng and Pirrong, 1996; Susmel and Thompson,
1997) refer to the base theory, analysing the correlation between an increase in oil
inventories, the difference between spot prices and futures contracts, and spread between
various futures contracts. What this research study basically reveals is that an increase in
oil inventories leads to reduced oil prices, and pushes the market into contango.
Developing this logic, it can be asserted that in a contango situation, futures prices cover
storage costs, thus stimulating future increases in inventories in storage, which, in turn,
deepen the contango. In fact, we observed this process when Cushing crude oil inventories
swelled from approximately 14.4 million barrels in October 2008 to 35 million barrels by
the middle of February 2009 (see Figure 7).
0
5000
10000
15000
20000
25000
30000
35000
40000
45000
16.1
1.07
16.1
2.07
16.0
1.08
16.0
2.08
16.0
3.08
16.0
4.08
16.0
5.08
16.0
6.08
16.0
7.08
16.0
8.08
16.0
9.08
16.1
0.08
16.1
1.08
16.1
2.08
16.0
1.09
16.0
2.09
16.0
3.09
16.0
4.09
16.0
5.09
16.0
6.09
16.0
7.09
16.0
8.09
16.0
9.09
16.1
0.09
16.1
1.09
16.1
2.09
16.0
1.10
16.0
2.10
16.0
3.10
16.0
4.10
16.0
5.10
16.0
6.10
16.0
7.10
16.0
8.10
16.0
9.10
16.1
0.10
16.1
1.10
16.1
2.10
16.0
1.11
16.0
2.11
Source: U.S. Energy Information Administration (2012b)
Figure 7: Weekly Cushing, OK Ending Stocks excluding SPR of Crude Oil.
(Thousand Barrels)
Page 42 of 576
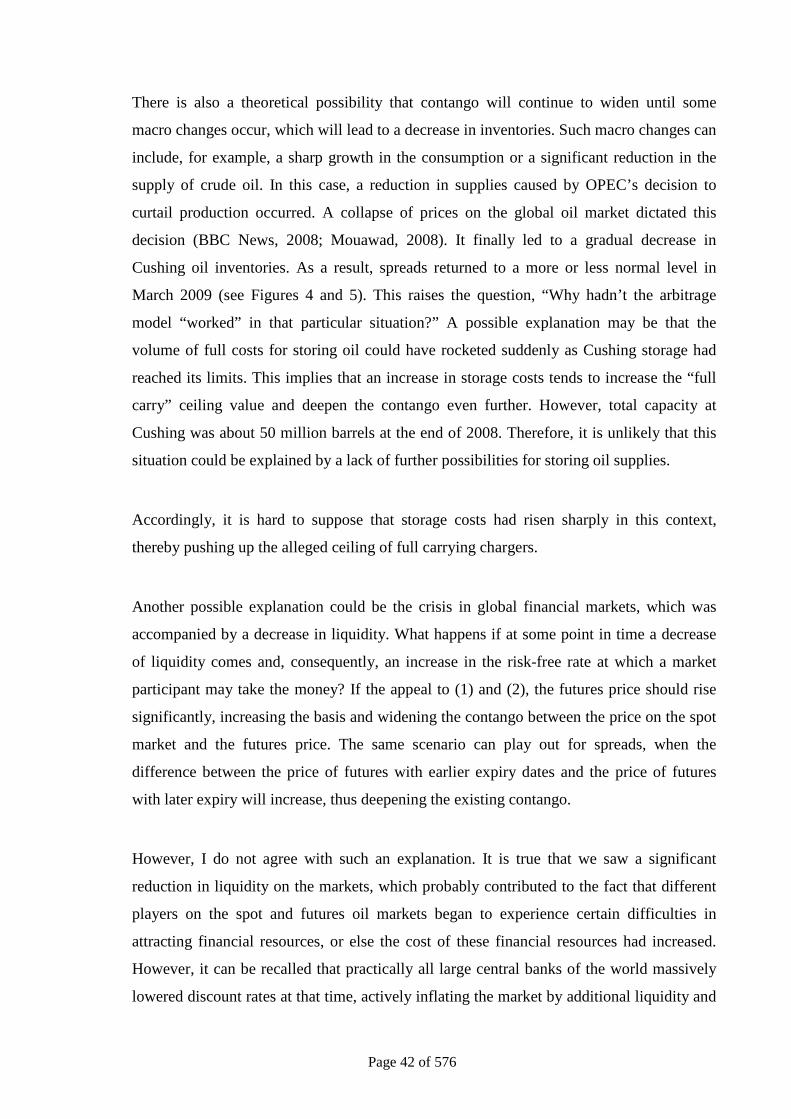
There is also a theoretical possibility that contango will continue to widen until some
macro changes occur, which will lead to a decrease in inventories. Such macro changes can
include, for example, a sharp growth in the consumption or a significant reduction in the
supply of crude oil. In this case, a reduction in supplies caused by OPEC’s decision to
curtail production occurred. A collapse of prices on the global oil market dictated this
decision (BBC News, 2008; Mouawad, 2008). It finally led to a gradual decrease in
Cushing oil inventories. As a result, spreads returned to a more or less normal level in
March 2009 (see Figures 4 and 5). This raises the question, “Why hadn’t the arbitrage
model “worked” in that particular situation?” A possible explanation may be that the
volume of full costs for storing oil could have rocketed suddenly as Cushing storage had
reached its limits. This implies that an increase in storage costs tends to increase the “full
carry” ceiling value and deepen the contango even further. However, total capacity at
Cushing was about 50 million barrels at the end of 2008. Therefore, it is unlikely that this
situation could be explained by a lack of further possibilities for storing oil supplies.
Accordingly, it is hard to suppose that storage costs had risen sharply in this context,
thereby pushing up the alleged ceiling of full carrying chargers.
Another possible explanation could be the crisis in global financial markets, which was
accompanied by a decrease in liquidity. What happens if at some point in time a decrease
of liquidity comes and, consequently, an increase in the risk-free rate at which a market
participant may take the money? If the appeal to (1) and (2), the futures price should rise
significantly, increasing the basis and widening the contango between the price on the spot
market and the futures price. The same scenario can play out for spreads, when the
difference between the price of futures with earlier expiry dates and the price of futures
with later expiry will increase, thus deepening the existing contango.
However, I do not agree with such an explanation. It is true that we saw a significant
reduction in liquidity on the markets, which probably contributed to the fact that different
players on the spot and futures oil markets began to experience certain difficulties in
attracting financial resources, or else the cost of these financial resources had increased.
However, it can be recalled that practically all large central banks of the world massively
lowered discount rates at that time, actively inflating the market by additional liquidity and

Page 43 of 576
stimulating the banks to extend credits (Banking News & Directory, 2012). Therefore, it is
doubtful that the problems in attracting financial resources constituted a reason for such a
significant market imbalance.
Now let us take a look at how the market developed further. In 2009, we see a sharp (in
percentage terms) increase in oil prices, when prices virtually double from their minimum
values. All spreads return to their normal levels from the beginning of March 2009,
maintaining the contango price structure, but not moving beyond full carrying charges. All
these processes were accompanied by the gradual recovery of the global economy and
stock market, stabilisation of the bond market and consumer demand.
However, what do we see in December 2009? Once again, future spreads sharply widen.
They do not reach the values that we observed almost one year ago, but they also move
beyond reasonable theoretical values. It must be said that the market reached a balance in
this situation fairly quickly, having moved the spreads back to their maximum theoretical
values. Spreads remained in the fore-mentioned situation until mid-February, 2010. Then
the situation changed and the spreads began to narrow quite sharply. Many spreads almost
approached zero, promising to shift to backwardation in the very near future. As a
minimum, this process seemed unusual and strange if to refer to previous explanations of
some of the authors (Cho and McDougall, 1990; Susmel and Thompson, 1997). They
connect the substantial widening of spreads with the large growth of inventories, in our
case – at Cushing. In fact, from January 2010, oil inventories began to grow week after
week (U.S. Energy Information Administration, 2012a), reaching almost record values (see
Figure 6). Proceeding from this logic, spreads should widen; whereas we see them
narrowing. Analysts stated that this process was connected with prevailing optimism about
strengthening of the global economy and a continuing increase in the demand for crude oil
(Habiby, 2010).
At the beginning of April 2010, spreads began to widen sharply again, reminding us of the
processes which occurred between December 2008 and February 2009. Publication 1 (p.
107) suggests that:
In a few days, spreads exceeded the ceiling value of full carrying charges many

Page 44 of 576
times, and continued to widen dramatically. The main difference between the
current widening and preceding ones was that spreads did not return within
their normal boundaries, even when there was a technical “impetus” connected
with the expiry of the front futures contract.
This raises the following question: If the widening of spreads is connected directly with the
increase in crude oil inventories at Cushing, and this seems to be the fundamental factor,
then why did we see such a sharp narrowing of spreads in the situation of a record increase
in inventories, which proceeded to grow for 11 consecutive weeks? An alternative question
– What caused such an aggressive widening of spreads starting from April 2010? None of
the phenomena which occurred during the crisis period, namely, huge declines in oil prices
and lack of liquidity on the market, have been present. Moreover, in the second half of
April 2010, on the one hand, oil prices reached local maximums of $87 per barrel (see
Figure 6), and on the other hand, the market was filled with cheap and available liquidity.
Such questions raise doubts about prevailing explanations, which are based on the current
theory of storage and arbitrage model, and on the significant correlation between spread
values and size of oil inventories.
3.5 Tentative Explanation
In my opinion, the following dynamics are taking place:
a) It seems that in order to find an explanation, it should be looked at the very essence of
the Light Sweet Crude Oil (WTI) futures contract quoted on the NYMEX. Theoretically,
there should be a physical delivery of the commodity to Cushing when this futures contract
expires (CME Group, 2012). That is, futures prices and spread values actually reflect the
situation at the Cushing facility rather than the general balance between supply and
demand in the U.S. It can be often seen that crude oil inventories in the United States, in
general, do not experience such sharp increases in percentage terms as in Cushing
(Publication 1). Moreover, this facility contains no more than 10% of total U.S. inventories
(excluding strategic reserves) (U.S. Energy Information Administration, 2012b). That is,
when futures are linked tightly to a concrete local site, this effectively tempts speculators
to manipulate futures prices, creating “bubbles”. In this case we are dealing with a

Page 45 of 576
“contango bubble”. Earlier, we dealt with an antifundamental spread narrowing which
occurred in February and March 2010.
I can support this idea by the fact that many major market players have come to realise this
disadvantage of WTI oil futures (Publication 5). In particular, during the “wild contango”
period which lasted from December 2008 to February 2009, Saudi Arabia raised the
question of abandoning the WTI as a crude oil benchmark (Blas, 2009). In fact, more than
half of the world oil trading is actually tied up to Brent. Brent oil futures are listed on both
the ICE and the NYMEX Exchange. There are two basic differences between these two oil
benchmarks. First, Brent and Brent oil futures are not linked to a specific territory. Second,
physical deliveries are not foreseen under Brent futures contract. Settlements are made in
cash at the ICE Brent Index Price at the contract expiry date (ICE, 2012). These factors
make Brent the most universal benchmark for oil prices in the world. Brent futures prices
and spreads between futures reflect the global balance between crude oil supply and
demand much more clearly. Therefore, we do not observe these phenomena with Brent
futures. Although Brent futures are also in contango, we do not see such drastic speculative
manipulations (“bubbles”) (see Figure 8).

Page 46 of 576
-9,00
-8,00
-7,00
-6,00
-5,00
-4,00
-3,00
-2,00
-1,00
0,00 01.12.2008
02.12.2008
03.12.2008
04.12.2008
05.12.2008
06.12.2008
07.12.2008
08.12.2008
09.12.2008
10.12.2008
11.12.2008
12.12.2008
13.12.2008
14.12.2008
15.12.2008
16.12.2008
17.12.2008
18.12.2008
19.12.2008
20.12.2008
21.12.2008
22.12.2008
23.12.2008
24.12.2008
25.12.2008
26.12.2008
27.12.2008
28.12.2008
29.12.2008
30.12.2008
31.12.2008
Brent Oil Calendar Spread WTI Crude Oil Calendar Spread
Source: QuoteCenter
Figure 8: Comparative chart of WTI Oil Calendar Spread and Brent Oil Calendar
spreads for the period from 01.12.2008-31.12.2008 based on two consecutive months
futures.
In addition, I can confirm the argument that everything that happens with WTI futures
seems speculative in nature, and not at all connected with fundamental reality by the fact
that in all those situations during the period of “enormous contango”, there were abrupt
jerks towards narrowing of spreads which speculative short position technical closures of
the expiring month contract caused. At the same time, one of the arbitrage model
hypotheses states that there are arbitrage players in the market who will take delivery under
an expiring contract, provide storage and further delivery against distant futures, thereby
contributing to a gradual narrowing of the spread (Hull, 2006).
However, what happens when only 2% of the total number of contracts ends up in the
physical delivery (as is common with the ripe futures markets)? This implies that, at the
very least, it would be difficult to apply arbitrage models to this situation. In other words,
in this situation it is necessary to develop an alternative model which would reflect today’s
increased volatility on the WTI futures market (and in the markets in general).
Page 47 of 576
b) The 2008 crisis led to changes in financial markets which were unobservable previously.
In particular, I am talking about the fact that the world's largest banks have lowered interest
rates to almost 0 (Banking News & Directory, 2012). Additionally, the Fed has brought
rates to a value of 0.25%, which remained for three years (2009-2012) and, as stated at the
recent Federal Open Market Committee (FOMC) meetings, will remain so until 2014
(Board of Governors of the Federal Reserve System, 2012). The financial world is facing a
new reality, which is called "zero risk-free rate".
The impact of this factor on theoretical finance is difficult to overestimate. In particular, a
large number of theoretical models include the concept of risk-free rate, and, as an
assumption to these models, imply that the risk-free rate is not zero. The same is true for
the described cost of carry model. If to insert the value of r = 0 in the formula (1), the
futures price will be equal to the spot price, that is, markets can not be in contango.
Moreover, since the summer of 2011, analysts have started to observe a situation where
short-term U.S. and German bonds traded at a negative yield. Following this logic, a
negative risk-free rate should lead to a permanent presence in the backwardation
commodity markets, regardless of the situation with fundamental supply and demand
balance. Otherwise, arbitrageurs would open the possibility of a risk-free profit. However,
despite that the WTI crude oil market was in contango for a long time, the precious metals
markets are in contango. Base metals markets switch periodically between contango and
backwardation. This situation points to the fact that many financial models must be
adapted to the current state of affairs. In my opinion, the discussion from the prospective of
zero or negative risk-free rate must be undertaken as well.
If to ignore the theoretical models, and pay attention to which implications for financial
markets have a zero risk-free rate on a practical level, an interesting picture will be found.
In particular, the great number of investors including institutional ones, have been focused
for decades on obtaining nominal and real risk-free income. Since 2008, the situation has
changed drastically and the real risk-free rate of return has become negative. This leads to
the fact that traditional investors are attempting to adapt themselves to new situations by
trying to find other ways of investing. This includes new approaches: discovering other
markets, such as commodities and narrowing the investment horizon, thereby trying to
reduce exposure to long-term risks. The emergence of larger speculative capital in the

Page 48 of 576
markets leads to higher volatility and appearance of values of financial instruments which
are disconnected from the fundamental situation and lack any logic (Publication 5;
Perchanok, 2012).
Further development of computer technology has led to the fact that trading machines start
to play a significant role. Perchanok (2012: 60) suggests that:
Although in earlier times the volume of these machine operations represented
only an insignificant market share, currently their actions are a major factor in
defining the direction and speed of movement of various financial assets’
prices. Of course, even before the appearance of trading programs, sudden
speculative price spikes or slumps occurred that were in conflict with
fundamental factors. However, there were quite a number of arbitrageurs,
investors, and commercial players who, by their actions, quickly restored the
status quo in the market, returning prices to normal ranges.
Now, it is becoming increasingly apparent that fundamental analysis and a focus on
fundamentals have ceased to play any significant role in trading decisions. Such changes
suggest that algorithmic trading programs, not people are making most of these decisions
(Perchanok, 2012).
Widely regarded as one of the main tools of technical analysis is the concept of a trend and
it can be most easily incorporated into algorithms of trading machines. Publication 1 states
that one can express spread trends much more strongly than simple outright positions.
Therefore, the actions of trading machines focused on trend following increase the trending
move, bringing the size of spreads to absurd values. These values contradict with
fundamental logic and theoretical models, which should explain spread values (e.g. the
cost of carry model).
Discussion about the need to supplement the theory of storage and the cost of carry model
would not be complete without mentioning a particular school of thought, best represented
by the work of Anand (2000) who finds it impossible for the market to be in a full-carry
condition for a long time because of arbitrage opportunities. Anand (2000: 32) suggests

Page 49 of 576
that:
We use the cost-of carry model to show that no-arbitrage conditions rule out
the possibility of the convenience yield being zero, or, equivalently, the
possibility of markets being at full carry. We show that an option component to
the convenience yield exists, and this option has value when the market is at
full carry. The spread is analysed for option-like properties to establish the
existence of the option. Further, cointegration tests are used to show the
existence of the option in the cost-of-carry relationship.
Anand (2000: 35) further suggests that:
When the convenience yield equals zero (at full carry), this creates an arbitrage
opportunity for the cash and carry trader. As is generally understood, an
arbitrage implies a position that is costless, with a zero probability of a
negative payoff, and a positive probability of a positive payoff. The position
has the structure of a call option on a convenience yield, which is in the money
when the market moves away from full carry.
Additionally, Anand (2000: 36) explains:
Therefore, as stated earlier, a market at full carry provides a free option to the
cash and carry trader. Given a positive probability of the option payoff being
positive and the assumption that this option is priced into the futures contract,
the market can never be at full carry.
Whilst Anand agrees with the possibility of reaching the state of full-carry market,
although not mentioning the possibility of exceeding these levels, he argues that the
persistence of this condition is impossible for a long time due to arbitrageurs. However, the
real situation on the market is in conflict with the authors’ work and with other researchers
who support this concept. As Publication 1 mentioned, the arbitrageurs’ activity does not
play as active a role as previously due to the increased role of speculative capital, which
limits the effect of the actions which arbitrageurs take. Thus, the arbitrageurs’ premise of

Page 50 of 576
quickly liquidating the market discrepancy is not quite true in the present market situation.
Tokic (2011) expresses a similar idea. In his article he examines how the interaction of
different participants in the crude oil futures markets affects the crude oil price efficiency.
Tokic (2011: 2051) states that:
Normally, the commercial market participants, such as oil producers and oil
consumers, act as arbitrageurs and ensure that the price of crude oil remains
within the fundamental value range. However, institutional investors that invest
in crude oil to diversify their portfolios and/or hedge inflation can destabilize
the interaction among commercial participants and liquidity-providing
speculators. We argue that institutional investors can impose limits to arbitrage,
particularly during the financial crisis when the investment demand for
commodities is particularly strong.
So, if a significant effect from arbitrage activity cannot be counted on, it is possible to
assume the appearance of abnormal market situations which are inexplicable in terms of
existing models.
3.6 Conclusion
This chapter had two aims: to find a possible explanation for the occurrence of "wild"
contango on the WTI crude oil futures market and to draw attention to the need for
updating the theory of storage and the cost of carry model. Achieving these, the author
makes the following conclusions:
a) Already in 2007, opinion began to appear that the WTI Crude Oil Benchmark pricing
does not adequately reflect the situation on the international oil market (Habiby, 2007).
The events of years 2008-2010 showed a further decrease in the status of this benchmark
as a determinant of world oil prices. Tight binding of a futures contract to the physical
delivery into Cushing Hub makes WTI very much locally-oriented. This opens
opportunities for excessive speculative influence not only on the outright prices, but also
on the calendar spreads.

Page 51 of 576
b) The theory of storage is a fundamental theory which was created by Working (1948,
1949) and popularised by later authors. This theory reflected the situation when the futures
markets were not excessively occupied by the speculators and abundant speculative capital.
By that time markets players based their decisions on the fundamental balance between
demand and supply. Therefore, the theory of storage brought up a theoretical foundation
under the observed market processes. It addressed very well the existence of steep
backwardation because this market condition is based upon purely fundamental factors.
However, enormous contangos did not exist at that time and appeared only recently. Giant
speculative presence, excessive liquidity, rising efficiency of the ripe futures markets,
appearance of round the clock trading and algorithmic trading machines strengthened the
divergence between fundamentally explainable from a theoretical point of view values of
contangos and values of observed ones. There is an urgent need for further research in
order to effectively amend and adapt the theory of storage in a timely manner in line with
the latest market situation.
3.7 Summary of Chapter Three
This chapter examined the causes of occurrence of contangos enormous dimensions on
crude oil calendar spreads markets. It discussed the need for updating the theory of storage
and adapting it to the current market circumstances. It also provided an expanded literature
review which showed the standing of my research.
Page 52 of 576
Chapter Four: Development of a Framework for Effective Analysis for Future Spreads Trading
4.1 Introduction
Futures spreads trading requires the constant and active use of different types of analysis
for making trading decisions. Despite the importance of this subject, research on it is very
limited. My publications contributed to the development of the framework for spreads
analysis.
Chapter Four’s objective is to consider in detail the possibility of practical application of
all types of analyses to spreads, assess supplementary function of comparative-historical
analysis, and to demonstrate inefficiency of application for practicing investors of the
regression-correlation analysis.
This chapter proposes an algorithm of co-integration of the four types of spreads analysis
for the purposes of creating trading strategies and decision-making.
This chapter demonstrates the standing of my research in relation to other works in this
field.
4.2 Literature Review
The futures spreads market can barely be called efficient. Thus, futures spreads trading
requires the constant and active use of different types of analysis to make trading
decisions. Despite the importance of this subject, research on it is very limited.
There are five basic types of analysis that can be used when working with spreads:
fundamental, seasonal, technical, comparative historical, and regression-correlation (Smith,
2000; Publication 1).
Fundamental analysis of commodity markets is based on the following principle: any
Page 53 of 576
economic factor that reduces the supply or increases the demand will increase the price
(Schwager and Turner, 1995). Conversely, we see that any factor which increases the
supply or reduces the demand usually leads to stock accumulation and a fall in prices
(Schwager and Turner, 1995; Thomsett, 2006; Errera and Brown, 1999). Fundamental
factors play an important role not only in the case of spreads, but also in the case of
outright futures positions, currencies, and shares. Whatever segment of the market that
may be mentioned, in the long run, these fundamental factors will play a determining role
(Ross, 2006b). However, there is a certain difference between spreads and other
investment instruments. In fact, fundamental factors impact spreads much more strongly
than other instruments (Smith, 2000; Ross, 2006b). Furthermore, fundamental factors also
affect spreads much more quickly. In terms of spreads, this type of analysis has been
studied by Smith (2000), Ross (2006b), Murray (2004), and Publication 1.
Seasonal analysis is based on life processes and methods employed by statistical analysis
(Moore et al., 2006; Bernstein 1990). Essentially, when analysing analogous historical
periods, investors attempt to find recurring patterns, and if they identify the high
recurrence of a certain behaviour that prices previously exhibited, they assume that such
behaviour is likely to occur in the future (Moore et al., 2006; Publication 1). Hence, the
longer the selected time span for analysis, the more credible the analysis pattern and,
consequently, the more reasons to expect that this pattern will repeat itself in the future.
This type of analysis is widely used in working with spreads; the possibility of its
application has been studied by the following authors: Moore et al. (2006), Smith (2000),
Ross (2006a, 2006b), Tolmasky and Hindanov (2002), Murray (2004, 2006), Carpenter
and Levy (1998), Salcedo (2004), Publications 1 and 3.
Technical analysis is the study of market dynamics with the purpose of forecasting future
price trends; it is focused on investment decision-making (Murphy, 1999). As applied to
the futures market, the term market dynamics captures two information sources available to
a technical analyst—namely, transaction prices and transaction volumes. In investigating
price movement and trade volume dynamics, technical analysis puts aside the issuer and
the environment where it operates—that is, knowing the reasons behind price movements
is not absolutely necessary in a technical analysis. Usage of technical analysis in spreads
trading is studied less than other types of analysis (McComas, 2003; Smith, 2000; Ross,

Page 54 of 576
2006b; Publication 1).
Comparative-historical analysis is based on the assumption that, under similar
circumstances (fundamental factors), futures prices or spreads should behave in a similar
way (Smith, 2000; Publication 1). It suggests searching for situations in the past that are
similar to the current one, tracing the behaviour of prices in that historical period, and
predicting the development of the current situation on this basis. Because of its
supplementary function, this type of analysis is limitedly used in the work with spreads and
therefore was not significantly highlighted in the literature. Attention to this type of
analysis is given in the works of Smith (2000) and Publication 1.
Regression analysis involves identifying the relationship between a dependent variable and
one or more independent variables (Markin, 2006). A model of the relationship is
hypothesized, and estimates of the parameter values are used to develop an estimated
regression equation (Markin, 2006; Prosvetov, 2008). Various tests are then employed to
determine whether the model is satisfactory. If the model is deemed satisfactory, the
estimated regression equation can be used to predict the value of the dependent variable
based on values for the independent variables (Theil, 1971; Chow, 1983).
Correlation and regression analysis are related in that both deal with relationships among
variables. The correlation coefficient is a measure of the linear association between two
variables (Markin, 2006; Prosvetov, 2008). Values of the correlation coefficient are always
between -1 and +1. A correlation coefficient of +1 indicates that two variables are perfectly
related in a positive linear sense, a correlation coefficient of -1 indicates that two variables
are perfectly related in a negative linear sense, and a correlation coefficient of 0 indicates
that there is no linear relationship between the two variables (Markin, 2006; Prosvetov,
2008). Smith, 2000 contributed to the study of this type of analysis in relation to spreads.
This chapter aims to extend the currently limited literature on the analysis of futures
spreads. Its objectives are to consider in detail the possible practical application of all types
of analyses to spreads, to assess the supplementary function of comparative-historical
analysis, and to demonstrate the inefficiency of application of the regression-correlation
analysis for practicing investors.
Page 55 of 576
This chapter proposes a framework of co-integration of the four types of spreads analysis
for the purposes of creating trading strategies and decision-making.
The remainder of the chapter is structured as follows: section two contains a short
discussion about the Efficient Markets Hypothesis (EMH) and the usefulness of
performing analysis, section three deals with fundamental analysis, section four covers
seasonal analysis, section five discusses technical analysis, section six explores
comparative-historical analysis, section seven critically examines regression-correlation
analysis in relation to spreads, section eight offers a framework of co-integration of
different analysis types, and section nine provides conclusions.
4.3 Short Discussion about Efficient Markets Hypothesis (EMH) and Usefulness of
Analysis Performing
Before I move on to different types of analysis, it is necessary to mention the Efficient
Market Hypothesis (EMH).
The EMH is the cornerstone of modern financial economics. The paradigm was coined in the
1960-70s by Roberts (1967) and formalised by Fama (1970). They identified three forms of
market efficiency distinguished by the type of information that prices of securities should
correctly incorporate. For a long time the EMH has been the dominant paradigm in
finance.
The weak form (or random walk) of the EMH assumes that prices fully reflect the
information contained in the historical sequence of prices. Thus, in a competitive market, it
should not be profitable to base investment decisions on information obtained from past
prices or returns of publicly traded securities. According to Malkiel (1999; 2003; 2011), the
stock price changes should be random and unpredictable - i.e., stock price movement
follows a random walk (Roberts, 1959). This version implies that technical analysis is
fruitless.
The semi-strong form of the EMH assumes that current stock prices reflect not only
historical price information, but also all publicly available information relevant for

Page 56 of 576
company securities. If markets are efficient in this sense, then an analysis of balance
sheets, income statements, announcements of dividend changes or stock splits, or any other
public information about a company will not yield abnormal economic profits. Investors
cannot trade profitably on the basis of announcements since the relevant information had
already been reflected in the stock prices by the time of an announcement (Williams, 1977;
Fama, 1991). This version implies that insider trading may be profitable.
The strong form of the EMH ensures that all information that is known to any market
participant about a company is fully reflected in the market prices. Hence, not even those
with privileged information can make use of it to secure superior investment results. There
is a perfect revelation of all private information in the market prices (Malkiel, 1992). This
version implies that fundamental analysis is also useless, prices are always fair, and no
investor would be able to make consistently superior forecasts of prices. This form justifies
the creation of index funds’ passive strategies.
By 1975, the preponderance of evidence indicated that markets were efficient. Statistical
studies showed that technical analysis did not add value (consistent with the weak form of
market efficiency). Event studies found that the market quickly reacts to new information
(consistent with the semi-strong form of market efficiency). And studies of professional
investors’ performance made a strong case for the strong form of market efficiency.
As more researchers tested the efficient market hypothesis, some rather controversial
evidence began to appear. Rozeff and Kinney (1976) published their article on stock
market seasonality, finding that January stock returns were higher than in any other month.
Gibbons and Hess (1981) reported “the Monday effect”: stock prices tended to go down on
Mondays. Both of these findings were clearly inconsistent with the weak form of market
efficiency. An unexpected criticism of the efficient market hypothesis came from academic
economists. Grossman and Stiglitz (1980) argued that if all relevant information were
reflected in market prices, market agents would have no incentive to acquire the
information on which prices are based.
Moreover, there were studies suggesting that the stock market actually overreacts to certain
announcements. In 1981, Shiller published the article “Do Stock Prices Move Too Much to
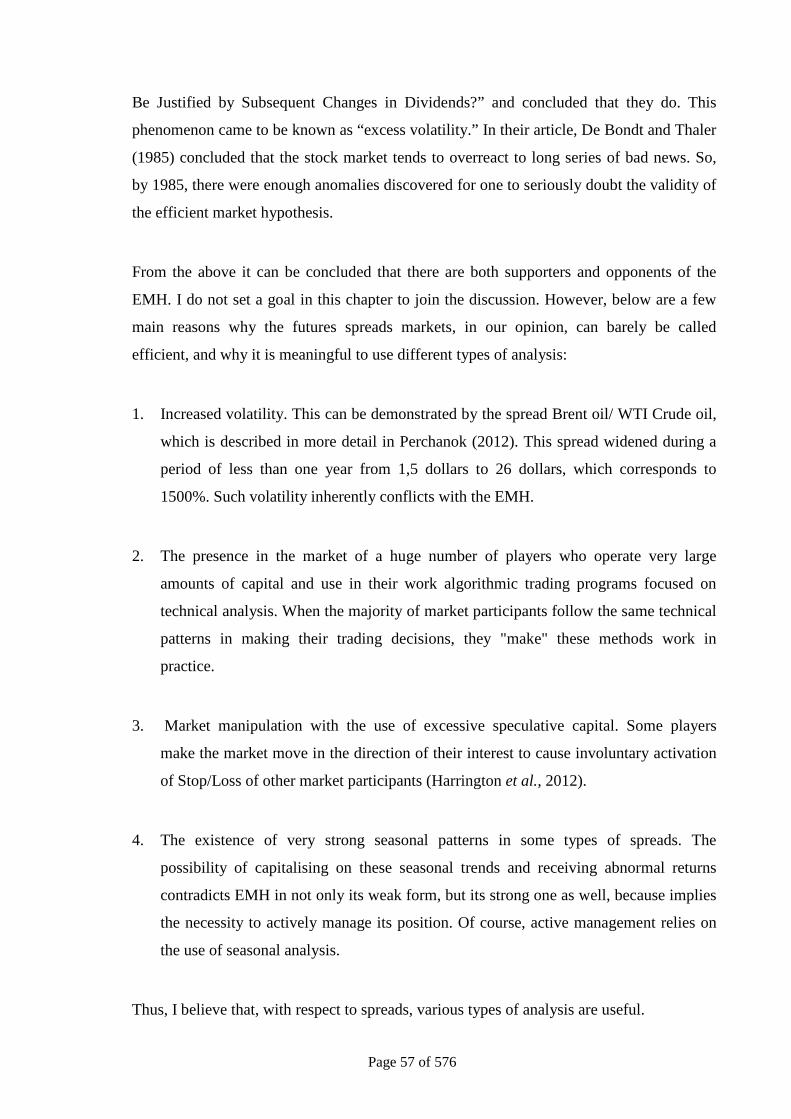
Page 57 of 576
Be Justified by Subsequent Changes in Dividends?” and concluded that they do. This
phenomenon came to be known as “excess volatility.” In their article, De Bondt and Thaler
(1985) concluded that the stock market tends to overreact to long series of bad news. So,
by 1985, there were enough anomalies discovered for one to seriously doubt the validity of
the efficient market hypothesis.
From the above it can be concluded that there are both supporters and opponents of the
EMH. I do not set a goal in this chapter to join the discussion. However, below are a few
main reasons why the futures spreads markets, in our opinion, can barely be called
efficient, and why it is meaningful to use different types of analysis:
1. Increased volatility. This can be demonstrated by the spread Brent oil/ WTI Crude oil,
which is described in more detail in Perchanok (2012). This spread widened during a
period of less than one year from 1,5 dollars to 26 dollars, which corresponds to
1500%. Such volatility inherently conflicts with the EMH.
2. The presence in the market of a huge number of players who operate very large
amounts of capital and use in their work algorithmic trading programs focused on
technical analysis. When the majority of market participants follow the same technical
patterns in making their trading decisions, they "make" these methods work in
practice.
3. Market manipulation with the use of excessive speculative capital. Some players
make the market move in the direction of their interest to cause involuntary activation
of Stop/Loss of other market participants (Harrington et al., 2012).
4. The existence of very strong seasonal patterns in some types of spreads. The
possibility of capitalising on these seasonal trends and receiving abnormal returns
contradicts EMH in not only its weak form, but its strong one as well, because implies
the necessity to actively manage its position. Of course, active management relies on
the use of seasonal analysis.
Thus, I believe that, with respect to spreads, various types of analysis are useful.

Page 58 of 576
4.4 Use of Fundamental Analysis in Working with Futures Spreads
There is a certain difference between spreads and other investment instruments. In fact,
fundamental factors impact spreads much more strongly than other instruments.
Furthermore, fundamental factors affect spreads much more quickly (Publication 1). For
example, if to look at the FOREX currency market, it may take fundamental factors from 3
to 5 months to break a strong trend. At the same time, movement of spreads in the same
direction as the trend may stop immediately if important fundamental factors affecting
these spreads appear along the way. This means that they are much more sensitive to
fundamental factors and more logical in their movements than outright positions. Even
though spreads may be considered as highly speculative investment tools, a speculative
impact unsupported by a fundamental situation tends to be weaker in the case of spreads.
Let’s consider an example described in the Publication 1 of how fundamental factors
impacted heating oil calendar spreads. Figure 9 shows a spread chart between June
(HONO) and December (HOZO) heating oil futures contracts.
HON0-HOZO_daily
-0,1460-0,1440-0,1420-0,1400-0,1380-0,1360-0,1340-0,1320-0,1300-0,1280-0,1260-0,1240-0,1220-0,1200-0,1180-0,1160-0,1140-0,1120-0,1100-0,1080-0,1060-0,1040-0,1020-0,1000-0,0980-0,0960-0,0940-0,0920-0,0900
01.1
2.20
09
08.1
2.20
09
15.1
2.20
09
22.1
2.20
09
29.1
2.20
09
05.0
1.20
10
12.0
1.20
10
19.0
1.20
10
26.0
1.20
10
02.0
2.20
10
09.0
2.20
10
16.0
2.20
10
23.0
2.20
10
02.0
3.20
10
09.0
3.20
10
16.0
3.20
10
23.0
3.20
10
30.0
3.20
10
06.0
4.20
10
13.0
4.20
10
20.0
4.20
10
27.0
4.20
10
04.0
5.20
10
11.0
5.20
10
18.0
5.20
10
25.0
5.20
10
01.0
6.20
10
08.0
6.20
10
15.0
6.20
10
22.0
6.20
10
29.0
6.20
10
EIA
Source: Publication 1
Figure 9: HON0/HOZ0 Spread Chart.

Page 59 of 576
On 11.06.2010, this spread, like other heating oil calendar spreads, began to narrow
gradually, but the size of this narrowing was insignificant. On 15.06.2010, the narrowing
of the spread became more aggressive. On 16.06.2010, the EIA issued an oil market report
showing a considerable growth in heating oil inventories during the previous week. This
marked an extremely important fundamental factor that should have forced the spreads to
widen. However, the opposite took place: the spreads continued to narrow aggressively,
reaching a local minimum on 17.06.2010 (we should not forget that the market was in
contango and that the graph values were in negative territory). This situation is also curious
in that heating oil spreads tend to exhibit a seasonal pattern, somewhat expanding toward
the end of June. It is important to note that the spread ignored two significant factors as
seasonality and changes in inventories. What happened next? The chart shows that the
spread movement swung in the opposite direction, widening sharply and reaching its
absolute maximum for that year within a very short period of time. This means that the
fundamental factors affected the spreads so strongly that they were forced to “turn around”
and “depart” quickly in the opposite direction. Moreover, all these movements occurred
within an approximate period of two weeks.
If to think about the range of movement of the spread and apply it to the movement in
heating oil prices, then a trend of extreme force and duration would be required to make
heating oil futures travel a path of this size (naturally, if the movement size is scaled as a
respective percentage ratio). This example clearly shows how sensitive spreads may be to
the impact of fundamental factors.
If the investor plans to work with spreads, he should first make an in-depth analysis of
each individual spread. The issue is complex, as each type of spread is impacted by its
individual and inherent fundamental factors. Moreover, each spread can be impacted by a
considerable number of fundamental factors, so it is essential to pick out those whose
impact has a determining character.
The following algorithm is suggested:
1. Choose a spread that should be analysed.
2. Determine which group this spread belongs to: calendar, intercommodity, intermarket,

Page 60 of 576
or processing.
3. Collect information on factors which will affect the price of each position in the spread.
4. Define the interoperability of these factors.
5. Trace the reaction of the spread to these factors.
Determining which group the spread belongs to is crucial, as in the case of calendar
spreads. We are only interested in factors related to one and the same contract. In the case
of intercommodity spreads, for example, both parts of the spread—i.e., different
contracts—should be analysed. The same can be said for intermarket spreads, but the
analysis should include not only the futures contracts composing the spread, but also the
situation on territorial markets where the contractual goods are to be delivered. The
situation becomes even more complicated in the case of complex or industrial spreads, as
the number of elements integrated into the spread increases.
The “search for information” step is of key importance in spread management (Publication
1). Data for an effective fundamental analysis is not always easy to find. At the very least,
the needed information is not always available in one place. For example, a great source of
information is reports presented by various U.S. government agencies and departments.
The information in these reports is fundamentally important and helps to define factors
affecting corresponding futures contracts and spreads. The Energy Information
Administration of the U.S. Department of Energy (EIA, 2012) publishes information on
the state of affairs in the energy sector on its website every week. The United States
Department of Agriculture (USDA, 2012) publishes reports concerning agricultural goods
and provides access to archives containing historical information on agricultural goods.
The United States Geological Survey (USGS, 2012) presents reports containing
information that may be useful for defining the objectives of an analysis on the metals
market. If the question concerns currencies or bonds, the information available on the
websites of central banks in different countries becomes indispensable. Finally, analytical
notes published by news channels, such as Bloomberg or Reuters, can be of great practical
use.
In a number of works (Smith, 2000; Publication 1; Schap, 2005), fundamental analysis of

Page 61 of 576
spreads is indicated as the main tool of analysis. Long time spreads were very sensitive to
changes in the fundamental situation, and this type of analysis successfully performed its
function. However, since 2008, the situation in the financial markets has begun to change,
and the fact that market participants ignore some fundamental factors in making their
trading decisions has become more noticeable (Publication 1). It is becoming increasingly
apparent that fundamental analysis and a focus on fundamentals have ceased to play any
significant role in trading decisions (Perchanok, 2012).
This can be explained by an increase in liquidity, the activity of speculators, and the fact
that most of these decisions are being made not by people, but by algorithmic trading
programs.
Such changes have led to some spreads reaching values that cannot be explained by
fundamental analysis, as they are illogical according to it. This situation is described in
more detail in Publication 1 and Publication 5.
Consider the spread platinum/gold. Fundamental factors that will influence the spread
platinum/gold movement include: economic situation, inflation rate, platinum
supply/demand balance, seasonality, and general sentiment among market participants
(Publication 3).
Platinum is a precious metal much more rare than gold, with a production volume
approximately 30 times less than that of gold. Platinum is widely used in jewelry and for
industrial purposes. The main demand for it comes from the automotive industry, where it
is used for the manufacture of catalytic converters. Industrial demand for platinum is
inelastic, since there are practically no alternatives to it, except for palladium, which
belongs to the same group of metals. Platinum supply, unlike gold, is also inelastic, since
there are no large reserves of platinum in warehouses (Lee, 2011). In addition, 80% of the
world’s production of platinum is concentrated in South Africa—a country that is not a
model of stability. The production cost of platinum is significantly higher than that of gold
(Lee, 2011; Publication 3). Taking into account all of these factors, it can be said that the
price of platinum should significantly exceed the price of gold, as was observed for many
years when platinum was worth an average of 20-30% more than gold (see Figure 10).

Page 62 of 576
-200,00-150,00-100,00-50,00
0,0050,00
100,00150,00200,00250,00300,00350,00400,00450,00500,00550,00600,00650,00700,00750,00800,00850,00900,00950,00
1000,001050,001100,001150,001200,001250,001300,001350,00
04.0
8.20
00
04.1
2.20
00
04.0
4.20
01
04.0
8.20
01
04.1
2.20
01
04.0
4.20
02
04.0
8.20
02
04.1
2.20
02
04.0
4.20
03
04.0
8.20
03
04.1
2.20
03
04.0
4.20
04
04.0
8.20
04
04.1
2.20
04
04.0
4.20
05
04.0
8.20
05
04.1
2.20
05
04.0
4.20
06
04.0
8.20
06
04.1
2.20
06
04.0
4.20
07
04.0
8.20
07
04.1
2.20
07
04.0
4.20
08
04.0
8.20
08
04.1
2.20
08
04.0
4.20
09
04.0
8.20
09
04.1
2.20
09
04.0
4.20
10
04.0
8.20
10
04.1
2.20
10
04.0
4.20
11
04.0
8.20
11
Source: Quote Center
Figure 10: Platinum/Gold Spread Chart for 2000-2011.
If to look at the history of the past 10 years, it is only during the crisis of 2008 that the
price of platinum was at the same level as the price of gold, and for a short time it was
even $20 cheaper than gold. However, this situation did not last long, and the spread began
rapidly widening, which led to the restoration of the traditional differences in prices.
Beginning in September 2011, the price of gold became steadily higher than the price of
platinum—that is, the value of the spread was less than 0. On some days, the size of the
spread reached -225 dollars. These values cannot be explained from a fundamental point of
view (Perchanok, 2012). The platinum/gold spread is not the only spread that achieved
abnormal values. Further examples of different anomalies in spreads could easily be found.
This allows us to state that there is a clear tendency of weakening fundamentals and
fundamental analysis in general.

Page 63 of 576
4.5 Use of Seasonality Analysis in Working with Futures Spreads
In the case of spreads seasonality is much more pronounced. In reality, practically all
spreads exhibit seasonality, beginning with gasoline and corn calendar spreads, where
seasonality is a key determinant, and ending with interest rate spreads, which are less
affected by seasonal influences (Moore et al., 2006). The fact that spreads are much more
prone to cyclic movements than outright futures positions is explained by the fact that
spreads are less susceptible to speculative pressures and more driven by intrinsic, natural,
production, and life processes (Publication 1).
Such an enviable regularity of spreads displayed from year to year allows investors to
benefit when making investment decisions. Many investors even rely on seasonality and
seasonal analysis as the key tool in their work with spreads. This makes sense, since
movements of spreads, as mentioned earlier, have a good deal of logic behind them.
However, I believe that one should not rely solely on this analysis when making trading
decisions.
Seasonal analysis is based on the methods employed in statistical analysis. Essentially,
when analysing analogous historical periods, investors attempt to find recurring patterns,
and if they identify the high recurrence of certain behaviour exhibited by prices in the past,
they assume that such behaviour is likely to occur in the future (Murray, 2004; Publication
1). Hence, the longer the time span selected for analysis, the more credible the analysis of
patterns is and, consequently, the more reasons there are to expect that this pattern will
repeat itself in the future. In order for a pattern to be considered reliable, it should exhibit
stability for at least three to five years.
Figure 11 shows that the platinum/gold spread displays a strong seasonal pattern, with the
spread widening between January and May. This is primarily due to the difference in the
demand growth cycles of these metals. In particular, starting from September to
approximately the end of February the demand for gold is rising. This growth is driven by
the requirements of the jewellery industry, which strives to meet the demand of the
population during Christmas, Chinese New Year and autumn weddings in India. Such
growth in the demand for gold makes the spread narrow. Starting in January, the industrial

Page 64 of 576
demand for platinum begins to grow; during the whole spring the price of this metal is
rising, causing the spread to widen (Publication 3).
Despite the weakening of the influence of fundamental factors, the seasonality of this
spread continues to influence it. The traditional pattern of widening in spring remained
intact in 2012.
Source: Capitol Commodity Services Quotes and Charts
Figure 11: Seasonal Pattern of the PLJ/GCJ Spread for 15, 10, and 5 Years.
Figures 12 and 13 show the seasonal pattern of the soybean meal/soybean spread and a
chart of the soybean meal/soybean spread, respectively.

Page 65 of 576
Source: Capitol Commodity Services Quotes and Charts
Figure 12: Seasonal Pattern of the Soybean (December 2009)/Soybean Meal
(November 2009) Spread for 10, 5, and 3 years.

Page 66 of 576
Source: Capitol Commodity Services Quotes and Charts
Figure 13: Seasonal Pattern of the Soybean Meal (December 2008)/Soybean
(November 2008) Spread for 10, 5, and 3 Years.
Despite the fact that this spread exhibits a very strong seasonal pattern and tends to narrow
in July-September, this did not happen in 2009. The spread in late July 2009 was already
very narrow. It remained in a sideways trend till late September and thus did not follow its
seasonal pattern. This is unlike in 2008 (Figure 12), when the spread narrowed from -1190
(in July) to -750 (at the end of September).
Whenever algorithmic software is used for seasonal analysis, this analysis has a number of
strategic limitations. In particular, seasonal patterns can rapidly change or disappear.
Moreover, this often occurs with very steady seasonal cycles. As a rule, this happens due to
the impact of significant fundamental factors. I can give the following example. For a long
time, the U.S. remained the only major exporter of soy. Therefore, the seasonal cycle in the
behaviour of soy spreads was oriented toward the seasonality typical of the U.S. This
Page 67 of 576
concerned allocation of land for sowing, growing and harvesting crops, etc. In the late
1980s to the early 1990s, soybeans were offered in the market by Latin-American countries
including Brazil, Argentina, Uruguay, and Paraguay. The aggregate output of these
countries started to outweigh U.S. production. Since these countries are located in the
southern hemisphere, their production cycle is different from that in North America. This
factor caused huge changes in the behaviour of soybean spreads and broke the previous
seasonal patterns.
Another example is currencies and currency spreads. There were some credible
calculations made for a number of currency spreads that provided some insight as to the
presence of seasonal cycles. However, it is safe to say that even if such patterns did exist,
they vanished after the 2008 financial crisis. This is explained by radical changes in the
levels of refinancing rates in many countries across the world, which disrupted previously
existing relationships and correlations. This can be demonstrated with the following
example. For many years, the Swiss franc base rate has been close to zero, while the UK
pound base rate was 5% prior to the 2008 crisis and 0,5% after the crisis. Thus, the
difference in the base rates between the Swiss franc and the UK pound that had existed for
decades disappeared within a few months. It would be logical to assume that such
appreciable change has greatly impacted the existing relationships between currency
exchange rates, and even more so the behaviour of currency spreads. All of this shows that
one should not rely solely on seasonal analysis when assessing the current situation.
Seasonal analysis should be combined with other types of analysis to achieve adequate
results from an evaluation of the current situation.
4.6 Use of Technical Analysis in Working with Futures Spreads
The classical theory of technical analysis, which contains fundamental principles laid down
by Charles Dow towards the end of the 19th century, is founded on three postulates—fine
points on which the technical analysis is based, and its methodological logic (Murphy,
1999).
First postulate: The market considers everything (or the rate considers everything; the price
considers everything).
Page 68 of 576
Second postulate: Price movements are subject to specific tendencies (or prices move in
one direction within a certain time interval; the market follows certain trends).
Third postulate: History repeats itself.
In my opinion, not all of the technical analysis tools can be used in work with spreads. Our
observations show that it is much better to use configuration methods to make a technical
analysis of spreads, such as trend lines, minimum-maximum, support and resistance, and
trading ranges.
Let’s consider each of these methods in detail.
Support and resistance lines (levels)
Support and resistance lines represent the foundation of classical trend analysis (Murphy,
1999; Williams, 2005). Their emergence, in the opinion of technical analysts, can be
explained using the following logic. A resistance line connects market important
maximums or market peaks. It emerges when buyers neither can nor wish to buy a given
futures contract, spread or security at higher prices. Each time the price moves upward,
sellers’ resistance builds up and sales increase, which also puts pressure on the price. The
upward trend is halted, as though held back by an invisible ceiling, which it cannot break
through at that moment. If “bulls” gather their forces together, and “bears” slacken their
grip, the price is likely to break the resistance level established earlier. Otherwise, the price
will inevitably move the opposite way.
A support line connects market important minimums. Support lines emerge and exist
inversely to resistance lines. Here, “bulls” exchange places with “bears.” Sellers are active
market players who push the price downward, whereas buyers will then find themselves on
the defensive side. The more active the sellers and the more passive the buyers, the more
probable it is that the support line level will be broken and the prices will slide even further
downward.
If the support or resistance levels are distinctly broken, they usually move in opposite

Page 69 of 576
directions. Therefore, as a rule, once a very strong support level gets through, it turns into
an equally consistent resistance level. Conversely, when a strong resistance level is broken,
it turns into a consistent support level.
Figure 14 shows a crack spread chart in which support and resistance lines are represented.
Due to the decline in the spread at the end of 2008, initial support turned into resistance in
an altered situation.
Source: eSignal
Figure 14: CLQ0/HOQ0/RBQ0 Crack Spread Chart.
It is better to draw support and resistance lines through the areas containing price clusters
rather than through extreme price excursions. Price clustering shows that the behaviour of
a determining number of traders changed its direction, whereas maximum price excursions
in such areas make the weakest market participants panic and hastily close their loss-
making positions.
Analysis of support and resistance lines helps traders to keep track of changes in the
trend—both swings and acceleration.

Page 70 of 576
Trend lines
A trend line is a natural product of the trend itself (Murphy, 1999). It is a straight line that
connects maximum or minimum price peak points. If we look at the crack spread chart
presented above, we see that the fall at the end of 2008 was followed by growth extending
into mid-2010 with a clearly defined trend (Figure 15).
Source: eSignal
Figure 15: CLQ0/HOQ0/RBQ0 Crack Spread Chart.
Trend lines can be classified by their importance using the following indicators:
— Time scale: The larger the time scale, the more important the trend line. The trend line
on a weekly chart displays a more important trend than that on a daily chart, and the trend
line on a daily chart shows a more important trend line than that on a one-hour chart.
— Length: The longer the trend line, the more reliable it is. A short trend line displays
behaviour of masses within a short time interval, whereas a longer line reflects their
behaviour within a longer timeframe.
— Number of times prices touch the trend line: The more touches of prices, the more
reliable the trend line. A preliminary trend line is drawn through only two points; the third
contact point makes it more reliable, and the fourth or fifth touch points show that the
dominant group on the market has significant potential.

Page 71 of 576
— Slope angle: The angle between the trend line and the horizontal line displays the
emotional intensity among the dominant market crowd. A steep trend line means that the
dominant crowd is dynamic, whereas a relatively flat trend line means that the dominant
crowd is rather inert. A flat trend line usually takes longer to develop.
To plot a trend line, it is enough to have two points through which it is drawn, and one
more point to “validate” the trend. The trend line exists until it is broken through due to a
sharp upward or downward price movement. Sharp changes in trend line directions do not
occur very often. If there is no consolidation, the longer this situation continues, the
sharper the subsequent swing. Several other chart examples of trend line tracing are shown
below.
Trading ranges
Significant temporary price fluctuations between support and resistance levels lead to the
formation of the so-called trading range, the limits of which are defined by these lines
(Murphy, 1999; Williams, 2005). It is characteristic for some spreads to remain in a narrow
trading range for a long period of time, considered almost as a kind of sideways trend. At a
certain point in time, they leave this range under the influence of various fundamental
factors and their movements can come across as very sharp and strong (Figure 16).
Source: eSignal
Figure 16: ESU0/YMU0 Spread Chart.

Page 72 of 576
In conclusion, I would like to note that technical analysis methods have definite
shortcomings. First, the criteria defining configuration patterns are relatively subjective
(one analyst will examine one figure or one line, whereas another will study others, and the
third will see absolutely nothing). The second imperfection is predetermined by particular
market situations, which is generally true for all technical methods. Therefore, on one
hand, configuration methods are very simple, but, on the other hand, they are subjective
and in general do not provide a highly credible forecast of price movements. In my
opinion, these methods should only be used in combination with other analysis methods—
namely, fundamental and seasonal analyses.
In my opinion, there is a powerful tool of technical analysis that allows one to perform a
dynamic assessment of the situation: the Relative Strength Index (RSI). This subject is
addressed in more detail by Publication 2. However, I draw attention to some important
abstracts.
RSI
The Relative Strength Index (RSI) is one of the main tools of technical analysis (Wong et
al., 2002; Murphy, 1999). It was developed and described by Welles Widler (1978). The
formula of this indicator is based on the theory of probability. I would like to note that the
general concept underlying this indicator holds that any movement in a particular direction
will stop and the direction will change sooner or later. The stronger the initial movement,
the stronger the pullback (Publication 2). Naturally, a movement that has lasted a few days
will cause a greater reverse movement than one that has lasted a few hours or minutes. If
we think about it, such a wave-like movement is somewhat phenomenal in its essence. We
are used to pullbacks that are commonly called corrections and are integral to the
behaviour of any financial market. Generally, it is hard to predict which direction the
prices will “go” within short time intervals. However, it can be asserted with 100%
confidence that a reverse movement will occur and we can also expect it to be considerable
in strength.
There are a number of technical analysis methods that enable reverse movements to be
assessed with a varying degree of accuracy (Stochastic Oscillator, Relative Momentum

Page 73 of 576
Index). It should also be noted that the RSI indicator is an oscillator and its signals work
most effectively only when the market experiences relatively lateral movement, whereas in
a soaring or plummeting market the trend areas may well contain a considerable number of
false signals (Murphy, 1999; Publication 2).
The RSI is plotted on a chart scaled from 0 to 100. The 70 and 30 values are used as
warning signals; the zone below 30 is called the oversold zone and that above 70 is
referred to as the overbought zone.
The RSI has only one parameter, which is the number of calculation periods. When
introducing this indicator, Welles Wilder (1978) recommended using a 14-day period for
RSI calculation. Later on, 7-, 9- and 25-day periods also became common. It should be
kept in mind that the shorter the calculation period, the higher the oscillator’s sensitivity
and the greater the amplitude of its oscillation.
In my opinion, the daily RSI is the most interesting for assessing spreads. Since spreads
tend to exhibit prolonged movements in any direction, their RSI quite easily moves into the
area of extreme values and can stay there for a long time, sometimes reaching values such
as 10 and 90. As practice shows, it is fairly hard for spreads to sustain a daily RSI value
higher than 85 and lower than 15 for more than several days. Moreover, their potential for
further movement along the trend is rather limited. These RSI levels may well be
considered a market entry signal. Apart from the daily RSI, the 5-minute RSI can also be
utilized, but it should be kept in mind that its values should be very extreme and approach
10 for spread purchase and 90 for spread sale. The 5-minute RSI is best suited for
assessing intercommodity and intermarket spreads, while the daily RSI is suitable for
spreads of all categories (Publication 2).
4.7 Use of Comparative-Historical Analysis in Working with Futures Spreads
It can be said that comparative historical analysis combines fundamental, technical, and
seasonal analyses. First, one needs to select a period in which to examine the behaviour of
prices and then compare fundamental data to find a configuration of fundamental factors
most similar to the current one. After that, the investor can make an appropriate trading

Page 74 of 576
decision for the current window while considering the current spread value. This approach
seems to be very sophisticated, as the emergence of similar configurations of fundamental
factors is highly unlikely due to a large number of these factors. In this case, the investor
should select one or two fundamental factors and search for data based on them. The
danger is that, firstly, the “key” factors may be selected incorrectly, and secondly, the
evaluation of the comparison results is subjective in nature, not to mention the fact that it is
necessary to look through a fair amount of statistical information. Based on the above, I
would say that such an analysis is both difficult to perform and impractical.
A simpler version of this analysis consists of analysing charts for past periods. I would
suggest the following sequence of steps: compare charts of the subject spread for several
past years; if a chart or charts generally similar to the current one are found, compare the
details of the current and found chart(s) to gain some insight into the possible behaviour of
the current spread. The comparison may involve a number of parameters. This simple
algorithm allows someone to perform this analysis even with very limited experience.
4.8 Critics of Regression and Correlation Analysis in Relation to Spreads
Spreads can be also analysed with the help of regression and correlation analysis. But the
author believes that the use of regression and correlation analysis, in practice, is not really
effective, and, therefore, refrained from in-depth study of it in relation to spreads. This
position reflects my personal conviction based on my own practical experience. Below are
the arguments for my position:
1. The aim of any analysis in trading is to assist in making various trading decisions.
However, the use of regression-correlation analysis for the average trader is
complicated because it requires adequate mathematical apparatus. Although traders
have sophisticated software, such analysis still requires very specific knowledge in
order to operate the software effectively. The majority of practical traders do not have
such a high level of knowledge in mathematics. As evidence would show, most
textbooks on practical trading never mention this type of analysis (Williams, 1999;
Luca, 2000).
Page 75 of 576
2. In short-term trading, application of this type of analysis is complicated by its very
nature. It involves multiply steps: identification of the dependent and independent
variables, creation of a hypothesized model of their relationship, estimation of the
parameter values needed to develop an estimated regression equation, running of the
various tests in order to determine if the model is satisfactory, application of the
regression equation, and assessment of the results. Obviously, such analysis takes a
very long time, and for an investor whose trading horizon is limited to a period of
several months, it loses its relevance in analysing the situation.
3. One of the features of correlation analysis is that it is impossible to isolate the
influence of extraneous factors because they are either unknown or cannot be isolated.
Therefore, the correlation method used to determine what would be the result of the
relationship between the cause and the effect assumes that extraneous factors did not
change or that the change does not distort the basic relationship. If such an assumption
is appropriate for theoretical research, then in practice, changes in extraneous factors
happen very quickly, and together with a high degree of volatility, a practical trader is
unable to take these factors into account. If any of the above factors had a negligible
impact on the situation at the current time, its influence could increase in the near
future, and it would become one of the key factors. Since the use of this type of
analysis requires a large sampling time, including 10- to 20-year-old data, the results
of this analysis would be questionable, because in the past 10 years, the world has
experienced significant changes due to globalisation, which may not be reflected in the
older data. Moreover, the recent events of 2008 changed the process of pricing in the
future markets due to increased liquidity and the sharp reduction of the refinancing
rates undertaken by the major central banks.
4. Neither regression nor correlation analyses can be interpreted as establishing cause-
and-effect relationships (Markin, 2006). They can indicate only how or to what extent
variables are associated with each other. The correlation coefficient measures only the
degree of linear association between two variables (Prosvetov, 2008). Any conclusions
about a cause-and-effect relationship must be based on the judgment of an analyst.
Moreover, identification of the variables requires the use of other types of analysis that
must be performed first in any case.
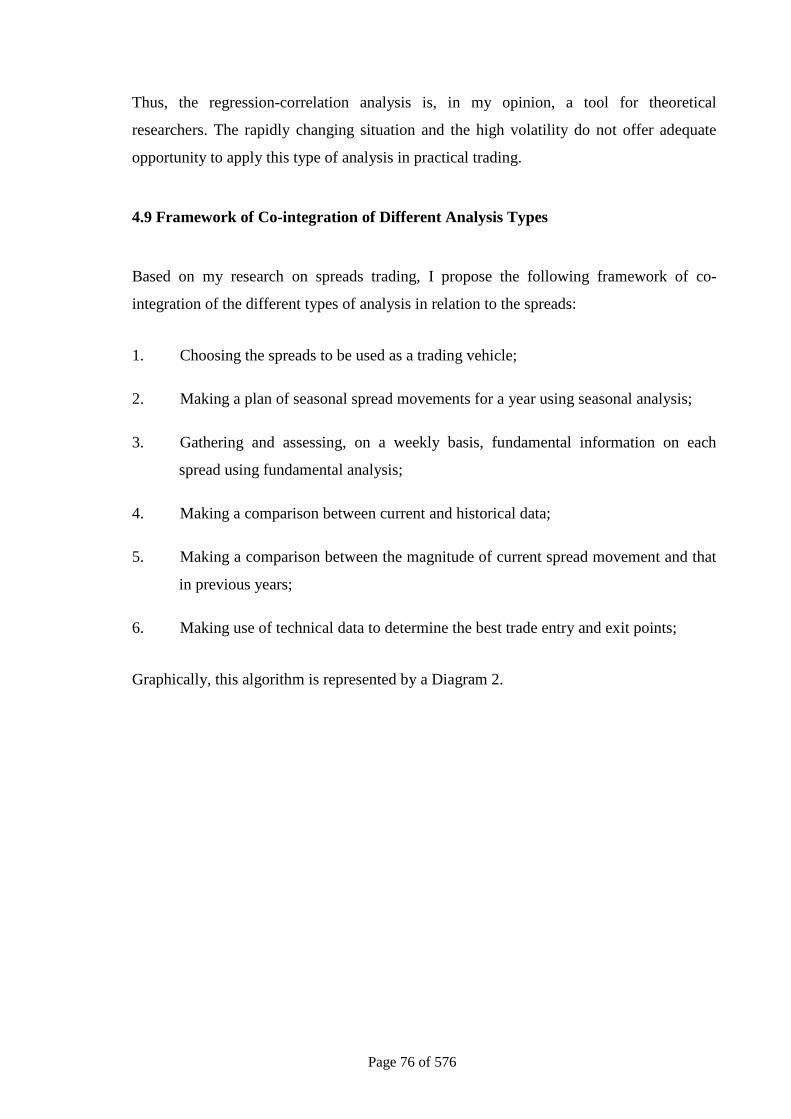
Page 76 of 576
Thus, the regression-correlation analysis is, in my opinion, a tool for theoretical
researchers. The rapidly changing situation and the high volatility do not offer adequate
opportunity to apply this type of analysis in practical trading.
4.9 Framework of Co-integration of Different Analysis Types
Based on my research on spreads trading, I propose the following framework of co-
integration of the different types of analysis in relation to the spreads:
1. Choosing the spreads to be used as a trading vehicle;
2. Making a plan of seasonal spread movements for a year using seasonal analysis;
3. Gathering and assessing, on a weekly basis, fundamental information on each
spread using fundamental analysis;
4. Making a comparison between current and historical data;
5. Making a comparison between the magnitude of current spread movement and that
in previous years;
6. Making use of technical data to determine the best trade entry and exit points;
Graphically, this algorithm is represented by a Diagram 2.

Page 77 of 576
Diagram 2: Algorithm of co-integration of the different types of analysis in relation to
the spreads.
Spread choice
Making a plan of seasonal spread movements for a year using
seasonal analysis
Weekly assessment of fundamental information
Making a comparison between current and historical data
Assessment of the magnitude of the current spread movement by comparing it with previous years
Determination of the trade entry and exit points using technical
analysis
Placing a trade
Page 78 of 576
The algorithm described above shows how the four types of analysis can be used to search
for potentially interesting trades. Let us discuss each step in this algorithm separately.
1. Choosing the spreads to be used as a trading vehicle
An approach to trading strategy development is highly dependent on the types of spreads.
Since there is a rich variety of spreads, investors should be very clear about what spreads
they are going to trade in.
Spreads can be classified into different groups using various criteria, beginning with the
relation between the futures comprising a spread—for example, agricultural futures, metals
futures, etc.—and ending with the level of volatility. This largely depends on the investor’s
interests and objectives. Of course, an experienced investor has a clear idea about what
spreads he is going to trade in, whereas a beginning investor will find this choice rather
challenging. Although it is hard to advise someone on choosing the spreads, to simplify the
task, I would suggest categorising spreads as follows:
— by commodity group;
— by the degree of seasonal influences;
— by volatility.
The spreads falling within category 1 are classified by the commodity group to which the
futures comprising these spreads belong, i.e.:
— energy products, including crack spreads;
— agricultural products, including grains, soybean complex, meat, etc.;
— industrial metals;
— precious metals;
— currencies, including currency indices;
— interest rates, including interest rate indices;
— stock futures;
— stock index futures;
— weather futures;
— emission allowances, etc.

Page 79 of 576
Classification by commodity group allows investors to understand better which particular
group they are going to deal with. This choice will determine which fundamental and
seasonal factors investors will have to analyse because these factors are peculiar to each
commodity group (and, of course, they are even more specific for each particular spread).
Classification based on the degree of seasonality influences would enable investors who
rely heavily on seasonal analysis to focus on those spreads in which seasonality is more
pronounced as a major influence factor. Although it is very difficult to measure the extent
to which seasonality affects the multitude of existing spreads, I will try to do it by dividing
the spreads into three groups:
— those with a high degree of seasonal influences;
— those with a medium degree of seasonal influences;
— those with a low degree of seasonal influences.
The spreads that display a high degree of seasonality influences include: heating oil,
natural gas, gasoline, soybean and soybean products calendar spreads; heating oil/gasoline
spread, and heating oil/gasoil spread.
The spreads that exhibit a medium degree of seasonality influences include: crude oil
calendar spreads, heating oil/crude oil spread, gold/silver spread, gold/ platinum spread,
crack spread, crush spread, and spark spread.
The spreads that are little affected by seasonal effects include: stock index spreads, stock
index - single stock futures spreads, currency spreads, WTI/Brent spread, and
platinum/silver spread.
By grouping spreads according to their volatility, the investor can better identify the
spreads that he would prefer for trading based on a perceived risk exposure. It would be
logical to suppose that the more volatile a spread, the higher the risk exposure. A more
conservative investor would therefore likely prefer less volatile spreads. The volatility of a
spread depends both on the type to which it belongs (calendar, intercommodity,
intermarket, or processing) and on the volatility of the futures comprising the spread. A
general rule in this situation may be formulated as follows: calendar and intermarket

Page 80 of 576
spreads are less volatile than intercommodity and processing spreads. As for the futures,
their volatility varies dramatically. Below is a list of some of the futures contracts arranged
in ascending order of volatility:
— interest rate futures;
— currency futures;
— commodity index futures;
— agricultural futures;
— stock index futures;
— precious metals;
— energy futures;
— industrial metals.
Certainly, this ranking is rather conventional, since volatility changes over time and largely
depends on the time interval under analysis.
2. Making a plan of seasonal spread movements for a year using seasonal analysis
As mentioned earlier, various types of spreads are affected by seasonal factors to different
extents (Moore et al., 2006). To explain how the above described approach works, I will
assume that an investor is interested in working with a spread that is significantly affected
by seasonal factors—for example, a gasoline calendar spread. From a seasonal analysis of
this spread, the investor finds out that its size changes according to a certain seasonal
pattern from year to year: it dramatically narrows starting in March and begins to sharply
widen in September. Thus, one comes to the conclusion that he or she is mostly interested
in the early spring and early autumn periods and there isn’t much need to track this spread
during the months that do not fall into the period of interest. At the same time, nobody is
able to guess when the gasoline spread will start to narrow in the spring, but the investor
can start actively tracking the behaviour of this spread well in advance, for example, from
late February, waiting for a suitable moment to bet. Then, a break in tracing the spread can
be made, if the trader is not interested in its interim fluctuations. In August, the investor
has to start tracing this spread again in order to correctly assess the time to enter the
market. Of course, making a timetable for “heightened attention” to one spread seems to be
a bit strange, but imagine that the investor’s arsenal includes more than 100 different

Page 81 of 576
spreads. The attention given to each spread will have to be limited to the minimum
necessary.
3. Gathering and assessing, on a weekly basis, fundamental information on each spread
using fundamental analysis
As soon as the investor starts to trace a spread in expectation of its potential seasonal
movement, it is necessary to begin collecting information to be able to perform an
adequate fundamental analysis. Since the fundamental factors do not change instantly, it
will be sufficient to conduct a weekly assessment of the situation in the subject area. For
instance, when it comes to a gasoline calendar spread, the best time to assess it is after the
EIA data are released.
4. Making a comparison between current and historical data
As new information about the spread of investor’s interest is accumulated, and new
fundamental data affecting this spread are published every week, he or she needs to
conduct a comparative analysis between these data and data for a similar period in past
years. This may give additional clues to understanding the nature and size of future spread
movements. For instance, the EIA announces that the gasoline inventories in the last week
of March were at the upper end of the average range for the last five years. After looking at
the data on inventories in past years, the investor discovers that even when the inventories
were at the bottom of this range, the spread did not start to narrow dramatically. It can
hardly be expected that when the inventories are at the upper end of the range, the spread
will start to narrow actively.
5. Making a comparison between the magnitude of current spread movement and that in
previous years
This comparison will help to better appreciate the levels reached by this spread and what
may be the local minimums and maximums for it. If the investor succeeds in finding a
similar spread in the past, which is close by its characteristics to the current spread, he or
she will gain a greater insight into how this spread may behave in the near future.

Page 82 of 576
Obviously, this is highly subjective, but if this method of analysis is treated as
supplementary, it may also prove to be useful in performing our next step in the algorithm:
evaluating a potential profit.
6. Making use of technical data to determine the best trade entry and exit points
In the chapter dedicated to technical analysis, I discussed quite extensively what methods
can be used in work with spreads. If the seasonal, fundamental and other factors suggest
that the spread should start widening, but at the moment it moves within a certain corridor,
it would be logical to suppose that if the spread goes beyond the limits of this corridor in
the expected direction and fixes there, it may serve as a good signal to enter the market.
Accordingly, if the movement within the expected trend has met considerable resistance,
which is below the level of the anticipated profit, then perhaps one should think about
closing the trade at the level of this resistance, as it is quite possible that it will not be
“broken through,” and the spread will turn around and move in the opposite direction. It
should be noted that a technical analysis should preferably be employed at the final stage
of spread assessment as a logical completion of the preparation for trading strategy
implementation.
Based on the works of Smith (2000) and Publication 1, I created a schematic plan that
should help to implement in practice (e.g., formalise) the steps of the offered algorithm.

Page 83 of 576
Sample plan for situation analysis before placing a position
General Data: _____________________________________________________ Name of instrument: _________________________________________ Number of contracts: _________________________________________ Margin: ___________________________________________________ Commission: _______________________________________________
Fundamental analysis
What is the current supply situation? What is the current demand situation? Are demand and supply balanced? Estimated forecast for this year. ____________________________________________________________ ____________________________________________________________ ____________________________________________________________ ____________________________________________________________
Seasonal analysis
Analysed period: from __________________ to ______________________ Probability of a successful trade, % _________________________________ Average movement: _____________________________________________ Maximum rise: _________________________________________________ Maximum fall: _________________________________________________ Comments on seasonal analysis:____________________________________ ______________________________________________________________
Technical chart analysis
Trend: long-term _______________________________________________ medium-term __________________________________________________ short-term ____________________________________________________ Support levels: _________________________________________________ Resistance levels: ______________________________________________ Annual contract maximum: _______________________________________ Annual contract minimum: _______________________________________ Comments on technical analysis: __________________________________ ____________________________________________________________
Historical analysis
How many years have been studied? What method of study was used? Were there any years similar to today’s situation? Which factors were similar and which were different? What happened to the price in similar years? Describe the expected price movement scenario (position lifetime). ____________________________________________________________ ____________________________________________________________ ____________________________________________________________

Page 84 of 576
Conclusions from all analyses
What are the reasons for opening the position? Which indicators and factors are favorable/adverse to opening the positions? What must happen for the position not to work? Expected scenario of how the price (position) will behave. ____________________________________________________________ ____________________________________________________________ ____________________________________________________________ ____________________________________________________________
Expected actions
Position: buy_______________________ sell ________________________ Opening level: _________________________________________________ Opening day: __________________________________________________ Stop/Loss level: _________________________________________________ Will trailing Stop/Loss be used? ___________________________________ Take/Profit target: _______________________________________________
Page 85 of 576
4.10 Conclusion
When working with spreads, investors should consider the results of the four types of
analysis: fundamental, seasonal, technical, and comparative-historical. Financial markets in
recent years have tended to show the weakened role of fundamental factors and analysis,
with the simultaneously increasing importance of technical analysis. Seasonal and
comparative-historical analyses play only a supplementary role in making trading
decisions. Regression-correlation analysis is barely applicable for practicing traders.
In this chapter I reviewed the specifics of the application of each type of analysis in
practice. The algorithm of co-integration of four types of analysis for making trading
decisions was offered.
After intensive study, I consider the most useful tool of technical analysis to be the
Relative Strength Index (RSI). This tool could be of specific interest to the investors
utilising discretionary contrarian strategies based on futures spreads. This indicator could
be integrated most efficiently into strategies with a short-to-medium-term investment
horizon.
4.11 Summary of Chapter Four
This chapter considered in detail the possibility of practical application of all types of
analyses to spreads, assessed supplementary function of comparative-historical analysis
and demonstrated inefficiency of application for practicing investors of the regression-
correlation analysis.
The chapter proposes an algorithm of co-integration of the four types of spreads analysis
for the purposes of creating trading strategies and decision-making.
The chapter also includes an expanded literature review and demonstrates the standing of
my research in relation to other works in this field.

Page 86 of 576
Chapter Five: Contribution to Knowledge
5.1 Introduction
This chapter demonstrates the achievement of the specific thesis objectives set out in Chapter One. It then sets out the contribution made by the six publications and the thesis to theoretical knowledge, to practitioner knowledge and to methodological theory and practice. It summarises the significance of the contribution, and reflects on the limitations of the research investigations, and of the thesis itself. It then provides an indication of areas for further research, and discusses wider implications for research. It also expresses some
personal reflections on the PhD process, and concludes with the final overview.
5.2 Achievement of the Thesis Aim and Objectives
Chapter One set out the general aims of the thesis and the four specific research objectives
which are to:
1. Systematise, classify and describe spreads based on the most liquid metal, energy
and index futures contracts.
The existing literature on this subject was reviewed and my own system of classification
and grouping was proposed based on the common approaches. Different heavily traded
spreads were described in detail.
2. Develop a spread analysis methodology using technical, fundamental, seasonal and
historical comparison analyses.
I achieved this through deep research of the different types of analysis and reviewed the
specifics of application of each analysis type. For each spread mentioned in the
publications, I conducted fundamental analysis, which could be used as a methodological
template. I then reviewed a wide array of academic and practitioner literature to assist in
deeper understanding of the subject under investigation.

Page 87 of 576
3. Develop approaches to designing trading strategies based on the use of spreads as an
investment tool.
I then reviewed different approaches to designing trading strategies. The key to the
successful spreads trading is the ability of the trader to implement the results of different
analysis types into daily work. Besides, a trader must clearly realise the specifics of each
spread. The submitted publications broadly address these issues.
4. Develop a theoretical model for implementing a practical task of using futures
spreads as an investment tool.
To achieve this objective, the research offered the algorithm of co-integration of four
analysis types. The thesis discussed the money management theme in application to
spreads.
The proposed new framework was formalized in the form of an article submitted for a
review.
5.3 Contribution to Knowledge
5.3.1 Summary of Contribution
The publications upon which this PhD by publication is based collectively make a
contribution to practitioners, theoretical and methodological knowledge (Table 2).

Page 88 of 576
Table 2: Summary of Contribution
Publication Contribution to:
Reference Publication No
Theoretical Knowledge
Methodological Knowledge
Practitioner Knowledge
Perchanok (2011) 1 Yes Yes Yes
Perchanok and Hrytsyuk (2011) 2 - Yes Yes
Perchanok (2011) 3 Yes Yes Yes
Perchanok (2011) 4 Yes Yes Yes
Perchanok (2011) 5 Yes - -
Perchanok (2012) 6 Yes Yes Yes
5.3.2 How Each Publication Contributed to Theoretical, Practitioner and Methodological Knowledge
The proposed thesis and the constituent publications contribute new insights to the
questions surrounding futures spreads and the possibility to utilise them as an investment
tool. The following results demonstrate the originality of the research:
− The thesis contributed to the theory of storage (Working, 1933, 1949) by drawing
attention to the problems related to the market of crude oil calendar spreads.
− Publications 1 and 2 developed a spread analysis methodology using technical,
fundamental, seasonal and historical comparison analyses. On this basis, the author
has analysed and evaluated the fundamental factors relating to each individual
spread.
Page 89 of 576
I considered in detail the possibility of practical application of all types of analyses to
spreads, assessed supplementary function of comparative-historical analysis, and
demonstrated the inefficiency of application for practicing investors of the regression-
correlation analysis. I then proposed an algorithm of co-integration of the four types of
spreads analysis for the purposes of creating trading strategies and decision-making.
Development of spread analysis methodology contributes greatly to theoretical, practical
and methodological knowledge.
− Publication 1 proposed a classification system for futures spreads based on the most
liquid metal, energy and futures index contracts.
An approach to trading strategy development is highly dependent on the types of spreads.
Since there is a rich variety of spreads, investors should be very clear about what spreads
they choose to trade. Spreads can be combined into different groups using various criteria,
beginning with the relation between the futures comprising a spread, for example,
agricultural futures or metals futures, and ending with a level of volatility. This largely
depends on the investor’s interests and objectives. I offered grouping by the following
criteria: by commodity, degree of seasonal influence and volatility.
Classification by commodity group allows investors to understand better with which
particular group they are going to deal. with. This choice will determine which
fundamental and seasonal factors investors will have to analyse, because these factors are
peculiar to each commodity group (and, of course, are even more specific for each
particular spread).
Grouping based on the degree of seasonality influences would enable investors who
heavily rely on seasonal analysis to focus on those spreads in which seasonality is more
pronounced as a major influence factor. Although it is very hard to measure the extent to
which seasonality affects the multitude of existing spreads, I divided the spreads into three
categories:
— with a high degree of seasonal influences;
Page 90 of 576
— with a medium degree of seasonal influences; and
— with a low degree of seasonal influences.
By grouping spreads according to their volatility, the investor can better identify the
spreads that he would prefer for trading based on a perceived risk exposure. It would be
logical to suppose that the more volatile a spread, the higher the risk exposure. A more
conservative investor would therefore be likely to prefer less volatile spreads. The
volatility of a spread depends both on the type to which it belongs (calendar,
intercommodity, intermarket or processing) and on the volatility of the futures comprising
the spread.
Spreads classification and grouping contributes to practical, as well as methodological
knowledge.
− Publication 2 provided an evaluation of the possibility of applying one of the most
popular technical indicators, the RSI, to futures spreads.
There are a number of technical analysis methods that enable one to assess reverse
movements with a varying degree of accuracy. RSI is the most widely used. Until my
publication there have been no serious attempts to investigate the possibility of applying
this indicator in spread trading. This tool could be specifically of interest to the investors
who utilise discretionary contrarian strategies based on futures spreads. Most efficiently,
one could integrate this indicator into strategies with a short-to-medium term investment
horizon. The evaluation represents contribution to theoretical, practical and methodological
knowledge.
− Publications 1 and 6 examined in detail one of the newest and least described spreads
in the literature - the spark spread.
This spread has recently emerged and became very widely used by professional
participants of energy markets such as hedgers and speculators. Despite this, it has
Page 91 of 576
received very small attention in the methodological literature. Perhaps this is because of
the complexity of this financial instrument. My attempt to publish research on the
fundamental factors affecting this spread was one of the first. Practitioners might be
interested in the explanation of the difficult underlying concept such as heat rate.
Methodological input is also quite significant because the publications proposed methods
of calculating investment results.
− Publication 5 analysed and researched thoroughly reasons for the occurrence of an
abnormal contango on the WTI oil market.
Chapter Three covers this subject in more detail. Here I would stress that this publication
provides theoretical contribution drawing attention to the problem of application of the
theory of storage and Cost of Carry model in current circumstances. This article
contributes to the practitioner knowledge by showing that the WTI crude oil benchmark
has become disconnected from the world oil prices.
− Publication 1 described in detail a methodology for dealing in the index/stock spread.
1. This spread is of interest to investors who pursue the following objectives: hedging
against general market risks by selling the index and simultaneously assembling
one’s own stock portfolio or vice versa; eliminating risks inherent in a particular set
of individual stocks and concurrently buying or selling the index as a whole. The
publication also discussed broad categories of spreads such as index spreads.
Although both subjects are broad and deserve further investigation, my work
provides the foundation for that. The most relevant contribution here is to provide
practitioners with methodological knowledge.
2. The practical application of futures spreads requires the trader to deal with such
issues as plotting a chart and calculating a spread’s tick value, which I considered
separately for each spread in my work. Publications 1, 3 ,4 and 6 attributed to that.
There is a definitive contribution to the methodological and practitioner knowledge.

Page 92 of 576
5.4 Limitations of the Research
The main limitation of my thesis is the impossibility of reviewing all existing variations of
futures spreads. There are many possibilities to construct futures spreads. Almost any
financial instruments related to each other could be spread out. This opens up before
practicing traders and academics significant opportunities for the practical use and study of
this subject. At the same time, it imposes certain limitations on what one can research
within the frame of a single thesis.
In my research I focused on the major commodity spreads and examined in more detail
spreads based on energy and precious metals futures. The theme of these spreads can be
considered well studied in my thesis. The work did not consider spreads on interest rate
futures as this subject deserves a separate deep and extensive individual study. My study
considered the subjects of index spreads and single stock-index spreads. I proposed the
basic principles of working with them and analysed them. However, the application of
these spreads is so wide, that it also requires a separate, concentrated study.
During the course of research I discovered a problem with the use of cost of carry model
for the market of crude oil calendar spreads. These issues were highlighted in my work in
detail, but the adaptation of the model to the current market conditions must be done within
the framework of additional research.
Whilst accepting the above limitations, I am aware that they are inherent in any scientific
research undertaken on such a broad subject matter, especially if the subject is not covered
in sufficient depth in the practical and academic literature. In general, I think that I have
achieved the goals set before me from the start of the study and consider the limitations as
an opportunity for further research, as I will discuss in more detail in the next section.
5.5 Opportunities for Further Research
As mentioned above, there is a vast variety of futures spreads. Having studied in detail
spreads based on energy and precious metals futures, there is still much to explore. In the
future I would like to focus on a more detailed study of index spreads, because I believe
Page 93 of 576
that this category of spreads is interesting both from practical and theoretical points of
view. The main reason for this is that trading in index futures and the ETFs is huge in
terms of turnover and represents financial market segments in which thousands of
instruments are traded. The subject of index spreads is barely researched. Particularly
promising, in my opinion, is exploring the possibility of capitalising on the index spreads,
which are comprised of the indices denominated in different currencies.
Another interesting aspect to study is testing the application of different technical
indicators in the index spreads trading. Of particular interest is the RSI indicator.
Researchers on this topic face problems such as determining overbought and oversold
levels for individual index spreads and market monitoring in search of spreads with
extreme values.
5.6 Personal Experience as a Part of the PhD and Research Process: A reflective
Journey
My first acquaintance with the stock exchange was in 1993, when I worked at the
exchange as a broker. Since then my interest in this subject has never waned. Since 2004, I
delved into the study of financial markets. Initially, the scope of my interests was wide
enough and included such tools as FOREX, CFD and futures. In addition to the text books
I have read, a significant amount of analytical literature allowed me to understand better
the functioning of markets. By 2008, I had already a deep knowledge and mature
perception of the markets. My interests have focused on the topic of futures spreads which
I decided to explore further. Since this topic is very broad, the study required all of my
previously acquired knowledge, as well as a significant amount of new theoretical and
practical information. The research process helped me to focus and organise my thoughts.
The desire to share my ideas with a wide range of practitioners and academics evolved into
eight publications, six of which are the basis of this thesis.
It is worth mentioning that as a researcher, but also an active trader, I had a chance to trade
in reality most of spreads researched in my work. This practical experience helped me with
my publications. The realisation that some aspects require deeper study received its
impetus from sometimes negative results that I experienced from live trading. As an

Page 94 of 576
example, I could provide anomalies on the crude oil calendar spreads markets. By that time
I was already researching and trading futures spreads. Before 2008, a spread sale at
carrying charges was a secure and profitable trade for many years. Suddenly, it created
losses. These losses urged me to investigate deeper this issue which resulted in the
appearance of Publication 5. I could provide several similar examples.. All of it shows that
the research process was a challenging journey closely linked to practice.
Overall, the PhD and research process provided me with a solid foundation in the
theoretical and empirical tools of modern finance, drawing heavily on the discipline of
economics.
5.7 Summary of Chapter Five
The final chapter identifies the contribution of the thesis to theoretical and practitioner
knowledge, and explores the limitations of the whole process. It sets out reflections and
learning points including implications for further research.
The original research aim, to gain a deeper understanding of futures spreads, was achieved.
Page 95 of 576
References
Anand, A. (2000) The impossibility of full carry markets. Derivatives Quarterly. 6, 31-49.
Ates, A. and Wang, H. K. G. (2007) Price dynamics in energy spot and futures markets:
the role of inventory and weather. CFTC Working Paper.
Banking News & Directory. (2012) Central bank rates [online]. Available from:
http://www.banksdaily.com/central-banks/ [Accessed 11th March 2012].
Barnes, T. J. (2001) Retheorizing economic geography: from the quantitative revolution to
the “Cultural Turn”. Annals-Association of American Geographers. 91.3, 546-565.
BBC News. (2008) OPEC agrees record oil output cut [online]. Available from:
http://news.bbc.co.uk/2/hi/business/7786456.stm [Accessed 20th December 2008].
Bernstein, J. (1990) Jake Bernstein's seasonal futures spreads: high-probability seasonal
spreads for futures traders. New Jersey: John Wiley & Sons.
Bessembinder, H., Coughenour, J. F., Seguin, P. J. and Smoller, M. M. (1995) Mean
reversion in equilibrium asset prices: evidence from the futures term structure. Journal of
Finance. 50, 361-375.
Billingsley, R. and Chance, D. (1988) The pricing and performance of stock index futures
spreads. Journal of Futures Markets. 8, 303-318.
Black, F. (1976) The pricing of commodity contracts. Journal of Finance Economics. 3,
167-179.
Black, T. R. (1999) Doing quantitative research in the social sciences: an integrated
approach to research design, measurement and statistics. London: Sage.

Page 96 of 576
Blaikie, N. (2003) Analysing quantitative data: from description to explanation. London:
Sage.
Blas, J. (2009) Saudis drop WTI oil contract. Financial Times. 29 October, p 26.
Board of Governors of the Federal Reserve System. (2012) Federal Reserve press release
[online]. 13 March . Available from:
http://www.federalreserve.gov/newsevents/press/monetary/20120313a.htm [Accessed 13th
March 2012].
Board, J. and Sutcliffe, C. (1996) The dual listing of stock index futures: arbitrage, spread
arbitrage and currency risk. Journal of Futures Markets. 16, 29-54.
Brennan, M. J. (1958) The supply of storage. American Economic Review. 48, 50-72.
Brennan, M. J. (1986) A theory of price limits in futures markets. Journal of Financial
Economics. 16, 213-233.
Buckley, P. (2002) Is the international business research agenda running out of stream?
Journal of International Business Studies. 33.2, 365-374.
Butterworth, D. and Holmes, P. (2002) Inter-market spread trading: evidence from U.K.
index futures markets. Applied Financial Economics. 12, 783-791.
Carpenter, R. E. and Levy, D. (1998) Seasonal cycles, business cycles, and the
comovement of inventory investment and output. Journal of Money, Credit, and Banking.
30, 331-335.
Chance, D. M. (1991) An introduction to options and futures. Dryden Press: Chicago.
Charupat, N. and Deaves, R. (2003) Backwardation in energy futures markets:
Metallgesellschaft revisited. Energy Studies Review. 1, 1-26.

Page 97 of 576
Cho, D. W. and McDougall, G. S. (1990) The supply of storage in energy futures markets.
The Journal of Futures Markets. 10, 611-621.
Chow, G. (1983) Econometrics. New York: McGraw-Hill.
CME Group. (2012) Energy products: light sweet crude oil (WTI) futures [online].
Available from: http://www.cmegroup.com/trading/energy/crude-oil/light-sweet-
crude_contract_specifications.html [Accessed 11th March 2012].
Creswell, J. W. (2003) Research design: qualitative, quantitative and mixed methods
approaches. 2nd ed. Thousand Oaks, CA: Sage.
Cupchik, G. (2001) Constructivist realism: an ontology that encompasses positivist and
constructivist approaches to the social sciences. Forum Qualitative Social Research.
[online]. Available from: http://www.qualitative-research.net/fqs [Accessed 11th March
2012]
De Bondt, W. and Thaler, R. (1985) Does the stock market overreact? Journal of Finance.
3, 793-808.
DeMark, T. R. (1994) The new science of technical analysis. New Jersey: John Wiley &
Sons.
Duffie, D. (1989) Futures Markets. London: Prentice Hall.
Edwards, F. R. and Canter, M. S. (1995) The collapse of Metallgesellschaft: unhedgeable
risks, poor hedging strategy or just bad luck? Journal of Futures Markets. 15, 211-264.
Elfakhani, S. and Wionzak, R. J. (1997) Inter-market spread opportunities between
Canadian and American agricultural futures. International Review of Economics and
Finance. 6, 361-377.

Page 98 of 576
Errera, S. and Brown, S. L. (1999) Fundamentals of trading energy futures & options.
Houston: Pennwell Corp.
Fabozzi, F. (2005) The Handbook of Fixed Income Securities. 7th ed. New York: McGraw-
Hill.
Fama, E. F. (1970) Efficient capital market: a review of theory and empirical work.
Journal of Finance. 25, 383-417.
Fama, E. F. (1991) Efficient capital markets II. Journal of Finance. 46 (5), 1575-1617.
Fama, E. F. and French, K. R. (1987) Commodity futures prices: some evidence on
forecast power, premiums and the theory of storage. Journal of Business. 60, 55-74.
Fama, E. F. and French, K. R. (1988) Business cycles and the behavior of metal prices.
Journal of Finance . 43, 1075-1093.
Gao, A. H. and Wang, G. H. K. (2005) Asymmetric volatility of basis and the theory of
storage. The Journal of Futures Markets. 25, 399-418.
Gibbons, M. and Hess, P. (1981) Day of the week effects and assets returns. Journal of
Business. 54, 579-596.
Gray, R. W. and Peck, A. E. (1981) The Chicago wheat futures market: recent problems in
historical perspective. Food Research Institute Studies. 18, 89-115.
Grossman, S. and Stiglitz, J. (1980) On the impossibility of informationally efficient
markets. American Economic Review. 70, 393-408.
Habiby, M. (2007) WTI prices don't reflect international oil market, study says [online].
Bloomberg News. 13 April. Available from:
http://www.bloomberg.com/apps/news?pid=newsarchive&sid=apum7LTvljdc [Accessed
Page 99 of 576
20th May 2012].
Habiby, M. (2010) Oil declines as dollar strengthens [online]. Bloomberg News. 18 March.
Available from: http://www.independent.ie/business/stocks-markets/oil-declines-as-dollar-
strengthens-2103912.html [Accessed 20th March 2012].
Haigh, M. S. and Holt, M. T. (2002) Crack spread hedging: accounting for time-varying
spillovers in the energy futures markets. Journal of Applied Economics. 17, 269-280.
Harrington, S. H., Keoun, B. and Harper, C. (2012) JPMorgan trader Iksil fuels prop-
trading debate with bets [online]. Bloomberg News. 9 April. Available from:
http://www.bloomberg.com/news/2012-04-09/jpmorgan-trader-iksil-fuels-prop-trading-
debate-with-bets.html [Accessed 9th April 2012].
Hendrickson, L. and McKelvey, B. (2002) Foundations of “new” social science. PNAS.
99:3, 7288-7295.
Hull, J. (2006) Options, futures, and other derivatives. 6th ed. New Jersey: Prentice-Hall.
ICE. (2012) Energy products. ICE Brent crude oil futures [online]. Available from:
https://www.theice.com/productguide/ProductDetails.shtml?specId=219 [Accessed 11th
March 2012].
Kaldor, N. (1939) Speculation and economic stability. Review of Economic Studies. 9, 1–
27.
Kawaller, I. G., Koch, P. D. and Ludan, L. (2002) Calendar spreads, outright futures
positions and risk. Journal of Alternative Investments. Winter, 59-74.
Klombies, K. (2006) Will grains follow metals? Futures Magazine. July, 34-36.
Larson, D. F. (1994) Copper and the negative price of storage. PRWP 1282, International
Page 100 of 576
Economics Department, World Bank, Washington, D.C.
Lee, J. (2011) Platinum: fire sale on the rich man's gold [online]. Kitco News. 29
December. Available from: http://www.kitco.com/ind/Lee/printerfriendly/dec292011.html
[Accessed 9 April 2012].
Litzenberger, R. H. and Rabinowitz, N. (1995) Backwardation in oil futures markets:
theory and empirical evidence. Journal of Finance. 50, 1517-45.
Luca, C. (2000) Trading in the global currency markets. 2nd ed. New York: New York
Institute of Finance.
Malkiel , B. G. (2011) A random walk down Wall Street: the best investment tactic for the
new century. New York: W.W. Norton & Company.
Malkiel, B. (1992) Efficient market hypothesis. In P. Newman, M. Milgate, and J. Eatwell
(eds.), New Palgrave dictionary of money and finance. London: Macmillan.
Malkiel, B. G. (1999) A random walk down Wall Street. New York: W.W. Norton &
Company.
Malkiel, B. G. (2003). The efficient market hypothesis and its critics. Princeton, NJ: Center
for Economic Policy Studies, Princeton University.
Markin, J. P. (2006) Theory of economic analysis. Moscow: Knorus.
McComas, A. (2003) Getting technical with spreads. Futures Magazine. July, 52-55.
McConnell, C., Brue, S. and Flynn, S. (2008) Economics. 18th ed. New York: McGraw-
Hill/Irwin.
Moles, P. (2004) Derivatives. Edinburgh: Edinburgh Business School.

Page 101 of 576
Moore, S., Toepke, J. and Colley, N. (2006) The encyclopedia of commodity and financial
spreads. New Jersey: John Wiley & Sons.
Mouawad, J. (2008) OPEC agrees to another cut in production. The New York Times. 18
December, p B5.
Murphy, J. J. (1999) Technical analysis of the financial markets: a comprehensive guide to
trading methods and applications. New York: York Institute of Finance.
Murray, A. R. (2004) Better trading with seasonals. Futures Magazine. June, 60-64.
Murray, A. R. (2006) Market cycles – are they fundamental? Futures Magazine. August,
48-51.
Ng, V. K. and Pirrong, S. C. (1994) Fundamentals and volatility: storage, spreads and
dynamics of metal prices. Journal of Business. 67, 203-230.
Ng, V. K. and Pirrong, S. C. (1996) Price dynamics in refined petroleum spot and futures
markets. Journal of Empirical Finance. 2, 359-388.
Parkin, M., Powell, M. and Matthews, K. (2005) Economics. 6th ed. Harlow: Longman
Publishing Group.
Perchanok, K. (2012) Trading machines taking control of the financial market. The Hedge
Fund Journal. 74, 60-63.
Pindyck, R. S. (1994) Inventories and short-run dynamics of commodity prices. Rand
Journal of Economics. 25, 141-159.
Prosvetov, G. I. (2008) Econometrics. Moscow: Alfa-Press.

Page 102 of 576
Rechner, D. and Poitras, G. (1993) Putting on the crush: day trading the soybean complex
spread. Journal of Futures Markets, 13, 61-75.
Roberts, H. (1967) Statistical versus clinical prediction of the stock market. Unpublished
manuscript.
Roberts, H. V. (1959) Stock-market patterns and financial analysis: methodological
suggestions. Journal of Finance. 14 (1), 1-10.
Ross, J. (2006a) Exploiting spread trades. Futures Magazine. December, 34-36.
Ross, J. (2006b) Trading spreads and seasonals. Cedar Park: Ross Trading.
Rozeff, M. and Kinney, W. (1976) Capital market seasonality: the case of stock returns.
Journal of Financial Economics. 3, 379-402.
Ryan, B., Scapens, R. W. and Theobald, M. (2002) Research methods and methodology in
finance and accounting. London: Cengage Learning.
Salcedo, Y. (2004) Spreads for the fall. Futures Magazine. September, 54-57.
Schap, K. (2005) The complete guide to spread trading. New York: McGraw-Hill.
Schwager, J. D. (1995) Schwager on futures: technical analysis. New Jersey: John Wiley
& Sons.
Schwager, J. D. and Turner, S. C. (1995) Futures: fundamental analysis. New Jersey: John
Wiley & Sons.
Schwarz, T. and Szakmary, A. (1994) Price discovery in petroleum markets: price
discovery, cointegration, and the time interval analysis. Journal of Futures Markets. 9,
147-167.

Page 103 of 576
Sharpe, W. F., Alexander, G. J. and Bailey, J. V. (1999) Investments. New Jersey:
Prentice-Hall.
Shiller, R. (1981) Do stock prices move too much to be justified by subsequent changes in
dividends? American Economic Review. 3 (June), 421-436.
Simon, D.P. (1999) The Soybean Crush Spread: Empirical Evidence and Trading
Strategies. Journal of Futures Markets, 19, pp. 271-289.
Smith, C. (2000) Futures spreads trading: the complete guide. Greenville: Traders Press.
Susmel, R. and Thompson, A. (1997) Volatility, storage and convenience: evidence from
natural gas markets. The Journal of Futures Markets. 17, 17-43.
Telser, L. G. (1958) Futures trading and the storage of cotton and wheat. Journal of
Political Economy. 66, 233–255.
Theil, H. (1971) Principles of econometrics. New York: Wiley.
Thomsett, M. C. (2006) Getting started in fundamental analysis. New Jersey: John Wiley
& Sons.
Tokic, D. (2011) Rational destabilizing speculation, positive feedback trading, and the oil
bubble 2008. Energy Policy. 39, 2051-2061.
Tolmasky, C. and Hindanov, D. (2002) Principal components analysis for correlated
curves and seasonal commodities: the case of the petroleum market. Journal of Futures
Markets. 11, 1019-1035.
U.S. Department of Agriculture (USDA). (2012) Agency reports: USDA scheduled release
dates for agency reports and summaries [online]. Available from:
http://www.usda.gov/wps/portal/usda/usdahome [Accessed 11th March 2012].

Page 104 of 576
U.S. Energy Information Administration (EIA). (2012a) Independent statistics and
analysis, EUA [online]. Available from: http://www.eia.doe.gov [Accessed 11th March
2012].
U.S. Energy Information Administration (EIA). (2012b) Stocks of crude oil by PAD
district, and stocks of petroleum products, U.S. totals [online]. Available from:
http://www.eia.doe.gov [Accessed 20 March 2012].
U.S. Geological Survey (USGS). (2012) Independent statistics and analysis [online].
Available from: http://www.usgs.gov/science/science.php?term=799 [Accessed 10th April
2012].
Wahab, M., Cohn, R. & Lashgari, M. (1994) The Gold-Silver Spread: Integration,
Cointegration, Predictability, and Ex-ante Arbitrage. Journal of Futures Markets, 14, pp.
709-756.
Wilder, W. J. (1978) New concepts in technical trading systems. New York: Trend
Research.
Williams, J. (1986) The economic function of futures markets. Cambridge: University
Press.
Williams, J. T. (1977) Capital asset prices with heterogeneous beliefs. Journal of Financial
Economics. 5, 219–239.
Williams, L. (1999) Long-term secrets to short-term trading. New York: Wiley.
Williams, L. (2005) Trade stocks and commodities with the insiders. New York: Wiley.
Wong, W., Manzur, M & Chew, B. (2002) How Rewarding Is Technical Analysis?
Evidence From Singapore Stock Market. NUS Department of Economics Working Paper,
No.0216.

Page 105 of 576
Working, H. (1933) Price relations between July and September wheat futures at Chicago
since 1885. Wheat Studies of the Food Research Institute. 9, 187–238.
Working, H. (1948) Theory of inverse carrying charge in futures markets. Journal of Farm
Economics. 30, 1-28.
Working, H. (1949) The theory of price of storage. American Economic Review. 39, 1254-
1262.
Working, H. (1953) Futures trading and hedging. American Economic Review. 43, 314-
343.
Working, H. (1962) New concepts concerning futures markets and prices. American
Economic Review. 52, 431–459.
Wright, R.W. and Ricks, D.A. (1994) Trends in international business research: twenty-
five years later. Journal of International Business Studies. 25.4, 687-701.

Page 106 of 576