future waves : trends impacting student populations for next 10 years
DESCRIPTION
ADAPE Australasia National Conference Charting New Waters 3 October 2004. Workshop 2 A/B. 4 . Future Waves : Trends Impacting Student Populations for Next 10 Years. Speaker. Annimac www.annimac.com.au. Reminder from this morning Rate of Change. - PowerPoint PPT PresentationTRANSCRIPT
Future Waves :
Trends Impacting Student Populations for Next 10 Years
Workshop 2 A/B. 4 Workshop 2 A/B. 4
Annimacwww.annimac.com.au
ADAPE Australasia National Conference
Charting New Waters 3 October 2004
Speaker


Reminder from this morningReminder from this morning
Rate of Change Rate of Change
• every 15 seconds every 15 seconds == new web site new web site
• every 15 minutes every 15 minutes == new technology new technology
• every 15 days = new product / service
Amount of change in one day,
Grandmother had in one year.
Younger we are - faster our world moves.
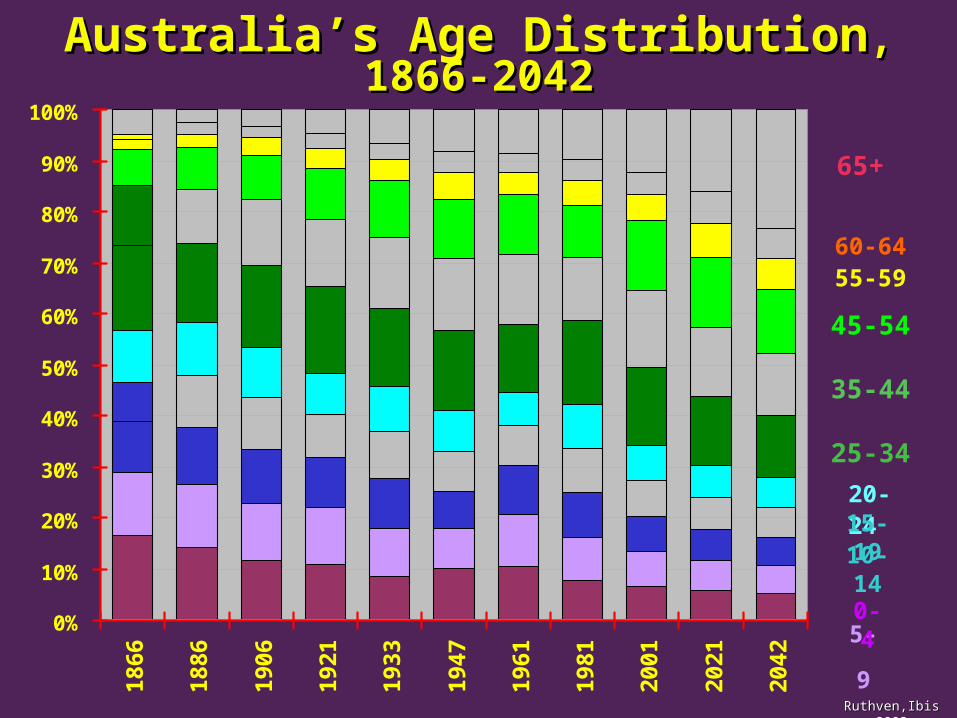
Australia’s Age DistributionAustralia’s Age Distribution,, 1866-20421866-2042
0%
10%
20%
30%
40%
50%
60%
70%
80%
90%
100%1
86
6
18
86
19
06
19
21
19
33
19
47
19
61
19
81
20
01
20
21
20
42
Ruthven,Ibis 2003Ruthven,Ibis 2003
65+
55-5960-64
45-54
35-44
25-34
20-2415-1910-14
5-90-4

Slightly Increasing Time for EducationSlightly Increasing Time for Education
0
100
200
300
400
500
600
700
800
900
1000
1788 1838 1888 1938 1988 2038 2088
Tho
usan
ds o
f Hou
rs
Year born
Leisure Time
Paid Work
Unpaid Work
Education
Travel to Work
Sleep
46%
44%
43%
32%29%
27%23%
38 years
50 years
74 years
120 ? years
Ruthven,Ibis 2003Ruthven,Ibis 2003Ruthven,Ibis 2003Ruthven,Ibis 2003

Australia’s Population 1866 - 2051Australia’s Population 1866 - 2051
0
10
20
30 0-4
5-9
10-14
15-19
20-24
25-34
45-54
55-59
60-64
65+
0-4 16.5 14.2 11.7 11.1 8.6 10.1 10.6 7.6 6.5 5.70 5.30
5-9 12.5 12.5 11.2 11 9.5 8 10 8.6 6.8 5.80 5.40
10-14 9.8 11.1 10.6 9.8 9.5 7.1 9.7 8.9 6.9 5.90 5.50
15-19 7.7 10.2 10.1 8.3 9.3 7.7 7.7 8.6 7.0 6.00 5.70
20-24 10.1 10.2 9.7 8.3 8.8 8.1 6.6 8.6 7.1 6.30 6.00
25-34 16.9 15.7 16.2 16.8 15.4 15.8 13.2 16.3 15.1 13.20 12.10
45-54 7.1 8 8.6 9.9 11.2 11.7 11.7 10.2 13.60 13.40 12.50
55-59 2 2.7 3.5 4 3.9 5.2 4.4 5 5.20 6.40 6.00
60-64 1.1 2.1 2.3 3.1 3.4 4.3 3.8 4.1 4.20 6.20 5.80
65+ 4.8 2.7 3.2 4.6 6.5 8.1 8.5 9.8 12.40 15.80 23.40
1866 1886 1906 1921 1933 1947 1961 1981 2001 2021 2042
Source: ABS

Population Distribution 2001 – 2021 Population Distribution 2001 – 2021 AustraliaAustralia
AgeAge 20012001 20212021
0-40-4 6.5 %6.5 % 5.8 %5.8 %
5-95-9 6.96.9 5.95.9
10-1410-14 6.96.9 5.95.9
15-1915-19 7.07.0 6.06.0
20-2420-24 7.17.1 6.36.3
25-3425-34 15.115.1 13.213.2
35-4435-44 15.115.1 15.115.1
45-5445-54 13.613.6 13.413.4
55-5955-59 5.25.2 6.46.4
60-6460-64 4.24.2 6.26.2
65+65+ 12.412.4 15.815.8Source: ABS


Population Projections to 2051 Population Projections to 2051 AustraliaAustralia
Capital CitiesCapital Cities Total Total
19991999 12.11 million 17.20 million 12.11 million 17.20 million
20512051 19.0 25.41 19.0 25.41
ABS 2002ABS 2002

Age :Age : % Pop :% Pop : 2001 :2001 : 2021 :2021 :
15-1915-19 6.0 6.0 1.03 m1.03 m 1.53 m1.53 m
20-2420-24 6.3 6.3 1.08 m1.08 m 1.60 m1.60 m
Student Age NumbersStudent Age Numbers Australia 2001 – 2021Australia 2001 – 2021Student Age NumbersStudent Age Numbers Australia 2001 – 2021Australia 2001 – 2021


Changing Nature of ChangeChanging Nature of Change
2020thth Century Century : : trackable demographicstrackable demographics
sstatistics useful predictors of demographic trendstatistics useful predictors of demographic trends
quantitative info useful for future planningquantitative info useful for future planning
linear projections reliablelinear projections reliable
stats accurately gatheredstats accurately gathered
2121stst Century Century : fast shifting demographics: fast shifting demographics
sstatistics useful historical information tatistics useful historical information
linear projections often misleadinglinear projections often misleading
useful predictors increasingly qualitativeuseful predictors increasingly qualitative
intuitive reasoning necessaryintuitive reasoning necessary


Shifting Student TrendsShifting Student Trends
2020thth Century : Century :
mono cultural normsmono cultural norms
single career pathsingle career path
long term life viewlong term life view
stable relationshipsstable relationships
professions respectedprofessions respected
2121stst Century : Century :
multi cultural diversity multi cultural diversity
no career pathno career path
immediacyimmediacy
temporary relationshipstemporary relationships
no deference, disreputeno deference, disrepute

Shifting student trends Shifting student trends
2020thth Century : Century :
compliant to ed systemcompliant to ed system
academia establishmentacademia establishment
value ed for contentvalue ed for content
Uni ed prestigiousUni ed prestigious
VET lower statusVET lower status
economic rationalismeconomic rationalism
2121stst Century : Century :
charting own educationcharting own education
www establishmentwww establishment
value ed as ticketvalue ed as ticket
Uni ed out of touchUni ed out of touch
VET skills valuedVET skills valued
coopitalismcoopitalism


Young Understand Technology Drives Young Understand Technology Drives Change Change
They know that in 2020
70 % of job types do not exist now
because
80% of technology is not invented yet.
Does your educational institution ?

GenerationsGenerations
Baby Boomers
b 1945 – 60 age 45 - 60 fewer females than males
Generation X 1960 – 75 30 - 45 largest number in population
DotComs 1975 – 90 15 – 30 first wired gen
Ferals 1990 – 05 0 - 15 smallest number - ½ of GenX


TrendsTrends BABY BOOMERS BABY BOOMERS 45 - 6045 - 60
Married or divorced
Empty nesters
Retired or p-t work
Identity from job
Material status
Downsizing their lives
Set relationships
Sense of community
Travellers, homebodies
Medium term planners
Seek new IF safe experiences
Security conscious
Health conscious
Defer to authorityDefer to authority
Love & hate changeLove & hate change

TrendsTrends GEN X ERS GEN X ERS 30 - 4530 - 45
SingleSingle
ChildlessChildless
I.d. ephemeral, I.d. ephemeral, changing changing
Global i.d., no Global i.d., no commitmentcommitment
Short term planners Short term planners
Risk takers, fast Risk takers, fast decisionsdecisions
Mobile, Mobile, nfa, renters , renters
Varied lifestyles, wired Varied lifestyles, wired
Multi careers, SOHOMulti careers, SOHO
Net DatingNet Dating
Materialism assumed Materialism assumed
Environmental valuesEnvironmental values
Personal journeyPersonal journey
Defer to heroesDefer to heroes
Expect, accept changeExpect, accept change


TrendsTrends DOTCOMS DOTCOMS 15 - 3015 - 30
Parental homeParental home
Global I.d. Global I.d.
No careers, own pathNo careers, own path
I.d. from activityI.d. from activity
Group socialisingGroup socialising
Temporary pairingTemporary pairing
WiredWired
Net relationships Net relationships
ImmediacyImmediacy
Multi channeled, multi Multi channeled, multi actions actions
Non consumers Non consumers
Planetary group Planetary group missionmission
Temporary deferenceTemporary deference
Need & welcome Need & welcome changechange


TrendsTrends FERALS FERALS 0 - 150 - 15
Parental home Parental home No patternsNo patterns Unlimited channelsUnlimited channels Future jobs Future jobs
unimportantunimportant Global limitless Global limitless
relationshipsrelationships Momentary Momentary
relationshipsrelationships Global i.d. & Global i.d. &
commitment commitment
Very immediate & long Very immediate & long
term viewterm view I.d. from self valuesI.d. from self values Non consumers, global Non consumers, global
valuesvalues Wired into global villageWired into global village Planetary mission, self & Planetary mission, self &
groupgroup No deference, respect per No deference, respect per
needneed Live change, ignore all Live change, ignore all
barriersbarriers


SUMMARYSUMMARY Future Waves of StudentsFuture Waves of Students
Increasing rate of change
Technology drives all change
Younger exponentially faster
Huge generational differences
As global world shrinks :
gain more knowledge
more options
greater passion
responsibility with dignity.


Thank youThank you www.annimac.com.au www.annimac.com.au