futures portfolio fund, limited …/media/sites/public/portal/static reports...3 part i item 1....
TRANSCRIPT

UNITED STATES SECURITIES AND EXCHANGE COMMISSION
Washington, D.C. 20549
FORM 10-K
ANNUAL REPORT PURSUANT TO SECTION 13 OR 15(d) OF THE SECURITIES EXCHANGE ACT OF 1934
For the Fiscal Year Ended December 31, 2013
Commission file number: 000-50728
FUTURES PORTFOLIO FUND, LIMITED PARTNERSHIP Organized in Maryland IRS Employer Identification No.: 52-1627106
c/o Steben & Company, Inc. 9711 Washingtonian Blvd., Suite 400
Gaithersburg, MD 20878 Telephone: (240) 631-7600
Securities to be registered pursuant to Section 12(b) of the Act: NONE
Securities to be registered pursuant to Section 12(g) of the Act: Limited Partner Interests
Indicate by check mark if the registrant is a well-known seasoned issuer, as defined in Rule 405 of the Securities Act. Yes No
Indicate by check mark if the registrant is not required to file reports pursuant to Section 13 or Section 15(d) of the Act. Yes No
Indicate by check mark whether the registrant: (1) has filed all reports required to be filed by Section 13 or 15(d) of the Securities Exchange Act of 1934 during the preceding 12 months (or for such shorter period that the registrant was required to file such reports), and (2) has been subject to such filing requirements for the past 90 days. Yes No
Indicate by check mark whether the registrant has submitted electronically and posted on its corporate web site, if any, every Interactive Data File required to be submitted and posted pursuant to Rule 405 of Regulation S-T (§232.405 of this chapter) during the preceding 12 months (or for such shorter period that the registrant was required to submit and post such files). Yes No
Indicate by check mark if disclosure of delinquent filers pursuant to Item 405 of Regulation S-K (§229.405 of this chapter) is not contained herein, and will not be contained, to the best of registrant’s knowledge, in definitive proxy or information statements incorporated by reference in Part III of this Form 10-K or any amendment to this Form 10-K.
Indicate by check mark whether the registrant is a large accelerated filer, an accelerated filer, a non-accelerated filer, or a smaller reporting company. See definition of “accelerated filer,” “large accelerated filer” and “smaller reporting company” in Rule 12b-2 of the Exchange Act. (Check one):
Large Accelerated Filer Accelerated Filer
Non-Accelerated Filer (Do not check if a smaller reporting company)
Smaller reporting company
Indicate by check mark whether the registrant is a shell company (as defined in Rule 12b-2 of the Exchange Act). Yes � No Aggregate market value of the voting and non-voting common equity held by non-affiliates: N/A.

Table of Contents
Part I Item 1. Business ......................................................................................................................................... 3 Item 1A. Risk Factors ................................................................................................................................... 7 Item 1B. Unresolved Staff Comments ........................................................................................................ 12 Item 2. Properties ..................................................................................................................................... 12 Item 3. Legal Proceedings ....................................................................................................................... 13 Item 4. Mine Safety Disclosures .............................................................................................................. 13
Part II
Item 5. Market for Registrant's Common Equity, Related Stockholder Matters and Issuer Purchases of Equity Securities .................................................................................................... 13 Item 6. Selected Financial Data ............................................................................................................... 14 Item 7. Management's Discussion and Analysis of Financial Condition and Results of Operations ....... 16 Item 7A. Quantitative and Qualitative Disclosures About Market Risk ..................................................... 25 Item 8. Financial Statements and Supplementary Data ........................................................................... 29 Item 9. Changes in and Disagreements with Accountants on Accounting and Financial Disclosure.. .... 29 Item 9A. Controls and Procedures .............................................................................................................. 29 Item 9B. Other Information ........................................................................................................................ 30
Part III
Item 10. Directors, Executive Officers, and Corporate Governance ........................................................ 30 Item 11. Executive Compensation ............................................................................................................. 32 Item 12. Security Ownership of Certain Beneficial Owners and Management ........................................ 32 Item 13. Certain Relationships and Related Transactions, and Director Independence ............................ 33 Item 14. Principal Accountant Fees and Services ...................................................................................... 33
Part IV
Item 15. Exhibits and Financial Statement Schedules ............................................................................... 33 Signatures……………………………………………………..………………….………………………………35

3
PART I Item 1. Business Futures Portfolio Fund, Limited Partnership (“Fund”) is a Maryland limited partnership, was formed on May 11, 1989 and began trading on January 2, 1990. Using professional trading advisors, the Fund engages in the speculative trading of futures contracts, forward currency contacts and other financial instruments traded in the United States (“U.S.”) and internationally. The Fund primarily trades futures contracts within six major market sectors: equity indices, currencies, interest rate instruments, energy products, metals and agricultural commodities. The Fund’s fiscal year ends each December 31, and the Fund will automatically terminate on December 31, 2025, unless terminated earlier as provided in the Third Amended and Restated Limited Partnership Agreement (“Partnership Agreement”). At December 31, 2013, the aggregate capitalization of the Fund was $880,409,705, consisting of Class A interest of $550,501,395, Class B interest of $325,651,536 and Class I interest of $4,256,774. The net asset value per limited partner interests (“Units”) of the Class A Units was $4,114.51, Class B Units was $5,789.73 and Class I units was $910.42 at December 31, 2013. The Fund’s assets are allocated among professional commodity trading advisors (“Trading Advisors”). Portions of the Fund’s assets may be allocated to other investment funds or pools at the discretion of Steben & Company, Inc. (“General Partner”). The General Partner is responsible for selecting and monitoring the Trading Advisors, and it may add new Trading Advisors in the future, terminate the current Trading Advisors, and will, in general, allocate and reallocate the Fund’s assets among the Trading Advisors as it deems is in the best interests of the Fund. During 2011, the Fund made investments totaling $90 million in the Steben Institutional Fund LLC (“SIF”), whose manager was the General Partner. The Fund was the only member in SIF. Similar to the Fund, SIF used professional trading advisors to engage in the speculative trading of futures and forward currency contracts traded in the U.S. and internationally. SIF traded within six major market sectors: agricultural commodities, currencies, energy, equity indices, interest rate instruments and metals. SIF commenced trading on March 1, 2011. SIF incurred trading advisor management and incentive fees, as well as reimbursed its manager for operating expenses incurred on its behalf. During 2012, the General Partner liquidated SIF and all of the assets of SIF were transferred to the Fund by October 31, 2012. The Fund maintains its margin deposits and reserves in cash, U.S. Treasury securities, U.S. and foreign government sponsored enterprise notes, registered U.S. money market funds, commercial paper, certificates of deposit and corporate notes in accordance with Commodity Futures Trading Commission (“CFTC”) rules. All interest income earned by the Fund accrues to the benefit of the Fund. The Fund’s business constitutes only one segment for financial reporting purposes. The Fund does not engage in material operations in foreign countries, although it does trade on international futures markets, nor is a material portion of its revenues derived from foreign customers. General Partner
Under the Partnership Agreement, management of all aspects of the Fund’s business and administration is carried out exclusively by the General Partner, a Maryland corporation organized in February 1989. The General Partner is registered with the CFTC as a commodity pool operator and introducing broker, and is also registered with the U.S. Securities and Exchange Commission (“SEC”) as an investment adviser and a broker dealer. The General Partner is a member of the National Futures Association (“NFA”) and the Financial Industry Regulatory Authority (“FINRA”). The General Partner manages all aspects of the Fund’s business, including selecting the Fund’s trading advisors; allocating the Fund’s assets among them; possibly investing a portion of the Fund’s assets in other investment pools; selecting the Fund’s futures broker(s), accountants and attorneys; computing the Fund’s net assets; reporting to limited partners; directing the allocation of excess margin monies; and processing subscriptions and redemptions. The General Partner maintains office facilities for and furnishes administrative and clerical services to the Fund. There have been no material administrative, civil or criminal actions within the past five years against the General Partner or its principals, and no such actions currently are pending.

4
Trading Advisors
As of February 28, 2014, the Trading Advisors of the Fund and the allocation of the Fund’s trading level are reflected as follows:
% of Total Allocations Altis Partners (Jersey), Ltd 1% BlueCrest Capital Management LLP 23% Estlander & Partners Ltd. 6% Fort Investment Management, L.P. 4% Lynx Asset Management 5% PGR Capital LLP 3% Quantitative Investment Management, LLC 18% Transtrend BV 15% Winton Capital Management, Ltd. 25%
These allocations are subject to change at the General Partner’s sole discretion.
An objective of the Fund’s multi-manager approach is to reduce the Fund’s volatility without sacrificing overall rates of return. The General Partner may, from time to time, adjust the amount of assets allocated to each Trading Advisor, add new Trading Advisors, terminate Trading Advisors or replace Trading Advisors without prior notice to investors. Trading Advisors are selected by the General Partner based on their performance histories and other factors. Selling Agents The General Partner acts as a selling agent for the Fund. The General Partner has and intends to continue to appoint certain other broker-dealers registered under the Securities Exchange Act of 1934, as amended (“1934 Act”), and members of FINRA, to act as additional selling agents with respect to Class A and B Units. Selling agents are selected to assist in the making of offers and sales of Class A and B Units. Including the General Partner, the Fund currently has approximately 100 selling agents. The selling agents are not required to purchase any Class A, B or I Units, or sell any specific number or dollar amount of Class A, B and I Units, instead use their best efforts to sell such Units. Where the General Partner acts as the selling agent it retains the selling agent fees. Futures Brokers and Forward Currency Counterparties The Fund’s futures trading is currently conducted with Newedge USA, LLC (“NUSA”) and J.P. Morgan Securities LLC (“JPMS”). NUSA is a subsidiary of Newedge Group, SA. Newedge Group was formed on January 2, 2008 as a joint venture by Société Générale and Calyon to combine the brokerage activities previously carried by their respective subsidiaries which comprised the Fimat Group and the Calyon Financial Group of affiliated entities. Newedge Group, which is owned 50% each by Calyon and Société Générale, is a société anonyme governed by French law. Newedge UK Finance Limited (NEUK), one of the Fund’s forward currency counterparties, is a wholly-owned subsidiary of Newedge Group, incorporated in England and Wales, and regulated by the Financial Services Authority for the conduct of business in the UK. JPMS is an indirect, wholly-owned subsidiary of JPMorgan Chase & Co., one of the largest bank holding companies in the U.S. UBS AG is another of the fund’s forward currency counterparties. UBS AG is a global financial services company operating in more than 50 countries. The General Partner may, in its discretion, have the Fund use other futures brokers, swap or forward currency counterparties if it deems it to be in the best interest of the Fund. Cash Managers The Fund has engaged J.P. Morgan Investment Management, Inc. (“JPMIM”) and Principal Global Investors, LLC (“PGI” and, together with JPMIM, the “Cash Managers”) to provide cash management services to the Fund. The Cash Managers will manage the Fund’s cash and excess margin through investments in fixed income instruments, pursuant to investment parameters established by the General Partner.

5
Description of Current Charges
Charges Amount Trading Advisor Management Fees
Each class of Units incurs monthly trading advisor management fees, payable monthly or quarterly in arrears, to the Trading Advisors (based on the assets under their management), equal to:
BlueCrest Capital Management, LLP: 1/12th of 2% Quantitative Investment Management, LLC: 0% Transtrend BV: 1/12th of 0.75% to 1% Winton Capital Management, Ltd: 1/12th of 1.5% Other Trading Advisors*: 1/12th of 1% to 2%
*Individual Trading Advisors represent less than 10% allocation of the Fund’s trading level.
Trading Advisor Incentive Fees
Each class of Units incurs quarterly trading advisor incentive fees, payable in arrears to the Trading Advisors, for any “Net New Trading Profits” generated on the portion of the Fund the respective Trading Advisor manages, equal to:
BlueCrest Capital Management, LLP 20% Quantitative Investment Management, LLC 30% Transtrend BV 25% Winton Capital Management Ltd. 20% Other Trading Advisors*: 12.50% to 25%
*Individual Trading Advisors represent less than 10% allocation of the Fund’s trading level. Net New Trading Profits are calculated based on formulas defined in each Trading Advisor’s trading agreement. In determining Net New Trading Profits, any trading losses generated by the respective Trading Advisor for the Fund in prior periods are carried forward, so that the incentive fee is assessed only if and to the extent the profits generated by the Trading Advisor for the period exceed any losses from prior periods. The loss carry-forward is proportionally reduced if and to the extent the Fund reduces the amount of assets allocated to the Trading Advisor.
Brokerage Commissions and Expenses
The Fund incurs brokerage commissions and expenses on U.S. futures exchanges at the approximate rate of $1.03 to $24.61, with an average of $3.78 per “round-turn” futures transaction (includes NFA, execution, clearing and exchange fees). Brokerage commissions and expenses may be higher for trades executed on certain foreign exchanges.
Cash Manager Fees
Each class of Units incurs a monthly cash manager fee, payable in arrears to the Cash Managers, equal to approximately 1/12th of 0.11% of the investments in securities and certificates of deposit.
General Partner Management Fee
The Fund incurs a monthly fee on Class A and Class B Units equal to 1/12th of 1.5% of the month-end net asset value of the Class A and Class B Units, payable in arrears. Prior to June 1, 2012, the general partner management fee was 1.75% per annum. The Fund incurs a monthly fee on Class I Units equal to 1/12th of 0.75% of the month-end net asset value of the Class I Units, payable in arrears.
General Partner Performance Fee
The Fund incurs a monthly fee on Class I Units equal to 7.5% of new profits of the Class I Units calculated monthly. The general partner performance fee is payable quarterly in arrears.
General Partner 1 percent allocation
The General Partner receives an annual allocation of 1% of any increase (or decrease) in the Fund’s net asset value, without regard to subscriptions and redemptions.
Selling Agent Fees and Broker Dealer Servicing Fees
The General Partner charges monthly selling agent fees and broker dealer servicing fees, equal to 1/12th of 2% of the month-end net asset value for Class A Units and 1/12th of 0.2% of the month-end net asset value for Class B Units, payable in arrears. The General Partner, in turn, pays selling agent fees and broker dealer servicing fees to the respective selling agents. If selling agent fees are not paid to the selling agents, or if the General Partner was the selling agent, such portions of the selling agent fees are retained by the General Partner.

6
Charges Amount Administrative Fee
Each class of Units incur a monthly General Partner administrative fee equal to 1/12th of 0.45% of Fund net assets at the end of each month, payable in arrears. This fee compensates the General Partner for a portion of its actual monthly administrative expenses incurred in administering the Fund. The administrative expenses include all accounting, audit, legal, administrative, marketing and offering expenses, and other back office expenses related to the administration of the Fund.
Market Sectors The Fund trades speculatively, through the allocation of its assets to Trading Advisors, in U.S. and international futures markets, and may trade or hold futures, forwards, swaps or options. Specifically, the Fund trades futures on interest rate instruments, equity indices, energy products, currencies, metals and agricultural commodities. The Fund also trades forward currency contracts and may trade options, swaps and other forwards other than currencies in the future.
Market Types The Fund trades on a variety of U.S. and international futures exchanges. As in the case of its market sector allocations, the Fund’s commitments to different types of markets - U.S. and non-U.S., regulated and non-regulated - differ substantially from time to time, as well as over time, and may change at any time if a Trading Advisor, with the approval of the General Partner, determines such change to be in the best interests of the Fund. Regulations The Fund is a registrant with the SEC pursuant to the 1934 Act. As a registrant, the Fund is subject to the regulations of the SEC and the reporting requirements of the 1934 Act. As a commodity pool, the Fund is subject to the regulations of the CFTC, an agency of the U.S. government, which regulates most aspects of the commodity futures industry; rules of the NFA, an industry self-regulatory organization; and the requirements of commodity exchanges where the Fund executes transactions. Additionally, the Fund is subject to the requirements of futures commission merchants, futures brokers and Interbank market makers through which the Fund trades. Under the Commodity Exchange Act (“CEAct”), commodity exchanges and commodity futures trading are subject to regulation by the CFTC. The NFA, a registered futures association under the CEAct, is the only non-exchange self-regulatory organization for commodity industry professionals. The CFTC has delegated to the NFA responsibility for the registration of commodity trading advisors, commodity pool operators, futures commission merchants, introducing brokers and their respective associated persons and floor brokers. The CEAct requires commodity pool operators, commodity trading advisors and futures brokers or futures commission merchants such as the Fund’s futures brokers to be registered and to comply with various reporting and recordkeeping requirements. The General Partner and the Fund’s futures brokers are members of the NFA. The CFTC may suspend a commodity pool operator’s or trading advisor’s registration if it finds that its trading practices tend to disrupt orderly market conditions, or as the result of violations of the CEAct or rules and regulations promulgated thereunder. In the event the General Partner’s registration as a commodity pool operator were terminated or suspended, the General Partner would be unable to continue to manage the business of the Fund. Should the General Partner’s registration be suspended, dissolution of the Fund might result. The Dodd-Frank Wall Street Reform and Consumer Protection Act (“Reform Act”) was enacted in July 2010. The Reform Act includes provisions that comprehensively regulate the over-the-counter derivatives markets for the first time. The Reform Act will mandate that a substantial portion of over-the-counter derivatives must be executed in regulated markets and submitted for clearing to regulated clearinghouses. The mandates imposed by the Reform Act may result in the Fund bearing higher upfront and mark-to-market margin, less favorable trade pricing, and the possible imposition of new or increased fees. The Reform Act also amended the definition of eligible contract participant, and the CFTC has interpreted that definition in such a manner that the Fund may no longer be permitted to engage in forward currency transactions by directly accessing the interbank market. Rather, if and when the Reform Act’s new definition goes into effect, the Fund may be limited to engaging in retail forex transactions which could limit the Fund’s potential forward currency counterparties to futures commission merchants and retail foreign exchange dealers. Thus, limiting the Fund’s potential forward currency counterparties could lead to the Fund bearing higher upfront and mark-to-market margin, less favorable trade pricing, and the possible imposition of new or increased fees. The retail forex markets could also be significantly less liquid than the interbank market. Moreover, the creditworthiness of the futures commission merchants and retail foreign exchange dealers with whom the Fund may be required to trade could be significantly weaker than the creditworthiness of the financial institutions with whom

7
the Fund currently engages for its forward currency transactions. Although the impact of requiring the Fund to conduct forward currency transactions in the retail market could be substantial, the full scope is currently unknown and the ultimate effect could also be negligible. Additionally, the CFTC and certain commodity exchanges have established limits on the maximum net long and net short positions which any person, including the Fund, may hold or control in particular commodities. Most exchanges also limit the maximum changes in futures contract prices that may occur during a single trading day. The Fund also trades in dealer markets for forward currency contracts, which are not regulated by the CFTC. Federal and state banking authorities do not regulate forward trading or forward dealers. In addition, the Fund trades on foreign commodity exchanges, which are not subject to regulation by any U.S. government agency. The CFTC adopted a separate position limits regime for 28 so-called “exempt” (i.e. metals and energy products) and agricultural futures and options contracts and their economically equivalent swap contracts, subject to a delayed implementation schedule. Position limits in spot months are 25% of the official estimated deliverable supply of the underlying commodity and in a non-spot month a percentage of the average open interest in all months for each contract. The General Partner believes that the proposed limits are sufficiently large that when implemented, they should not restrict the Fund’s trading strategy. Competition The Fund operates in a competitive environment in which it faces several forms of competition, including, without limitation, the following:
• The Fund competes with other commodity pools and other investment vehicles for investors.
• The Trading Advisors may compete with other traders in the markets in establishing or liquidating positions on behalf of the Fund.
Available Information The Fund files Forms 10-Q, 10-K, 8-K, 3 and 4, as required, with the SEC. The public may read and copy any materials filed with the SEC at the SEC’s Public Reference Room at 100 F Street, N.E., Washington, D.C. 20549. Additional information about the Reference Room may be obtained by calling the SEC at (800) SEC-0330. Reports filed electronically with the SEC may be found at http://www.sec.gov.
Reports to Security Holders None.
Enforceability of Civil Liabilities Against Foreign Persons
None. Item 1A. Risk Factors No Limitations on Trading Policies The Fund’s Partnership Agreement places no limitation on the trading policies the General Partner may pursue for the Fund. Potential Increase in Leverage The General Partner may increase the leverage used with a particular Trading Advisor by the use of notional funds. Notional funds are used when a Trading Advisor is instructed to trade an account according to its trading system under the assumption that the account is larger than the actual cash or securities on hand. This additional leverage, while creating additional profit potential which the General Partner feels may be appropriate with certain Trading Advisors in light of the Fund’s multi-trader diversification, also increases the risk of loss to the Fund.

8
Volatility The volatility of the Fund is expected to be similar to what it has been in the past, although it could be more or less volatile in the future depending upon the volatility of the market, the success of the Trading Advisors and the level of notional funding used by the General Partner in its allocations to the Trading Advisors. Liquidity Although the Fund offers monthly redemptions, the Fund may delay payment if special circumstances require, such as a market emergency that prevents the liquidation of commodity positions or a delay or default in payment to the Fund by a futures broker or a counterparty. Complex Fee Structure Allocation to more than one Trading Advisor makes the Fund’s fee structure more complex which in turn could diminish the Fund’s profit potential. Fund Expenses Will Be Substantial The Fund is obligated to pay brokerage expenses, selling agent and management fees to the General Partner and various Trading Advisors and other administrative fees, regardless of whether it realizes profits. The Fund will need to make substantial trading profits to avoid depletion of its assets from these expenses.
Reliance on General Partner The Fund’s success depends significantly on the General Partner’s ability to select Trading Advisors.
Dependence on Key Personnel The General Partner is dependent on the services of Mr. Kenneth E. Steben and key management personnel. If Mr. Steben’s services became unavailable, another principal of the firm or a new principal (whose experience cannot be known at this time) would need to take charge of the General Partner.
Reliance on the Trading Advisors The Fund’s success depends largely on the ability of its Trading Advisors. There can be no assurance that their trading methods will produce profits (or not generate losses). Past performance is not necessarily indicative of future results.
Reliance on Futures Brokers’ Financial Condition If one of the futures brokers becomes insolvent, the Fund might incur a loss of all or a portion of the funds it had deposited directly or indirectly with such futures broker. There is no government insurance for commodity brokerage accounts. Such a loss could occur if one of the futures brokers unlawfully failed to segregate its customers’ funds or if a customer failed to pay a deficiency in its account. Use of Cash Managers A significant percentage of the Fund’s assets not placed as margin with the futures brokers are managed by the Cash Managers. Using investment guidelines established by the General Partner, the Cash Managers invest the excess margin in U.S. Treasury securities, U.S. and foreign government sponsored enterprise notes, commercial paper, corporate notes and certificates of deposit. Although these investments are considered to be high quality, some of the securities purchased are neither guaranteed by the U.S. government nor supported by the full faith and credit of the U.S. government. There is some risk that a security issuer may fail to pay the interest and principal in a timely manner, or that negative perceptions about the issuer’s ability to make such payments will cause the price of these instruments to decline in value.
Investment in Other Investment Pools During 2011 and through October 2012, the Fund had an investment in Steben Institutional Fund LLC (SIF). SIF incurred trading advisor management and incentive fees, cash manager fees, as well as reimbursed its manager for operating expenses

9
incurred on its behalf. Although it does not do so currently, the Fund may invest in other pools. The Fund expects to be liable to those pools (e.g., limited partners), only for the amount of its investment plus any undistributed profits. However, there can be no assurance in this regard, and the Fund might invest as a general partner if the situation warranted, and thus be liable for additional amounts. Investment in pools (or similar investment vehicles), as distinguished from direct participation in the markets, has several potential disadvantages. Those investments may increase the Fund’s expenses, since the Fund will have to pay its pro rata share of the expenses borne by the investors in the pools, and the pools may have higher expenses. The Fund will generally be a minority investor in those pools and thus lack control over the pools. The pools might (a) change trading policies, strategies and trading advisors without prior notice to the Fund; (b) substantially restrict the ability of their investors to withdraw their capital from the pools; (c) be new ventures with little or no operating history; (d) be general rather than limited partnerships, thus increasing the Fund’s liability; and/or (e) use aggressive leveraging policies. Use of Electronic Trading The Trading Advisors may use electronic trading while implementing their strategies on behalf of the Fund. Electronic trading differs from traditional methods of trading. Electronic system transactions are subject to the rules and regulations of the exchanges offering the system or listing the specific contracts. Attributes of electronic trading may vary widely among the various electronic trading systems with respect to order requirements, processes and administration. There may also be differences regarding conditions for access and reasons for termination and limitations on the types of orders that may be placed into the system. These factors may present various risk factors with respect to trading on or using a specific system. Electronic trading systems may also possess particular risks related to system access, varying response times and security procedures. Internet enabled systems may also have additional risks associated with service providers and the delivery and monitoring of electronic communications.
Electronic trading may also be subject to risks associated with system or component failure. In the event of system or component failure, it is possible that a Trading Advisor may not be able to initiate new orders, fill existing orders or modify or cancel orders that were previously entered, as well as exit existing positions. System or component failure may also result in loss of orders or order priority. Some contracts offered on an electronic trading system may also be traded electronically and through open outcry during the same trading hours. Exchanges offering an electronic trading system which lists contracts may have implemented rules to limit their liability, the liability of futures brokers, as well as software and communication system vendors and the damages that may be collected for system inoperability and delays. These limitations of liability provisions may vary among the various exchanges. Changes in Trading Strategies The trading strategies of the Trading Advisors are continually developing. The Trading Advisors are free to make any changes in their trading strategies, without notice, if they feel that doing so will be in the Fund’s best interest. The General Partner will notify the limited partners of any such changes that the General Partner considers material. Changes in commodities or the markets traded shall not be deemed a change in trading strategy.
Disadvantages of Periodic Incentive Fees Because the Trading Advisor incentive fees (if any) are paid on a quarterly basis, they could receive incentive fees for a period even though their trading for the year was unprofitable. Once an incentive fee is paid, the Trading Advisors retain the fee regardless of their subsequent performance, but no new incentive fees will be paid until after all previous losses have been recovered.
Disadvantages of Multi-Trader Structure The Fund’s use of multiple Trading Advisors to conduct its trading has several potential disadvantages. Each Trading Advisor is paid incentive fees solely on the basis of its trading for the Fund. The Fund, therefore, could have periods in which it pays fees to one or more Trading Advisors even though the Fund, as a whole, has a loss for the period (because the losses incurred by the Fund from unprofitable Trading Advisors exceed the profits earned by the Fund from profitable Trading Advisors).
Because the Trading Advisors trade independently of each other, they may establish offsetting positions for the Fund. For example, one Trading Advisor may sell 12 March wheat contracts at the same time another Trading Advisor buys 12 March wheat contracts. The net effect for the Fund will be the incurring of two brokerage commissions without the potential for earning a profit (or incurring a loss).

10
Under certain unusual circumstances, the Fund might have to direct a Trading Advisor to liquidate positions in order to generate funds needed to meet margin calls, to fund the redemption of Units, or to permit the reallocation of funds to another Trading Advisor. Such liquidations could disrupt the Trading Advisor’s trading system or method.
Disadvantages of Replacing Trading Advisors The General Partner has the authority to reallocate the Fund’s assets among the Trading Advisors, terminate Trading Advisors and allocate assets to new Trading Advisor(s), or invest the Fund’s assets in other investment funds or commodity pools. Trading Advisors generally have to “make up” previous trading losses incurred by the Fund on portions of the Fund the Trading Advisors are managing, before they can earn an incentive fee. However, a Trading Advisor might terminate its services to the Fund or the General Partner might decide to replace a Trading Advisor when it has such a loss carry-forward. The Fund might have to pay a new Trading Advisor higher advisory fees than are currently being paid to the current Trading Advisor. In addition, the Fund would lose the potential benefit of not having to pay the Trading Advisor an incentive fee during the time that the Trading Advisor was generating profits that made up for the prior losses. The replacement Trading Advisor would “start from scratch,” that is, the Fund would have to pay a new Trading Advisor an incentive fee for each dollar of profit it generated for the Fund, regardless of the Fund’s previous experience.
Limited Partners Do Not Participate in Management Limited partners are not entitled to participate in the management of the Fund or the conduct of its business.
Non-Transferability of Units Investors may acquire Units only for investment and not for resale, and the Units are transferable only with the General Partner’s consent, provided that the economic benefits of ownership of a limited partner may be transferred or assigned without the consent of the General Partner. There will be no resale market for the Units. However, limited partners may redeem all or (subject to certain limitations) any portion of their Units at the end of any month, on five business days’ written notice to the General Partner.
Possible Adverse Effect of Large Redemptions The Trading Advisors’ trading strategies could be disrupted by large redemptions by limited partners. For example, such redemptions could require the Trading Advisors to prematurely liquidate futures positions they had established for the Fund.
Mandatory Redemptions The General Partner may require a limited partner to redeem from the Fund if the General Partner deems the redemption (a) necessary to prevent or correct the occurrence of a nonexempt prohibited transaction under the Employee Retirement Income Security Act of 1974, as amended, or the Internal Revenue Code of 1986, as amended, (b) beneficial to the Fund or (c) necessary to comply with the Investment Company Act of 1940.
Indemnification The Fund is required to indemnify the General Partner, the Trading Advisors and the futures brokers, and their affiliates, against various liabilities they may incur in providing services to the Fund, provided the indemnified party met the standard of conduct specified in the applicable indemnification clause. The Fund’s indemnification obligations could require the Fund to make substantial indemnification payments.
Termination of Fund The Fund will automatically terminate on December 31, 2025, unless terminated earlier as provided in the Partnership Agreement. For example, the General Partner can withdraw on 60 days’ prior written notice, and such a withdrawal could result in termination of the Fund. The General Partner has no present intention of withdrawing and intends to continue the Fund business as long as it believes that it is in the best interest of all Partners to do so. In addition, certain events may occur which could result in early termination.

11
Lack of Regulation The Fund is not an investment company under the federal securities laws. Thus, limited partners will not have the benefits of federal regulation of investment companies. In addition, this offering is not registered with the SEC or any state.
Conflicts of Interest The General Partner and its principals have organized and are involved in other business ventures, and may have incentives to favor certain of these ventures over the Fund. The Fund will not share in the risks or rewards of such other ventures. However, such other ventures will compete for the General Partner’s and its principals’ time and attention, which might create other conflicts of interest. The Partnership Agreement does not require the General Partner to devote any particular amount of time to the Fund. The General Partner or any of its affiliates or any person connected with it may invest in, directly or indirectly, or manage or advise other investment funds or accounts which invest in assets which may also be purchased or sold by the Fund. Neither the General Partner nor any of its affiliates nor any person connected with it is under any obligation to offer investment opportunities of which any of them becomes aware to the Fund or to account to the Fund in respect of (or share with the Fund or inform the Fund of) any such transaction or any benefit received by any of them from any such transaction, but will allocate such opportunities on an equitable basis between the Fund and other clients. Incentive Fees to the Trading Advisors The Trading Advisors are entitled to incentive fees, therefore the Trading Advisors may have an incentive to cause the Fund to make riskier or more speculative investments than it otherwise would. Personal Trading The Trading Advisors, the futures brokers, the General Partner and the principals and affiliates thereof may trade commodity interests for their own account. In such trading, positions might be taken which are opposite those of the Fund, or that compete with the Fund’s trades. Trades by the Trading Advisors and their Principals The Trading Advisors and their principals may trade for their own accounts in addition to directing trading for client accounts. Therefore, the Trading Advisors and their principals may be deemed to have a conflict of interest concerning the sequence in which orders for transactions will be transmitted for execution. Additionally, a potential conflict may occur when the Trading Advisors and their principals, as a result of a neutral allocation system, testing a new trading system, trading their own proprietary account(s) more aggressively, or any other actions that would not constitute a violation of fiduciary duties, take positions in their own proprietary account(s) which are opposite, or ahead of, the position(s) taken for a client. Proprietary accounts, in trading a new or experimental system, may enter the same markets earlier than (either days before or on the same day) client accounts traded at the same or other futures commission merchants. Since the principals of the Trading Advisors trade futures and foreign exchange for their own accounts, there is potentially a conflict of interest between these principals and the Trading Advisors’ clients when allocating prices on trades that are executed by a futures commission merchant at multiple prices. In such instances, the Trading Advisors use a non-preferential method of fill allocation. The clients of the Trading Advisors will not be permitted to inspect the personal trading records of the Trading Advisors, NUSA, JPMS, or their respective principals, or the written policies relating to such trading. Client records are not available for inspection due to their confidential nature. Effects of Speculative Position Limits The CFTC and domestic exchanges have established speculative position limits on the maximum net long or net short futures position which any person, or group of persons, or group of persons acting in concert, may hold or control in particular futures contracts or options on futures traded on U.S. commodity exchanges. All commodity accounts owned or controlled by the Trading Advisors and their principals are combined for speculative position limits. Because speculative position limits allow the Trading Advisors and their principals to control only a limited number of contracts in any one commodity, the Trading Advisors and their principals are potentially subject to a conflict among the interests of all accounts the Trading Advisors and their principals control which are competing for shares of that limited number of contracts. There exists a conflict between the Trading Advisors’ interest in maintaining a smaller position in an individual client’s account in order to also provide positions in the specific commodity to other accounts under management and the personal accounts of the Trading Advisors and their principals. The General Partner does not believe, however, that the position limits are likely to impair the Trading Advisors’ trading for the Fund, although it is possible the issue could arise in the future.

12
To the extent that position limits restrict the total number of commodity positions which may be held by the Fund and those other accounts, the Trading Advisors will allocate the orders equitably between the Fund and such other accounts. Similarly, where orders for the same commodity given on behalf of both the Fund and other accounts managed by the Trading Advisors cannot be executed in full, the Trading Advisors will equitably allocate between the Fund and such other accounts that portion of the total quantity able to be executed. Other Activities of the Principals of the Advisors Certain principals of the Trading Advisors are currently engaged, and expect in the future to be engaged, in other activities, some of which may involve other business activities in the futures industry. In addition, each principal of the Trading Advisors may be engaged in trading for his own personal account. The principals will have a conflict of interest between their obligations to devote all of their attention to client accounts and their interests in engaging in other activities. However, the principals of the Trading Advisors intend to devote substantial attention to the operation and activities of the Trading Advisors consistent with the division of responsibilities among them as is described herein. Operation of Other Commodity Pools The General Partner currently operates two other commodity pools and might have an incentive to favor those pools over the Fund. Fiduciary Responsibility of the General Partner The General Partner has a fiduciary duty to the Fund to exercise good faith and fairness in all dealings affecting the Fund. If a limited partner believes this duty has been violated, he/she may seek legal relief under applicable law, for himself/herself and other similarly situated partners, or on behalf of the Fund. However, it may be difficult for limited partners to obtain relief because of the changing nature of the law in this area, the vagueness of standards defining required conduct and the broad discretion given the General Partner in the Partnership Agreement and the exculpatory provisions therein. Selling Agents The receipt by the selling agents and their registered representatives of continued sales commissions and/or servicing fees for outstanding Units may give them an incentive to advise limited partners to remain investors in the Fund. These payments cease to the extent the limited partners withdraw from the Fund. The General Partner Serving as Selling Agent The General Partner also serves as a selling agent for the Fund. As a result, the fees and other compensation received by the General Partner as selling agent have not been independently negotiated. Futures Brokers The futures brokers affect transactions for customers (including public and private commodity pools), including the Fund, who may compete with the Fund’s transactions including with respect to priorities or order entry. Since the identities of the purchaser and seller are not disclosed until after the trade, it is possible that the futures brokers could effect transactions for the Fund in which the other parties to the transactions are the futures brokers’ officers, directors, employees, customers or affiliates. Such persons might also compete with the Fund in making purchases or sales of commodities without knowing that the Fund is also bidding on such commodities. Since orders are filled in the order in which they are received by a particular floor broker, transactions for any of such persons might be executed when similar trades for the Fund are not executed or are executed at less favorable prices. However, in entering orders for the Fund and other customer accounts, including with respect to priorities of order entry and allocations of executed trades, CFTC regulations prohibit a futures commission merchant from utilizing its knowledge of one customer’s trades for its own or its other customer’s benefit.
Item 1B. Unresolved Staff Comments None. Item 2. Properties
The Fund does not use any physical properties in the conduct of its business. Its assets currently consist of futures and other contracts, cash and high grade fixed income instruments. The General Partner’s principal business office is in Gaithersburg, Maryland.
13
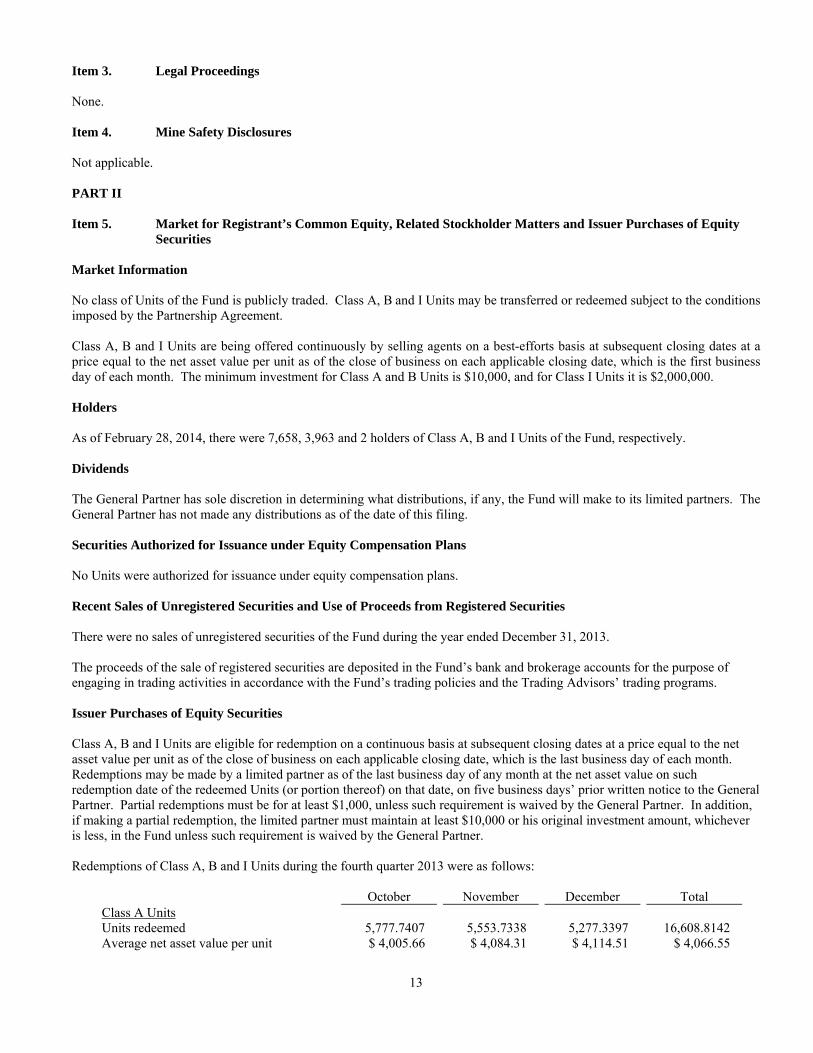
Item 3. Legal Proceedings None. Item 4. Mine Safety Disclosures Not applicable. PART II Item 5. Market for Registrant’s Common Equity, Related Stockholder Matters and Issuer Purchases of Equity
Securities Market Information No class of Units of the Fund is publicly traded. Class A, B and I Units may be transferred or redeemed subject to the conditions imposed by the Partnership Agreement. Class A, B and I Units are being offered continuously by selling agents on a best-efforts basis at subsequent closing dates at a price equal to the net asset value per unit as of the close of business on each applicable closing date, which is the first business day of each month. The minimum investment for Class A and B Units is $10,000, and for Class I Units it is $2,000,000. Holders
As of February 28, 2014, there were 7,658, 3,963 and 2 holders of Class A, B and I Units of the Fund, respectively. Dividends
The General Partner has sole discretion in determining what distributions, if any, the Fund will make to its limited partners. The General Partner has not made any distributions as of the date of this filing. Securities Authorized for Issuance under Equity Compensation Plans
No Units were authorized for issuance under equity compensation plans. Recent Sales of Unregistered Securities and Use of Proceeds from Registered Securities There were no sales of unregistered securities of the Fund during the year ended December 31, 2013. The proceeds of the sale of registered securities are deposited in the Fund’s bank and brokerage accounts for the purpose of engaging in trading activities in accordance with the Fund’s trading policies and the Trading Advisors’ trading programs. Issuer Purchases of Equity Securities
Class A, B and I Units are eligible for redemption on a continuous basis at subsequent closing dates at a price equal to the net asset value per unit as of the close of business on each applicable closing date, which is the last business day of each month. Redemptions may be made by a limited partner as of the last business day of any month at the net asset value on such redemption date of the redeemed Units (or portion thereof) on that date, on five business days’ prior written notice to the General Partner. Partial redemptions must be for at least $1,000, unless such requirement is waived by the General Partner. In addition, if making a partial redemption, the limited partner must maintain at least $10,000 or his original investment amount, whichever is less, in the Fund unless such requirement is waived by the General Partner. Redemptions of Class A, B and I Units during the fourth quarter 2013 were as follows:
October November December Total Class A Units Units redeemed 5,777.7407 5,553.7338 5,277.3397 16,608.8142 Average net asset value per unit $ 4,005.66 $ 4,084.31 $ 4,114.51 $ 4,066.55

14
Class B Units Units redeemed 4,729.4589 3,935.2076 2,470.5933 11,135.2598 Average net asset value per unit $ 5,619.74 $ 5,738.68 $ 5,789.73 $ 5,699.49
Class I Units Units redeemed -- -- -- -- Average net asset value per unit $ -- $ -- $ -- $ --
Item 6. Selected Financial Data The following selected consolidated financial data of the Fund as of and for the years ended December 31, 2013, 2012, 2011, 2010 and 2009 is derived from the consolidated financial statements that have been audited by McGladrey LLP (formerly known as McGladrey & Pullen, LLP), the Fund’s independent registered public accountant. This financial data should be read in conjunction with “Management’s Discussion and Analysis of Financial Condition and Results of Operations,” and with the Fund’s consolidated financial statements and notes thereto, included elsewhere in this Annual Report on Form 10-K.
For the Year Ended December 31, 2013 2012 2011 2010 2009
Income Statement Items Net gain (loss) from trading $ 21,102,913 $ (20,344,441) $ (46,536,177) $ 182,134,426 $ (1,321,770)Interest income and net gain (loss) from trading of investments in securities and certificates of deposit 4,653,995 15,554,487 (2,821,909) 3,119,900 4,484,279Net total expenses (53,810,139) (79,113,002) (84,954,757) (84,518,180) (66,508,237)
Net income (loss) $ (28,053,231) $ (83,902,956) $ (134,312,843) $ 100,736,146 $ (63,345,728)
Balance Sheet Items Total assets $ 924,445,965 $ 1,320,258,204 $ 1,527,648,938 $ 1,457,657,150 $ 1,109,264,003Total partners’ capital (net asset value) $ 880,409,705 $ 1,263,878,940 $ 1,482,656,104 $ 1,401,627,694 $ 1,057,734,905
Class A Units
Net asset value per unit $ 4,114.51 $ 4,228.83 $ 4,527.45 $ 4,985.84 $ 4,668.87 Increase (decrease) in net asset
value per unit $ (114.32) $ (298.62) $ (458.39)
$ 316.97 $ (350.09)Total return (2.70)% (6.60)% (9.19)% 6.79% (6.98)%
Class B Units
Net asset value per unit $ 5,789.73 $ 5,845.11 $ 6,147.29 $ 6,650.67 $ 6,118.04 Increase (decrease) in net asset
value per unit $ (55.38) $ (302.18) $ (503.38)
$ 532.63 $ (342.01)Total return (0.95)% (4.92)% (7.57)% 8.71% (5.29)%
Class I Units
Net asset value per unit $ 910.42 $ 912.75 $ -- $ -- $ -- Increase (decrease) in net asset
value per unit $ (2.33) $ (87.25) $ --
$ -- $ -- Total return (0.25)% (8.73)% --% --% --%
Results from past periods are not necessarily indicative of results that may be expected for any future period.

15
The following supplementary summarized quarterly data are presented for the three-months ended March 31, June 30, September 30 and December 31, 2013 and 2012. March 31, 2013 March 31, 2012
Class A Class B Class I Class A Class B Class I Net income (loss) $ 14,007,308 $ 11,700,349 $ 111,115 $ (13,722,214) $ (6,839,078) $ -- Increase (decrease) in net asset value per unit 78.87 135.67 23.15 (70.97) (69.25) -- Net asset value per unit 4,307.70 5,980.78 935.90 4,456.48 6,078.04 -- Ending net asset value 724,490,811 484,036,930 5,418,841 848,421,814 588,711,138 -- June 30, 2013 June 30, 2012
Class A Class B Class I Class A Class B Class I Net income (loss) $ (44,287,390) $ (26,954,728) $ (316,721) $ (2,094,100) $ 1,132,270 $ (13,281) Increase (decrease) in net asset value per unit (270.01) (349.73) (54.70) (14.14) 7.63 (52.20) Net asset value per unit 4,037.69 5,631.05 881.20 4,442.34 6,085.67 947.80 Ending net asset value 654,177,690 428,218,140 5,102,120 833,249,714 566,865,241 241,131 September 30, 2013 September 30, 2012
Class A Class B Class I Class A Class B Class I Net income (loss) $ (21,077,315) $ (11,919,741) $ (131,588) $ 3,185,581 $ 4,604,963 $ 2,096 Increase (decrease) in net asset value per unit (131.17) (158.54) (22.73) 16.34 49.69 8.24 Net asset value per unit 3,906.52 5,472.51 858.47 4,458.68 6,135.36 956.04 Ending net asset value 589,400,670 356,480,156 4,013,847 826,386,945 563,204,627 2,375,119 December 31, 2013 December 31, 2012
Class A Class B Class I Class A Class B Class I Net income (loss) $ 30,687,371 $ 19,885,183 $ 242,926 $ (43,102,668) $ (26,948,987) $ (107,538) Increase (decrease) in net asset value per unit 207.99 317.22 51.95 (229.85) (290.25) (43.29) Net asset value per unit 4,114.51 5,789.73 910.42 4,228.83 5,845.11 912.75 Ending net asset value 550,501,395 325,651,536 4,256,774 753,610,488 508,000,871 2,267,581
16
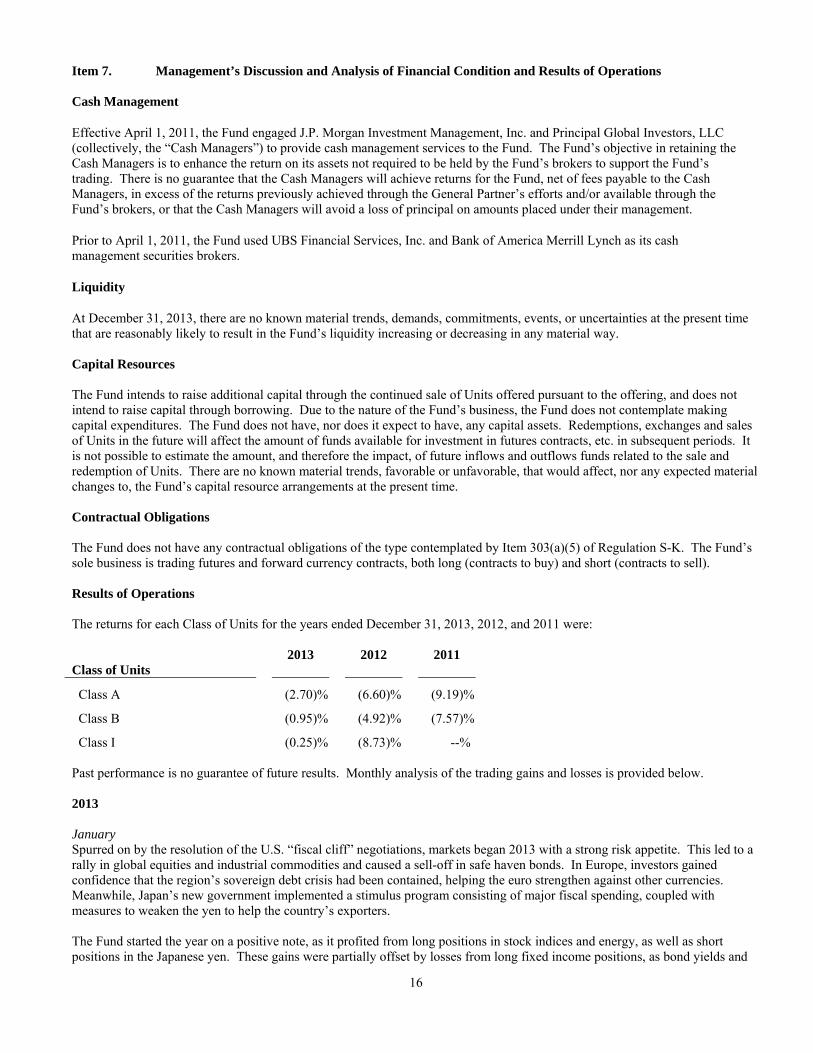
Item 7. Management’s Discussion and Analysis of Financial Condition and Results of Operations
Cash Management
Effective April 1, 2011, the Fund engaged J.P. Morgan Investment Management, Inc. and Principal Global Investors, LLC (collectively, the “Cash Managers”) to provide cash management services to the Fund. The Fund’s objective in retaining the Cash Managers is to enhance the return on its assets not required to be held by the Fund’s brokers to support the Fund’s trading. There is no guarantee that the Cash Managers will achieve returns for the Fund, net of fees payable to the Cash Managers, in excess of the returns previously achieved through the General Partner’s efforts and/or available through the Fund’s brokers, or that the Cash Managers will avoid a loss of principal on amounts placed under their management.
Prior to April 1, 2011, the Fund used UBS Financial Services, Inc. and Bank of America Merrill Lynch as its cash management securities brokers.
Liquidity
At December 31, 2013, there are no known material trends, demands, commitments, events, or uncertainties at the present time that are reasonably likely to result in the Fund’s liquidity increasing or decreasing in any material way. Capital Resources The Fund intends to raise additional capital through the continued sale of Units offered pursuant to the offering, and does not intend to raise capital through borrowing. Due to the nature of the Fund’s business, the Fund does not contemplate making capital expenditures. The Fund does not have, nor does it expect to have, any capital assets. Redemptions, exchanges and sales of Units in the future will affect the amount of funds available for investment in futures contracts, etc. in subsequent periods. It is not possible to estimate the amount, and therefore the impact, of future inflows and outflows funds related to the sale and redemption of Units. There are no known material trends, favorable or unfavorable, that would affect, nor any expected material changes to, the Fund’s capital resource arrangements at the present time. Contractual Obligations The Fund does not have any contractual obligations of the type contemplated by Item 303(a)(5) of Regulation S-K. The Fund’s sole business is trading futures and forward currency contracts, both long (contracts to buy) and short (contracts to sell). Results of Operations The returns for each Class of Units for the years ended December 31, 2013, 2012, and 2011 were: Class of Units
2013 2012 2011
Class A (2.70)% (6.60)% (9.19)%
Class B (0.95)% (4.92)% (7.57)%
Class I (0.25)% (8.73)% --% Past performance is no guarantee of future results. Monthly analysis of the trading gains and losses is provided below. 2013 January Spurred on by the resolution of the U.S. “fiscal cliff” negotiations, markets began 2013 with a strong risk appetite. This led to a rally in global equities and industrial commodities and caused a sell-off in safe haven bonds. In Europe, investors gained confidence that the region’s sovereign debt crisis had been contained, helping the euro strengthen against other currencies. Meanwhile, Japan’s new government implemented a stimulus program consisting of major fiscal spending, coupled with measures to weaken the yen to help the country’s exporters. The Fund started the year on a positive note, as it profited from long positions in stock indices and energy, as well as short positions in the Japanese yen. These gains were partially offset by losses from long fixed income positions, as bond yields and

17
interest rates climbed during the month. Overall, the Fund returned a profit for the month, with Class A Units up 2.20%, Class B Units up 2.35%, and Class I Units up 2.25%. February Although February began with a continuation of January’s risk-seeking market trends, the second half of the month saw “risk-off” price reversals across many sectors. Weak European data signaled a region-wide economic contraction. The UK suffered a credit rating downgrade as it is on the verge of a triple-dip recession. Meanwhile, Italian voters toppled the country’s incumbent government with an election result that repudiated austerity as a means of managing Europe’s sovereign debt crisis. In the U.S., minutes from the most recent Fed meeting hinted at a sooner than expected slowdown of monetary stimulus, frightening investors who anticipated longer term quantitative easing. The Fund entered February with “risk-on” exposures in many of the markets it trades, including long positions in equities, industrial commodities, the euro and high-yielding currencies. February’s market reversals caused losses in a number of these positions. The largest losses came from energy, as oil prices fell late in the month on concerns over global demand as well as U.S. supply hitting a 20-year high due to shale fracking. In currencies, the decline of the euro detracted from performance. The Fund did however make gains in fixed income with long positions in U.S. bonds. In the agricultural sector, easing drought conditions in the Midwest lowered wheat prices, helping the Fund’s short position. In stock indices, the Fund made a small net gain as profits in the U.S. and Asia were offset by losses in Europe. Overall, the Fund finished with a loss for the month, with Class A Units down 1.41%, Class B Units down 1.26%, and Class I Units down 1.18%. March Overall, the Fund returned a profit for the month, with Class A Units up 1.10%, Class B Units up 1.25%, and Class I Units up 1.48%. In March, financial headlines were dominated by the banking crisis in Cyprus. Eurozone members led by Germany made the release of bailout funds contingent on a Cypriot financial contribution through a one-time “tax” on bank deposits. This action sparked protests over the plan’s fairness. A last minute compromise deal exempted smaller insured deposits from capital seizure. Investors feared that the Cyprus bailout might create a precedent for haircutting depositors at troubled banks in Spain and Italy. This prompted a sell-off in the euro, a slide in southern European stock markets and a rally in safe haven German bunds. Meanwhile, in the U.S., equities climbed with largely positive economic data and a statement from Fed Chairman Bernanke that he saw no evidence of a stock bubble. In Japan, monetary easing by the Abe government continued, boosting bond and equity markets and depreciating the yen. The Fund profited in March from long positions in stocks, especially in the U.S. Gains were also made in the currency sector from short positions in the Japanese yen. The Fund was flat in fixed income as gains from being long the German bund were offset by losses due to trend reversals in the U.S. bond market. The contribution of physical commodity markets to the Fund’s performance during the month was minimal. April In April, economic data in China confirmed a slowdown in growth, while U.S. GDP estimates for the first quarter were weaker than expected. This led to a sell-off in industrial commodities such as energy and base metals, and a rally in Treasury bonds. The price of gold tumbled mid-month, triggered by reports that Cyprus might sell part of its gold reserves to pay down the country’s debt. Furthermore, the current absence of global inflation has reduced the attractiveness of precious metals that are often used as a hedge against inflation. Meanwhile, the Japanese central bank continued its policy of monetary stimulus, further weakening the yen and boosting the Nikkei stock index. During the month, the Fund profited from its long bond positions, particularly in the U.S., where the fixed income market rallied on disappointing economic growth. The Fund’s short positions in gold and copper also made a positive return contribution after the decline in precious and base metals prices. Partly offsetting these gains were losses from long exposures to declining oil markets, as well as from trend reversals in agricultural markets such as corn. Overall, the Fund finished the month with a profit, with Class A Units up 3.11%, Class B Units up 3.26%, and Class I Units up 3.10%. May In May, improving economic data in the U.S. drove stock indices higher, but also prompted the Fed to signal that it might soon taper its quantitative easing program. Fixed income markets reacted negatively to the prospect of a reduction in the Fed’s $85 billion in monthly purchases of Treasury bonds and mortgage backed securities. U.S. 10-year Treasury bond yields jumped 46 basis points from 1.67% to 2.13% during the month, while international bond markets also sold off. Meanwhile in Japan, the high flying Nikkei index, which at one point was up 50% on the year, fell abruptly by 13% over the last 9 days of the month. This was caused by investors taking profits after signs of slowing Chinese growth and impending U.S. monetary tightening.

18
May proved to be a challenging month for the Fund’s trend-following strategies. The majority of losses were a result of sharp declines in global bond markets, particularly in the U.S. and Europe, which hurt the Fund’s long positions. The Fund’s trading systems responded by cutting back bond positions substantially, standing ready to reposition as new trends emerge, whether bullish or bearish. In the currencies sector, long positions in the Australian dollar and New Zealand dollar detracted from performance, following a surprise interest rate cut in Australia and central bank intervention to weaken the currency in New Zealand. In energy markets, long positions in natural gas suffered as prices declined on higher than expected inventory levels. The Fund did, however, make a profit in equity indices through its long positions across the globe. The Fund was also positive in agricultural commodities, benefitting from a rally in soybeans. Overall, the Fund finished the month with a loss, with Class A Units down 4.97%, Class B Units down 4.83%, and Class I Units down 4.75%. June In June, the Fed reaffirmed its desire to phase out its quantitative easing program as long as U.S. economic data continues to improve. Markets interpreted this as the beginning of the end of an era of ultra-easy monetary policy. As a result, global equities and bonds sold off sharply. Ironically, the largest stock market declines were not in the U.S. Prospective tightening by the U.S. Federal Reserve had a greater impact in Europe, where the economic recovery lags the U.S., and in Asia and emerging markets, where a slowdown in China also worried investors. Meanwhile, the Fed’s new stance caused gold prices to plummet to levels last seen in 2010, as the risk of inflation due to loose monetary conditions diminished. The market moves in June were a continuation of the sharp and sudden trend reversals that began at the end of May. These price patterns are particularly difficult for trend-following systems to navigate. The Fund came into June with long exposure to global equities. Although these positions were reduced significantly over the month, the Fund nevertheless saw losses in this sector, particularly in European indices. In currencies, choppy price movements in the euro and British pound sterling against the U.S. dollar were also a detriment to performance. Residual long positions in bonds and interest rates, primarily in Europe, caused losses before positions were closed out. By the end of the month, most of the Fund’s trading advisors had systematically moved to net short positions in fixed income instruments. On the positive side, the Fund was able to profit from the downward trend in precious metals, such as gold and silver, as well as in industrial metals, such as copper. Overall, the Fund finished the month with a loss, with Class A Units down 4.34%, Class B Units down 4.20%, and Class I Units down 4.12%. July In July, global equity indices rebounded from their losses in the prior month. This was a result of central banks seeking to reassure skittish investors that they would wait to pull back on monetary easing until an economic recovery became more firmly established. In the U.S., investors came to believe that the imminent tapering of the Fed’s quantitative easing program may be more gradual than previously thought, as Bernanke softened his tone on potential tightening amid still modest economic growth and low inflation. Meanwhile, the European Central Bank announced that interest rates would stay at current levels or lower for an extended period. Gold and bond markets saw a bounce as a result. In energy markets, surprisingly high summer demand in the U.S. coupled with lower inventories caused WTI crude oil prices to jump to a 16-month high of $108/barrel. The Fund profited from long equity positions, particularly in the U.S. However, the size of these gains was tempered by the fact that our trend-following managers had trimmed their exposures after stock market declines in the previous month. Elsewhere, the Fund benefited from its long positions in crude oil. Offsetting these profits were losses from short positions in metals, as gold prices reversed from their downward trend. The Fund also saw small negative contributions from reversals in currencies and bond markets. Overall, the Fund finished the month with a loss, with Class A Units down 0.56%, Class B Units down 0.41%, and Class I Units down 0.33%. August August saw continued positive economic data in the U.S. and early signs of a recovery in the Eurozone, where a positive second quarter GDP report marked the end of an 18-month recession in the region. This raised the risk of near-term monetary policy tightening, which caused bond yields to rise across developed markets and weighed on equity indices. In the latter half of the month, political tensions escalated in the Middle East. The U.S. and France threatened to intervene in Syria’s civil war, causing a sell-off in stocks and a rally in oil and gold. In August, the Fund’s short positions in metals suffered losses, as stronger than expected Chinese industrial production caused a rebound in base metal prices, while the Syrian crisis boosted demand for precious metals. The currency sector also detracted from performance as a result of choppy movements in European exchange rates. Meanwhile, the Fund saw a negative contribution from long positions in equity indices as global stock markets fell, with the S&P 500 seeing its biggest monthly decline since May 2012. On the positive side, the Fund’s long energy positions were able to profit from the rise in oil prices. Overall, the Fund finished the month with a loss, with Class A Units down 2.71%, Class B Units down 2.57%, and Class I Units down 2.49%.

19
September In September, the Federal Reserve surprised markets by delaying a much anticipated “tapering” of its quantitative easing program until there are more signs of a robust U.S. economic recovery. The Fed’s decision boosted stock indices, lowered bond yields and weakened the U.S. dollar. Meanwhile, oil prices fell as the U.S. backed away from military intervention in Syria, following the Assad regime’s acceptance of a chemical disarmament proposal. Towards the end of the month, a breakdown in U.S. budget and debt ceiling negotiations caused a sell-off in equities ahead of a government shutdown. The Fund profited in September from long exposure to rising equity indices, although the political impasse over the U.S. budget led to a giveback of some of the stock gains from early in the month. In fixed income markets, the Fund benefited from long positions in Japanese bonds, which rallied on continued monetary stimulus by the Bank of Japan. The Fund’s main losses came from long positions in the energy sector, as oil prices fell from their highs with an easing of the Syrian crisis. The Fund also saw small losses in metals and agricultural commodities. In currencies, gains from long positions in the Euro and British pound were offset by losses from short positions in the Australian dollar. Overall the Fund finished the month with flat performance, with Class A Units at 0.00%, Class B Units up 0.15%, and Class I Units up 0.23%. October In October, a budget stalemate in Washington caused a government shutdown and threatened to trigger a sovereign default as the U.S. hovered at its debt ceiling. An agreement reached mid-month reopened government offices and extended the nation’s borrowing capacity until February 2014. As a result, global equities rallied, with the S&P 500 rising to all-time highs. Amid a dysfunctional fiscal policy environment with weak employment growth, the Federal Reserve decided to maintain its current level of bond purchases through its quantitative easing program and pushed out the likely start of monetary tightening further into the future. Meanwhile, in energy markets, crude oil prices fell from their highs reached during the Syrian crisis while natural gas was down on warmer temperature forecasts for the fall season. The Fund enjoyed strong gains in its long equity positions on the back of rallies in the U.S. and European stock markets. In the fixed income sector, interest rates and bond yields fell, benefiting the Fund’s long positions, particularly in Eurodollars and Japanese bonds. These gains outweighed losses sustained on trend reversals in gold, natural gas and crude oil, allowing the Fund to end the month with net positive performance. Overall, the Fund finished the month with a gain, with Class A Units up 2.54%, Class B Units up 2.69%, and Class I Units up 2.77%. November Global equity markets continued their broad-based rally in November, as positive economic news in the U.S. outweighed potentially bearish Fed comments that suggested it could begin to taper its quantitative easing program in future months. Meanwhile, the European Central Bank added to its monetary stimulus with a surprise cut in interest rates. Elsewhere, the Bank of Japan signaled it would continue its expansionary monetary policy, which resulted in the Japanese yen falling to new lows. In commodity markets, precious metals declined in anticipation of Fed tightening, while some energy markets rallied due to higher demand from unseasonably cold weather. The Fund profited from the global stock rally, with the largest gains coming from long positions in the S&P 500 and DAX indices. In currencies, the Fund garnered strong returns through a short position in the depreciating Japanese yen. In the metals sector, declines in gold and silver proved profitable for the Fund’s short exposure. However, a short position in natural gas saw losses as prices jumped on unusually chilly temperatures in the U.S. The Fund closed the month with a net positive return, with Class A Units up 1.96%, Class B Units up 2.12%, and Class I Units up 2.20%. December In December, equities initially fell as strong U.S. economic performance heightened concerns that the Federal Reserve might unwind its quantitative easing program more sharply than previously expected. However, the Fed allayed the worst of investors’ fears by announcing a moderate $10B reduction in monthly bond purchases, while also signaling that it would keep short-term interest rates low through 2015. This prompted a relief rally in global stock indices into the year-end. Elsewhere, the European Union received a credit rating downgrade, but saw stronger than expected economic growth data. In Asia, the Japanese yen fell to multi-year lows on the belief that the Bank of Japan would continue its monetary easing program. Overall, the Fund enjoyed a moderate gain for the month, with Class A Units up 0.74%, Class B Units up 0.89%, and Class I Units up 0.97%. 2012 January In January, markets responded positively to supportive monetary policy from central banks around the world. In the U.S., the Fed announced that it expected to keep interest rates low through 2014. Meanwhile, in Europe, the European Central Bank was expected to extend its Long-Term Refinancing Operations program by providing additional loans to the region’s banks later this

20
year, beyond the nearly half trillion euros (approximately $650 billion) already distributed to banks in December. This improved the European credit environment, helping France, Italy and Spain to hold successful bond auctions at reduced yields and allowing them to shrug off Standard & Poor’s sovereign credit downgrades earlier in the month. Positive sentiment fueled by easy monetary policy led to a rally in global equities, industrial commodities, as well as short and medium term interest rate instruments. Among currencies, it also led to a decline in the U.S. dollar, a rebound in the euro, and a surge in commodity currencies. The Fund profited from long positions in interest rate instruments, particularly Eurodollar and Euribor contracts, as well as from long exposure to U.S. equities and the Australian dollar. In addition, a continued decline in natural gas prices benefited the Fund’s short positions. Short positions in metals, including aluminum and silver, resulted in losses, and a short currency exposure to the euro also caused a loss for the fund. Overall, the Fund returned a net profit for the month, with Class A Units up 0.11% and Class B Units up 0.26%. February In February, markets were driven by continued monetary stimulus from central banks around the world. The European Central Bank extended an additional €529 billion (approximately $700 billion) in low interest 3-year loans to 800 of the region’s banks in the second round of its Long Term Refinancing Operation to shore up the balance sheets of the financial sector in Europe. Since December, the ECB has made over €1 trillion (approximately $1.3 trillion) in loans to Europe’s banking sector. Elsewhere, the Bank of Japan and the Bank of England implemented new rounds of quantitative easing in their respective markets. These actions encouraged a greater risk appetite among investors, driving up global equity indices. Meanwhile, the U.S. saw an improvement in labor market data, prompting a rise in U.S. bond yields. In the Middle East, the threat of oil supply disruptions from rising tensions over Iran’s nuclear program led to a rally in energy prices, with Brent crude prices exceeding $125 per barrel. The Fund’s largest gains came from the energy sector, where it benefited from long positions in both in crude oil and oil-related products. The Fund also profited from its long exposure to equity indices, particularly in the U.S. However, long positions in the fixed income sector caused losses as bonds in the U.S. sold off. There was also a modest decline in currencies, as depreciation of the Japanese yen hurt the Fund’s long positions. Overall, the Fund enjoyed a moderate gain for the month, with Class A Units up 0.54% and Class B Units up 0.69%. March In March, markets continued to price in a stronger economic growth outlook for the U.S. Following improved labor and consumption data, the Fed raised its forecast from “modest” to “moderate” growth. Investors interpreted this positive language as a signal that further Fed stimulus in the form of bond purchases was not necessary. As a result U.S. long-term bonds sold off sharply. Meanwhile U.S. equities continued to rally, with the S&P 500 enjoying its best quarter since Q3 of 2009. Elsewhere, the attempt by Chinese authorities to limit domestic inflation through a gradual deceleration of economic growth had a negative impact on commodity currencies such as the Australian dollar. In energy markets, crude oil halted its six month rise due to softer prospective Chinese demand as well as an expected release of strategic oil reserves by the U.S., UK and France. The Fund made gains in its long equity index positions, particularly in the U.S. The energy sector was also profitable, primarily due to short positions in natural gas where a supply glut and unusually warm weather led to continued price declines. However, the Fund suffered losses in fixed income, as bond prices declined mid-month in the U.S., Europe and Japan, hurting long positions. In currencies, long exposure to the weakening Australian dollar also detracted from performance. Overall, the Fund finished with a loss for the month, with Class A Units down 2.20% and Class B Units down 2.06%. April April saw a reversal of the positive equity market sentiment that characterized much of the first quarter of 2012, with renewed worries over global growth and the European debt crisis. Both the U.S. and China reported slowing GDP growth for Q1. Meanwhile in Europe, the UK and Spain posted a second consecutive quarter of negative growth and thus joined Italy, Ireland, Portugal and Greece in falling into a double dip recession. The possibility of a Spanish default became the latest focus for sovereign bond investors, as the effectiveness of its fiscal austerity program came into doubt, with the unemployment rate rising to 24%. The Fund saw profits in April from its long positions in fixed income, as bond yields in major markets declined, with a global swing towards risk aversion. The Fund also made gains in the agricultural sector, as soybeans continued their strong year-to-date rally due to a lack of rain in South America threatening the harvest. These profits were partly offset by losses from long positions in global equities and in oil-related commodities. Overall the Fund finished with a positive return for the month, with Class A Units up 2.19% and Class B Units up 2.34%.

21
May In May, the escalating European debt crisis and weak U.S. and Chinese economic data led to a flight to safety in financial markets. In Greece, electoral gains by anti-austerity political parties stoked fears that the country might ultimately exit the Eurozone. Elsewhere, concerns grew over the health of Spain’s banks, as the already debt-laden Spanish government was forced to bail out the country’s third largest lender. Meanwhile, labor market conditions deteriorated in the U.S. and industrial production slowed in China. In response, investors sold global equities, energies and commodity currencies and sought the relative safe harbor of bonds and the U.S. dollar. The Fund made its largest gains from long positions in U.S., German and UK bonds, as yields trended lower and prices moved higher. In currencies, the Fund profited from a short position in the euro which depreciated over 6% against the U.S. dollar during the month. The Fund had some offsetting losses in long equity index and oil positions, before trimming those exposures by month-end. Overall, the Fund finished May with a positive return, with Class A Units up 3.06% and Class B units up 3.22%. June The risk appetite of global investors returned in 5.0% June, as markets anticipated increased central bank intervention to spur weakening economic growth. In Europe, the risk of a splintering of the euro currency union subsided, as Greek parliamentary elections were won by political parties favoring a European bailout with austerity conditions attached, in effect keeping the country in the Eurozone. This was followed by a European summit meeting at month end where EU leaders agreed to ease conditions on loans to Spain and Italy, thereby stemming the surge in borrowing costs in those countries. In response, investors rotated from bonds into equities and sold off the U.S. dollar in favor of the euro and emerging market currencies. June’s market reversals caused the Fund to give back profits made from trends over the prior two months. In the interest rates sector, the Fund’s long positions caused losses, particularly in the German Bund which saw its largest monthly decline since 1994. In currencies, the Fund’s short euro exposure detracted from performance, as the currency rallied on the positive news out of Europe. Meanwhile, trading in the physical commodities was unprofitable, as sharp reversals in energy and corn prices went against the Fund’s short positions. The Fund generated a positive return in equity indices through long positions in U.S. stock markets. Overall, the Fund finished the month with a loss, with Class A, B and I Units down 5.35%, 5.22% and 5.22%, respectively. July The Fund delivered strong returns in July, as more signs emerged of a faltering global economic recovery. U.S. labor market data continued to disappoint and Chinese growth weakened. Europe, however, remained the primary focus of investors. Spain’s credit conditions deteriorated, as the 10-year sovereign bond yield spiked as high as 7.75% during the month, its highest level since the inception of the euro. The European Central Bank (ECB) cut interest rates, but this did little to reverse the depreciation of the euro. The tide of negative sentiment was stanched only later in the month, when the ECB President vowed to use all necessary means to save the currency union. The largest contribution to the Fund came from the fixed income sector, where long positions profited from the ECB rate cut as well as market speculation of additional future central bank easing in Europe and the U.S. The Fund also made solid gains in currencies through its short euro exposure. Lastly, in the agricultural sector, the Fund profited from a surge in grain prices, as hot, dry weather in the U.S. damaged crop yields. Class A, B and I Units finished the month up 4.86%, 5.02% and 4.78%, respectively. August In August, investor sentiment towards the future of the Eurozone turned from pessimistic to mildly optimistic. U.S. economic reports, including non-farm payroll data, also came in better than expected. These factors extended the rally in global equities, caused a rebound in the euro and prompted an initial sell-off in safe haven U.S. and German government bonds. As the month progressed, speculation mounted that global central banks would engage in further quantitative easing, which caused bonds to recover from their earlier declines. Rising tensions between Iran and Israel caused crude oil prices to climb, while the U.S. experienced its most widespread drought since 1956, leading to higher grain prices. During the month, the Fund gave back some of the profits it made in July. The Fund’s short positions in the euro and long positions in the Australian dollar suffered on market reversals. Long bond exposures were also a negative contributor in the first half of the month. The Fund did see gains in long equity and long oil positions. However, the Fund finished the month with a net loss, with Class A, B and I Units down 1.68%, 1.53% and 1.39%, respectively.

22
September September saw an increase in the scale of global central bank intervention in an attempt to prevent further deterioration of economic growth. The European Central Bank announced a plan to buy unlimited amounts of government bonds of distressed countries such as Spain, in exchange for their accepting austerity reforms. Meanwhile in the U.S., the Fed announced “QE3”, a third round of quantitative easing, involving the purchase of $40 billion of agency-backed mortgages each month for an indefinite period of time. In response, equities rallied worldwide, as did the euro, gold and industrial metals. There was a corresponding sell-off in perceived safe haven assets such as U.S. bonds and the U.S. dollar. The Fund entered the month with balanced exposure between long equity and long bond positions. The Fund’s gains from the ensuing stock rally offset losses from the decline in bond prices for a flat net impact across these two sectors. However, the Fund did experience losses in other sectors that were unrelated to macroeconomic policy moves. In the agricultural markets, grain prices corrected after their recent run-up, hurting the Fund’s long positions, after reports that the U.S. drought had not damaged crop yields as much as expected. In energy, natural gas prices climbed with the start of cooler temperatures, causing losses for the Fund’s short positions. Overall, the Fund finished the month with a loss, with Class A, B and I units down 2.65%, 2.51% and 2.37%, respectively. October October was characterized by trend reversals across a broad range of sectors. Weaker than expected corporate earnings prompted a selloff in U.S. equity markets, as well as in global risk assets such as oil, industrial metals, and commodity-related currencies. In spite of this, safe haven assets such as bonds and gold did not rally and in fact declined, as investors pared back previous expectations over the scope and duration of quantitative easing by central banks. Given the breadth of market reversals, October proved to be a difficult month for trend-following programs across the entire managed futures industry. The Fund was no exception and experienced losses that were spread across all sectors in the portfolio. The largest declines came from the Fund’s long bond positions both in the U.S. and Europe. Other major markets that detracted from performance included U.S. equities, gasoline and gold. On the positive side, the Fund reversed its net long position in crude oil in time to profit from the decline in that market. The Fund also made gains on long exposure to non-U.S. stock markets. Overall, the Fund finished the month with a loss, with Class A, B and I units down 5.42%, 5.28% and 5.15%, respectively. November As the U.S. election maintained the status quo in Washington, investor attention turned to the ability of a divided government to deal with the looming “fiscal cliff”. The year-end expiration of key tax cuts and automatic reduction in government expenditures, if unaddressed, could potentially cause a recession in 2013, according to the Congressional Budget Office. Global equities sold off over the first half of November as a result. However, sentiment recovered and stocks rebounded in the latter part of the month, as reports indicated some willingness on the part of Democrats and Republicans to compromise in budget talks. In November, the Fund made gains in long positions in the fixed income sector as global bonds rallied on continued easy central bank monetary policy. The currency sector made a small profit from short positions in the Japanese yen, which depreciated on speculation of more aggressive money printing with a potential Liberal Democratic Party victory in the country’s upcoming election. However, the Fund saw losses due to price reversals in physical commodities. Base metals and crude oil prices rebounded from their downward trend on stronger Chinese industrial production data, while grain prices declined from their recent highs on higher than expected supply. Equity markets also proved difficult to trade during the month, as an early sell-off reversed sharply mid-month with a return of investor risk appetite. Overall, the Fund finished the month with a loss, with Class A, B and I units down 0.78%, 0.63% and 0.55%, respectively. December In December, U.S. “fiscal cliff” negotiations dominated news headlines. Investors rotated from bonds into stocks on speculation the two U.S. political parties would ultimately reach a compromise budget deal by the end of the year. Meanwhile, in Japan, the Liberal Democratic Party (LDP) returned to power, pledging to lift the country out of a deflationary spiral with an aggressive fiscal stimulus plan and by pressuring the Bank of Japan to further weaken the yen. The Japanese election was the primary driver of the Fund’s performance for the month. The Fund profited from both a short position in the depreciating Japanese yen and a long position in the surging Nikkei stock index. Elsewhere, the Fund benefited from its long exposure to other global stock indices which rallied on optimism over U.S. budget talks, although these gains were partly offset by losses from the related decline in bond prices. The Fund saw small losses in physical commodities, as choppy conditions prevailed in a number of markets. Overall, the Fund finished the month with a positive return with Class A, B and I units up 1.07%, 1.22% and 1.21%, respectively.

23
2011 January A Units of the Fund were down 1.42% for the month of January and B Units were down 1.27%. The Fund finished lower this month as losses from foreign currencies, interest rate instruments and metals offset profits from energy products, equity indices and agricultural commodities. The most significant losses came from the Fund’s positions in international currencies as several exchange prices reversed direction in response to positive economic news in both the U.S. and Europe. Cross-currency trades in several markets, including the British pound/Japanese yen, euro/Australian dollar, and British pound/Australian dollar all reversed and moved against the Fund’s positions during the month. In equity indices, the Fund saw profits from its long positions in both European and U.S. indices. In interest rates, mixed performance among contracts led to a loss in that sector. Gold prices retreated this month generating losses for the Fund’s long positions, while rising prices in cotton, corn and sugar contributed additional profits in agricultural commodities. February A Units of the Fund were up 2.16% for the month of February and B Units were up 2.31%. The Fund finished higher this month as profits from energy products, equity indices, metals, agricultural commodities and currencies offset losses in interest rate instruments. The most significant profits came from the Fund’s positions in energy products as tensions in the Middle East, and especially in Libya, pushed oil prices higher benefiting the Funds’ long positions in that sector. Global equity prices were volatile this month, but finished higher by the end of the month which added profits from the Fund’s long positions. Both industrial and precious metals prices trended higher, as did agricultural commodity prices. The rising prices from all three of these sectors generated profits for the Fund’s long positions. Prices were mixed in interest rate instruments, with losses offsetting profits in that sector. March A Units of the Fund were down 2.75% for the month of March and B Units were down 2.61%. The Fund finished lower this month with losses in equity indices, agricultural commodities, interest rate instruments and metals. The most significant profits came from the energy markets as events in Japan and Libya sent energy prices sharply higher benefiting the Fund’s long positions. The same global events also generated reversals in global stock indices that went against the Fund’s long positions. Although equity prices rebounded later in the month it wasn’t enough to offset the earlier losses. Agricultural commodity prices led by corn, sugar and cocoa, experienced significant volatility this month. Prices generally moved against the Fund’s long positions generating losses. Prices in interest rate instruments and foreign currencies were mixed this month with losses offsetting profits in that sector. April A Units of the Fund were up 3.58% for the month of April and B Units were up 3.73%. The Fund finished higher this month with profits from currencies, metals, stock indices and energy products offsetting losses from interest rate instruments and agricultural commodities. The most significant profits came from the foreign exchange markets, where the Fund’s long positions benefited from significant price appreciation in the Australian dollar relative to several other currencies including the U.S. dollar. Precious metals, including silver and gold, continued to trend higher generating profits for the Fund, although a reversal in industrial metals offset some of those profits. Oil product prices also pushed higher which benefited the Fund’s long positions, but losses from natural gas dampened gains for the energy sector. May A Units of the Fund were down 5.65% for the month of May and B Units were down 5.52%. The Fund finished lower this month with losses from energy products, foreign exchange, metals, equity indices and agricultural commodities offsetting profits from interest rate instruments. An abrupt sell-off in physical commodities early in the month sent energy products and precious metals prices sharply lower. The most significant losses in these sectors came from long positions in light crude, Brent crude, silver and aluminum. Reports that Greece was considering leaving the euro zone sparked a flight to safety that drove global indices lower and interest rate instruments and the U.S. dollar sharply higher. While the market moves were profitable for the Fund’s long positions in interest rate instruments, they went against the Fund’s long positions in global indices and several foreign currencies which generated losses. In agricultural commodities, losses were mostly in coffee, corn and sugar. June A Units of the Fund were down 3.80% for the month of June and B Units were down 3.65%. The Fund finished lower this month with losses in equity indices, energy products, agricultural commodities, metals and currencies offsetting profits from interest rate instruments. The markets were relatively quiet during the month, although concerns over Greece’s debt and the end of the Federal Reserve’s quantitative easing program weighed heavily in the news. A modest flight to quality sent equity prices lower and interest rate instruments higher for the second month in a row. While the rise in interest rate instrument prices

24
benefited the Fund, the fall in equity prices went against the Fund’s long positions. Over the past several weeks, the Fund’s trading advisors reduced their long equity positions, reducing the impact. In commodities, improved supply coupled with weaker confidence in the global economy sent prices lower. The decline in commodity prices was led by a drop in energies prices and agricultural commodities, both of which went against the Fund’s long positions. July A Units of the Fund were up 4.31% for the month and B Units were up 4.47%. The Fund finished higher this month with profits in interest rate instruments, metals, currencies and energy products offsetting losses from equity indices. The Fund’s most significant gains came from its long positions in interest rate instruments. Concerns over a weak U.S. economy, and persistent debt issues in Europe, helped push global bond prices higher, benefiting the Fund’s long positions. In metals, rising prices generated profits for the Fund’s long gold positions, while a weaker dollar benefited the Fund’s long positions in major foreign currencies, especially the Swiss franc, Japanese yen and Australian dollar. Equity indices continued to move sideways without a strong trend, generating some losses. In the energy sector, the Fund’s short positions in natural gas profited from the sustained downward trend in natural gas prices. August A Units of the Fund were down 1.56% for the month of August and B Units were down 1.42%. The Fund finished lower this month with losses in currencies, equity indices and energy products offsetting profits in interest rate instruments. Metals and agricultural commodities were essentially unchanged for the month. The Fund’s most significant gains came from its positions in interest rate instruments. Persistent concerns over weak European and U.S. economies coupled with lingering debt concerns in Europe, pushed global bond prices higher, generating profits for the Fund’s long positions. In currencies the largest losses came from a sharp sell-off in the Australian dollar in the first week of the month that went against the Fund’s long positions. Following a sharp sell-off in equity markets during the first week of August, the Fund’s trading advisors exited their remaining long positions and went short. For the remainder of the month however, many equity markets bounced from their lows, moving against the Fund’s new positions that generated losses in that sector. In metals, the Fund generated significant profits from long positions in gold although those profits were offset by losses in industrial metals, especially copper. September A Units of the Fund were down 0.03% for the month of September and B Units were up 0.12%. The Fund finished the month virtually un-changed, as profits from interest rate instruments, equities and metals were offset by losses from agricultural commodities, energy products and currencies. The Fund’s most significant gains came from its long positions in interest rate instruments. Both the equity and interest rate sectors were impacted by concerns about the global economy and sovereign debt issues that are playing out in Europe and the U.S. By the end of the month, stocks and interest rates were lower, which generated profits for the Fund’s long positions in interest rate instruments and its short positions in equity indices. In metals, profits from short positions in industrial metals offset losses from long positions in precious metals. In agricultural commodities, as well as the energy sector, the Fund’s long positions generated losses as the prices for many of the physical commodities declined during the month. October A Units of the Fund were down 5.71% for the month and B Units were down 5.57%. October proved to be difficult month for the Fund in the face of a near sea change in market sentiment from a risk-averse to a risk-seeking mode. During the month, investors responded optimistically to the latest European plan to solve the Greek sovereign debt crisis. Furthermore, the Bank of England launched a new round of quantitative easing. Meanwhile, minutes from the latest Fed meeting revealed that members were open to QE3 as a backstop if economic growth should continue to falter. These developments led to sharp reversals across a broad range of markets during October, causing losses for the Fund’s largely bearish portfolio. The largest declines came in currency markets where a sudden surge in Eurozone optimism hurt the Fund’s long US dollar-short European currency positions. In addition, the Bank of Japan intervened to weaken the yen on the last trading day of the month, hurting the Fund’s long positions. The Fund was, however, able to profit from a rally in the Australian dollar. In physical commodities, a rally in crude oil as well as in base metals caused losses for the Fund’s short positions. However, the Fund benefited from a rally in gold. Finally, the Fund’s long fixed income-short equity exposures were negatively impacted by a rotation from bonds into stocks, as the S&P 500 Index recorded its largest monthly percentage gain since 1991. November A Units of the Fund were up 0.46% for the month and B Units were up 0.61%. November saw a rapid waning of investor enthusiasm for the European sovereign debt rescue package announced in the prior month. Attention turned to the possibility of an Italian default and doubts arose as to the ability of the European Financial Stability Facility to prevent a more widespread contagion. Markets thus reversed from “risk-on” in October to “risk-off” in early November, with global equities falling, bonds rallying and high-yield currencies depreciating as investors grew less tolerant of risk. However, at month-end the Federal Reserve, in conjunction with European and Asian central banks, intervened to provide a large liquidity injection into the

25
financial system causing a sharp market rebound and yet another trend reversal in financial futures. Physical commodity futures proved to be somewhat uncorrelated to other sectors in November, providing profitable trends for the Fund. The Fund finished the month with positive net performance. Gains were made in commodities, particularly in short natural gas and short soybean positions. However, these were partially offset by losses in equities and currencies where managers were whipsawed by macro-driven market reversals. The fixed income sector generated only modest gains as profits early in the month from the Fund’s long bond exposures were eroded by a rise in yields in the last week, particularly in Japanese government bonds. December A Units of the Fund were up 1.42% for the month and B Units were up 1.57%. The European sovereign debt crisis continued to dominate headlines in December. A flight to safety by investors early in the month prompted the European Central Bank to cut its key policy interest rates by another 25 bps, following a similar move in November. In addition, the ECB provided European banks a record €489 billion in 3-year loans to keep credit flowing in the region. The impact of this monetary easing was a further depreciation of the Euro, while also sparking a rally in European bond markets, and a small month-end rebound in global equities. The Fund posted a positive return in December, profiting from its short currency positions in the Euro and long positions in European fixed income instruments. Equity sector returns were relatively flat for the month. In commodities, the Fund benefited from short positions in natural gas, as mild weather and excess supply depressed prices further. However, downturns in oil and gold, where the Fund was positioned long, led to offsetting losses. Off-Balance Sheet Risk The term “off-balance sheet risk” refers to an unrecorded potential liability that, even though it does not appear on the balance sheet, may result in future obligation or loss. The Fund trades in futures and forward currency contracts, and is therefore a party to financial instruments with elements of off-balance sheet market and credit risk. In entering into these contracts there exists a risk to the Fund that such contracts may be significantly influenced by market conditions, such as interest rate volatility, resulting in such contracts being less valuable. If the markets should move against all of the futures interests positions of the Fund at the same time, and if the commodity trading advisors were unable to offset futures interest positions of the Fund, the Fund could lose all of its assets and the limited partners would realize a 100% loss. The General Partner minimizes market risk through diversification of the portfolio allocations to multiple trading advisors, and maintenance of a margin-to-equity ratio that rarely exceeds 30%. In addition to subjecting the Fund to market risk, upon entering into futures and forward currency contracts there is a risk that the counterparty will not be able to meet its obligations to the Fund. The counterparty for futures contracts traded in the U.S. and on most foreign exchanges is the clearinghouse associated with such exchange. In general, clearinghouses are backed by the corporate members of the clearinghouse who are required to share any financial burden resulting from the non-performance by one of their members and, as such, should significantly reduce this risk. In cases where the clearinghouse is not backed by the clearing members, as is the case with some foreign exchanges, it is normally backed by a consortium of banks or other financial institutions. In the case of forward currency contracts, which are traded on the interbank market rather than on exchanges, the counterparty is generally a single bank or other financial institution, rather than a group of financial institutions, thus there may be a greater counterparty risk. The General Partner utilized only those counterparties that it believes to be creditworthy for the Fund. All positions of the Fund are valued each day on a mark-to-market basis. There can be no assurance, however, that any clearing member, clearinghouse or other counterparty will be able to meet its obligations to the Fund. The Fund may invest in U.S. Treasury securities, U.S. and foreign government sponsored enterprise notes, certificates of deposit, commercial paper and corporate notes. Should an issuing entity default on its obligation to the Fund and such entity is not backed by the full faith and credit of the U.S. government, the Fund bears the risk of loss of the amount expected to be received. The Fund minimizes this risk by only investing in securities and certificates of deposit of firms with high quality debt ratings. Significant Accounting Estimates A summary of the Fund’s significant accounting policies are included in Note 1 to the consolidated financial statements. The Fund’s most significant accounting policy is the valuation of its assets invested in U.S. and foreign futures and forward currency contracts, and fixed income instruments. The Fund’s futures contracts are exchange-traded, with the fair value of these contracts based on exchange settlement prices. The fair values of non-exchange-traded contracts, such as forward currency contracts, are based on third-party quoted dealer values on the interbank market. The fair value of money market funds is based on quoted market prices for identical shares. U.S. Treasury securities are stated at fair value based on quoted market prices for

26
identical assets in an active market. Notes of U.S. and foreign government sponsored enterprises, as well as certificates of deposit, commercial paper and corporate notes, are stated at fair value based on quoted market prices for similar assets in an active market. Given the valuation sources, there is little judgment or uncertainty involved in the valuation of these assets, and it is unlikely that materially different amounts would be reported under different valuation methodologies or assumptions. Item 7A. Quantitative and Qualitative Disclosures about Market Risk
Introduction
The Fund is a speculative commodity pool. The market-sensitive instruments held by it are acquired for speculative trading purposes, and all or a substantial amount of the Fund's assets are subject to the risk of trading loss. Unlike an operating company, the risk of market sensitive instruments is integral, not incidental, to the Fund's main line of business.
Market movements result in frequent changes in the fair value of the Fund's open positions and, consequently, in its earnings and cash flow. The Fund's market risk is influenced by a wide variety of factors, including the level and volatility of exchange rates, interest rates, equity price levels, the market value of financial instruments and contracts, the diversification effects among the Fund's open positions and the liquidity of the markets in which it trades.
The Fund rapidly acquires and liquidates both long and short positions in a wide range of different markets. Consequently, it is not possible to predict how a particular future market scenario will affect performance, and the Fund's past performance cannot be relied on as indicative of its future results.
Standard of Materiality Materiality as used in this section, "Quantitative and Qualitative Disclosures about Market Risk," is based on an assessment of reasonably possible market movements and the potential losses caused by such movements, taking into account the leverage, and multiplier features of the Fund's market sensitive instruments. Quantifying the Fund’s Trading Value at Risk
The following quantitative disclosures regarding the Fund's market risk exposures contain forward-looking statements within the meaning of the Private Securities Litigation Reform Act of 1995 and other federal securities laws. All quantitative disclosures in this section are deemed to be forward-looking statements for purposes of the safe harbor, except for statements of historical fact. Value at Risk is a measure of the maximum amount which the Fund could reasonably be expected to lose in a given market sector. However, the inherent uncertainty of the Fund's speculative trading and the recurrence in the markets traded by the Fund to market movements far exceeding expectations could result in actual trading or non-trading losses far beyond the indicated Value at Risk or the Fund's experience to date (i.e., "risk of ruin"). Risk of ruin is defined to be no more than a 5% chance of losing 20% or more on a monthly basis. In light of the foregoing as well as the risks and uncertainties intrinsic to all future projections, the inclusion of the quantification included in this section should not be considered to constitute any assurance or representation that the Fund's losses in any market sector will be limited to Value at Risk or by the Fund's attempts to manage its market risk. The Fund's risk exposure in the various market sectors traded by the Fund’s Trading Advisors is quantified below in terms of Value at Risk. Due to mark-to-market accounting, any loss in the fair value of the Fund's open positions is directly reflected in the Fund's earnings.
Exchange margin requirements have been used by the Fund as the measure of its Value at Risk. Margin requirements are set by exchanges to equal or exceed the maximum losses reasonably expected to be incurred in the fair value of any given contract in 95% - 99% of any one-day interval. The margin levels are established by dealers and exchanges using historical price studies as well as an assessment of current market volatility and economic fundamentals to provide a probabilistic estimate of the maximum expected near-term one-day price fluctuation.
In the case of market sensitive instruments that are not exchange-traded (includes currencies, certain energy products and metals), the margin requirements required by the forward counterparty is used as Value at Risk.
In quantifying the Fund's Value at Risk, 100% positive correlation in the different positions held in each market risk category has been assumed. Consequently, the margin requirements applicable to the open contracts have simply been aggregated to

27
determine each trading category's aggregate Value at Risk. The diversification effects resulting from the fact that the Fund's positions are rarely, if ever, 100% positively correlated, have not been reflected.
Value at Risk as calculated herein may not be comparable to similarly titled measures used by others. The Fund’s Trading Value at Risk in Different Market Sectors
The following table indicates the trading Value at Risk associated with the Fund's open positions by market sector at December 31, 2013 and 2012. All open position trading risk exposures of the Fund have been included in calculating the figures set forth below. At December 31, 2013 and 2012, the Fund's total capitalization was $880,409,705 and $1,263,878,940, respectively. December 31, 2013 2012
Market Sector Value at Risk % of Total
Capitalization Value at Risk % of Total
Capitalization Agricultural commodities $ 12,048,839 1.37% $ 15,121,060 1.19% Currencies 32,743,375 3.72 80,209,588 6.35 Energy 10,635,338 1.21 11,375,877 0.90 Equity indices 43,589,832 4.95 81,635,067 6.46 Interest rate instruments 20,895,833 2.37 58,004,027 4.59 Metals 14,333,234 1.63 14,346,855 1.14 Single stock futures 4,144,187 0.47 4,786,136 0.38 Total $ 138,390,638 15.72% $ 265,478,610 21.01% Material Limitations on Value at Risk as an Assessment of Market Risk
The face value of the market sector instruments held by the Fund is typically many times the applicable margin requirement (margin requirements generally ranging between approximately 1% and 10% of contract face value) as well as many times the capitalization of the Fund. The magnitude of the Fund's open positions creates a risk of ruin not typically found in most other investment vehicles. Because of the size of its positions, certain market conditions - unusual, but historically recurring from time to time - could cause the Fund to incur severe losses over a short period of time. The foregoing Value at Risk tables, as well as the past performance of the Fund, gives no indication of this risk of ruin. Non-Trading Risk
The Fund has non-trading market risk on its foreign cash balances not needed for margin. However, these balances (as well as the market risk they represent) are immaterial to the Fund as a whole. The Fund also has non-trading market risk as a result of investing a substantial portion of its available assets in U.S. Treasury securities, U.S. government sponsored enterprise notes, commercial paper, corporate notes and certificates of deposit. Although these investments are considered to be high quality, some of the securities purchased are neither guaranteed by the U.S. government nor supported by the full faith and credit of the U.S. government. There is some risk that a security issuer may fail to pay the interest and principal in a timely manner, or that negative perceptions about the issuer’s ability to make such payments will cause the price of these instruments to decline in value.
Qualitative Disclosures Regarding Primary Trading Risk Exposures The following qualitative disclosures regarding the Fund's market risk exposures - except for those disclosures that are statements of historical fact and the descriptions of how the Fund manages its primary market risk exposures - constitute forward-looking statements within the meaning of Section 27A of the Securities Act of 1933, (“1933 Act”) and Section 21E of the Securities Exchange Act of 1934, (“1934 Act”). The Fund's primary market risk exposures as well as the strategies used and to be used by the Fund’s Trading Advisors for managing such exposures are subject to numerous uncertainties, contingencies and risks, any one of which could cause the actual results of the Fund's risk controls to differ materially from the objectives of such strategies. Government interventions, defaults and expropriations, illiquid markets, the emergence of dominant fundamental factors, political upheavals, changes in historical price relationships, an influx of new market participants, increased regulation and many other factors could result in material losses as well as in material changes to the risk exposures and the risk management strategies of the Fund. There can be no assurance that the Fund's current market exposure and/or risk management strategies will not change materially or that any such strategies will be effective in either the short- or long-term. Investors must be prepared to lose all or substantially all of their investment in the Fund.

28
The following were the primary trading risk exposures of the Fund as of December 31, 2013 and 2012, by market sector. Agricultural Commodities The Fund’s primary agricultural exposure is due to price movements in agricultural commodities, which are often directly affected by severe or unexpected weather conditions as well as other factors that affect inventory levels or supply and demand characteristics. The Fund's agricultural exposure is primarily to cotton, coffee, cocoa, rubber, corn, soybeans, sugar and wheat. Currencies The Fund's currency risk exposure is due to exchange rate fluctuations, primarily fluctuations which disrupt the historical pricing relationships between different currencies and currency pairs. These fluctuations are influenced by interest rate changes as well as political and general economic conditions. The Fund trades various currencies, including cross-rates (i.e., positions between two currencies other than the U.S. dollar).
Energy The Fund's primary energy market exposure is due to gas and oil price movements, often resulting from political developments, ongoing conflicts or production disruptions in the Middle East and other oil producing nations as well as other factors that can influence supply and demand. Crude oil, heating oil, unleaded gas and natural gas are the dominant energy market exposures of the Fund. Oil and gas prices can be volatile and substantial profits and losses have been and are expected to continue to be experienced in this market.
Equity Indices The Fund's primary equity exposure is due to equity price risk in many countries other than the U.S. The stock index futures traded by the Fund are limited to futures on broadly based indices. The Fund is primarily exposed to the risk of adverse price trends or static markets in the major Australian, Canadian, European, Hong Kong, Japanese and U.S. indices. Interest Rate Instruments Interest rate risk is a significant market exposure of the Fund. Interest rate movements directly affect the price of the sovereign bond futures positions held by the Fund and indirectly the value of its stock index and currency positions. Interest rate movements in one country as well as relative interest rate movements between countries materially impact the Fund's profitability. The Fund's primary interest rate exposure is to interest rate fluctuations in the U.S., Japan, Great Britain, the European Economic Union, Sweden, Canada, Australia and New Zealand. Metals The Fund's metals market exposure is primarily due to fluctuations in the price of aluminum, copper, gold, silver, nickel, platinum, lead and zinc.
Single Stock Futures The Fund has a very small exposure to Single Stock Futures (“SSF”). The Fund’s SSF exposure is primarily due to adverse price movements in the underlying stock.
Qualitative Disclosures Regarding Non-Trading Risk Exposure The following were the significant non-trading risk exposures of the Fund as of December 31, 2013 and 2012.
Foreign Currency Balances The Fund's primary foreign currency balances are in euros, Japanese yen, British pounds, Australian dollars, Hong Kong dollars and Canadian dollars. The Fund controls the non-trading risk of these balances by regularly converting these balances back into dollars (no less frequently than once a week). U.S. Treasury Securities, U.S. and Foreign Government Sponsored Enterprise Notes, Commercial Paper, Corporate Notes and Certificates of Deposit Monies in excess of margin requirements are invested in fixed income instruments, including U.S. Treasury securities, U.S. and foreign government sponsored enterprise notes, commercial paper, corporate notes and certificates of deposit. Fluctuations in prevailing interest rates could cause immaterial mark-to-market gains or losses on the Fund's investments; although substantially all of these investments are held to maturity.

29
Qualitative Disclosures Regarding Means of Managing Risk Exposure The means by which the Fund and the Fund’s Trading Advisors, severally, attempt to manage the risk of the Fund's open positions is essentially the same in all market sectors traded. The Fund’s Trading Advisors apply risk management policies to their respective trading which generally limit the total exposure that may be taken. In addition, the Trading Advisors generally follow proprietary diversification guidelines (often formulated in terms of the balanced volatility between markets and correlated groups). The Fund is unaware of any (i) anticipated known demands, commitments or capital expenditures; (ii) material trends, favorable or unfavorable, in its capital resources; or (iii) trends or uncertainties that will have a material effect on operations. From time to time, certain regulatory agencies have proposed increased margin requirements on futures contracts. Because the Fund generally will use a small percentage of assets as margin, the Fund does not believe that any increase in margin requirements, as proposed, will have a material effect on the Fund's operations.
Item 8. Financial Statements and Supplementary Data Financial statements meeting the requirements of Regulation S-X appear in Part IV of this report. The supplementary financial information specified by Item 302 of Regulation S-K is included in this report under the heading "Selected Financial Data" above. Item 9. Changes in and Disagreements with Accountants on Accounting and Financial Disclosures None. Item 9A. Controls and Procedures Evaluation of Disclosure Controls and Procedures The General Partner of the Fund, with the participation of the Chief Executive Officer and Chief Financial Officer, evaluated the effectiveness of the design and operation of the Fund’s disclosure controls and procedures at December 31, 2013 (the “Evaluation Date”). Based on their evaluation, the Chief Executive Officer and Chief Financial Officer of the General Partner concluded that, as of the Evaluation Date, the Fund’s disclosure controls and procedures were effective. Any control system, no matter how well designed and operated, can provide only reasonable (not absolute) assurance that its objectives will be met. Furthermore, no evaluation of controls can provide absolute assurance that all control issues and instances of fraud, if any, have been detected. Management’s Annual Report on Internal Control over Financial Reporting The management of the General Partner is responsible for establishing and maintaining adequate internal control over financial reporting by the Fund. The Fund’s internal control over financial reporting is a process designed to provide reasonable assurance regarding the reliability of financial reporting and the preparation of financial statements for external purposes in accordance with accounting principles generally accepted in the United States. The Fund’s internal control over financial reporting includes those policies and procedures that (i) pertain to the maintenance of records that, in reasonable detail, accurately and fairly reflect the transactions and dispositions of the assets of the Fund; (ii) provide reasonable assurance that transactions are recorded as necessary to permit preparation of financial statements in accordance with accounting principles generally accepted in the United States, and that receipts and expenditures of the Fund are being made only in accordance with authorizations of management of the Fund; and (iii) provide reasonable assurance regarding prevention or timely detection of unauthorized acquisition, use, or disposition of the Fund’s assets that could have a material effect on the consolidated financial statements.
Because of its inherent limitations, internal control over financial reporting may not prevent or detect misstatements. All internal control systems, no matter how well designed, have inherent limitations, including the possibility of human error and the circumvention of overriding controls. Accordingly, even effective internal control over financial reporting can provide only reasonable assurance with respect to financial statement preparation. Also, projections of any evaluation of effectiveness to future periods are subject to the risk that controls may become inadequate because of changes in conditions, or that the degree of compliance with the policies or procedures may deteriorate.

30
Management assessed the effectiveness of the Fund’s internal control over financial reporting as of December 31, 2013, based on the framework set forth by the Committee of Sponsoring Organizations of the Treadway Commission (COSO) in Internal Control-Integrated Framework published in 1992. Based on that assessment, management concluded that, as of December 31, 2013, the Fund’s internal control over financial reporting is effective based on the criteria established in Internal Control-Integrated Framework published in 1992. Changes in Internal Control Over Financial Reporting There has been no change in internal control over financial reporting that occurred during the year ended December 31, 2013 that has materially affected, or is reasonably likely to materially affect, the Fund’s internal control over financial reporting.
Item 9B. Other Information None.
PART III
Item 10. Directors, Executive Officers and Corporate Governance Directors and Executive Officers The Fund itself has no directors or officers and has no employees. It is managed by the General Partner in its capacity as General Partner. The Kenneth E. Steben Revocable Trust, dated January 29, 2008, (“Trust”) is the sole shareholder of the General Partner and Mr. Kenneth E. Steben is the sole trustee and beneficiary of the Trust. The directors and executive officers of the General Partner are Kenneth E. Steben, Michael D. Bulley, Neil D. Menard, Carl A. Serger and Francine Rosenberger. Their respective biographies are set forth below. Kenneth E. Steben is the General Partner’s founder, President and Chief Executive Officer. Additionally, he is Chairman of the board of directors of the General Partner. Mr. Steben, born in January 1955, received his Bachelor’s Degree in Interdisciplinary Studies, with a concentration in Accounting in 1979 from Maharishi University of Management. Mr. Steben has been a licensed stockbroker since 1981 and a licensed commodities broker since 1983. Mr. Steben holds his Series 3, 5, 7, 24, 63 and 65 FINRA and NFA licenses. Mr. Steben has been a CFTC listed Principal, and registered as an Associated Person since March 15, 1989.
Michael D. Bulley is Senior Vice President of Research and Risk Management, and a Director. Mr. Bulley is a CAIASM
designee and Member of the Chartered Alternative Investment Analyst Association®. Mr. Bulley, born in October 1957, received his Bachelor’s Degree in Electrical Engineering from the University of Wisconsin – Madison in 1980 and his Master’s in Business Administration with a concentration in Finance from Johns Hopkins University in 1998. Mr. Bulley joined the General Partner in November 2002, and holds Series 3, 7, 28 and 30 FINRA licenses. Mr. Bulley has been a CFTC listed Principal and registered as an Associated Person of the General Partner since January 18, 2003.
Neil D. Menard is Senior Vice President of Distribution. Mr. Menard, born in August 1967, graduated from Colby College in 1989 with a BA in political science. Prior to joining the General Partner in July of 2006, Mr. Menard was the Director of Sales for Engagement Systems, LLC, a strategic outsource solution for independent financial advisors from October 2004 to June 2006. From June 2003 to October 2004, Mr. Menard served as the Managing Director of New Business Development of SEI Investments Distribution Company. SEI is a provider of asset management, investment processing and investment operations solutions for institutional and personal wealth management. Mr. Menard created sales and selection systems for the new business development team and utilized these processes to select independent investment advisors for SEI. Mr. Menard holds his Series 3, 7, 24 and 63 FINRA and NFA licenses and is a General Securities Principal. Mr. Menard has been a CFTC listed Principal of the General Partner since July 6, 2006, and registered as an Associated Person of the General Partner since August 7, 2006.
Carl A. Serger is Chief Financial Officer and a Director. Mr. Serger joined the General Partner in December of 2009 and has been listed as a CFTC Principal of the General Partner since February 2, 2010. Mr. Serger, born in March 1960, graduated cum laude from Old Dominion University with a BS in Business Administration and has a Technology Management Certification from the California Institute of Technology. Prior to joining the General Partner, Mr. Serger was the CFO and Senior Vice President of Operations of Peracon, Inc., a software platform for institutional commercial real estate transactions from November 2007 through November 2009. From July 2007 to November 2007, he acted as an independent consultant to start-up companies in the financial services and technology industries. From January 2007 to July 2007, Mr. Serger was the CFO, Senior Vice President and Treasurer of Ebix, Inc., an international software company serving the financial services and insurance industries.
31
From October 2006 through December 2006, he was President of Finetre Corporation, a division of Ebix, Inc. From December 1999 until its October 2006 acquisition by Ebix, Inc., Mr. Serger was the CFO, Senior Vice President and Treasurer of Finetre Corporation, a financial technology platform company providing services to major brokerage firms, banks and insurance companies. Mr. Serger holds a Series 28 FINRA license.
Francine Rosenberger is General Counsel. Ms. Rosenberger, born in October 1967, earned her Bachelor of Arts from Juniata College in 1989, and graduated magna cum laude, with a J.D., from The Columbus School of Law at Catholic University in 1995. Prior to joining the General Partner, Ms. Rosenberger was in the Investment Management practice at the law firm of K&L Gates from September 1995 until January 2013. At K&L Gates, Ms. Rosenberger specialized in the formation, structuring and operation of investment companies, ETFs, and commodity pools. She has been pending as a CFTC listed Principal of the General Partner since January 31, 2013. Kenneth E. Steben Revocable Trust, dated January 29, 2008, has been a CFTC listed Principal of the General Partner since March 10, 2008. The Trust is the sole shareholder of the General Partner. Kenneth E. Steben is the sole beneficiary of the Trust and serves as its sole trustee. A biography of Mr. Steben is set forth above.
Since February 29, 2004, Steben & Company, Inc. has acted as general partner to another Maryland limited partnership, Sage Fund Limited Partnership, an SEC registrant under the 1934 Act whose shares are privately offered. Since March 27, 2007, Steben & Company, Inc. has acted as general partner of a Delaware limited partnership, Seneca Global Fund, L.P., whose units of limited partner interests are registered with the SEC pursuant to a public offering. Since March 1, 2011, Steben & Company, Inc. has acted as a manager of a Delaware limited liability company, Steben Institutional Fund LLC (“SIF”). During 2012, the General Partner liquidated SIF and all of the assets of SIF were transferred to the Fund by October 2012. Since August 1, 2013, the General Partner has acted as the general partner for Steben Select Multi-Strategy Partners, L.P., a privately offered investment fund. Since August 1, 2013, the General Partner has been the Investment Manager for Steben Select Multi-Strategy Master Fund, a privately offered closed-end fund. Additionally, since January 1, 2014, the General Partner acts as the investment manager for Steben Select Multi-Strategy Fund, a publicly offered closed-end fund. Because Steben & Company, Inc. serves as the sole general partner or manager of these funds, the officers and directors of Steben & Company, Inc. effectively manage the respective funds. Significant Employees
The General Partner is dependent on the services of Mr. Steben and key management personnel. If Mr. Steben’s services became unavailable, another principal of the firm or a new principal (whose experience cannot be known at this time) would need to take charge of the General Partner.
Family Relationships
None.
Business Experience
See “Item 10. Directors, Executive Officers and Corporate Governance” above.
Involvement in Certain Legal Proceedings
None.
Promoters and Control Persons
Not applicable.
Section 16 (A) Beneficial Ownership Reporting Compliance
Section 16(a) of the 1934 Act requires that reports of beneficial ownership of limited partner interests and changes in such ownership be filed with the SEC by Section 16 “reporting persons.” The Fund is required to disclose in this annual report on Form 10-K each reporting person whom it knows to have failed to file any required reports under Section 16(a) on a timely basis during the year ended December 31, 2013. During the year ended December 31, 2013, all reporting persons complied with all Section 16(a) filing requirements applicable to them.

32
Code of Ethics The General Partner has adopted a code of ethics, as of the period covered by this report, which applies to the Fund’s principal executive officer and principal financial officer, or persons performing similar functions. A copy of the code of ethics is available without charge upon request by calling 240-631-7600.
Item 11. Executive Compensation
The Fund does not have any officers, directors or employees. The managing officers of the General Partner are remunerated by the General Partner in their respective positions. The directors and managing officers of the General Partner receive no other compensation from the Fund.
As compensation for its services in managing the Fund, the General Partner earns the following compensation:
General Partner Management Fee – the Fund incurs a monthly fee on Class A and Class B Units equal to 1/12th of 1.5% of the month-end net asset value of the Class A and Class B Units, payable in arrears. Prior to June 1, 2012, the general partner management fee was 1.75% per annum. The Fund incurs a monthly fee on Class I Units equal to 1/12th of 0.75% of the month-end net asset value of the Class I Units, payable in arrears. During 2013, 2012 and 2011, the General Partner earned $16,660,484, $23,059,894 and $26,123,720, respectively, in General Partner management fees.
General Partner Performance Fee – the Fund incurs a monthly fee on Class I Units equal to 7.5% of new profits of the Class I Units calculated monthly. The general partner performance fee is payable quarterly in arrears. During 2013, 2012 and 2011, the General Partner earned $13,402, $3,161 and $0, respectively, in General Partner performance fees.
Selling Agent Fees – the Class A Units incur a monthly fee equal to 1/12th of 2% of the month-end net asset value of the
Class A Units and such amounts are included in Selling Agent fees – General Partner in the consolidated statements of operations. The General Partner, in turn, pays the selling agent fee to the respective selling agents. If there is no designated selling agent or the General Partner was the selling agent, such portions of the selling agent fee are retained by the General Partner.
Broker Dealer Servicing Fees – the Class B Units incur a monthly fee equal to 1/12th of 0.2% of the month-end net asset
value of the Class B Units and such amounts are included in Selling Agent fees – General Partner in the consolidated statements of operations. The General Partner, in turn, pays the fee to the respective selling agents. If there is no designated selling agent or the General Partner was the selling agent, such portions of the broker dealer servicing fee are retained by the General Partner. During 2013, 2012 and 2011, the General Partner earned $14,343,627, $18,152,168 and $19,182,712, respectively, in Selling Agent and Broker Dealer Servicing Fees.
Additionally, each year the General Partner receives from the Fund 1% of any net income earned by the Fund or pays to the Fund 1% of any net loss incurred by the Fund. For the years ended December 31, 2013, 2012 and 2011, the General Partner paid the Fund $283,366 and $847,505 and $1,356,695, respectively, for the General Partner 1% allocation. Item 12. Security Ownership of Certain Beneficial Owners and Management and Related Stockholder Matters The Fund has no officers or directors as its affairs are managed by the General Partner. Set forth in the table below is information regarding the beneficial ownership of the officers and directors of the Fund’s General Partner at February 28, 2014. There are no securities authorized for issuance under an equity compensation plan.
At February 28, 2014, no person or group is known to have been the beneficial owner of more than 5% of the Units.
At February 28, 2014, the General Partner did not own any Units. At February 28, 2014, the directors, executive officers and principals of the General Partner beneficially owned interests in the Fund as follows:
Name Class of
Units OwnedNumber of
Units Owned Value of Units Percentage of
the Fund Kenneth E. Steben I 254.4114 $ 229,234 0.03%Carl A. Serger B 16.1415 92,340 0.01%Michael D. Bulley B 15.9425 91,202 0.01%

33
Neil D. Menard B 4.3721 25,011 0.00%Total directors and executive officers of the General Partner as a group
290.8675 $ 437,787 0.05%
The address of each director and officer is c/o Steben & Company, Inc., 9711 Washingtonian Blvd., Suite 400, Gaithersburg, Maryland 20878. There has been no change in control of the Fund. Item 13. Certain Relationships and Related Transactions, and Director Independence See “Item 1. Business” for a description of the relationships between the General Partner, the Fund, the Trading Advisor, the futures brokers and the Cash Managers. See “Item 11. Executive Compensation” and “Item 12. Security Ownership of Certain Beneficial Owners and Management and Related Stockholder Matters.”
Item 14. Principal Accountant Fees and Services The following table sets forth the fees billed to the Fund for professional audit services provided by McGladrey LLP (formerly known as McGladrey & Pullen, LLP), the Fund’s independent registered public accountant, for the audits of the Fund’s annual consolidated financial statements for the years ended December 31, 2013 and 2012, and fees billed for other professional services rendered by McGladrey LLP and RSM McGladrey, Inc. (formerly an associated entity that McGladrey LLP acquired on December 1, 2011) (collectively, “McGladrey”) during those years.
Fee Category 2013 2012 Audit fees(1) $ 206,559 $ 200,000 Audit-related fees -- -- Tax fees(2) 41,000 41,000 All other fees -- --
Total fees $ 247,559 $ 241,000
(2) Tax fees consist of fees for the preparation of original tax returns. The General Partner’s Board of Directors pre-approves all audit and permitted non-audit services of the Fund’s independent accountants, including all engagement fees and terms. The General Partner’s Board of Directors approved all the services provided by McGladrey during 2013 and 2012 to the Fund described above. The General Partner’s Board of Directors has determined that the payments made to McGladrey for these services during 2013 and 2012 are compatible with maintaining that firm’s independence. PART IV
Item 15. Exhibits and Financial Statement Schedules
Consolidated Financial Statements
Futures Portfolio Fund, Limited Partnership Report of Independent Registered Public Accounting Firm Consolidated Statements of Financial Condition as of December 31, 2013 and 2012 Consolidated Condensed Schedule of Investments as of December 31, 2013 Consolidated Condensed Schedule of Investments as of December 31, 2012 Consolidated Statements of Operations for the Years Ended December 31, 2013, 2012 and 2011 Consolidated Statements of Cash Flows for the Years Ended December 31, 2013, 2012 and 2011
(1) Audit fees consist of fees for professional services rendered for the audit of the Fund’s consolidated financial statements and review of consolidated financial statements included in the Fund’s quarterly reports, as well as services normally provided by the independent accountant in connection with statutory and regulatory filings or engagements.

34
Consolidated Statements of Changes in Partners’ Capital (Net Asset Value) for the Years Ended December 31, 2013, 2012 and 2011 Notes to Consolidated Financial Statements Financial statement schedules not included in this Form 10-K have been omitted for the reason that they are not required or are not applicable or that equivalent information has been included in the financial notes or statements thereto. Exhibits.
The following exhibits are filed herewith or incorporated by reference.
Exhibit Number Description of Document
1.1* Form of Selling Agreement.
3.1* Maryland Certificate of Limited Partnership.
4.1* Limited Partnership Agreement.
10.1* Form of Subscription Agreement.
16.1* Letter regarding change in certifying accountant.
31.01 Rule 13a-14(a)/15d-14(a) Certification of Principal Executive Officer
31.02 Rule 13a-14(a)/15d-14(a) Certification of Principal Financial Officer
32.01 Section 1350 Certification of Principal Executive Officer
32.02 Section 1350 Certification of Principal Financial Officer
* Incorporated by reference to the corresponding exhibit to the Registrant’s registration statement (File no. 000-50728) filed on April 29, 2004 on Form 10 under the 1934 Act, as amended.

35
SIGNATURES
Pursuant to the requirements of the Securities Exchange Act of 1934, as amended, this report has been signed below by the following persons on behalf of the General Partner of the Registrant in the capacities and on the date indicated.
Name Title Date
/s/ Kenneth E. Steben Kenneth E. Steben
President, Chief Executive Officer and Director of the General Partner March 28, 2014
/s/ Carl A. Serger Carl A. Serger
Chief Financial Officer and Director of the General Partner March 28, 2014
/s/ Michael Bulley Michael D. Bulley
Senior Vice President, Research & Risk Management and Director of the General Partner March 28, 2014
Pursuant to the requirements of Section 13 or 15(d) of the Securities Exchange Act of 1934, as amended, the registrant has duly caused this report to be signed on its behalf by the undersigned, thereunto duly authorized.
Dated March 28, 2014 Futures Portfolio Fund, Limited Partnership
By: Steben & Company, Inc. General Partner
By: /s/ Kenneth E. Steben Name: Kenneth E. Steben Title: President, Chief Executive Officer and Director
of the General Partner

F-1
Report of Independent Registered Public Accounting Firm To the Partners of Futures Portfolio Fund, Limited Partnership
We have audited the accompanying consolidated statements of financial condition, including the consolidated condensed schedule of investments, of Futures Portfolio Fund, Limited Partnership and subsidiary (the "Fund"), as of December 31, 2013 and 2012, and the related consolidated statements of operations, cash flows, and changes in partners' capital (net asset value) for each of the three years in the period ended December 31, 2013. These financial statements are the responsibility of the Fund's management. Our responsibility is to express an opinion on these financial statements based on our audits. We conducted our audits in accordance with the standards of the Public Company Accounting Oversight Board (United States). Those standards require that we plan and perform the audit to obtain reasonable assurance about whether the financial statements are free of material misstatement. The Fund is not required to have, nor were we engaged to perform, an audit of its internal control over financial reporting. Our audits included consideration of internal control over financial reporting as a basis for designing the audit procedures that are appropriate in the circumstances, but not for the purpose of expressing an opinion on the effectiveness of the Fund's internal control over financial reporting. Accordingly, we express no such opinion. An audit also includes examining, on a test basis, evidence supporting the amounts and disclosures in the financial statements, assessing the accounting principles used and significant estimates made by management, as well as evaluating the overall financial presentation. We believe that our audits provide a reasonable basis for our opinion. In our opinion, the consolidated financial statements referred to above present fairly, in all material respects, the financial position of Futures Portfolio Fund, Limited Partnership and subsidiary as of December 31, 2013 and 2012, and the results of their operations and their cash flows for each of the three years in the period ended December 31, 2013 in conformity with U.S. generally accepted accounting principles.
/s/ McGladrey LLP Chicago, Illinois March 28, 2014

The accompanying notes are an integral part of these consolidated financial statements. F-2
Futures Portfolio Fund, Limited Partnership Consolidated Statements of Financial Condition
December 31, 2013 and 2012
2013 2012 Assets
Equity in broker trading accounts Cash $ 289,217,101 $ 509,692,323 Net unrealized gain on open futures contracts 37,958,108 12,117,973 Net unrealized gain on open forward currency contracts 695,075 5,626,395
Total equity in broker trading accounts 327,870,284 527,436,691 Cash and cash equivalents 22,745,016 23,524,330 Investments in securities, at fair value 530,922,246 700,338,316 Certificates of deposit, at fair value 42,625,053 68,111,362 General Partner 1% allocation receivable 283,366 847,505
Total assets $ 924,445,965 $ 1,320,258,204
Liabilities and Partners’ Capital (Net Asset Value) Liabilities
Trading Advisor management fees payable $ 2,512,701 $ 2,067,535 Trading Advisor incentive fees payable 177,898 -- Commissions and other trading fees payable on open contracts 144,920 278,431 Cash Manager fees payable 164,805 307,443 General Partner management and performance fees payable 1,145,591 1,635,993 Selling Agent fees payable – General Partner 1,016,111 1,380,866 Administrative expenses payable – General Partner 344,649 490,790 Redemptions payable 36,130,211 41,157,564 Subscriptions received in advance 2,399,374 9,060,642
Total liabilities 44,036,260 56,379,264 Partners’ Capital (Net Asset Value)
Class A Interests – 133,795.0412 units and 178,207.9880 units outstanding at December 31, 2013 and 2012, respectively 550,501,395 753,610,488
Class B Interests – 56,246.4420 units and 86,910.3630 units outstanding at December 31, 2013 and 2012, respectively 325,651,536 508,000,871
Class I Interests – 4,675.5936 and 2,484.3408 units outstanding at December 31, 2013 and 2012, respectively 4,256,774 2,267,581
Total partners' capital (net asset value) 880,409,705 1,263,878,940 Total liabilities and partners' capital (net asset value) $ 924,445,965 $ 1,320,258,204

The accompanying notes are an integral part of these consolidated financial statements. F-3
Futures Portfolio Fund, Limited Partnership Consolidated Condensed Schedule of Investments
December 31, 2013
Fair Value
% of Partners'
Capital (Net Asset Value)
INVESTMENTS IN SECURITIESU.S. Treasury Securities
Face Value Maturity Date Name Yield 1
8,000,000$ 2/28/14 U.S. Treasury Note 1.88% 8,073,462$ 0.92%8,350,000 3/31/14 U.S. Treasury Note 1.75% 8,420,926 0.96%5,115,000 4/15/14 U.S. Treasury Note 1.25% 5,145,478 0.58%7,500,000 5/15/14 U.S. Treasury Note 1.00% 7,534,638 0.86%8,750,000 5/31/14 U.S. Treasury Note 2.25% 8,843,870 1.01%3,000,000 5/31/14 U.S. Treasury Note 0.25% 3,002,417 0.34%8,100,000 6/30/14 U.S. Treasury Note 2.63% 8,201,206 0.93%4,000,000 6/30/14 U.S. Treasury Note 0.25% 4,003,152 0.45%5,000,000 8/31/14 U.S. Treasury Note 2.38% 5,113,984 0.58%5,000,000 9/30/14 U.S. Treasury Note 0.25% 5,007,294 0.57%7,200,000 11/30/14 U.S. Treasury Note 2.13% 7,340,891 0.83%3,185,000 12/15/14 U.S. Treasury Note 0.25% 3,187,984 0.36%2,700,000 12/31/14 U.S. Treasury Note 0.13% 2,699,167 0.31%3,700,000 1/31/15 U.S. Treasury Note 0.25% 3,706,905 0.42%5,000,000 4/30/15 U.S. Treasury Note 0.13% 4,995,210 0.57%2,833,000 12/31/15 U.S. Treasury Note 0.25% 2,825,495 0.32%
Total U.S. Treasury securities (cost: $88,765,255) 88,102,079 10.01%
U.S. Commercial PaperFace Value Maturity Date Name Yield 1
Automotive2,200,000$ 1/21/14 Nissan Motor Acceptance Corp. 0.30% 2,199,633 0.25%
Banks2,200,000 2/24/14 Mizuho Funding LLC 0.21% 2,199,323 0.25%
Beverages2,200,000 1/15/14 Bacardi Corporation 0.25% 2,199,786 0.25%1,262,000 1/16/14 Brown-Forman Corporation 0.12% 1,261,937 0.14%
Diversified Financial Services2,700,000 1/9/14 AXA Financial, Inc. 0.24% 2,699,856 0.30%1,500,000 1/14/14 VNA Holding Inc. 0.30% 1,499,838 0.17%
Energy2,000,000 1/30/14 Devon Energy Corporation 0.20% 1,999,678 0.23%2,000,000 1/10/14 Enterprise Products Operating LLC 0.22% 1,999,890 0.23%2,200,000 1/7/14 Oglethorpe Power Corporation 0.16% 2,199,941 0.25%2,000,000 1/23/14 Sempra Energy Global Enterprises 0.25% 1,999,694 0.23%2,750,000 1/7/14 Southern Company Funding Corp. 0.17% 2,749,922 0.31%
Food2,000,000 1/10/14 Sysco Corporation 0.17% 1,999,915 0.23%
Manufacturing1,200,000 1/3/14 Stanley Black & Decker, Inc. 0.15% 1,199,990 0.14%
Non-profit2,800,000 1/6/14 Salvation Army 0.15% 2,799,942 0.31%
Description

The accompanying notes are an integral part of these consolidated financial statements. F-4
Futures Portfolio Fund, Limited Partnership Consolidated Condensed Schedule of Investments (continued)
December 31, 2013
Fair Value
% of Partners'
Capital (Net Asset Value)
U.S . Commercial Paper (continued)Face Value Maturity Date Name Yield 1
Telecommunications2,000,000$ 1/24/14 Verizon Communications Inc. 0.21% 1,999,732$ 0.23%
Total U.S. commercial paper (cost: $31,004,242) 31,009,077 3.52%
Foreign Commercial PaperFace Value Maturity Date Name Yield 1
Banks2,100,000$ 3/31/14 Bank of Nova Scotia 0.17% 2,099,115 0.24%2,015,000 1/14/14 Bank of Tokyo-Mitsubishi UFJ, Ltd. 0.15% 2,014,891 0.23%2,600,000 1/6/14 Commonwealth Bank of Australia 0.15% 2,599,946 0.30%2,400,000 2/27/14 DBS Bank Ltd 0.16% 2,399,392 0.27%1,250,000 4/7/14 DNB Bank ASA 0.18% 1,249,400 0.14%2,500,000 3/3/14 Nordea Bank AB 0.18% 2,499,259 0.28%2,500,000 1/7/14 Oversea-Chinese Banking Corporation Ltd 0.19% 2,499,921 0.28%1,400,000 2/10/14 Skandinaviska Enskilda Banken AB 0.15% 1,399,767 0.16%2,700,000 1/22/14 Sumitomo Mitsui Bank 0.15% 2,699,764 0.31%
Consumer Products1,600,000 3/4/14 Reckitt Benckiser Treasury Services PLC 0.43% 1,599,544 0.18%4,000,000 4/17/14 Reckitt Benckiser Treasury Services PLC 0.40% 3,997,670 0.46%
Energy2,500,000 1/2/15 Electricite de France 0.55% 2,486,500 0.28%3,000,000 1/30/14 GDF Suez 0.20% 2,999,517 0.34%
Food2,100,000 1/17/14 Tesco Treasury Services PLC 0.25% 2,099,767 0.24%
Insurance1,500,000 1/8/14 Prudential PLC 0.16% 1,499,953 0.17%
Total foreign commercial paper (cost: $34,118,201) 34,144,406 3.88%
Total commercial paper (cost: $65,122,443) 65,153,483 7.40%
U.S. Corporate NotesFace Value Maturity Date Name Yield 1
Aerospace1,240,000$ 6/1/14 BAE Systems Holdings Inc. 4.95% 1,266,529 0.14%2,800,000 12/15/16 Rockwell Collins, Inc. 0.59% 2,805,386 0.32%
Automotive2,500,000 3/28/14 Daimler Finance North America LLC 1.95% 2,518,789 0.29%8,300,000 7/31/15 Daimler Finance North America LLC 1.30% 8,407,757 0.95%1,805,000 3/1/14 Johnson Controls, Inc. 1.75% 1,819,497 0.21%1,700,000 9/18/15 Toyota Motor Credit Corporation 0.39% 1,700,853 0.19%
Banks2,250,000 4/1/15 Bank of America Corporation 4.50% 2,378,565 0.27%3,750,000 3/22/16 Bank of America Corporation 1.07% 3,781,374 0.43%2,000,000 2/20/15 Bank of New York Mellon 1.20% 2,024,095 0.23%
189,000 4/1/14 Citigroup Inc. 1.18% 189,567 0.02%
Description

The accompanying notes are an integral part of these consolidated financial statements. F-5
Futures Portfolio Fund, Limited Partnership Consolidated Condensed Schedule of Investments (continued)
December 31, 2013
Fair Value
% of Partners'
Capital (Net Asset Value)
U.S . Corporate Notes (continued)Face Value Maturity Date Name Yield 1
Banks (continued)8,000,000$ 4/1/16 Citigroup Inc. 1.30% 8,052,560$ 0.91%2,460,000 2/7/14 Goldman Sachs Group, Inc. 1.24% 2,466,374 0.28%9,250,000 7/22/15 Goldman Sachs Group, Inc. 0.64% 9,232,548 1.05%
10,275,000 2/26/16 JPMorgan Chase & Co. 0.86% 10,319,661 1.18%7,500,000 10/15/15 Morgan Stanley 0.72% 7,506,959 0.85%2,641,000 5/1/14 Northern Trust Corporation 4.63% 2,699,554 0.31%3,500,000 1/15/15 The Bank of New York Mellon 3.10% 3,644,296 0.41%4,815,000 2/13/15 Wells Fargo & Company 1.25% 4,877,825 0.55%1,500,000 7/20/15 Wells Fargo Bank 0.52% 1,503,866 0.17%
Beverages2,750,000 7/14/14 Anheuser-Busch InBev Worldwide Inc. 1.50% 2,784,802 0.32%6,650,000 7/15/15 Anheuser-Busch InBev Worldwide Inc. 0.80% 6,705,121 0.76%
Biotechnology1,500,000 11/15/14 Amgen Inc. 1.88% 1,520,308 0.17%8,450,000 12/1/14 Gilead Sciences, Inc. 2.40% 8,612,409 0.98%
Computers4,500,000 5/30/14 Hewlett-Packard Company 0.64% 4,496,825 0.51%3,850,000 9/19/14 Hewlett-Packard Company 1.79% 3,884,488 0.44%
Diversified Financial Services2,500,000 8/25/14 American Express Credit Corporation 5.13% 2,620,966 0.30%4,500,000 4/8/14 American Honda Finance Corp. 0.37% 4,505,258 0.51%3,750,000 8/11/15 American Honda Finance Corporation 1.00% 3,780,183 0.43%
500,000 2/15/14 CME Group Inc. 5.75% 513,792 0.06%1,860,000 1/10/14 ERAC USA Finance LLC 2.25% 1,880,442 0.21%1,750,000 3/4/15 General Electric Capital Corporation 4.88% 1,865,951 0.21%3,500,000 7/2/15 General Electric Capital Corporation 1.63% 3,585,158 0.41%5,000,000 1/8/16 General Electric Capital Corporation 0.44% 4,989,578 0.57%
800,000 10/8/14 John Deere Capital Corporation 0.34% 801,093 0.09%1,500,000 3/9/15 John Deere Capital Corporation 2.95% 1,556,997 0.18%2,400,000 6/15/15 John Deere Capital Corporation 0.36% 2,401,102 0.27%1,000,000 4/21/14 MassMutual Global Funding II 2.88% 1,013,309 0.12%
Electronics1,350,000 11/17/15 Honeywell International Inc. 0.29% 1,350,416 0.15%
Energy1,100,000 11/15/14 177293 Canada Ltd. 5.00% 1,147,025 0.13%
640,000 6/30/14 Arizona Public Service Company 5.80% 655,732 0.07%400,000 10/15/14 Atmos Energy Corporation 4.95% 417,407 0.05%
1,730,000 5/15/14 DTE Energy Company 7.63% 1,790,737 0.20%1,273,000 3/6/15 Duke Energy Ohio, Inc. 0.38% 1,273,979 0.14%1,855,000 1/15/14 Exelon Generation Company, LLC 5.35% 1,904,064 0.22%2,000,000 6/1/14 NextEra Energy Capital Holdings, Inc. 1.61% 2,011,605 0.23%1,370,000 10/1/14 Niagara Mohawk Power Corporation 3.55% 1,411,772 0.16%
Description

The accompanying notes are an integral part of these consolidated financial statements. F-6
Futures Portfolio Fund, Limited Partnership Consolidated Condensed Schedule of Investments (continued)
December 31, 2013
Fair Value
% of Partners'
Capital (Net Asset Value)
U.S . Corporate Notes (continued)Face Value Maturity Date Name Yield 1
Energy (continued)2,000,000$ 8/15/14 Public Service Electric and Gas Company 5.00% 2,093,454$ 0.24%2,000,000 8/15/14 Public Service Electric and Gas Company 0.85% 2,012,144 0.23%2,328,000 3/15/14 Sempra Energy 1.00% 2,332,395 0.26%
Food6,000,000 6/4/15 Kraft Foods Group, Inc. 1.63% 6,090,293 0.69%4,500,000 10/17/16 Kroger Co. 0.80% 4,499,780 0.51%
Healthcare600,000 12/11/14 Baxter International Inc. 0.41% 600,903 0.07%
3,500,000 3/15/15 Medtronic, Inc. 3.00% 3,642,140 0.41%675,000 11/30/14 Zimmer Holdings, Inc. 1.40% 680,182 0.08%
Diversified Financial Services11,122,000 3/20/15 American International Group, Inc. 3.00% 11,529,028 1.32%1,500,000 2/11/15 Berkshire Hathaway Inc. 3.20% 1,564,714 0.18%4,000,000 9/30/15 Jackson National Life Global Funding 0.60% 4,011,869 0.46%4,450,000 6/11/14 Pricoa Global Funding I 5.45% 4,558,646 0.52%
600,000 8/19/15 Pricoa Global Funding I 0.51% 601,286 0.07%1,000,000 9/19/14 Principal Life Global Funding II 0.40% 1,000,999 0.11%2,498,000 12/1/15 Travelers Companies, Inc. 5.50% 2,736,470 0.31%
Manufacturing4,000,000 11/2/15 Eaton Corporation 0.95% 4,021,548 0.46%3,750,000 10/9/15 General Electric Company 0.85% 3,776,423 0.43%
Media2,900,000 4/30/15 NBCUniversal Media, LLC 3.65% 3,037,184 0.34%1,445,000 4/15/16 NBCUniversal Media, LLC 0.78% 1,448,195 0.16%1,150,000 9/15/14 Viacom Inc. 4.38% 1,194,807 0.14%4,600,000 2/11/15 Walt Disney Company 0.23% 4,600,598 0.52%
Mining1,140,000 5/1/14 Rio Tinto Finance (USA) Limited 8.95% 1,187,971 0.13%
Pharmaceutical5,150,000 11/6/15 AbbVie Inc. 1.00% 5,197,960 0.59%
975,000 2/12/15 Express Scripts Holding Company 2.10% 997,404 0.11%4,275,000 2/10/14 Novartis Capital Corporation 4.13% 4,362,322 0.50%
REITs2,400,000 5/15/14 Simon Property Group, L.P. 6.75% 2,437,512 0.28%1,000,000 8/15/14 Simon Property Group, L.P. 5.63% 1,044,933 0.12%
Retail1,800,000 1/15/14 AutoZone, Inc. 6.50% 1,857,458 0.21%
Telecommunications960,000 9/15/14 AT&T Inc. 5.10% 1,005,014 0.11%
8,050,000 2/13/15 AT&T Inc. 0.88% 8,127,393 0.92%1,040,000 8/15/15 AT&T Inc. 2.50% 1,077,586 0.12%2,250,000 3/28/14 Verizon Communications Inc. 0.86% 2,253,042 0.26%4,575,000 3/6/15 Verizon Communications Inc. 0.44% 4,570,512 0.52%4,000,000 9/15/16 Verizon Communications Inc. 1.77% 4,128,792 0.47%
Total U.S. corporate notes (cost: $252,246,718) 250,957,531 28.50%
Description

The accompanying notes are an integral part of these consolidated financial statements. F-7
Futures Portfolio Fund, Limited Partnership Consolidated Condensed Schedule of Investments (continued)
December 31, 2013
Fair Value
% of Partners'
Capital (Net Asset Value)
Foreign Corporate NotesFace Value Maturity Date Name Yield 1
Automotive3,000,000$ 3/21/14 Volkswagen Int'l Finance N.V. 1.00% 3,004,676$ 0.34%
10,000,000 11/18/16 Volkswagen Int'l Finance N.V. 0.68% 10,017,381 1.14%Banks
1,000,000 1/13/15 Australia and New Zealand Banking Group 3.70% 1,049,841 0.12%3,950,000 5/7/15 Australia and New Zealand Banking Group 0.44% 3,955,928 0.45%4,100,000 9/24/15 Bank of Montreal 0.50% 4,102,607 0.47%1,800,000 7/10/14 Barclays Bank PLC 5.20% 1,889,402 0.21%2,740,000 3/19/15 Commonwealth Bank of Australia 3.50% 2,863,444 0.33%5,000,000 4/14/14 Danske Bank A/S 1.29% 5,020,114 0.57%
400,000 1/17/14 HSBC Bank PLC 1.04% 401,025 0.04%4,000,000 6/9/14 ING Bank N.V. 1.64% 4,025,891 0.46%1,500,000 6/9/14 ING Bank N.V. 2.38% 1,514,839 0.17%5,350,000 9/25/15 ING Bank N.V. 2.00% 5,458,302 0.62%3,050,000 9/25/15 ING Bank N.V. 1.89% 3,111,067 0.35%1,175,000 4/11/14 National Australia Bank Limited 2.25% 1,187,388 0.13%
600,000 3/20/15 Nordea Bank AB 2.25% 615,818 0.07%2,000,000 5/13/14 Rabobank Nederland 4.20% 2,038,986 0.23%3,431,000 3/11/15 Rabobank Nederland 3.20% 3,571,331 0.41%7,650,000 3/18/16 Rabobank Nederland 0.72% 7,679,537 0.87%4,190,000 11/18/14 Standard Chartered PLC 5.50% 4,386,735 0.50%5,000,000 5/1/15 Toronto-Dominion Bank 0.42% 5,007,986 0.57%2,200,000 1/15/15 UBS AG 3.88% 2,313,791 0.26%
Energy8,600,000 11/14/14 Canadian Natural Resources Ltd 1.45% 8,673,728 0.99%4,800,000 5/9/16 CNOOC Finance (2013) Limited 1.13% 4,802,760 0.55%1,000,000 1/26/14 Electricite de France 5.50% 1,026,421 0.12%3,602,000 3/15/14 EOG Resources Canada Inc. 4.75% 3,685,544 0.42%1,500,000 3/2/15 TransCanada PipeLines Limited 0.88% 1,508,699 0.17%
Food600,000 12/5/14 Tesco PLC 2.00% 608,424 0.07%
Multi-national4,000,000 2/26/15 International Finance Corporation 0.38% 4,004,804 0.45%
Pharmaceutical10,150,000 3/17/15 Takeda Pharmaceutical Co Ltd 1.03% 10,240,862 1.16%8,500,000 3/21/14 Teva Pharmaceutical Finance III BV 0.75% 8,513,655 0.97%
Telecommunications1,815,000 3/1/14 America Movil, S.A.B. de C.V. 5.50% 1,862,021 0.21%2,270,000 7/8/14 Orange 4.38% 2,360,619 0.27%2,100,000 6/10/14 Vodafone Group PLC 4.15% 2,138,585 0.24%
Transportation4,000,000 10/28/16 Kansas City Southern de Mexico 0.94% 4,066,942 0.46%
Total foreign corporate notes (cost: $127,072,938) 126,709,153 14.39%
Total corporate notes (cost: $379,319,656) 377,666,684 42.89%Total investments in securities (cost: $533,207,354) 530,922,246$ 60.30%
Description

The accompanying notes are an integral part of these consolidated financial statements. F-8
Futures Portfolio Fund, Limited Partnership Consolidated Condensed Schedule of Investments (continued)
December 31, 2013
Fair Value
% of Partners'
Capital (Net Asset Value)
CERTIFICATES OF DEPOSITU.S. Certificates of Deposit
Face Value Maturity Date Name Yield 1
Banks4,000,000$ 2/11/14 Bank of Tokyo-Mitsubishi UFJ, Ltd. (NY) 0.42% 4,016,143$ 0.46%2,500,000 3/7/14 Bank of Tokyo-Mitsubishi UFJ, Ltd. (NY) 0.40% 2,509,173 0.29%1,000,000 1/30/14 Barclays Bank (NY) 0.78% 1,007,812 0.11%3,000,000 2/14/14 Barclays Bank (NY) 0.75% 3,021,996 0.34%2,000,000 4/1/14 China Construction Bank Corporation (NY) 0.65% 2,005,242 0.23%5,000,000 9/17/14 Deutsche Bank (NY) 0.51% 5,012,367 0.57%3,500,000 2/27/14 Mizuho Bank (NY) 0.21% 3,500,827 0.40%5,000,000 5/9/14 Sumitomo Mitsui Bank (NY) 0.38% 5,014,597 0.57%3,000,000 5/30/14 UBS AG (NY) 0.52% 3,012,777 0.34%
Total U.S. certificates of deposit (cost: $29,000,000) 29,100,934 3.31%
Foreign Certificates of DepositFace Value Maturity Date Name Yield 1
Banks2,000,000$ 2/10/14 Bank of Nova Scotia 0.74% 2,004,015 0.23%2,000,000 10/23/15 Bank of Nova Scotia 0.49% 2,001,152 0.23%2,000,000 1/15/15 Credit Suisse Group AG 0.64% 2,005,475 0.23%2,500,000 5/15/15 Credit Suisse Group AG 0.54% 2,500,464 0.28%3,000,000 2/14/14 Industrial and Commercial Bank of China Ltd 0.77% 3,011,154 0.34%2,000,000 12/19/14 Svenska Handelsbanken AB 0.41% 2,001,859 0.23%
Total foreign certificates of deposit (cost: $13,500,000) 13,524,119 1.54%
Total certificates of deposit (cost: $42,500,000) 42,625,053$ 4.85%
OPEN FUTURES CONTRACTSLong U.S . Futures Contracts
Agricultural commodities (1,285,920)$ (0.15)%Currencies 1,637,874 0.19%Energy 178,014 0.02%Equity indices2 9,622,471 1.09%Interest rate instruments (1,613,148) (0.18)%Metals 3,628,603 0.41%Single stock futures 553,351 0.06%
Net unrealized gain on open long U.S. futures contracts 12,721,245 1.44%
Short U.S . Futures ContractsAgricultural commodities 5,024,333 0.58%Currencies 4,288,371 0.49%Energy (190,577) (0.02)%Equity indices 1,437,522 0.16%Interest rate instruments 1,571,383 0.18%Metals (2,334,738) (0.27)%Single stock futures (50,972) (0.01)%
Net unrealized gain on open short U.S. futures contracts 9,745,322 1.11%
Total U.S. Futures Contracts - Net unrealized gain on open U.S. futures contracts 22,466,567 2.55%
Description

The accompanying notes are an integral part of these consolidated financial statements. F-9
Futures Portfolio Fund, Limited Partnership Consolidated Condensed Schedule of Investments (continued)
December 31, 2013
1 Represents the annualized yield at date of purchase for discount securities, the stated coupon rate for coupon-bearing securities, or the stated interest rate for certificates of deposit.
2 No individual futures or forward currency contract position constituted one percent or greater of partners’ capital (net asset value). Accordingly, the number of contracts and expiration dates are not presented.
Fair Value
% of Partners'
Capital (Net Asset Value)
Long Foreign Futures ContractsAgricultural commodities 7,074$ 0.00%Currencies 1,610,945 0.18%Energy 16,781 0.00%Equity indices2 14,012,489 1.59%Interest rate instruments (3,066,606) (0.35)%Single stock futures 46,170 0.01%
Net unrealized gain on open long foreign futures contracts 12,626,853 1.43%
Short Foreign Futures ContractsAgricultural commodities 171,905 0.02%Currencies 148,660 0.02%Energy 16,007 0.00%Equity indices (206,846) (0.02)%Interest rate instruments 2,737,146 0.31%Metals (2,184) (0.00)%
Net unrealized gain on open short foreign futures contracts 2,864,688 0.33%
Total foreign futures contracts - net unrealized gain on open foreign futures contracts 15,491,541 1.76%
Net unrealized gain on open futures contracts 37,958,108$ 4.31%
OPEN FORWARD CURRENCY CONTRACTSU.S. Forward Currency Contracts
Long (1,252,456)$ (0.14)%Short 1,307,980 0.15%
Net unrealized gain on open U.S. forward currency contracts 55,524 0.01%
Foreign Forward Currency ContractsLong 412,242 0.04%Short 227,309 0.03%
Net unrealized gain on open foreign forward currency contracts 639,551 0.07%
Net unrealized gain on open forward currency contracts 695,075$ 0.08%
Description

The accompanying notes are an integral part of these consolidated financial statements. F-10
Futures Portfolio Fund, Limited Partnership Consolidated Condensed Schedule of Investments
December 31, 2012
Description Fair Value
% of Partners'
Capital (Net Asset Value)
INVESTMENTS IN SECURITIESU.S. Treasury Securities
Face Value Maturity Date Name Yield 1
4,795,000$ 1/15/13 U.S. Treasury Notes 1.38% 4,827,597$ 0.38%500,000 3/31/13 U.S. Treasury Notes 2.50% 506,123 0.04%
4,000,000 4/30/13 U.S. Treasury Notes 3.13% 4,060,997 0.32%7,350,000 5/31/13 U.S. Treasury Notes 3.50% 7,474,923 0.59%8,850,000 6/15/13 U.S. Treasury Notes 1.13% 8,894,753 0.70%3,500,000 6/30/13 U.S. Treasury Notes 3.38% 3,556,382 0.28%9,000,000 7/15/13 U.S. Treasury Notes 1.00% 9,083,208 0.72%4,500,000 7/31/13 U.S. Treasury Notes 3.38% 4,647,405 0.37%7,500,000 8/15/13 U.S. Treasury Notes 0.75% 7,549,372 0.60%
12,020,000 8/31/13 U.S. Treasury Notes 0.13% 12,022,292 0.96%8,000,000 9/30/13 U.S. Treasury Notes 0.13% 8,000,371 0.63%3,200,000 10/31/13 U.S. Treasury Notes 2.75% 3,282,947 0.26%5,000,000 11/15/13 U.S. Treasury Notes 0.50% 5,017,111 0.40%8,250,000 11/30/13 U.S. Treasury Notes 0.25% 8,256,648 0.65%8,000,000 12/15/13 U.S. Treasury Notes 0.75% 8,045,298 0.64%4,000,000 2/28/14 U.S. Treasury Notes 1.88% 4,102,723 0.32%5,850,000 3/31/14 U.S. Treasury Notes 1.75% 5,987,441 0.47%
Total U.S. Treasury securities (cost: $105,775,748) 105,315,591 8.33%
U.S. Government Sponsored Enterprise NotesFace Value Maturity Date Name Yield 1
1,160,000$ 5/28/13 Federal Farm Credit Bank 0.20% 1,160,162 0.09%3,250,000 1/16/13 Federal Home Loan Bank 1.50% 3,274,086 0.26%2,300,000 1/29/13 Federal Home Loan Bank 0.38% 2,304,081 0.18%3,000,000 3/27/13 Federal Home Loan Bank 1.00% 3,014,061 0.24%6,700,000 1/9/13 Federal Home Loan Mortgage Corp. 1.38% 6,745,650 0.54%
250,000 8/9/13 Federal National Mortgage Assoc. 0.50% 250,975 0.02%Total U.S. government sponsored enterprise notes (cost: $16,904,946) 16,749,015 1.33%
U.S. Commercial PaperFace Value Maturity Date Name Yield 1
Automotive4,000,000$ 1/7/13 BMW US Capital, LLC 0.14% 3,999,908 0.32%
Banks3,800,000 2/4/13 Bank of Tokyo-Mitsubishi UFJ, Ltd. 0.20% 3,799,282 0.30%3,050,000 1/30/13 Mizuho Funding LLC 0.24% 3,049,410 0.24%3,800,000 3/4/13 Standard Chartered Bank 0.25% 3,798,364 0.30%
Beverages1,025,000 2/26/13 Anheuser-Busch InBev Worldwide Inc. 0.24% 1,024,617 0.07%
Diversified Financial Services3,850,000 2/15/13 Caterpillar Financial Services Corporation 0.19% 3,849,086 0.30%2,250,000 1/4/13 ING (U.S.) Funding LLC 0.25% 2,249,953 0.18%1,600,000 2/14/13 UOB Funding LLC 0.19% 1,599,628 0.13%

The accompanying notes are an integral part of these consolidated financial statements. F-11
Futures Portfolio Fund, Limited Partnership Consolidated Condensed Schedule of Investments (continued)
December 31, 2012
Description Fair Value
% of Partners'
Capital (Net Asset Value)
U.S . Commercial Paper (continued)Face Value Maturity Date Name Yield 1
Energy2,500,000$ 1/2/13 Apache Corporation 0.35% 2,499,976$ 0.20%3,500,000 1/25/13 Devon Energy Corporation 0.27% 3,499,370 0.28%3,500,000 1/10/13 Motiva Enterprises LLC 0.18% 3,499,843 0.28%3,800,000 1/2/13 NextEra Energy 0.42% 3,799,956 0.30%3,850,000 2/19/13 Oglethorpe Power Corporation 0.22% 3,848,847 0.30%3,500,000 1/14/13 ONEOK, Inc. 0.40% 3,499,494 0.28%3,500,000 1/18/13 Sempra Energy Global Enterprises 0.40% 3,499,339 0.28%
Food3,700,000 1/24/13 H. J. Heinz Finance Company 0.26% 3,699,385 0.29%
Manufacturing3,100,000 1/3/13 Danaher Corporation 0.15% 3,099,974 0.25%2,400,000 1/4/13 Dover Corporation 0.10% 2,399,980 0.19%
Total U.S. commercial paper (cost: $56,708,020) 56,716,412 4.49%
Foreign Commercial PaperFace Value Maturity Date Name Yield 1
Banks5,300,000$ 2/1/13 DBS Bank Ltd. 0.89% 5,299,611 0.41%4,000,000 3/25/13 Macquarie Bank Limited 0.63% 3,997,360 0.32%2,900,000 1/28/13 Sumitomo Mitsui Banking Corporation 0.23% 2,899,522 0.23%
Diversified Financial Services3,100,000 1/16/13 John Deere Bank SA 0.16% 3,099,793 0.25%4,200,000 1/17/13 Toyota Credit Canada Inc. 0.22% 4,199,589 0.33%
Energy3,800,000 1/3/13 BP Capital Markets P.L.C. 0.17% 3,799,968 0.30%3,900,000 1/2/13 GDF Suez 0.24% 3,899,974 0.31%
Household Products2,500,000 3/5/13 Reckitt Benckiser 0.75% 2,498,979 0.20%5,250,000 4/8/13 Reckitt Benckiser 0.80% 5,246,693 0.41%
Latin America Multi-National4,000,000 2/15/13 Corporacion Andina de Fomento 0.24% 3,998,800 0.32%
Total foreign commercial paper (cost: $38,819,728) 38,940,289 3.08%
Total commercial paper (cost: $95,527,748) 95,656,701 7.57%
U.S. Corporate NotesFace Value Maturity Date Name Yield 1
Aerospace13,000,000$ 12/2/13 United Technologies 0.58% 13,041,831 1.02%
Apparel2,325,000 8/23/13 V.F. Corporation 1.06% 2,339,017 0.19%
Automotive4,300,000 7/31/15 Daimler Finance North America LLC 1.30% 4,348,231 0.34%

The accompanying notes are an integral part of these consolidated financial statements. F-12
Futures Portfolio Fund, Limited Partnership Consolidated Condensed Schedule of Investments (continued)
December 31, 2012
Description Fair Value
% of Partners'
Capital (Net Asset Value)
U.S . Corporate Notes (continued)Face Value Maturity Date Name Yield 1
Banks2,000,000$ 4/16/13 American Express Bank 5.50% 2,051,847$ 0.16%
10,450,000 1/30/14 Bank of America Corporation 1.73% 10,569,450 0.84%2,200,000 4/1/13 Bank of New York Mellon 4.50% 2,247,157 0.18%2,000,000 8/27/13 Bank of New York Mellon 5.13% 2,097,186 0.17%5,000,000 7/28/14 Bank of New York Mellon 0.58% 5,013,876 0.40%2,475,000 9/25/13 BB&T Corporation 3.38% 2,548,743 0.20%
189,000 4/1/14 Citigroup Inc. 1.29% 189,833 0.02%3,094,000 5/15/13 Credit Suisse (USA), Inc. 5.00% 3,164,704 0.25%
10,000,000 5/2/14 JPMorgan Chase & Co. 1.06% 10,073,010 0.80%7,500,000 1/9/14 Morgan Stanley 0.65% 7,458,480 0.59%4,750,000 2/7/14 The Goldman Sachs Group, Inc. 1.31% 4,773,300 0.38%
300,000 6/14/13 U.S. Bancorp 2.00% 302,448 0.02%2,650,000 10/30/13 U.S. Bancorp 1.13% 2,672,210 0.21%4,050,000 8/12/13 UBS AG 2.25% 4,123,927 0.33%1,500,000 8/1/13 Wachovia 5.70% 1,582,385 0.13%3,800,000 5/1/13 Wachovia 5.50% 3,898,008 0.31%
250,000 5/1/13 Wachovia 2.08% 252,321 0.02%Beverages
5,000,000 3/26/13 Anheuser-Busch InBev Worldwide Inc. 1.04% 5,009,929 0.40%2,350,000 1/27/14 Anheuser-Busch InBev Worldwide Inc. 0.86% 2,366,222 0.19%4,000,000 7/14/14 Anheuser-Busch InBev Worldwide Inc. 0.70% 4,021,288 0.32%6,101,000 8/15/13 Coca-Cola Enterprises, Inc. 5.00% 6,390,536 0.51%
Chemical2,725,000 12/1/14 Gilead Sciences, Inc. 2.40% 2,815,734 0.22%
Computers2,800,000 5/24/13 Hewlett-Packard Company 0.59% 2,793,550 0.22%4,500,000 5/30/14 Hewlett-Packard Company 0.71% 4,413,140 0.35%3,850,000 9/19/14 Hewlett-Packard Company 1.86% 3,817,278 0.30%
Diversified Financial Services4,500,000 4/8/14 American Honda Finance Corp. 0.47% 4,503,921 0.36%2,075,000 5/8/14 American Honda Finance Corp. 0.76% 2,086,053 0.17%3,750,000 8/11/15 American Honda Finance Corp. 1.00% 3,782,557 0.30%6,335,000 5/24/13 BlackRock, Inc. 0.61% 6,345,861 0.50%2,510,000 4/5/13 Caterpillar Financial Services Corporation 2.00% 2,533,229 0.20%1,600,000 4/1/14 Caterpillar Financial Services Corporation 0.65% 1,608,735 0.13%
250,000 2/9/15 Caterpillar Financial Services Corporation 0.66% 251,331 0.02%4,800,000 4/7/14 General Electric Capital Corporation 0.98% 4,836,876 0.38%
157,000 1/15/13 John Deere Capital Corporation 5.10% 160,923 0.01%2,200,000 4/25/14 John Deere Capital Corporation 0.47% 2,205,038 0.17%
800,000 10/8/14 John Deere Capital Corporation 0.44% 801,084 0.06%3,714,000 9/27/13 MassMutual Global Funding II 0.81% 3,728,241 0.29%6,517,000 4/5/13 PACCAR Financial Corp. 0.67% 6,527,764 0.52%5,000,000 4/14/14 SSIF Nevada, LP 1.04% 5,039,277 0.40%

The accompanying notes are an integral part of these consolidated financial statements. F-13
Futures Portfolio Fund, Limited Partnership Consolidated Condensed Schedule of Investments (continued)
December 31, 2012
Description Fair Value
% of Partners'
Capital (Net Asset Value)
U.S . Corporate Notes (continued)Face Value Maturity Date Name Yield 1
Diversified Financial Services (continued)300,000$ 10/11/13 Toyota Motor Credit Corporation 0.80% 301,570$ 0.02%
3,000,000 1/17/14 Toyota Motor Credit Corporation 0.73% 3,015,242 0.24%3,000,000 1/27/14 Toyota Motor Credit Corporation 0.48% 3,005,716 0.24%8,450,000 2/17/15 Toyota Motor Credit Corporation 1.00% 8,538,549 0.68%
Energy750,000 8/16/13 Appalachian Power Company 0.69% 751,619 0.06%
1,388,000 3/1/13 Columbus Southern Power Company 5.50% 1,424,464 0.11%1,000,000 6/1/13 Northeast Utilities 5.65% 1,025,498 0.08%4,275,000 12/13/13 Occidental Petroleum Corporation 1.45% 4,322,898 0.34%2,300,000 4/15/13 PSEG Power LLC 2.50% 2,325,412 0.18%
Food2,267,000 8/15/13 General Mills, Inc. 5.25% 2,378,011 0.19%1,036,000 3/6/13 Kellogg Company 4.25% 1,056,936 0.08%6,000,000 6/4/15 Kraft Foods Group, Inc. 1.63% 6,113,689 0.48%
Healthcare7,743,000 3/1/14 Roche Holdings, Inc. 5.00% 8,263,053 0.65%
Household Products4,250,000 8/15/14 Procter & Gamble Company 0.70% 4,288,514 0.34%
Insurance9,750,000 2/11/13 Berkshire Hathaway 0.74% 9,767,035 0.77%1,980,000 1/10/14 Berkshire Hathaway 0.68% 1,989,617 0.16%3,650,000 5/8/13 Jackson National Life 5.38% 3,741,729 0.30%6,000,000 12/12/13 MetLife Global Funding I 0.71% 6,018,316 0.48%
300,000 4/4/14 MetLife Institutional Funding II 1.25% 303,479 0.02%4,024,000 1/25/13 Monumental Global Funding III 0.49% 4,028,125 0.32%2,270,000 4/22/13 Monumental Global Funding III 5.50% 2,326,391 0.18%3,250,000 5/9/13 New York Life 4.65% 3,317,303 0.26%4,610,000 4/15/13 Pacific Life 5.15% 4,721,379 0.37%1,700,000 9/27/13 Pricoa Global Funding I 0.51% 1,701,040 0.13%2,700,000 4/24/13 Principal Life 5.30% 2,765,261 0.22%
725,000 3/15/13 Travelers Companies, Inc. 5.00% 742,732 0.06%Internet
3,000,000 5/19/14 Google Inc. 1.25% 3,041,444 0.24%Machinery
3,420,000 5/21/13 Caterpillar Inc. 0.48% 3,425,443 0.27%Manufacturing
9,035,000 6/21/13 Danaher Corporation 0.56% 9,045,139 0.72%3,750,000 10/9/15 General Electric Company 0.85% 3,770,437 0.30%
Media2,400,000 3/15/13 Comcast Corporation 8.38% 2,497,029 0.20%2,900,000 4/30/15 NBCUniversal Media, LLC 3.65% 3,103,512 0.25%3,700,000 12/1/14 The Walt Disney Company 0.88% 3,733,464 0.30%2,200,000 12/1/15 The Walt Disney Company 0.45% 2,190,041 0.17%1,100,000 7/15/13 Thomson Reuters 5.95% 1,161,117 0.09%2,200,000 7/1/13 Time Warner Cable Inc. 6.20% 2,328,588 0.18%

The accompanying notes are an integral part of these consolidated financial statements. F-14
Futures Portfolio Fund, Limited Partnership Consolidated Condensed Schedule of Investments (continued)
December 31, 2012
Description Fair Value
% of Partners'
Capital (Net Asset Value)
U.S . Corporate Notes (continued)Face Value Maturity Date Name Yield 1
Pharmaceuticals5,150,000$ 11/6/15 AbbVie Inc. 1.07% 5,218,139$ 0.41%
975,000 2/12/15 Express Scripts Holding Company 2.10% 1,001,084 0.08%2,350,000 3/1/13 McKesson Corporation 5.25% 2,408,630 0.19%4,275,000 2/10/14 Novartis Capital Corporation 4.13% 4,515,238 0.36%
Retail3,775,000 7/18/14 Target Corporation 0.49% 3,790,019 0.30%2,200,000 8/1/13 Walgreen Co. 4.88% 2,298,959 0.18%6,500,000 3/13/14 Walgreen Co. 0.81% 6,511,837 0.52%4,500,000 2/3/14 Wal-Mart Stores, Inc. 3.00% 4,687,331 0.37%4,775,000 4/15/14 Wal-Mart Stores, Inc. 1.63% 4,870,366 0.39%
Semiconductor4,275,000 5/15/13 Texas Instruments 0.49% 4,282,125 0.34%
Telecommunication6,550,000 2/13/15 AT&T Inc. 0.88% 6,602,689 0.52%2,250,000 3/14/14 Cisco Systems, Inc. 0.56% 2,256,759 0.18%5,700,000 3/28/14 Verizon Communications Inc. 0.92% 5,734,323 0.45%
Transportation1,000,000 3/1/13 Ryder System, Inc. 6.00% 1,027,594 0.08%9,424,000 1/15/13 United Parcel Service, Inc. 4.50% 9,633,014 0.76%
Total U.S. corporate notes (cost: $347,870,863) 346,154,430 27.39%
Foreign Corporate NotesFace Value Maturity Date Name Yield 1
Automotive3,000,000$ 3/21/14 Volkswagen NV 1.06% 3,016,955 0.24%5,870,000 4/1/14 Volkswagen NV 0.97% 5,903,892 0.47%
Bank3,300,000 6/28/13 Bank of Montreal 2.13% 3,328,572 0.26%2,000,000 1/23/13 Barclays Bank PLC 2.50% 2,024,405 0.16%5,000,000 4/14/14 Danske Bank A/S 1.39% 4,934,627 0.39%2,300,000 1/18/13 HSBC Bank PLC 0.72% 2,303,895 0.18%4,150,000 5/15/13 HSBC Bank PLC 0.74% 4,159,770 0.33%3,200,000 8/12/13 HSBC Bank PLC 1.63% 3,242,478 0.26%
400,000 1/17/14 HSBC Bank PLC 1.13% 403,715 0.03%9,000,000 3/15/13 ING Bank N.V. 1.36% 9,018,614 0.71%1,000,000 6/9/14 ING Bank N.V. 1.71% 1,010,429 0.08%5,000,000 6/17/13 KfW Bankengruppe 0.22% 5,000,646 0.40%1,500,000 1/8/13 National Australia Bank 2.50% 1,518,397 0.12%5,000,000 4/11/14 National Australia Bank 1.07% 5,043,164 0.40%5,000,000 2/4/13 Rabobank Nederland 0.46% 5,003,405 0.40%6,660,000 7/26/13 Toronto-Dominion Bank 0.49% 6,671,494 0.53%5,000,000 3/31/14 Westpac Banking Corp. 1.04% 5,031,637 0.40%

The accompanying notes are an integral part of these consolidated financial statements. F-15
Futures Portfolio Fund, Limited Partnership Consolidated Condensed Schedule of Investments (continued)
December 31, 2012
Description Fair Value
% of Partners'
Capital (Net Asset Value)
Foreign Corporate Notes (continued)Face Value Maturity Date Name Yield 1
Chemical1,000,000$ 3/1/13 Potash Corp. of Saskatchewan 4.88% 1,023,377$ 0.08%
Energy8,250,000 11/7/13 BP Capital Markets P.L.C. 5.25% 8,649,744 0.68%8,600,000 11/14/14 Canadian Natural Resources Ltd 1.45% 8,739,113 0.69%1,076,000 7/15/13 Petro-Canada 4.00% 1,113,435 0.09%8,646,000 3/25/13 Shell 1.88% 8,720,082 0.69%
Manufacturing8,000,000 6/16/14 Eaton Corporation 0.64% 7,991,462 0.63%
Multi-national4,750,000 8/1/13 International Finance Corp. 0.33% 4,760,818 0.38%
Pharmaceutical8,065,000 3/28/13 Sanofi 0.51% 8,071,074 0.64%4,280,000 3/28/14 Sanofi 0.62% 4,296,280 0.34%5,950,000 3/17/15 Takeda Pharmaceutical Co Ltd 1.03% 5,991,129 0.47%9,450,000 3/21/14 Teva Pharmaceutical 0.81% 9,489,970 0.75%
Total foreign corporate notes (cost: $136,787,164) 136,462,579 10.80%
Total corporate notes (cost: $484,658,027) 482,617,009 38.19%Total investments in securities (cost: $702,866,469) 700,338,316$ 55.42%
CERTIFICATES OF DEPOSITU.S. Certificates of Deposit
Face Value Maturity Date Name Yield 1
Banks2,250,000$ 1/28/13 Banco del Estado de Chile (NY) 0.60% 2,256,324$ 0.18%2,000,000 8/15/13 Bank of Montreal (Chicago) 0.51% 2,004,552 0.16%2,250,000 10/3/13 Bank of Montreal (Chicago) 0.81% 2,261,955 0.18%7,500,000 2/11/13 Bank of Tokyo-Mitsubishi UFJ, Ltd. 0.49% 7,516,420 0.59%2,500,000 4/12/13 Bank of Tokyo-Mitsubishi UFJ, Ltd. 0.83% 2,519,034 0.20%3,000,000 9/27/13 Barclays Bank PLC (NY) 0.94% 3,013,682 0.24%1,600,000 11/14/13 Barclays Bank PLC (NY) 0.81% 1,602,380 0.13%3,750,000 7/26/13 BB&T 0.48% 3,762,925 0.30%2,950,000 7/25/13 Credit Suisse (NY) 0.82% 2,954,218 0.23%2,975,000 3/14/13 Deutsche Bank (NY) 1.06% 3,005,338 0.24%3,700,000 10/16/13 Deutsche Bank (NY) 0.75% 3,708,485 0.29%2,000,000 3/1/13 Mizuho Corporate Bank, Ltd. (NY) 0.46% 2,003,734 0.16%2,700,000 2/8/13 Norinchukin Bank (NY) 0.52% 2,706,307 0.21%4,500,000 4/1/13 Norinchukin Bank (NY) 0.43% 4,506,205 0.36%
250,000 3/1/13 PNC Bank 0.41% 250,164 0.02%250,000 3/15/13 Royal Bank of Canada (NY) 2.25% 252,701 0.02%
1,500,000 7/30/13 Royal Bank of Canada (NY) 0.36% 1,501,102 0.12%4,600,000 9/3/13 Royal Bank of Canada (NY) 0.51% 4,607,145 0.36%4,300,000 1/14/13 Standard Chartered Bank 0.57% 4,311,952 0.34%
Total U.S. certificates of deposit (cost: $54,582,427) 54,744,623 4.33%

The accompanying notes are an integral part of these consolidated financial statements. F-16
Futures Portfolio Fund, Limited Partnership Consolidated Condensed Schedule of Investments (continued)
December 31, 2012
Description Fair Value
% of Partners'
Capital (Net Asset Value)
Foreign Certificates of DepositFace Value Maturity Date Name Yield 1
Banks2,000,000$ 2/10/14 Bank of Nova Scotia 0.81% 2,008,124$ 0.16%2,050,000 4/9/13 National Australia Bank 0.43% 2,053,020 0.16%2,250,000 4/11/13 Sumitomo Mitsui Bank 0.80% 2,266,513 0.18%5,000,000 5/10/13 Sumitomo Mitsui Bank 0.79% 5,034,435 0.40%2,000,000 10/22/13 Sumitomo Mitsui Bank 0.60% 2,004,647 0.16%
Total foreign certificates of deposit (cost: $13,300,000) 13,366,739 1.06%
Total certificates of deposit (cost: $67,882,427) 68,111,362$ 5.39%
OPEN FUTURES CONTRACTSLong U.S . Futures Contracts
Agricultural commodities (2,448,733)$ (0.19)%Currencies (2,154,771) (0.17)%Energy 1,606,954 0.13%Equity indices 943,102 0.07%Interest rate instruments (969,809) (0.08)%Metals 523,562 0.04%Single stock futures 65,673 0.01%
Net unrealized loss on open long U.S. futures contracts (2,434,022) (0.19)%
Short U.S . Futures ContractsAgricultural commodities 4,589,873 0.37%Currencies 4,839,647 0.38%Energy (960,037) (0.08)%Equity indices (857,247) (0.06)%Interest rate instruments (1,540,849) (0.12)%Metals (5,401,528) (0.43)%Single stock futures 28,887 0.00%
Net unrealized gain on open short U.S. futures contracts 698,746 0.06%
Total U.S. Futures Contracts - Net unrealized loss on open U.S. futures contracts (1,735,276) (0.14)%
Long Foreign Futures ContractsAgricultural commodities (153,049) (0.01)%Currencies 1,672,733 0.13%Energy 157,050 0.01%Equity indices 6,439,003 0.51%Interest rate instruments 7,051,964 0.56%Metals 131,886 0.01%
Net unrealized gain on open long foreign futures contracts 15,299,587 1.21%

The accompanying notes are an integral part of these consolidated financial statements. F-17
Futures Portfolio Fund, Limited Partnership Consolidated Condensed Schedule of Investments (continued)
December 31, 2012
1 Represents the annualized yield at date of purchase for discount securities, the stated coupon rate for coupon-bearing securities, or the stated interest rate for certificates of deposit.
No individual futures or forward currency contract position constituted one percent or greater of partners’ capital (net asset value). Accordingly, the number of contracts and expiration dates are not presented.
Description Fair Value
% of Partners'
Capital (Net Asset Value)
Short Foreign Futures ContractsAgricultural commodities 135,344$ 0.01%Currencies 621,593 0.05%Energy 153,137 0.01%Equity indices (2,210,671) (0.17)%Interest rate instruments (145,741) (0.01)%
Net unrealized loss on open short foreign futures contracts (1,446,338) (0.11)%
Total foreign futures contracts - net unrealized gain on open foreign futures contracts 13,853,249 1.10%
Net unrealized gain on open futures contracts 12,117,973$ 0.96%
OPEN FORWARD CURRENCY CONTRACTSU.S. Forward Currency Contracts
Long 1,681,416$ 0.14%Short 2,815,763 0.22%
Net unrealized gain on open U.S. forward currency contracts 4,497,179 0.36%
Foreign Forward Currency ContractsLong 550,729 0.04%Short 578,487 0.05%
Net unrealized gain on open foreign forward currency contracts 1,129,216 0.09%
Net unrealized gain on open forward currency contracts 5,626,395$ 0.45%

The accompanying notes are an integral part of these consolidated financial statements. F-18
Futures Portfolio Fund, Limited Partnership Consolidated Statements of Operations
Years Ended December 31, 2013, 2012 and 2011
2013 2012 2011 Trading Gain (Loss) from Futures and Forwards
Net realized gain (loss) $ 4,337,000 $ 5,921,868 $ (19,473,968)Net change in unrealized gain (loss) 20,908,815 (20,940,649) (22,690,405)Brokerage commissions and trading expenses (4,142,902) (5,325,660) (4,371,804)
Net gain (loss) from futures and forwards trading 21,102,913 (20,344,441) (46,536,177)
Net Investment Loss
Income (loss) Interest income 9,881,356 14,949,610 11,686,695 Net realized and change in unrealized gain (loss) on securities and certificates of deposit
(5,227,361)
604,877
(14,508,604)
Total income (loss) 4,653,995 15,554,487 (2,821,909)Expenses
Trading Advisor management fees 16,692,370 21,972,275 23,433,566 Trading Advisor incentive fees 550,930 9,265,699 9,895,806 Cash Manager fees 821,125 967,194 851,317 General Partner management and performance fees
16,673,886 23,063,055 26,123,720
General Partner 1% allocation (283,366) (847,505) (1,356,695)Selling Agent and broker dealer servicing fees – General Partner
14,343,627
18,152,168
19,182,712
Administrative expenses – General Partner 5,011,567 6,540,116 6,824,331 Total expenses 53,810,139 79,113,002 84,954,757 Net investment loss (49,156,144) (63,558,515) (87,776,666)
Net Loss $ (28,053,231) $ (83,902,956) $ (134,312,843)
Per Share Data by Class of Units Class A Units Class B Units 2013 2012 2011 2013 2012 2011
Decrease in net asset value per unit for the year $ (114.32) $ (298.62) $ (458.39)
$ (55.38)
$ (302.18)
$ (503.38)
Net loss per unit $ (129.83) $ (297.67) $ (468.10) $ (99.50) $ (298.54) $ (512.15) (based on weighted average number of units outstanding during the year)
Weighted average number of units outstanding 159,208.4586 187,234.0655
186,655.9584
73,258.8516
93,959.2854
91,650.8857
Class I Units 2013 2012 2011
Decrease in net asset value per unit for the year $ (2.33) $ (87.25) $ --
Net loss per unit $ (18.46) $ (86.70) $ -- (based on weighted average number of units outstanding during the year)
Weighted average number of units outstanding 5,107.1020 1,369.3761

The accompanying notes are an integral part of these consolidated financial statements. F-19
Futures Portfolio Fund, Limited Partnership Consolidated Statements of Cash Flows
Years Ended December 31, 2013, 2012 and 2011
2013 2012 2011 Cash flows from operating activities
Net loss $ (28,053,231) $ (83,902,956) $ (134,312,843)Adjustments to reconcile net loss to net cash provided by (used in)
operating activities
Net change in unrealized (gain) loss from futures and forwards
trading (20,908,815)
20,940,649 22,690,405 Purchases of securities and certificates of deposit (1,442,002,615) (2,224,707,216) (2,717,763,460)Proceeds from disposition of securities and certificates of deposit 1,631,677,633 2,548,622,673 2,289,037,651 Net realized and change in unrealized (gain) loss on securities and certificates of deposit 5,227,361
(604,877) 14,508,604
Changes in Trading Advisor management fees payable 445,166 6,339 (205,455)Trading Advisor incentive fees payable 177,898 -- (13,050,625)Commissions and other trading fees payable on open contracts (133,511) 76,104 60,594 Cash Manager fees payable (142,638) (57,487) 364,930 General Partner management and performance fees payable (490,402) (563,420) 131,891 General Partner 1% allocation receivable/payable 564,139 509,190 (2,374,232)Selling Agent fees payable – General Partner (364,755) (204,224) 49,121 Administrative expenses payable – General Partner (146,141) (85,531) 44,474
Net cash provided by (used in) operating activities 145,850,089 260,029,244 (540,818,945)
Cash flows from financing activities Subscriptions 62,230,923 128,390,810 323,789,875 Subscriptions received in advance 2,399,374 9,060,642 15,876,320 Redemptions (431,734,922) (260,111,011) (121,738,957)
Net cash provided by (used in) financing activities (367,104,625) (122,659,559) 217,927,238
Net increase (decrease) in cash and cash equivalents (221,254,536) 137,369,685 (322,891,707)Cash and cash equivalents, beginning of year 533,216,653 395,846,968 718,738,675 Cash and cash equivalents, end of year $ 311,962,117 $ 533,216,653 $ 395,846,968
End of year cash and cash equivalents consists of
Cash in broker trading accounts $ 289,217,101 $ 509,692,323 $ 371,356,278 Cash and cash equivalents 22,745,016 23,524,330 24,490,690
Total end of year cash and cash equivalents $ 311,962,117 $ 533,216,653 $ 395,846,968
Supplemental disclosure of cash flow information Prior year redemptions paid $ 41,157,564 $ 22,127,237 $ 11,807,236 Prior year subscriptions received in advance $ 9,060,642 $ 15,876,320 $ 23,610,336
Supplemental schedule of non-cash financing activities
Redemptions payable $ 36,130,211 $ 41,157,564 $ 22,127,237

The accompanying notes are an integral part of these consolidated financial statements. F-20
Futures Portfolio Fund, Limited Partnership Consolidated Statements of Changes in Partners’ Capital (Net Asset Value)
Years Ended December 31, 2013, 2012 and 2011
Class A Interests Class B Interests Class I Interests Units Amount Units Amount Units Amount Total Balance at December 31, 2010 172,138.6872 $ 858,255,331 81,701.8729 $ 543,372,363 -- $ -- $ 1,401,627,694 Net loss (87,373,529) (46,939,314) -- (134,312,843) Subscriptions 40,067.8247 192,617,898 24,019.5573 154,782,313 -- -- 347,400,211 Redemptions (17,269.7094) (80,670,341) (8,114.4415) (51,388,617) -- -- (132,058,958) Transfers (2,296.3874) (10,659,958) 1,702.9003 10,659,958 -- -- -- Balance at December 31, 2011 192,640.4151 $ 872,169,401 99,309.8890 $ 610,486,703 -- $ -- $ 1,482,656,104 Net loss (55,733,401) (28,050,832) (118,723) (83,902,956) Subscriptions 19,402.6294 87,181,985 9,224.0743 56,830,734 254.4114 254,411 144,267,130 Redemptions (32,608.1852) (144,543,605) (22,169.2158) (134,597,733) -- (279,141,338) Transfers (1,226.8713) (5,463,892) 545.6155 3,331,999 2,229.9294 2,131,893 -- Balance at December 31, 2012 178,207.9880 $ 753,610,488 86,910.3630 $ 508,000,871 2,484.3408 $ 2,267,581 $ 1,263,878,940 Net loss (20,670,026) (7,288,937) (94,268) (28,053,231) Subscriptions 10,050.4027 42,154,405 4,492.7783 26,097,015 3,305.6618 3,040,145 71,291,565 Redemptions (51,241.6356) (211,357,077) (37,455.7015) (214,393,808) (1,114.4090) (956,684) (426,707,569) Transfers (3,221.7139 (13,236,395) 2,299.0022 13,236,395 -- -- -- Balance at December 31, 2013 133,795.0412 $ 550,501,395 56,246.4420 $ 325,651,536 4,675.5936 $ 4,256,774 $ 880,409,705
Net Asset Value per Unit
Class A Class B Class I December 31, 2013 $ 4,114.51 $ 5,789.73 $ 910.42 December 31, 2012 $ 4,228.83 $ 5,845.11 $ 912.75 December 31, 2011 $ 4,527.45 $ 6,147.29 $ --

F-21
Futures Portfolio Fund, Limited Partnership Notes to Consolidated Financial Statements
1. Organization and Summary of Significant Accounting Policies Description of the Fund Futures Portfolio Fund, Limited Partnership (“Fund”) is a Maryland limited partnership, which operates as a commodity investment pool that commenced trading operations on January 2, 1990. The Fund issues units of limited partner interests (“Units”) in three classes, Class A, B and I, which represent units of fractional undivided beneficial interest in and ownership of the Fund. The Fund will automatically terminate on December 31, 2025, unless terminated earlier as provided in the Third Amended and Restated Limited Partnership Agreement (“Partnership Agreement”). The Fund uses commodity trading advisors to engage in the speculative trading of futures contracts, forward currency contracts and other financial instruments traded in the United States (“U.S.”) and internationally. The Fund is a registrant with the U.S. Securities and Exchange Commission (“SEC”) pursuant to the U.S. Securities Exchange Act of 1934, as amended (“1934 Act”). As a registrant, the Fund is subject to the regulations of the SEC and the disclosure requirements of the 1934 Act. As a commodity pool, the Fund is subject to the regulations of the U.S. Commodity Futures Trading Commission (“CFTC”), an agency of the U.S. Government, which regulates most aspects of the commodity futures industry; rules of the National Futures Association (“NFA”), an industry self-regulatory organization; rules of Financial Industry Regulatory Authority (“FINRA”), an industry self-regulatory organization; and the requirements of commodity exchanges where the Fund executes transactions. Additionally, the Fund is subject to the requirements of the futures brokers and interbank market makers through which the Fund trades. Steben & Company, Inc. (“General Partner”), is the general partner of the Fund and a Maryland corporation registered with the CFTC as a commodity pool operator and a commodities introducing broker, and is also registered with the SEC as a registered investment advisor and a broker dealer. The General Partner is a member of the NFA and FINRA. The General Partner manages all aspects of the Fund’s business and serves as one of the Fund’s selling agents. The three classes of Units in the Fund differ only in the fees applicable to each class. Class A Units are subject to a 2% per annum selling agent fee and class B Units are subject to a 0.2% per annum broker dealer servicing fee. Class I Units are subject to higher minimum investments requirements and lower General Partner Management Fees (0.75% per annum instead of 1.50% per annum) as well as a General Partner performance fee (7.5% of new profits, described more fully in Footnote 4). During 2011, the Fund made investments totaling $90 million in the Steben Institutional Fund LLC (“SIF”), whose manager was the General Partner. The Fund was the only member in SIF. Similar to the Fund, SIF used professional commodity trading advisors to engage in the speculative trading of futures and forward currency contracts traded in the U.S. and internationally. SIF traded within six major market sectors: agricultural commodities, currencies, energy, equity indices, interest rate instruments and metals. SIF commenced trading on March 1, 2011. SIF incurred trading advisor management and incentive fees, as well as reimbursed its manager for operating expenses incurred on its behalf. During 2012, the General Partner liquidated SIF, and all of the assets of SIF were transferred to the Fund by October 31, 2012. Significant Accounting Policies Accounting Principles The Fund’s consolidated financial statements are prepared in conformity with U.S. generally accepted accounting principles (“GAAP”). Consolidation The accompanying consolidated financial statements include the accounts of the Fund and SIF, for which the Fund is the sole member. All material intercompany accounts and transactions have been eliminated in consolidation. SIF was liquidated in 2012 and there was no consolidation in 2013.

F-22
Use of Estimates Preparing consolidated financial statements in conformity with GAAP requires management to make estimates and assumptions that affect the amounts reported in the consolidated financial statements and accompanying notes. Actual results could differ from those estimates. Revenue Recognition Futures, options on futures, forward currency contracts, investments in securities, and certificates of deposit are recorded on a trade date basis, and gains or losses are realized when contracts/positions are liquidated. Realized gains and losses on investments in securities and certificates of deposit are determined on a specific identification basis and are included in net realized and change in unrealized gain (loss) in the consolidated statements of operations. Unrealized gains and losses on open contracts (the difference between contract trade price and fair value) are reported in the consolidated statements of financial condition as net unrealized gain or loss, as there exists a right of offset of any unrealized gains or losses. The difference between cost and the fair value of open investments in securities and certificates of deposit is reflected as unrealized gain or loss on investments in securities and certificates of deposit. Any change in net unrealized gain or loss on from the preceding period is reported in the consolidated statements of operations. Interest income earned on investments in securities, certificates of deposit and other cash and cash equivalent balances is recorded on an accrual basis. Fair Value of Financial Instruments Financial instruments are recorded at fair value, the price that would be received to sell an asset or paid to transfer a liability in an orderly transaction between market participants. Assets and liabilities recorded at fair value are classified within the fair value hierarchy based upon the level of judgment associated with the inputs used to measure their value. The fair value hierarchy gives the highest priority to quoted prices in active markets for identical assets or liabilities (Level 1) and the lowest priority to unobservable inputs (Level 3). The three levels of the fair value hierarchy are described below: Level 1 – Fair value is based on unadjusted quoted prices for identical instruments in active markets. Financial instruments
utilizing Level 1 inputs include futures contracts, U.S. Treasury securities and money market funds. Level 2 – Fair value is based on quoted prices for similar instruments in active markets and inputs other than quoted prices
that are observable for the financial instrument, such as interest rates and yield curves that are observable at commonly quoted intervals using a market approach. Financial instruments utilizing Level 2 inputs include forward currency contracts, commercial paper, certificates of deposit, corporate notes and U.S. and foreign government sponsored enterprise notes.
Level 3 – Fair value is based on valuation techniques in which one or more significant inputs are unobservable. The Fund
has no financial instruments valued using Level 3 inputs. In certain cases, the inputs used to measure fair value may fall into different levels of the fair value hierarchy. In such cases, an instrument’s level within the fair value hierarchy is based on the lowest level of input that is significant to the fair value measurement. The Fund’s assessment of the significance of a particular input to the fair value measurement in its entirety requires judgment, and considers factors specific to the investment. The Fund assesses the classification of the instruments at each measurement date, and any transfers between levels are recognized on the actual date of the event or change in circumstances that caused the transfer in accordance with the Fund’s accounting policy regarding the recognition of transfers between levels of the fair value hierarchy. For the years ended December 31, 2013, 2012 and 2011, there were no such transfers between levels. A description of the valuation techniques applied to the Fund’s major categories of assets and liabilities measured at fair value on a recurring basis follows. U.S. Treasury securities are recorded at fair value based on bid and ask quotes for identical instruments. Commercial paper, certificates of deposit, corporate notes and U.S. and foreign government sponsored enterprise notes are recorded at fair value based on bid and ask quotes for similar, but not identical, instruments. Accordingly, U.S. Treasury securities are classified within Level 1, and commercial paper, certificate of deposits, corporate notes and U.S. and foreign government sponsored enterprise notes are classified within Level 2. The investment in a money market fund, included in cash and cash equivalents in the consolidated statements of financial condition, and futures contracts, all of which are exchange-traded, are valued using quoted market prices for identical assets and are classified within Level 1. The fair values of forward currency contracts are based upon third-party quoted dealer values on the interbank market and are classified within Level 2.

F-23
Cash and Cash Equivalents Cash and cash equivalents may include cash, funds held in money market accounts and short-term investments with maturities of three months or less at the date of acquisition and that are not held for sale in the normal course of business. The Fund maintains deposits with financial institutions in amounts that are in excess of federally insured limits; however, the Fund does not believe it is exposed to any significant credit risk. Brokerage Commissions and Trading Expenses Brokerage commissions and trading expenses include brokerage and other trading fees, and are charged to expense when contracts are opened and closed. Redemptions Payable Redemptions payable represent redemptions that meet the requirements of the Fund and have been approved by the General Partner prior to year end. These redemptions have been recorded using the year end net asset value per Unit. Income Taxes The Fund prepares calendar year U.S. and applicable state and local tax returns. The Fund is not subject to federal income taxes as each partner is individually liable for his or her allocable share of the Fund’s income, expenses and trading gains or losses. The Fund evaluates the tax positions taken or expected to be taken in the course of preparing the Fund’s tax returns to determine whether the tax positions are more-likely-than-not to be sustained when examined by the applicable tax authority. Tax positions not deemed to meet the more-likely-than-not threshold would be recorded as a tax benefit or expense and asset or liability in the current year. Management has determined there are no material uncertain income tax positions through December 31, 2013. With few exceptions, the Fund is no longer subject to U.S. federal, or state and local income tax examinations by tax authorities for years before 2010.
Foreign Currency Transactions The Fund has certain investments denominated in foreign currencies. The purchase and sale of investments, and income and expenses are translated at the rates of exchange prevailing on the respective dates of such transactions. The Fund does not isolate that portion of the results of operations resulting from changes in foreign exchange rates on investments from the fluctuations arising from changes in market prices of investments held. Such fluctuations are included with the net realized and change in unrealized gain or loss on such investments in the consolidated statements of operations. Reclassification Certain amounts in the 2012 and 2011 consolidated financial statements have been reclassified to conform to the 2013 presentation without affecting previously reported partners’ capital (net asset value). Recently Issued Accounting Pronouncement In November 2011, the Financial Accounting Standards Board (“FASB”) issued new guidance that requires an entity to disclose information about offsetting and related arrangements to enable users of its financial statements to understand the effect of those arrangements on its financial position. This guidance became effective for the Fund on January 1, 2013. The adoption of this guidance did not have a material impact on the Fund’s financial position or results of operations. 2. Fair Value Disclosures The Fund’s assets and liabilities, measured at fair value on a recurring basis, are summarized in the following tables by the type of inputs applicable to the fair value measurements:
At December 31, 2013
Level 1 Level 2 Total Equity in broker trading accounts: Net unrealized gain on open futures contracts* $ 37,958,108 $ -- $ 37,958,108 Net unrealized gain on open forward currency
contracts* -- 695,075 695,075 Cash and cash equivalents: Money market fund 6,338,530 -- 6,338,530 Investments in securities: U.S. Treasury securities* 88,102,079 -- 88,102,079 Commercial paper* -- 65,153,483 65,153,483

F-24
Corporate notes* -- 377,666,684 377,666,684 Certificates of deposit* -- 42,625,053 42,625,053 Total $ 132,398,717 $ 486,140,295 $ 618,539,012
*See the consolidated condensed schedule of investments for further description.
At December 31, 2012
Level 1 Level 2 Total Equity in broker trading accounts: Net unrealized gain on open futures contracts* $ 12,117,973 $ -- $ 12,117,973 Net unrealized gain on open forward currency
contracts* -- 5,626,395 5,626,395 Cash and cash equivalents: Money market fund 12,193,936 -- 12,193,936 Investments in securities: U.S. Treasury securities* 105,315,591 -- 105,315,591 U.S. government sponsored enterprise notes* -- 16,749,015 16,749,015 Commercial paper* -- 95,656,701 95,656,701 Corporate notes* -- 482,617,009 482,617,009 Certificates of deposit* -- 68,111,362 68,111,362 Total $ 129,627,500 $ 668,760,482 $ 798,387,982
*See the consolidated condensed schedule of investments for further description. There were no Level 3 holdings at December 31, 2013 and 2012, or during the years then ended. In addition to the financial instruments listed above, substantially all of the Fund’s other assets and liabilities are considered financial instruments and are reflected at fair value, or at carrying amounts that approximate fair value because of the short maturity of the instruments. 3. Derivative Instruments Disclosures The Fund’s derivative contracts are comprised of futures and forward currency contracts, none of which are designated as hedging instruments. At December 31, 2013 and 2012, the Fund’s derivative contracts had the following impact on the consolidated statements of financial condition:
December 31, 2013 Derivative Assets and Liabilities, at fair value
Consolidated Statements of Financial Condition Location
Gross Amounts of Recognized
Assets
Gross Amounts Offset in the Statements of
Financial Condition
Net Amount of Assets Presented in the Statements of
Financial Condition Equity in broker trading accounts Net unrealized gain on open futures contracts
Agricultural commodities $ 5,823,273 $ (1,905,881) $ 3,917,392 Currencies 8,479,775 (793,925) 7,685,850 Energy 1,961,940 (1,941,715) 20,225 Equity indices 25,256,880 (391,244) 24,865,636 Interest rate instruments 5,523,958 (5,895,183) (371,225) Metals 10,448,475 (9,156,794) 1,291,681 Single stock futures 617,785 (69,236) 548,549 Net unrealized gain on open futures contracts $58,112,086 $ (20,153,978) $ 37,958,108
Net unrealized gain on open forward currency contracts $ 5,818,188 $ (5,123,113) $ 695,075
At December 31, 2013, there were 64,196 open futures contracts and 2,271 open forward currency contracts. The Fund’s financial assets, derivative assets, and cash collateral held by counterparties at December 31, 2013 were:

F-25
Gross Amounts Not Offset in the Statements of Financial Condition
Counterparty
Net Amount of Assets in the Statements of
Financial Condition Financial
Instruments Cash Collateral
Received Net Amount JP Morgan Securities, LLC $ 11,027,627 $ -- $ -- $ 11,027,627 Newedge UK Financial Ltd 639,551 -- -- 639,551 Newedge USA, LLC 26,930,481 -- -- 26,930,481 UBS AG 55,524 -- -- 55,524 Total $ 38,653,183 $ -- $ -- $ 38,653,183
December 31, 2012 Derivative Assets and Liabilities, at fair value
Consolidated Statements of Financial Condition Location
Gross Amounts of Recognized
Assets
Gross Amounts Offset in the Statements of
Financial Condition
Net Amount of Assets Presented in the Statements of
Financial Condition
Equity in broker trading accounts Net unrealized gain on open futures contracts
Agricultural commodities $ 6,119,312 $ (3,995,877) $ 2,123,435 Currencies 10,634,972 (5,655,770) 4,979,202 Energy 4,377,815 (3,420,711) 957,104 Equity indices 12,433,423 (8,119,236) 4,314,187 Interest rate instruments 14,620,306 (10,224,741) 4,395,565 Metals 5,720,409 (10,466,489) (4,746,080) Single stock futures 197,149 (102,589) 94,560 Net unrealized gain on open futures contracts $ 54,103,386 $ (41,985,413) $ 12,117,973
Net unrealized gain on open forward currency contracts $ 13,170,988 $ (7,544,593) $ 5,626,395
At December 31, 2012, there were 125,947 open futures contracts and 2,428 open forward currency contracts. The Fund’s financial assets, derivative assets, and cash collateral held by counterparties at December 31, 2012 were:
Gross Amounts Not Offset in the Statements of Financial Condition
Counterparty
Net Amount of Assets in the Statements of
Financial Condition Financial
Instruments Cash Collateral
Received Net Amount JP Morgan Securities, LLC $ 603,604 $ -- $ -- $ 603,604 Newedge UK Financial Ltd 866,766 -- -- 866,766 Newedge USA, LLC 11,514,369 -- -- 11,514,369 UBS AG 4,759,629 -- -- 4,759,629 Total $ 17,744,368 $ -- $ -- $ 17,744,368 For the years ended December 31, 2013, 2012 and 2011, the Fund’s futures and forwards contracts had the following impact on the consolidated statements of operations:

F-26
2013 2012
Types of Exposure Net realized gain (loss)
Net change in unrealized
gain (loss) Net realized gain (loss)
Net change in unrealized gain (loss)
Futures contracts Agricultural commodities $ 321,517 $ 1,793,957 $ (25,357,049) $ 4,089,884 Currencies (967,139) 2,706,648 (11,828,618) (4,842,382) Energy (47,484,893) (936,879) (24,394,073) (6,450,552) Equity indices 109,640,028 20,551,449 33,424,360 2,010,678 Interest rate instruments (60,300,646) (4,766,790) 84,220,448 (18,400,910) Metals 13,269,933 6,037,761 (37,468,401) (2,777,222) Single stock futures 3,128,407 453,989 2,201,661 74,850 Total futures contracts 17,607,207 25,840,135 20,798,328 (26,295,654)
Forward currency contracts (13,877,094) (4,931,320) (15,172,716) 5,355,005
Total futures and forward currency contracts $ 3,730,113 $ 20,908,815 $ 5,625,612 $ (20,940,649) 2011
Types of Exposure Net realized gain (loss)
Net change in unrealized
gain (loss) Futures contracts
Agricultural commodities $ (34,695,326) $(15,033,956) Currencies (32,166,401) (10,135,727) Energy (25,551,459) (110,655) Equity indices (99,853,027) 775,456 Interest rate instruments 167,808,332 22,639,889 Metals 3,697,021 (12,549,362) Single stock futures (290,206) 11,894 Total futures contracts (21,051,066) (14,402,461)
Forward currency contracts 2,146,988 (8,287,944)
Total futures and forward currency contracts $ (18,904,078) $(22,690,405) For the years ended December 31, 2013, 2012 and 2011, the number of futures contracts closed was 1,228,562, 1,455,435 and 1,100,279, respectively, and the number of forward currency contracts closed was 42,952, 43,075 and 47,969, respectively. 4. General Partner At December 31, 2013, 2012 and 2011, and for the years then ended, the General Partner did not maintain a capital balance in the Fund; however, the beneficiary of the majority shareholder of the General Partner had the following investment:
2013 2012 2011 Class of Units I I B Units Owned 254.4114 254.4114 39.6245 Value of Units $ 231,622 $ 232,214 $ 243,583
During 2012, the beneficiary of the majority shareholder exchanged Class B Units for Class I Units.

F-27
The General Partner earns the following compensation:
General Partner Management Fee – the Fund incurs a monthly fee on Class A and Class B Units equal to 1/12th of 1.5% of the month-end net asset value of the Class A and Class B Units, payable in arrears. Prior to June 1, 2012, the general partner management fee was 1.75% per annum. The Fund incurs a monthly fee on Class I Units equal to 1/12th of 0.75% of the month-end net asset value of the Class I Units, payable in arrears.
General Partner Performance Fee – the Fund incurs a monthly fee on Class I Units equal to 7.5% of new profits of the Class I Units calculated monthly. The general partner performance fee is payable quarterly in arrears.
Selling Agent Fees – the Class A Units incur a monthly fee equal to 1/12th of 2% of the month-end net asset value of the
Class A Units and such amounts are included in Selling Agent fees – General Partner in the consolidated statements of operations. The General Partner, in turn, pays the selling agent fee to the respective selling agents. If there is no designated selling agent or the General Partner was the selling agent, such portions of the selling agent fee are retained by the General Partner.
Broker Dealer Servicing Fees – the Class B Units incur a monthly fee equal to 1/12th of 0.2% of the month-end net asset
value of the Class B Units and such amounts are included in Selling Agent fees – General Partner in the consolidated statements of operations. The General Partner, in turn, pays the fee to the respective selling agents. If there is no designated selling agent or the General Partner was the selling agent, such portions of the broker dealer servicing fee are retained by the General Partner.
Administrative Expenses – the Fund incurs a monthly fee equal to 1/12th of 0.45% of the month-end net asset value of the fund, payable in arrears to the General Partner. The General Partner, in turn, pays the administrative expenses of the Fund. Administrative expenses include accounting, audit, legal, salary and administrative costs incurred by the General Partner relating to marketing and administration of the Fund; such as, salaries and commissions of General Partner marketing personnel, administrative employee salaries and related costs.
Pursuant to the terms of the Partnership Agreement, each year the General Partner receives from the Fund 1% of any net income earned by the Fund. Conversely, the General Partner pays to the Fund 1% of any net loss incurred by the Fund. Such amounts are reflected as General Partner 1% allocation receivable or payable in the consolidated statements of financial condition and as General Partner 1% allocation in the consolidated statements of operations. During 2011 and through September 2012, SIF incurred administrative fees of 1/12th of 0.15% of the month-end net asset value of SIF. The administrative fee was payable in arrears to the General Partner 5. Trading Advisors and Cash Managers The Fund has advisory agreements with various commodity trading advisors, pursuant to which the Fund incurs a monthly advisor management fee that ranges from 0% to 2% per annum of allocated net assets (as defined in each respective advisory agreement), paid monthly or quarterly in arrears. Additionally, the Fund incurs advisor incentive fees, payable quarterly in arrears, ranging from 10% to 30% of net new trading profits (as defined in each respective advisory agreement). Effective April 1, 2011, the Fund engaged J.P. Morgan Investment Management, Inc. and Principal Global Investors, LLC (collectively, the “Cash Managers”) to provide cash management services to the Fund. The Fund incurs monthly fees, payable in arrears to the Cash Managers, equal to approximately 1/12th of 0.11% of the investments in securities and certificates of deposit. 6. Deposits with Brokers To meet margin requirements, the Fund deposits funds with brokers, subject to CFTC regulations and various exchange and broker requirements. The Fund earns interest income on its assets deposited with brokers. At December 31, 2013 and 2012, the Fund had margin deposit requirements of $130,308,150 and $250,611,119, respectively. 7. Administrative Expenses The Fund incurs a monthly administrative fee equal to 1/12th of 0.45% of the Fund’s month-end asset value. Administrative expenses include accounting, audit, legal, salary and administrative costs incurred by the General Partner relating to marketing and administration of the Fund; such as, salaries and commissions of General Partner marketing personnel, administrative

F-28
employee salaries and related costs. For the years ended December 31, 2013, 2012 and 2011, the Fund incurred administrative fees were $5,011,567, $6,540,116 and $6,824,331, respectively. At December 31, 2013 and 2012, $344,649 and $490,790, respectively, were payable to the General Partner for administrative expenses. Such amounts are presented as administrative expenses payable – General Partner in the consolidated statements of financial condition. 8. Subscriptions, Distributions and Redemptions Investments in the Fund are made by subscription agreement and must be received within five business days of the end of the month, subject to acceptance by the General Partner. The minimum investment is $10,000 for Class A and B units and $2,000,000 for Class I units. Units are sold at the respective net asset value per unit for Class A, B or I interests as of the close of business on the last day of the month in which the subscription is accepted. Investors whose subscriptions are accepted are admitted as limited partners as of the beginning of the month following the month in which their subscriptions were accepted. At December 31, 2013 and 2012, the Fund received advance subscriptions of $2,399,374 and $9,060,642, respectively, which were recognized as subscriptions to the Fund or returned, if applicable, subsequent to period-end. The Fund is not required to make distributions, but may do so at the sole discretion of the General Partner. A limited partner may request and receive redemption of Class A, Class B or Class I Units owned at the end of any month, subject to five business days’ prior written notice to the General Partner, and in certain circumstances, restrictions in the Partnership Agreement. The General Partner may require a limited partner to redeem from the Fund if the General Partner deems the redemption (a) necessary to prevent or correct the occurrence of a non-exempt prohibited transaction under the Employee Retirement Income Security Act of 1974, as amended, or the Internal Revenue Code of 1986, as amended, (b) beneficial to the Fund, or (c) necessary to comply with applicable government or other self-regulatory organization regulations. 9. Trading Activities and Related Risks The Fund engages in the speculative trading of futures, options and over-the-counter contracts, including forward currency contracts traded in the U.S. and internationally. Trading in derivatives exposes the Fund to both market risk, the risk arising from a change in the fair value of a contract, and credit risk, the risk of failure by another party to perform according to the terms of a contract. Purchase and sale of futures contracts requires margin deposits with the futures brokers. Additional deposits may be necessary for any loss of contract value. The Commodity Exchange Act (“CEAct”) requires a broker to segregate all customer transactions and assets from such broker’s proprietary activities. A customer’s cash and other property (for example, U.S. Treasury securities) deposited with a broker are considered commingled with all other customer funds subject to the broker’s segregation requirements. In the event of a broker’s insolvency, recovery may be limited to a pro rata share of segregated funds available. It is possible that the recovered amount could be less than (or none of) the total cash and other property deposited. The Fund uses Newedge USA, LLC and JP Morgan Securities, LLC as its futures brokers and Newedge UK Financial Limited and UBG AG as its forward currency counterparties. For futures contracts, risks arise from changes in the fair value of the contracts. Theoretically, the Fund is exposed to a market risk equal to the value of futures and forward currency contracts purchased, and unlimited liability on such contracts sold short. In addition to market risk, upon entering into commodity interest contracts there is a credit risk that a counterparty will not be able to meet its obligations to the Fund. The counterparty for futures and options on futures contracts traded in the U.S. and on most non-U.S. futures exchanges is the clearinghouse associated with such exchanges. In general, clearinghouses are backed by the corporate members of the clearinghouse who are required to share any financial burden resulting from the non-performance by one of their members and, as such, should significantly reduce this credit risk. In cases where the clearinghouse is not backed by the clearing members, like some non-U.S. exchanges, it is normally backed by a consortium of banks or other financial institutions. In the case of forward currency contracts, which are traded on the interbank or other institutional market rather than on exchanges, the counterparty is generally a single bank or other financial institution, rather than a clearinghouse backed by a group of financial institutions; thus there likely will be greater counterparty credit risk. While the Fund trades only with those

F-29
counterparties that it believes to be creditworthy, there can be no assurance that any clearing member, clearinghouse or other counterparty will be able to meet its obligations to the Fund. The Fund trades forward currency contracts in unregulated markets between principals and assumes the risk of loss from counterparty non-performance. Accordingly, the risks associated with forward currency contracts are generally greater than those associated with exchange-traded contracts because of the greater risk of counterparty default. Additionally, the trading of forward currency contracts typically involves delayed cash settlement. The Fund has a portion of its assets on deposit with interbank market makers and other financial institutions in connection with its trading of forward currency contracts and its cash management activities. In the event of an interbank market maker’s or financial institution’s insolvency, recovery of Fund assets on deposit may be limited to account insurance or other protection afforded such deposits. The Cash Managers manage the Fund’s cash and excess margin through investments in fixed income instruments, pursuant to investment parameters established by the General Partner. Fluctuations in prevailing interest rates could cause mark-to-market losses on the Fund’s fixed income instruments. Prior to April 2011, the Fund used UBS Financial Services, Inc. and Bank of America Merrill Lynch as its cash management securities brokers for the investment of some excess margin amounts into short-term fixed income instruments. Through its investments in debt securities and certificates of deposit, the Fund has exposure to U.S. and foreign enterprises. The following table presents the exposure at December 31, 2013.
Country or RegionU.S . Treasury
SecuritiesCommercial
Paper Corporate NotesCertificates of
Deposit Total
% of Partners'
Capital (Net Asset Value)
United States 88,102,079$ 31,009,077$ 250,957,531$ 29,100,934$ 399,169,621$ 45.35%Netherlands - - 40,422,010 - 40,422,010 4.59%Canada - 2,099,115 22,978,564 4,005,167 29,082,846 3.30%Great Britain - 9,196,934 9,424,171 - 18,621,105 2.12%Japan - 4,714,655 10,240,862 - 14,955,517 1.70%Australia - 2,599,946 9,056,601 - 11,656,547 1.32%France - 5,486,017 3,387,040 - 8,873,057 1.01%Netherland Antilles - - 8,513,655 - 8,513,655 0.97%Switzerland - - 2,313,791 4,505,939 6,819,730 0.77%Sweden - 3,899,026 615,818 2,001,859 6,516,703 0.74%Mexico - - 5,928,963 - 5,928,963 0.67%Denmark - - 5,020,114 - 5,020,114 0.57%Singapore - 4,899,313 - - 4,899,313 0.56%British Virgin Islands - - 4,802,760 - 4,802,760 0.55%Multi-national - - 4,004,804 - 4,004,804 0.45%China - - - 3,011,154 3,011,154 0.34%Norway - 1,249,400 - - 1,249,400 0.14% Total 88,102,079$ 65,153,483$ 377,666,684$ 42,625,053$ 573,547,299$ 65.15%

F-30
The following table presents the exposure at December 31, 2012.
10. Indemnifications In the normal course of business, the Fund may enter into contracts and agreements that contain a variety of representations and warranties, and which provide general indemnifications. The Fund’s maximum exposure under these arrangements cannot be estimated. However, the Fund believes that it is unlikely it will have to make material payments under these arrangements and has not recorded any contingent liability in the consolidated financial statements for such indemnifications. 11. Financial Highlights The following information presents per unit operating performance data and other ratios for the years ended December 31, 2013, 2012 and 2011, assuming the unit was outstanding throughout the entire year: 2013 2012 Class A Class B Class I Class A Class B Class I Per Unit Operating Performance Net asset value per unit, beginning of
year/period $ 4,228.83 $ 5,845.11 $ 912.75 $ 4,527.45 $ 6,147.29 $ 1,000.00Loss from operations Gain (loss) from futures and forwards trading (1) 102.43 142.80 22.88 (64.54) (92.35) (76.45)Net investment loss (1) (216.75) (198.18) (25.21) (234.08) (209.83) (10.80)Total loss from operations (114.32) (55.38) (2.33) (298.62) (302.18) (87.25)
Net asset value per unit, end of year $ 4,114.51 $ 5,789.73 $ 910.42 $ 4,228.83 $ 5,845.11 $ 912.75
Total return (2.70)% (0.95)% (0.25)% (6.60)% (4.92)% (8.73)% Other Financial Ratios Ratios to average net asset value
Expenses prior to Trading Advisor incentive fees and General Partner 1% allocation (2) 5.63% 3.82% 3.19% 5.75% 3.92% 2.58%
Trading Advisor incentive fees 0.05% 0.05% 0.06% 0.66% 0.66% 0.00% General Partner 1% allocation (0.03)% (0.02)% (0.02)% (0.07)% (0.05)% (0.09)%
Total expenses 5.65% 3.85% 3.23% 6.34% 4.53% 1.41%
Net investment loss (2) (5.22)% (3.42)% (2.79)% (5.24)% (3.43)% (2.00)%
Country or RegionU.S. Treasury
Securities
Gov't Sponsored Enterprise
NotesCommercial
Paper Corporate NotesCertificates of
Deposit Total
% of Partners'
Capital (Net Asset Value)
United States 105,315,591$ 16,749,015$ 56,716,412$ 346,154,430$ 54,744,623$ 579,680,071$ 45.85%Netherlands - - - 32,673,377 - 32,673,377 2.59%Great Britain - - 11,545,640 20,784,007 - 32,329,647 2.56%Canada - - 4,199,589 20,875,991 2,008,124 27,083,704 2.14%Japan - - 2,899,522 5,991,129 9,305,595 18,196,246 1.44%Australia - - 3,997,360 11,593,198 2,053,020 17,643,578 1.40%France - - 3,899,974 12,367,354 - 16,267,328 1.29%Netherland Antilles - - - 9,489,970 - 9,489,970 0.75%Multinational - - 3,998,800 4,760,818 - 8,759,618 0.69%Ireland - - - 7,991,462 - 7,991,462 0.63%Singapore - - 5,299,611 - - 5,299,611 0.42%Germany - - - 5,000,646 - 5,000,646 0.40%Denmark - - - 4,934,627 - 4,934,627 0.39%Luxumberg - - 3,099,793 - - 3,099,793 0.25% Total 105,315,591$ 16,749,015$ 95,656,701$ 482,617,009$ 68,111,362$ 768,449,678$ 60.80%

F-31
2011 Class A Class B Class I Per Unit Operating Performance Net asset value per unit, beginning of year $ 4,985.84 $ 6,650.67 $ --
Loss from operations Loss from futures and forwards trading (1) (141.14) (191.76) -- Net investment loss (1) (317.25) (311.62) -- Total loss from operations (458.39) (503.38) --
Net asset value per unit, end of year $ 4,527.45 $ 6,147.29 $ --
Total return (9.19)% (7.57)% --% Other Financial Ratios Ratios to average net asset value
Expenses prior to Trading Advisor incentive fees and General Partner 1% allocation (2) 5.92%
4.09%
--%
Trading Advisor incentive fees 0.67% 0.67% --% General Partner 1% allocation (0.10)% (0.08)% --%
Total expenses 6.49% 4.68% --%
Net investment loss (2) (6.68)% (4.88)% --%
Total returns are calculated based on the change in value of a Class A, Class B or Class I Unit during the year. An individual partner’s total returns and ratios may vary from the above total returns and ratios based on the timing of subscriptions and redemptions. (1) The net investment loss per unit is calculated by dividing the net investment loss by the average number of Class A, Class B or Class I Units outstanding during the year/period. Gain (loss) from futures and forwards trading is a balancing amount necessary to reconcile the change in net asset value per unit with the other per unit information. Such balancing amount may differ from the calculation of gain (loss) from futures and forwards trading per unit due to the timing of trading gains and losses during the year relative to the number of units outstanding. (2) The net investment loss includes interest income and excludes net realized and change in unrealized gain (loss) from futures and forwards trading activities as shown in the consolidated statements of operations. The total amount is then reduced by all expenses, excluding brokerage commissions, which are included in net gain (loss) from futures and forwards trading in the consolidated statements of operations. The resulting amount is divided by the average net asset value for the year. 12. Subsequent Events From January 1, 2014 through February 28, 2014, there were $5,723,929 of contributions and $44,777,651 of redemptions from the Fund.

F-32
EXHIBIT 31.01
Certification in Accordance with Section 302 of the Sarbanes-Oxley Act of 2002
I, Kenneth E. Steben, certify that:
1. I have reviewed this annual report on Form 10-K of Futures Portfolio Fund, Limited Partnership;
2. Based on my knowledge, this report does not contain any untrue statement of a material fact or omit to state a material fact necessary to make the statements made, in light of the circumstances under which such statements were made, not misleading with respect to the period covered by this report;
3. Based on my knowledge, the financial statements, and other financial information included in this report, fairly present in all material respects the financial condition, results of operations and cash flows of the registrant as of, and for, the periods presented in this report;
4. The registrant’s other certifying officer and I are responsible for establishing and maintaining disclosure controls and procedures (as defined in Exchange Act Rules 13a-15(e) and 15d-15(e)) and internal control over financial reporting (as defined in Exchange Act Rules 13a-15(f) and 15d-15(f)) for the registrant and have:
a) Designed such disclosure controls and procedures, or caused such disclosure controls and procedures to be designed under our supervision, to ensure that material information relating to the registrant, including its consolidated subsidiaries, is made known to us by others within those entities, particularly during the period in which this report is being prepared;
b) Designed such internal control over financial reporting, or caused such internal control over financial reporting to be designed under our supervision, to provide reasonable assurance regarding the reliability of financial reporting and the preparation of financial statements for external purposes in accordance with generally accepted accounting principles;
c) Evaluated the effectiveness of the registrant’s disclosure controls and procedures and presented in this report our conclusions about the effectiveness of the disclosure controls and procedures, as of the end of the period covered by this report based on such evaluation;
d) Disclosed in this report any change in the registrant’s internal control over financial reporting that occurred during the registrant’s most recent fiscal quarter (the registrant’s fourth fiscal quarter in the case of an annual report) that has materially affected, or is reasonably likely to materially affect, the registrant’s internal control over financial reporting; and
5. The registrant’s other certifying officer and I have disclosed, based on our most recent evaluation of internal control over financial reporting, to the registrant’s auditors and the audit committee of registrant’s board of directors (or persons performing the equivalent functions):
a) All significant deficiencies and material weaknesses in the design or operation of internal control over financial reporting which are reasonably likely to adversely affect the registrant’s ability to record, process, summarize and report financial information; and
b) Any fraud, whether or not material, that involves management or other employees who have a significant role in the registrant’s internal control over financial reporting.
Date: March 28, 2014
By: /s/ Kenneth E. Steben Kenneth E. Steben
President, Chief Executive Officer and Director of the General Partner

F-33
EXHIBIT 31.02
Certification in Accordance with Section 302 of the Sarbanes-Oxley Act of 2002
I, Carl A. Serger, certify that:
1. I have reviewed this annual report on Form 10-K of Futures Portfolio Fund, Limited Partnership;
2. Based on my knowledge, this report does not contain any untrue statement of a material fact or omit to state a material fact necessary to make the statements made, in light of the circumstances under which such statements were made, not misleading with respect to the period covered by this report;
3. Based on my knowledge, the financial statements, and other financial information included in this report, fairly present in all material respects the financial condition, results of operations and cash flows of the registrant as of, and for, the periods presented in this report;
4. The registrant’s other certifying officer and I are responsible for establishing and maintaining disclosure controls and procedures (as defined in Exchange Act Rules 13a-15(e) and 15d-15(e)) and internal control over financial reporting (as defined in Exchange Act Rules 13a-15(f) and 15d-15(f)) for the registrant and have:
a) Designed such disclosure controls and procedures, or caused such disclosure controls and procedures to be designed under our supervision, to ensure that material information relating to the registrant, including its consolidated subsidiaries, is made known to us by others within those entities, particularly during the period in which this report is being prepared;
b) Designed such internal control over financial reporting, or caused such internal control over financial reporting to be designed under our supervision, to provide reasonable assurance regarding the reliability of financial reporting and the preparation of financial statements for external purposes in accordance with generally accepted accounting principles;
c) Evaluated the effectiveness of the registrant’s disclosure controls and procedures and presented in this report our conclusions about the effectiveness of the disclosure controls and procedures, as of the end of the period covered by this report based on such evaluation;
d) Disclosed in this report any change in the registrant’s internal control over financial reporting that occurred during the registrant’s most recent fiscal quarter (the registrant’s fourth fiscal quarter in the case of an annual report) that has materially affected, or is reasonably likely to materially affect, the registrant’s internal control over financial reporting; and
5. The registrant’s other certifying officer and I have disclosed, based on our most recent evaluation of internal control over financial reporting, to the registrant’s auditors and the audit committee of registrant’s board of directors (or persons performing the equivalent functions):
a) All significant deficiencies and material weaknesses in the design or operation of internal control over financial reporting which are reasonably likely to adversely affect the registrant’s ability to record, process, summarize and report financial information; and
b) Any fraud, whether or not material, that involves management or other employees who have a significant role in the registrant’s internal control over financial reporting.
Date: March 28, 2014
By: /s/ Carl A. Serger Carl A. Serger
Chief Financial Officer and Director of the General Partner

F-34
EXHIBIT 32.01
Certification Pursuant to Section 906 of the Sarbanes-Oxley Act of 2002 In connection with the annual report of Futures Portfolio Fund, Limited Partnership (“Fund”), on Form 10-K for the year ended December 31, 2013 as filed with the U.S. Securities and Exchange Commission on the date hereof (“Report”), I, Kenneth E. Steben, President and Chief Executive Officer of Steben & Company, Inc., the General Partner of the Fund, certify, pursuant to Section 906 of the Sarbanes-Oxley Act of 2002, that:
1. The Report fully complies with the requirements of Section 13(a) or 15(d), as applicable, of the U.S. Securities Exchange Act of 1934; and
2. The information contained in the Report fairly presents, in all material respects, the financial condition and results of operations of the Fund. By: /s/ Kenneth E. Steben Kenneth E. Steben President and Chief Executive Officer of the General Partner March 28, 2014

F-35
EXHIBIT 32.02
Certification Pursuant to Section 906 of the Sarbanes-Oxley Act of 2002 In connection with the annual report of Futures Portfolio Fund, Limited Partnership (“Fund”), on Form 10-K for the year ended December 31, 2013 as filed with the U.S. Securities and Exchange Commission on the date hereof (“Report”), I, Carl A. Serger, Chief Financial Officer of Steben & Company, Inc., the General Partner of the Fund, certify, pursuant to Section 906 of the Sarbanes-Oxley Act of 2002, that:
1. The Report fully complies with the requirements of Section 13(a) or 15(d), as applicable, of the U.S. Securities Exchange Act of 1934; and
2. The information contained in the Report fairly presents, in all material respects, the financial condition and results of operations of the Fund. By: /s/ Carl A. Serger Carl A. Serger Chief Financial Officer of the General Partner March 28, 2014