fuzzy logic as a computational tool for quantitative modelling of biological systems...
TRANSCRIPT

Fuzzy logic as a Computational Tool for Quantitative Modelling of Biological Systems with
Uncertain Kinetic Data
J. Bordon, M. Moškon, N. Zimic and M. Mraz
IEEE copyright notice:
© 2014 IEEE. Personal use of this material is permitted. Permission from IEEE must be obtained for all other uses, in any current or future media, including reprinting/republishing this material for advertising or promotional purposes, creating new collective works, for resale or redistribution to servers or lists, or reuse of any copyrighted component of this work in other works.
Citation to the original IEEE publication:
J. Bordon, M. Moškon, N. Zimic and M. Mraz, Fuzzy Logic as a Computational Tool for Quantitative Modelling of Biological Systems with Uncertain Kinetic Data, IEEE/ACM Transactions on Computational Biology and Bioinformatics, Vol. 12, No. 5, pp. 1199-1205, Sept.-Oct. 1 2015 (doi: 10.1109/TCBB.2015.2424424)
Available at IEEE Xplore
http://ieeexplore.ieee.org/xpl/articleDetails.jsp?arnumber=7089201

IEEE/ACM TRANSACTIONS ON COMPUTATIONAL BIOLOGY AND BIOINFORMATICS 1
Fuzzy Logic as a Computational Tool forQuantitative Modelling of Biological Systems
with Uncertain Kinetic DataJure Bordon, Miha Moskon, Nikolaj Zimic, Member, IEEE and Miha Mraz, Member, IEEE
Abstract—Quantitative modelling of biological systems hasbecome an indispensable computational approach in thedesign of novel and analysis of existing biological systems.However, kinetic data that describe the system’s dynamicsneed to be known in order to obtain relevant results with theconventional modelling techniques. These data are often hardor even impossible to obtain. Here we present a quantitativefuzzy logic modelling approach that is able to cope withunknown kinetic data and thus produce relevant results eventhough kinetic data are incomplete or only vaguely defined.Moreover, the approach can be used in the combination withthe existing state-of-the-art quantitative modelling techniquesonly in certain parts of the system, i.e. where kinetic dataare missing. The case study of the approach proposed here isperformed on the model of 3-gene repressilator.
Index Terms—Fuzzy Logic, Uncertain Kinetic Data, Or-dinary Differential Equations, Computational Biology, GeneRegulatory Networks, Modelling and Simulation, SyntheticBiology.
I. INTRODUCTION
RECENT advances in systems and synthetic biologyhave given detailed insight on the dynamics and
structure of several biological systems. This knowledgehas made the design and construction of novel biologicalsystems with predefined functionalities more straightfor-ward [1]–[3]. Among others, several synthetic gene reg-ulatory networks (GRNs), such as genetic toggle-switchesand oscillators, have caught the attention of the researchcommunity due to their occurrence in nature as well astheir vast potential in different synthetic applications, e.g.bi-stable switch for gene therapy, repressilator, metabolatoretc. [4]–[8]. However, experimental realization of thesesystems still presents a time-consuming and costly trial anderror process.
Recently computational models present an indispensabletool that can be used for the design, optimization and insilico verification of a novel biological system before itsexperimental realization [9], [10]. Choosing an appropriatemodelling technique depends on the complexity of theobserved GRN, desired accuracy of simulation results andthe availability of accurate kinetic data, which describe thedynamical properties of the system. Existing quantitative
The authors are with the Faculty of Computer and Information Science,University of Ljubljana, Ljubljana, Slovenia (e-mail: [email protected]; [email protected]; [email protected];[email protected]).
Manuscript received 22 Sep. 2014; revised 20 Mar. 2015.
methods are mostly based on the numerical simulationsof the system of ordinary differential equations (ODEs)or chemical master equation (CME). While describingsystems’ dynamics accurately, these approaches requireaccurate kinetic data in order to produce useful simulationresults [11]–[14].
The dynamics of an arbitrary GRN can be roughlydescribed with three different processes, i.e. transcription,translation and degradation. Each of these processes canbe presented with at least one chemical reaction and itsbelonging kinetic rate(s). Kinetic rates can be sometimes(accurately) determined by using various parameter pre-diction and estimation techniques. If experimental data fora given biological system is available, these methods canestimate missing kinetic data, which can then be used inan ODE model [15]–[17]. However, experimental data areoften hard or even impossible to obtain. In those casesparameter estimation techniques cannot be used and adifferent approach is needed.
In recent years fuzzy logic has been established as analternative approach for the quantitative modelling of bio-logical systems [18]. Fuzzy models consist of linguistic ex-pressions (e.g. Concentration is High or Promoter activityis Low) and are straightforward to construct as well as easyto understand. When kinetic data are known the accuracyof fuzzy modelling approaches is equal to the existingdeterministic approaches, such as ODE based models [19].Moreover, existing fuzzy logic approaches can be used toobtain a qualitative response of the system’s dynamics eventhough the kinetic data are unknown [20]. Uncertain kineticdata however still present a major obstacle for obtaining thequantitative response using existing modelling approaches[21].
Existing fuzzy logic approaches mostly consist of thekey events descriptions only (e.g. gene activated or re-pressed, binding of a transcription factor probable or notetc.) [22], [23], but are as such unable to cope withthe quantitative response of the system, such as proteinconcentration changes. On the other hand, Fuzzy CognitiveMaps can be constructed to describe a metabolic or generegulatory network, but are used as a qualitative overviewof the network (e.g. when are nodes actived/deactivated,how species interact with eacho ther over time, etc.) [24],[25]. Here we present a new approach that comprehen-sively exploits the advantages of fuzzy logic to obtainthe quantitative simulation results. The approach is able to
IEEE/ACM TRANSACTIONS ON COMPUTATIONAL BIOLOGY AND BIOINFORMATICS 2
Fuzzification
Knowledge base
Membership functions
Fuzzy rule base
DefuzzificationInference engineNumerical
values
Numerical
values
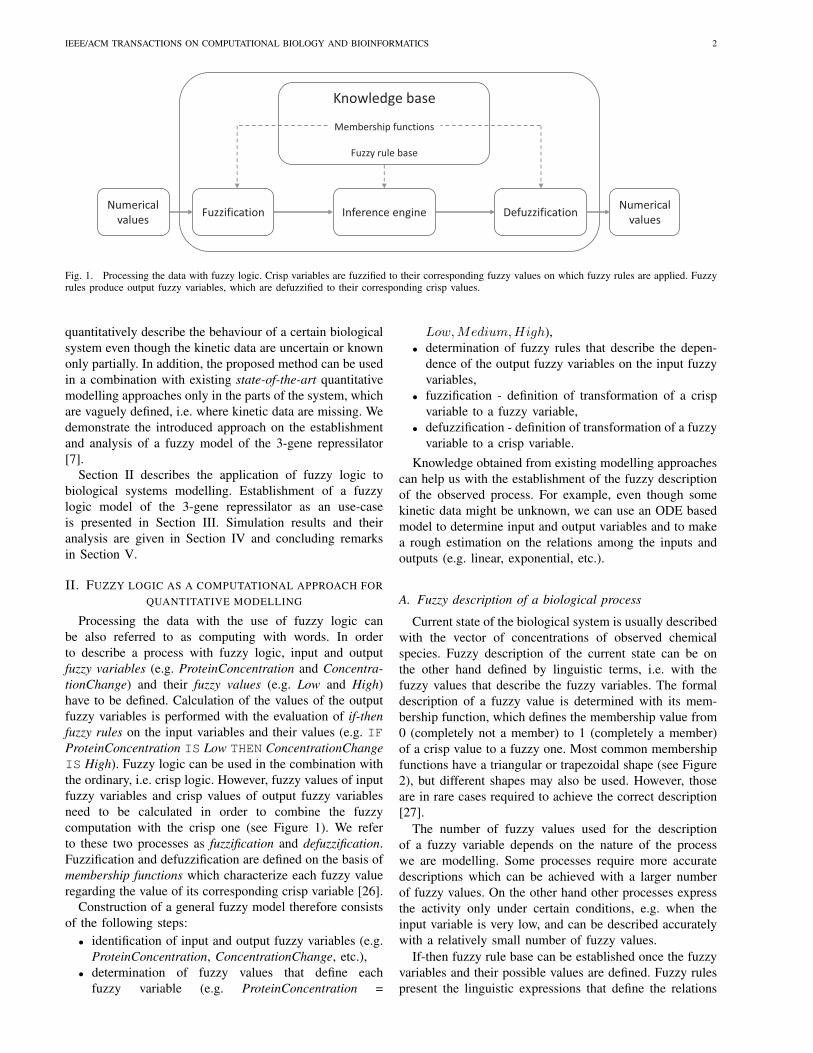
Fig. 1. Processing the data with fuzzy logic. Crisp variables are fuzzified to their corresponding fuzzy values on which fuzzy rules are applied. Fuzzyrules produce output fuzzy variables, which are defuzzified to their corresponding crisp values.
quantitatively describe the behaviour of a certain biologicalsystem even though the kinetic data are uncertain or knownonly partially. In addition, the proposed method can be usedin a combination with existing state-of-the-art quantitativemodelling approaches only in the parts of the system, whichare vaguely defined, i.e. where kinetic data are missing. Wedemonstrate the introduced approach on the establishmentand analysis of a fuzzy model of the 3-gene repressilator[7].
Section II describes the application of fuzzy logic tobiological systems modelling. Establishment of a fuzzylogic model of the 3-gene repressilator as an use-caseis presented in Section III. Simulation results and theiranalysis are given in Section IV and concluding remarksin Section V.
II. FUZZY LOGIC AS A COMPUTATIONAL APPROACH FORQUANTITATIVE MODELLING
Processing the data with the use of fuzzy logic canbe also referred to as computing with words. In orderto describe a process with fuzzy logic, input and outputfuzzy variables (e.g. ProteinConcentration and Concentra-tionChange) and their fuzzy values (e.g. Low and High)have to be defined. Calculation of the values of the outputfuzzy variables is performed with the evaluation of if-thenfuzzy rules on the input variables and their values (e.g. IFProteinConcentration IS Low THEN ConcentrationChangeIS High). Fuzzy logic can be used in the combination withthe ordinary, i.e. crisp logic. However, fuzzy values of inputfuzzy variables and crisp values of output fuzzy variablesneed to be calculated in order to combine the fuzzycomputation with the crisp one (see Figure 1). We referto these two processes as fuzzification and defuzzification.Fuzzification and defuzzification are defined on the basis ofmembership functions which characterize each fuzzy valueregarding the value of its corresponding crisp variable [26].
Construction of a general fuzzy model therefore consistsof the following steps:
• identification of input and output fuzzy variables (e.g.ProteinConcentration, ConcentrationChange, etc.),
• determination of fuzzy values that define eachfuzzy variable (e.g. ProteinConcentration =
Low,Medium,High),• determination of fuzzy rules that describe the depen-
dence of the output fuzzy variables on the input fuzzyvariables,
• fuzzification - definition of transformation of a crispvariable to a fuzzy variable,
• defuzzification - definition of transformation of a fuzzyvariable to a crisp variable.
Knowledge obtained from existing modelling approachescan help us with the establishment of the fuzzy descriptionof the observed process. For example, even though somekinetic data might be unknown, we can use an ODE basedmodel to determine input and output variables and to makea rough estimation on the relations among the inputs andoutputs (e.g. linear, exponential, etc.).
A. Fuzzy description of a biological process
Current state of the biological system is usually describedwith the vector of concentrations of observed chemicalspecies. Fuzzy description of the current state can be onthe other hand defined by linguistic terms, i.e. with thefuzzy values that describe the fuzzy variables. The formaldescription of a fuzzy value is determined with its mem-bership function, which defines the membership value from0 (completely not a member) to 1 (completely a member)of a crisp value to a fuzzy one. Most common membershipfunctions have a triangular or trapezoidal shape (see Figure2), but different shapes may also be used. However, thoseare in rare cases required to achieve the correct description[27].
The number of fuzzy values used for the descriptionof a fuzzy variable depends on the nature of the processwe are modelling. Some processes require more accuratedescriptions which can be achieved with a larger numberof fuzzy values. On the other hand other processes expressthe activity only under certain conditions, e.g. when theinput variable is very low, and can be described accuratelywith a relatively small number of fuzzy values.
If-then fuzzy rule base can be established once the fuzzyvariables and their possible values are defined. Fuzzy rulespresent the linguistic expressions that define the relations

IEEE/ACM TRANSACTIONS ON COMPUTATIONAL BIOLOGY AND BIOINFORMATICS 3
0 200 400 600 800 1000
0
0.2
0.4
0.6
0.8
1
ProteinConcentration [nM]
Deg
ree
of
mem
ber
ship
Low Medium High
(a)
0 200 400 600 800 1000
0
0.2
0.4
0.6
0.8
1
ProteinConcentration [nM]
Deg
ree
of
mem
ber
ship
Low Medium High
(b)
Fig. 2. Fuzzy values that define the fuzzy variable Protein concentrationare formally defined by the membership functions with a triangular (a) ortrapezoidal shapes (b). Different shapes may also be used, but are in rarecases required.
between the input and output fuzzy variables and can beusually established intuitively with the linguistic descriptionof the system’s dynamics.
Our approach will be used to quantitatively describethe system state changes caused by the reactions in ob-served GRN. Each fuzzy value will be defined with theconcentrations in a certain interval and their correspondingmembership values (e.g. if concentration of a protein canrange from 0 to 1000nM , concentrations from 0 to 650nMcan be completely referred to as not High, i.e. membershipvalue is 0; concentrations from 900 to 1000nM can becompletely referred to as High, i.e. membership value is1; and concentrations from 650 to 900nM as somethingin between, i.e. membership values linearly increase from0 to 1; see Figure 2b). Output fuzzy variables will bedefined as absolute changes of the concentrations causedby the processes that describe observed chemical reactions.Rule base will therefore have the form such as IF Protein-Concentration IS High THEN ConcentrationDecrease ISHigh.
Fuzzy logic can be as such used to quantitatively describea biological process with only partial knowledge of thesystem’s dynamics and without the direct use of kineticdata. In order to make the approach compatible with othermodelling techniques that only operate with crisp valuesfuzzification and defuzzification processes are used in theinput and output segment of a fuzzy model. This allowsus to use the fuzzy logic only in the parts of the modelin which kinetic data are unknown and to use conventionalapproaches elsewhere.
B. Combining fuzzy logic with the existing modelling ap-proaches
It is evident that the inputs and outputs of the fuzzymodel will always be crisp values, i.e. current concentra-tions as inputs and concentration changes as outputs. Thisenables us to use our fuzzy model only as a replacement fora certain part of the conventional model in which kineticdata are unknown.
Current state in a biological system is usually describedwith the vector of concentrations of observed chemicalspecies, i.e. x = (x1, x2, ..., xn). System change can be
described with the following set of differential equations:
d[xi]
dt=
m∑j=1
fi,j(x), for i = 1, . . . , n, (1)
where each function describes a different process (e.g.transcription, translation, etc.) and has its own set of kineticparameters (e.g. transcription rate, translation rate, etc.).Using our fuzzy logic approach, we can replace of theany functions that are only partially known due to missingkinetic parameters:
d[xi]
dt= FLk(x) +
m∑j=1
fi,j(x),
for i = 1, . . . , n and k 6= j,
(2)
where FLk(x) is the fuzzy logic model of the processfor which kinetic parameters are unknown. Inputs to ourfuzzy logic model are crisp values of the concentrationsof observed species, while the output is a crisp value ofchange in concentration of xi. The output of our model iscombined with the output of other functions to obtain thechanges in concentrations of observed species for each timestep of the simulation.
III. CASE STUDY: 3-GENE REPRESSILATOR
Repressilator is a GRN that consists of an arbitrary num-ber of genes, which are connected in a circular repressionscheme. It has been shown that only the topologies ofa repressilator with odd numbers of genes may exhibitoscillations for certain parameter values (kinetic rates) [7].We will demonstrate the establishment of a quantitativefuzzy logic model on the 3-gene repressilator (see Figure3). Even though the proposed approach could be used todescribe the whole system, we will presume that the onlyprocess that is partially unknown due to the missing kineticrates is transcription. Here we present the quantitativefuzzy description of transcription only. However, the fuzzypresentation of translation and degradation could be madein the same way straightforwardly.
1
23
Fig. 3. Circular repression scheme of the 3-gene repressilator.
Dynamics of the 3-gene repressilator is determined bythe production of three different mRNA species (i.e. tran-scription), production of three different protein species(i.e. translation) and degradation of all mRNA and proteinspecies. Transcription of mRNAi is dampened by thepresence of a protein Pj , where j represents the index of

IEEE/ACM TRANSACTIONS ON COMPUTATIONAL BIOLOGY AND BIOINFORMATICS 4
the protein that inhibits the production of mRNAi, i.e.j = (i− 1) mod 3.
While we presume transcription rate to be unknown, it isimpossible to find a numerical solution for the conventionaldeterministic model. However, we will demonstrate thatthe introduced quantitative fuzzy model is able to producequantitatively relevant results, even though certain kineticrates are unknown.
A. Conventional deterministic model
Our reference model will be based on the system ofODEs. We assume that all genes of the repressilator havethe same dynamical properties, i.e. equal kinetic rates [7].The system of ODEs that defines the dynamics is asfollows:
d[Pi]
dt= ktsl · [mRNAi]− kdegP · [Pi], (3)
d[mRNAi]
dt=
ktsk1 + [Pj ]n
− kdegmRNA· [mRNAi], (4)
where Eqn. (3) presents the protein concentration change(translation and degradation), in which Pi is the current pro-tein concentration, mRNAi current mRNA concentration,ktsl translation rate and kdegP protein degradation rate. Eqn.(4) presents mRNA concentration change (transcription anddegradation), in which Pj is the current repressor proteinconcentration, n Hill coefficient, ktsk transcription rate andkdegmRNA
mRNA degradation rate. Table I shows the valuesof all kinetic rates that will be used in our simulations andare derived from [7].
TABLE IKINETIC PARAMETERS THAT WILL BE USED IN THE REFERENCE
MODEL.
n. Process Parameter Value(1) Transcription ktsk 1.6min−1
(2) Transcription n 2
(3) Translation ktsl 2.6min−1
(4) mRNA degradation kdegmRNA0.12min−1
(5) Protein degradation kdegP 0.06min−1
B. Quantitative fuzzy transcription model
The mRNA concentration changes are described in Eqn.(4). First part of the equation presents the changes in theconcentration caused by transcription. To demonstrate theproposed fuzzy approach, we will assume that transcriptionrate (ktsk) is unknown. Other parameter values will bederived from Table I. Quantitative fuzzy transcription modelconstruction procedure can be described with the followingsteps:
1) identification of known and unknown parameter val-ues (in our case only the value of ktsk is unknown).
2) analysis of the correlation between the kinetic ratesand transcription dynamics,
3) establishment of the linguistic description of tran-scription dynamics,
4) quantitative fuzzy model construction (fuzzificationand defuzzification, establishment of if-then rules,membership functions and potential scaling).
1) Identification of known and unknown parameter val-ues: The equation that describes transcription can be de-rived from Eqn. (4) and has the following form:
d[mRNAi]
dt=
ktsk1 + [Pj ]n
, (5)
where• [Pj ] is current concentration of repressor protein (j =
1, 2, 3) – an input variable to a quantitative fuzzy logicmodel, which will be fuzzified to a fuzzy variable,
• d[mRNAi] presents an increase of mRNAi concen-tration (i = 1, 2, 3) in time step dt – an output fuzzyvariable from a quantitative fuzzy logic model, whichwill be transformed to a crisp variable as an absoluteconcentration change for Eqn. (4),
• n is Hill coefficient - the correlation between transcrip-tion and Hill coefficient will be analysed; its resultswill be used in a combination with the values fromTable I to construct the quantitative fuzzy logic model,
• ktsk is transcription rate - transcription rate is assumedto be unknown. Its effects on transcription, based onthe step 2 of a quantitative fuzzy transcription modelconstruction procedure, will be considered when con-structing fuzzy model.
2) Analysis of the correlation between the kinetic ratesand transcription dynamics: To understand how parametersn and ktsk affect the mRNA concentration increase dueto transcription, the correlation between their values andsystem’s dynamics are analysed on the basis of Eqn. (5).Figure 4 shows the dependence of the mRNA concentrationincrease on transcription rate values from ktsk = 0.5 toktsk = 5, if n equals 1, 2, 3 or 4. Figure 5 shows thedependence of the mRNA concentration increase on Hillcoefficient from n = 0 to n = 3, if ktsk equals 0.5, 1, 3 or10.
3) Establishment of the linguistic description of tran-scription dynamics: Figures 4 and 5 indicate that therepressor proteins drastically affect transcription even whentheir concentrations are relatively low, i.e. gene is com-pletely silenced in most cases (e.g. when the repressorconcentrations reach the threshold of 15nM ). Transcriptionmay therefore increase the concentration of mRNA onlywhen the repressor protein concentrations are in the interval[0, 15nM ]. The linguistic description can be constructed onthe basis of our observations:
• The represor concentrations can be divided in twoparts: a small interval of low concentrations, wheretranscription is active (e.g. repressor concentration islower than 15nM at ktsk = 5; see Figure 4(d)) andthe rest of the interval, where transcription is silenced(e.g. repressor concentration is higher than 15nM atktsk = 5; see Figure 4(d)).

IEEE/ACM TRANSACTIONS ON COMPUTATIONAL BIOLOGY AND BIOINFORMATICS 5
0 5 10 15 20 25 300.5
1
1.5
2
2.5
3
3.5
4
4.5
5
Protein concentration [nM]
mRNA concentration change [nM]; Transcription rate (ktsk
), n = 4
Tra
nsc
rip
tio
n r
ate
(kts
k)
0
0.5
1
1.5
(a)
0 5 10 15 20 25 300.5
1
1.5
2
2.5
3
3.5
4
4.5
5
Protein concentration [nM]
mRNA concentration change [nM]; Transcription rate (ktsk
), n = 3
Tra
nsc
rip
tio
n r
ate
(kts
k)
0
0.5
1
1.5
(b)
0 5 10 15 20 25 300.5
1
1.5
2
2.5
3
3.5
4
4.5
5
Protein concentration [nM]
mRNA concentration change [nM]; Transcription rate (ktsk
), n = 2
Tra
nsc
rip
tio
n r
ate
(kts
k)
0
0.5
1
1.5
(c)
0 5 10 15 20 25 300.5
1
1.5
2
2.5
3
3.5
4
4.5
5
Protein concentration [nM]
mRNA concentration change [nM]; Transcription rate (ktsk
), n = 1
Tra
nsc
rip
tio
n r
ate
(kts
k)
0
0.5
1
1.5
(d)
Fig. 4. Different colours indicate the mRNA concentration change.Figures present how the mRNA concentration changes at different valuesof ktsk , where n = 4 (a), n = 3 (b), n = 2 (c) and n = 1 (d).
0 5 10 15 20 25 301
1.5
2
2.5
3
Protein concentration [nM]
mRNA concentration change [nM]; Hill coefficient (n), ktsk
= 10
Hill
co
effi
cien
t (n
)
0
0.05
0.1
0.15
0.2
0.25
(a)
0 5 10 15 20 25 301
1.5
2
2.5
3
Protein concentration [nM]
mRNA concentration change [nM]; Hill coefficient (n), ktsk
= 3
Hill
co
effi
cien
t (n
)
0
0.05
0.1
0.15
0.2
0.25
(b)
0 5 10 15 20 25 301
1.5
2
2.5
3
Protein concentration [nM]
mRNA concentration change [nM]; Hill coefficient (n), ktsk
= 1
Hill
co
effi
cien
t (n
)
0
0.05
0.1
0.15
0.2
0.25
(c)
0 5 10 15 20 25 301
1.5
2
2.5
3
Protein concentration [nM]
mRNA concentration change [nM]; Hill coefficient (n), ktsk
= 0.5
Hill
co
effi
cien
t (n
)
0
0.05
0.1
0.15
0.2
0.25
(d)
Fig. 5. Different colours indicate the mRNA concentration change.Figures present how the mRNA concentration changes at different valuesof n, where ktsk = 10 (a), ktsk = 3 (b), ktsk = 1 (c) and ktsk = 0.5(d).
• Transcription is active when the repressor concentra-tions are low (even though we only show the lowerpart of protein concentration interval ([0, 30nM ]), itis enough to demonstrate that transcription completelystops when the concentrations are higher than thethreshold).
• Transcription rate increases when the repressor con-centrations are relatively low. (e.g. mRNA concentra-
tion change increases when the repressor concentra-tions decrease from 15nM to 0nM ; see Figure 4(d)at ktsk = 5).
• By increasing the value of transcription rate ktsk themRNA concentrations change increase linearly (theedge of the non-zero mRNA concentration change islinearly proportional to ktsk in Figure 4).
• By decreasing the Hill coefficient n the repressor con-centrations interval where transcription is still activewidens (e.g. interval [0, 5nM ] at n = 3 increases to[0, 15nM ] if n = 1; see Figure 5(c)).
4) Quantitative fuzzy model construction: The quanti-tative fuzzy logic model presented in Figure 6 can beconstructed on the basis of the linguistic description givenabove.
Crisp input variable presents the repressor concentrationand will be transformed to a fuzzy variable Repressor-Concentration with fuzzy values Low and High. WhileLow describes the lower part of possible concentrations,where transcription is active, High describes the rest ofthe possible concentrations, where transcription is silenced.Output fuzzy variable mRNAIncrease will also be describedwith the fuzzy values denoted Low and High. However,these values will have different membership functions thanthe ones describing input fuzzy variable. Fuzzy variablevalues should include all possible values of respectivecrisp variables (e.g. we can presume that the repressorconcentrations always lie between 0 and 500nM ). Whilewe presume that transcription rate parameter is not exactlyknown, it is impossible to presume the maximal repressorconcentration as well as the maximal mRNA concentrationincrease. Therefore both input and output fuzzy variableintervals are normalized to interval [0, 1], where valuesclose to 0 correspond to value Low, while values close to1 correspond to value High (see Figure 7).
0 0.1 0.2 0.3 0.4 0.5 0.6 0.7 0.8 0.9 10
0.2
0.4
0.6
0.8
1
Represor concentration
Deg
ree
of m
embe
rshi
p
Low High
Input membership functions for transcription
(a)
0 0.1 0.2 0.3 0.4 0.5 0.6 0.7 0.8 0.9 10
0.2
0.4
0.6
0.8
1
mRNA concentration increase
Deg
ree
of m
embe
rshi
p
Low High
Output membership functions for transcription
(b)
Fig. 7. Membership functions for fuzzy sets Low and High, which de-scribe the concentration of repressor regulating the observed transcriptionprocess (a) and mRNA concentration change (b). The concentrations arenormalized to interval [0,1] and are therefore unitless.
In the case of output fuzzy variable, value Low describessmall or almost negligible increase of the mRNA con-centration and is active when the repressor concentrationsare High. Respectively, High presents a maximal increaseof the mRNA concentrations, and becomes active as therepressor concentrations go towards 0. If-then rule set,which describes the observed behaviour, can be establishedonce the fuzzy variable values are defined with their cor-

IEEE/ACM TRANSACTIONS ON COMPUTATIONAL BIOLOGY AND BIOINFORMATICS 6
[Pj]
(crisp)
Fuzzification
Knowledge base
Membership functions
IF-THEN rules
ktsk
n
Defuzzification d[mRNAi]
Correlation
analysis
Repressor
Concentration
mRNAConc
IncreaseIF-THEN
(fuzzy) (fuzzy)(crisp)
Fuzzy model of transcription with repression
Fig. 6. The quantitative fuzzy logic model of transcription will have a crisp input variable Pj , which will be fuzzified to fuzzy variableRepressorConcentration and an output fuzzy variable mRNAIncrease, which will be defuzzified to a crisp variable defining mRNA increase dueto transcription.
responding membership functions. The number of fuzzyrules is bounded by the number of values from the inputfuzzy variable. In our case we need two rules to describeall possibilities:
1. IF RepressorConcentration IS LowTHEN mRNAIncrease IS High,
2. IF RepressorConcentration IS HighTHEN mRNAIncrease IS Low .
It is convenient to use the proposed approach only forthe parts of the system that lack the exact kinetic data.For this purpose input and output variable values needto be scaled to the ranges of the concentrations observedin other parts of the system in which conventional mod-elling techniques are used. Scaling is performed with thefunctions prescale (see Algorithm III.1), which maps therepressor concentrations from a crisp value to an interval[0, 1] and postscale (see Algorithm III.2), which maps themRNA concentration changes from the interval [0, 1] to acrisp value. These two functions dynamically adjust themaximal protein concentrations and the maximal mRNAconcentration changes according to the crisp values of theconcentrations in other segments of the model. Both pa-rameters (prescalein, postscalein) that determine scalingare initially set to 1 (no scaling). While prescaleout isincreased by input variable Pj (prescaleout is assingned toprescalein in the next iteration), postscaleout is incremen-tally increased by parameter multiplier until the maximalconcentration change is reached. The parameter is set to1.01 in our simulation (1% increase for every iteration).Increasing multiplier will cause faster convergence to thefinal value of postscale, however, it might also introducebigger error due to larger changes of postscale in everyiteration. Introduced functions allow us to describe theunknown processes quantitatively with the knowledge weobtain from the known parts of the system.
Algorithm III.1 Function prescale that applies the quantitativecontext to the process described with the fuzzy logic model.
prescalein = maximal protein concentrationprescaleout = adjusted maximal protein concentrationinput = input protein concentration (crisp input of the fuzzymodel)inputprescaled = scaled input protein concentration (mapped tothe interval [0,1])
function PRESCALE( prescalein, input )
prescaleout ← prescalein
if input > prescalein thenprescaleout ← input
end if
inputprescaled ← input/prescaleoutreturn [inputprescaled, prescaleout]
end function
Algorithm III.2 Function postscale that applies the quantitativecontext to the process described with the fuzzy logic model.
postscalein = maximal mRNA concentration changepostscaleout = adjusted maximal mRNA concentration changeoutput = normalized mRNA concentration increase (output ofthe fuzzy model)outputpostscaled = scaled mRNA concentration increasemultiplier = multiplication factor for postscaleout
function POSTSCALE( postscalein, output,multiplier )
postscaleout ← postscalein
if output ·multiplier > postscaleout thenpostscaleout ← output ·multiplier
end if
outputpostscaled ← output · postscaleoutreturn [outputpostscaled, postscaleout]
end function

IEEE/ACM TRANSACTIONS ON COMPUTATIONAL BIOLOGY AND BIOINFORMATICS 7
IV. RESULTS AND DISCUSSION
Conventional model (see Section III-A) and quantitativefuzzy logic model (see Section III-B) were constructed inMATLAB Simulink1. Fuzzy toolbox was used for the con-struction of fuzzy logic model of transcription. Parametervalues used in both models were derived from Table I.Simulations were performed with the ode4 Runge-Kuttaengine for numerical solving using a fixed time step of 0.1minutes. The system’s dynamics was simulated for 2000minutes. An example of a simulation run on both modelsis presented in Figure 8.
0 500 1000 1500 20000
50
100
150
200
250
300
350
400Represilator with 3−gene ring − fuzzy transcription
Time [min]
Pro
tein
con
cent
ratio
n
Protein 1Protein 2Protein 3
(a)
0 500 1000 1500 20000
50
100
150
200
250
300
350
400Represilator with 3−gene ring − ODE
Time [min]
Pro
tein
con
cent
ratio
n
Protein 1
Protein 2Protein 3
(b)
Fig. 8. Simulation results of the fuzzy logic (a) and the conventionalmodel (b) of the 3-gene repressilator using the parameter set from Table I.Transcription rate is omitted from the fuzzy model. Both simulation runsreveal stable oscillations with comparable frequencies and amplitudes.
We analysed the presence of oscillations for differentparameter values, i.e. protein degradation and translationrates were varied. The quantitative accuracy of the fuzzyapproach was measured with the agreement of the fre-quencies and amplitudes of oscillations between the con-ventional and fuzzy model. Frequencies were determinedusing Fast Fourier transform (FFT) analysis. We expectedsome dissimilarities between the conventional and the fuzzymodel, while transcription rate was not used in the latter.However, quantitative relevance should be retained in thefuzzy model. The results presented in Figure 9 indicatethat the parameter range for which the system exhibitsoscillatory behaviour is wider when transcription is mod-elled with fuzzy logic. However, the amplitude and thefrequency of oscillations are comparable to those obtainedwith the conventional model. Even if we run the ODEmodel with different values of transcription rate, frequencyof oscillations stays the same. On the other hand amplitudechanges proportionally to increase or decrease of transcrip-tion rate. Nevertheless, for biologically relevant values oftranscription rate, changes to amplitude are not significantand remain comparable to those obtained by our fuzzyapproach.
Dissimilarities between the conventional and the fuzzymodel arise especially in the bifurcation regions, i.e. inthe parameter space where the system transitions fromthe convergence to a steady state to oscillatory behaviour.However, frequency analysis confirms that the fuzzy logic
1The MATLAB and Simulink models are available at http://lrss.fri.uni-lj.si/bio/material/tcbb Bordon.zip under the Creative Commons Attribu-tion license.
1 2 3 4 50
0.1
0.2
0.3
0.4
0.5 Frequency − Fuzzy model of transcription
ktsl
k degP
rote
in
0
0.002
0.004
0.006
0.008
0.01
(a)
1 2 3 4 50
0.1
0.2
0.3
0.4
0.5 Frequency − pure ODE model
ktsl
k degP
rote
in
0
0.002
0.004
0.006
0.008
0.01
(b)
Fig. 9. Frequency analysis for different values of translation (ktsl) anddegradation rates (kdegProtein
) for both models. Figures demonstrate thatthe frequencies of oscillations obtained by both models are comparableand that the Fuzzy approach retains the quantitative relevance of the ODEmodel.
model preserves the quantitative relevance of simulationresults despite the missing kinetic data.
V. CONCLUSION
Missing kinetic data present a major obstacle in thequantitative modelling of biological systems. Even thoughsome data are missing, various parameter estimation tech-niques may be used for their evaluation. These techniqueshowever often require large sets of experimental data,which are sometimes very hard or even impossible toobtain. Here we introduced an alternative approach thatexploits the properties of fuzzy logic and enables us toobtain quantitatively relevant simulation results even thoughthe kinetic data are incomplete. While the accuracy ofsimulations is partially lost, they can still be used to produceresults with biological relevance. Moreover, the approachpresented here is compatible with conventional state-of-the-art modelling approaches. We successfully demonstratedthe establishment of proposed modelling methodology inthe combination with ODE based model on fuzzy tran-scription in the reaction network of the 3-gene repressilator.Translation or degradation could be modelled in the sameway straightforwardly. Since the proposed method relieson the knowledge unrelated to kinetic data as well as onthe kinetic data that is known, dissimilarities between thefuzzy and the conventional model would increase with thenumber of processes modelled by fuzzy logic. However, theapproach would still be able to produce quantitative resultswith biological relevance.
ACKNOWLEDGMENTS
The research was supported by the national postgraduateprogramme Higher Education National Scheme, financedby the European Union (EU), University of Ljubljanaand Slovenian Ministry of Higher Education, Science andTechnology. Results presented here are in scope of PhDthesis that is being prepared by Jure Bordon, University ofLjubljana, Faculty of Computer and Information science.
REFERENCES
[1] U. Alon, An Introduction to Systems Biology: Design Principles ofBiological Circuits, ser. Chapman and Hall/CRC mathematical &computational biology series. Chapman & Hall/CRC, 2007. [On-line]. Available: http://books.google.si/books?id=pAUdPQlCZ54C

IEEE/ACM TRANSACTIONS ON COMPUTATIONAL BIOLOGY AND BIOINFORMATICS 8
[2] R. Kitney and P. Freemont, “Synthetic biology - the state of play.”FEBS Lett, vol. 586, no. 15, pp. 2029–2036, Jul. 2012.
[3] E. Andrianantoandro, S. Basu, D. K. Karig, and R. Weiss, “Syn-thetic biology: new engineering rules for an emerging discipline,”Molecular Systems Biology, vol. May, pp. 1–14, 2006.
[4] E. Fung, W. W. Wong, J. K. Suen, T. Bulter, S.-g. Lee, and J. C.Liao, “A synthetic gene–metabolic oscillator,” Nature, vol. 435, no.7038, pp. 118–122, 2005.
[5] S. L. Michael B. Elowitz, “A synthetic oscillatory network oftranscriptional regulators,” Nature, vol. 403, pp. 335–338, 2000.
[6] J. Stricker, S. Cookson, M. R. Bennett, W. H. Mather, L. S. Tsimring,and J. Hasty, “A fast, robust and tunable synthetic gene oscillator,”Nature, vol. 456, pp. 516–520, 2008.
[7] N. Strelkowa and M. Barahona, “Switchable genetic oscillator oper-ating in quasi-stable mode,” Journal of The Royal Society Interface,vol. 7, no. 48, pp. 1071–1082, 2010.
[8] T. S. Gardner, C. R. Cantor, and J. J. Collins, “Construction of agenetic toggle switch in Escherichia coli,” Nature, vol. 403, pp. 339–342, 2000.
[9] Y. Y. Chen, K. E. Galloway, and C. D. Smolke, “Synthetic biol-ogy: advancing biological frontiers by building synthetic systems,”Genome biology, vol. 13, no. 2, p. 240, 2012.
[10] L. Chen and R. Wang, “Designing gene regulatory networks withspecified functions,” IEEE Transactions on Circuits and Systems I:Regular Papers, vol. 53, pp. 2444–2450, 2006.
[11] H. de Jong, “Modeling and simulation of genetic regulatory systems:A literature review,” Journal of Computational Biology, vol. 9, pp.67–103, 2002.
[12] J. N. Weiss, “The hill equation revisited: uses and misuses,” FASEBJournal, vol. 11, pp. 835–841, 1997.
[13] D. T. Gillespie, “Stochastic simulation of chemical kinetics,” AnnualReview of Physical Chemistry, vol. 58, pp. 35–55, 2007.
[14] A. Cheng and T. K. Lu, “Synthetic biology: An emerging engineeringdiscipline,” Annual Review of Biomedical Engineering, vol. 14, pp.155–178, 2012.
[15] C. G. Moles, P. Mendes, and J. R. Banga, “Parameter estimationin biochemical pathways: A comparison of global optimizationmethods,” Genome research, vol. 13, no. 11, pp. 2467–2474, 2003.
[16] G. Lillacci and M. Khammash, “Parameter estimation and modelselection in computational biology,” PLoS Computational biology,vol. 6, no. 3, p. e1000696, 2010.
[17] J. Sun, J. M. Garibaldi, and C. Hodgman, “Parameter estimationusing metaheuristics in systems biology: A comprehensive review,”IEEE/ACM Transactions on Computational Biology and Bioinfor-matics, vol. 9, no. 1, pp. 185–202, 2012.
[18] R. Kuffner, T. Petri, L. Windhager, and R. Zimmer, “Petri nets withfuzzy logic (PNFL): Reverse engineering and parametrization,” PLoSOne, vol. 5, no. 9, p. e12807, 2010.
[19] L. Windhager, “Modeling of dynamic systems with Petri nets andfuzzy logic,” Ph.D. dissertation, Ludwig-Maximilians-UniversitatMunchen, April 2013. [Online]. Available: http://nbn-resolving.de/urn:nbn:de:bvb:19-156555
[20] L. Windhager and R. Zimmer, “Intuitive modeling of dynamicsystems with Petri nets and fuzzy logic,” in Proc German ConfBioinf, vol. 136. Citeseer, 2008, pp. 106–115.
[21] A. P. Heath and L. E. Kavraki, “Computational challenges in systemsbiology,” Computer Science Review, vol. 3, no. 1, pp. 1–17, 2009.
[22] Y. Gendrault, M. Madec, V. Wlotzko, C. Lallement, and J. Haiech,“Fuzzy logic, an intermediate description level for design andsimulation in synthetic biology,” in Biomedical Circuits and SystemsConference (BioCAS), 2013 IEEE. IEEE, 2013, pp. 370–373.
[23] R. I. Hamed, S. Ahson, and R. Parveen, “A new approach formodelling gene regulatory networks using fuzzy Petri nets,” Journalof Integrative Bioinformatics, vol. 7, no. 1, p. 113, 2010.
[24] J. Dickerson, Z. Cox, E. Wurtele, and A. Fulmer, “Creating metabolicand regulatory network models using fuzzy cognitive maps,” in IFSAWorld Congress and 20th NAFIPS International Conference, 2001.Joint 9th, vol. 4. IEEE, 2001, pp. 2171–2176.
[25] P. Du, J. Gong, E. S. Wurtele, and J. A. Dickerson, “Modelinggene expression networks using fuzzy logic,” IEEE Transactions onSystems, Man, and Cybernetics, Part B: Cybernetics, vol. 35, no. 6,pp. 1351–1359, 2005.
[26] L. Zadeh, “Fuzzy logic and approximate reasoning,” Synthese,vol. 30, no. 3, pp. 407–428, 1975.
[27] G. J. Klir and B. Yuan, Fuzzy sets and fuzzy logic. Prentice HallNew Jersey, 1995.
Jure Bordon received his BSc degree in Com-puter Science from the Faculty of Computer andInformation Science, University of Ljubljana,Slovenia in 2011.
He is a PhD student and currently employedas a teaching assistant in the Computer Struc-tures and Systems Laboratory at the Faculty ofComputer and Information Science, Universityof Ljubljana, Slovenia, where he is in chargeof the several laboratory courses. He is also amember of Computational biology group at the
same faculty. His research interests are mainly directed towards Fuzzylogic modelling and computational biology. He has published his work inseveral conference and workshop proceedings.
Miha Moskon received his BSc degree in Com-puter Science from the Faculty of Computer andInformation Science, University of Ljubljana,Slovenia in 2007 and his PhD in 2012.
He is currently employed as an assistant pro-fessor in the Computer Structures and SystemsLaboratory at the Faculty of Computer andInformation Science, University of Ljubljana,Slovenia, where he is in charge of the severallaboratory courses. He is also a member ofComputational biology group at the same faculty.
His main research interests are computational biology and unconventionalprocessing methods. He has published his work in several internationaljournals and conference proceedings.
Nikolaj Zimic received his BSc, MSc and PhDdegree in computer science from the Faculty ofComputer and Information Science, Universityof Ljubljana, Slovenia in 1984, 1990 and 1994.
Nikolaj Zimic is a full professor and a deanof the Faculty of Computer and informationScience (Ljubljana). He leads the Laboratory ofComputer Structures and Systems. His researchwork is mainly focused on the fields of uncon-ventional computing, fuzzy logic and computernetworks. He led several industrial and research
projects covering the topics from the optimization of network protocols toimplementation of fuzzy algorithms for control and decision systems. Heis an occasional reviewer for several international journals, such as Fuzzysets and Mathematical and Computer Modeling of Dynamical Systems.His research work has been published in different international scientificjournals and on several conferences. He is a member of IEEE professionalsociety.
Miha Mraz received his BSc, MSc and PhDdegree in computer science from the Faculty ofComputer and Information Science, Universityof Ljubljana, Slovenia in 1992, 1995 and 2000.
He is currently employed as a full professorat the Faculty of Computer and InformationScience, University of Ljubljana, Slovenia andis also a head of Computational biology groupat the same faculty. His research interests arerecently directed towards unconventional pro-cessing methods, such as fuzzy logic, synthetic
biological systems and QCA structures. He has published his work in manydistinguished journals such as Nanotechnology, Journal of TheoreticalBiology, International Journal on Unconventional computing, Japanesejournal of applied physics, etc. He is also in the editorial board ofnewly founded Journal of Synthetic Biology. He is a member of IEEEprofessional society.