fuzzy logic based power system contingency ranking · a static voltage collapse proximity...
TRANSCRIPT

I.J. Intelligent Systems and Applications, 2013, 03, 1-12
Published Online February 2013 in MECS (http://www.mecs-press.org/)
DOI: 10.5815/ijisa.2013.03.01
Copyright © 2013 MECS I.J. Intelligent Systems and Applications, 2013, 03, 1-12
Fuzzy Logic Based Power System Contingency
Ranking
A. Y. Abdelaziz*, A. T. M. Taha, M. A. Mostafa
Electrical Power and Machines Department, Faculty of Engineering, Ain Shams University, Cairo, Egypt
Email*: [email protected]
A. M. Hassan
Electrical Power and Machines Department, Faculty of Engineering, Ain Shams University, Cairo, Egypt
Email: [email protected]
Abstract— Voltage stability is a major concern in
planning and operations of power systems. It is well
known that voltage instability and collapse have led to
major system failures. Modern transmission networks
are more heavily loaded than ever before to meet the
growing demand. One of the major consequences
resulted from such a stressed system is voltage collapse
or instability. Th is paper presents maximum loadability
identification of a load bus in a power transmission
network. In this study, Fast Voltage Stability Index
(FVSI) is utilized as the indicator of the maximum
loadability termed as Qmax. In this technique, reactive
power loading will be increased gradually at part icular
load bus until the FVSI reaches close to unity.
Therefore, a critical value of FVSI was set as the
maximum loadability point. Th is value ensures the
system from entering voltage-collapse region. The main
purpose in the maximum loadability assessment is to
plan for the maximum allowable load value to avoid
voltage collapse; which is important in power system
planning risk assessment.
The most important task in security analysis is the
problem of identifying the critical contingencies from a
large list of credible contingencies and ranks them
according to their severity. The condition of voltage
stability in a power system can be characterized by the
use of voltage stability indices . This paper presents
fuzzy approach for ranking the contingencies using
composite-index based on parallel operated fuzzy
inference engine. The Line Flow index (L.F) and bus
Voltage Magnitude (VM) of the load buses are
expressed in fuzzy set notation. Further, they are
evaluated using Fuzzy rules to obtain overall Crit icality
Index. Contingencies are ranked based on decreasing
order of Crit icality Index and then provides the
comparison of ranking obtained with FVSI method.
Index Terms— Contingency Ranking, Fuzzy Sets, Line
Flow Index, FVSI, Criticality Index
I. Introduction
Voltage stability has been identified as a crucial issue
in power system study and one of the causes that lead to
cascading power system blackout in many parts of the
world. This phenomenon has made this subject a very
relevant issue in power system planning and operation.
There are many incidents of power system blackouts,
due to voltage collapse, as reported in [1-3]. Thus, it is
very important to know the maximum permissible
loading of a system so that it can be operated with an
adequate voltage stability margin to prevent voltage
collapse. Due to the fact that many systems have not
expanded their transmission and generation capacity in
recent years, many utilit ies are operating closer to their
maximum capacity. For a system with smaller margin,
more contingencies are considered as severe
contingencies, and the system is exposed to more
frequent voltage collapses [4]. Many power systems are
now experiencing voltage problems more frequently
and voltage studies have gained increasing attention
from operating and planning points of views. It is vital,
then, for the electric utility planners and operators to
know the impact of every contingency on the voltage
profile. Ranking all possible contingencies based on
their impact on the system voltage profile will help the
operators in choosing the most suitable remedial actions
before the system moves toward voltage collapse. To
maintain the system reliability, it is desirable to study
the impact of the contingency on the power system, and
to categorize them based on their severities. The change
in loading margin to voltage collapse when line outages
occur is estimated, a nose curve is computed by
continuation to obtain a nominal loading margin. Then
linear and quadratic sensitivities of the loading margin
to each contingency are computed and used to estimate
the resulting change in the loading margin [5]. A Fuzzy
Set theory based algorithm is used to identify the weak
buses in a power system. Bus voltage and reactive
power loss at that bus are represented by membership
functions for voltage stability study [6]. Newton
optimal power flow is used to identify the weakest bus /
area, which is likely to cause voltage collapse. The

2 Fuzzy Logic Based Power System Contingency Ranking
Copyright © 2013 MECS I.J. Intelligent Systems and Applications, 2013, 03, 1-12
complex power – voltage curve is examined through
Newton optimal power flow. The indicator, which
identifies the weakest bus, was obtained by integrating
all the marginal costs via Kuhn-Tucker theorem [7]. A
Fast Voltage Stability Index is used to estimate the
maximum loadability for identification of weak bus.
The indicator is derived from the voltage quadratic
equation at the receiving bus in a two bus system. The
load of a bus, which is to be ranked is increased till
maximum value of FVSI is reached and this load value
is used as an indicator for ranking the bus [8]. A weak
bus-oriented criterion is used to determine the candidate
buses for installing new VAR sources in VAR planning
problem. Two indices are used to identify weak buses
based on power flow Jacobian matrix calcu lated at the
current operating point of the system [9]. A neural
network method for the identification of voltage weak
buses/areas uses singular value decomposition method.
Kohonen neural network is trained to cluster/rank buses
in terms of voltage stability [10].
In this paper, analysis of voltage behavior has been
approached using static techniques, which have been
widely used on voltage stability analysis. An accurate
knowledge of how close the actual system’s operating
point is from the voltage stability limit is crucial to
operators. Therefore, to find a voltage stability index
has become an important task for many voltage stability
studies. These indices provide reliable information
about proximity o f voltage instability in a power system.
Usually, their values change between 0 (no load) and 1
(voltage collapse).
Firstly, FVSI was utilized as the measurement to
indicate the voltage stability condition in the maximum
loadability identificat ion at several load buses, then
Fuzzy logic based algorithm for contingencies ranking
is presented. Hence the L.F index and FVSI are used as
a static voltage collapse proximity indicators. In order
to evaluate the fuzzy logic based algorithm, so results
obtained will be compared with FVSI results . The
results of contingency analysis and maximum
loadability can be used as a guide for controlling and
planning of power systems. The approach is tested on
IEEE 14 and 30 bus test systems.
II. Static Voltage Stability Indicators
2.1 Fast Voltage Stability Index (FVSI)
Voltage stability index proposed by I.Musirin et al.
[11] can be conducted on a system by evaluating the
voltage stability referred to a line. The voltage stability
index referred to a line is formulated from the 2-bus
representation of a system. The voltage stability index
developed is derived by first obtaining the current equation through a line in a 2-bus system. Representation of the system illustrated in Fig. 1
Fig. 1: 2- bus system model
XV
QZFVSI
i
j
ij
2
24
(1)
Where,
Z: line impedance
X: line reactance
Qj: reactive power at the receiving end
Vi: sending end voltage
2.2 Line Flow Index (L.F)
The Line Flow (L.F) index proposed by
M.Moghavvemi et al. [12] investigates the stability of
each line of the system and they are based on the
concept of maximum power transferred through a line
as shown in Fig. 2.
Fig. 2: A transmission line of a power system network
)(
.MAXR
R
P
PFindexL
(2)
Fuzzy Logic Based Power System Contingency Ranking 3
Copyright © 2013 MECS I.J. Intelligent Systems and Applications, 2013, 03, 1-12
Where the value of PR is obtained from conventional
power flow calculations, and PR(max) is the maximum
active that can be transferred through a line. The Line
Flow index varies from 0 (no load condition) to 1
(voltage collapse).
ll
i
MAXRZ
VP
cos1
cos
2
2
)(
Where Vi is the voltage magnitude of sending bus of
branch i-j, Zl and θl are the magnitude and angle of
branch impedance respectively , Ф = arctan (Qj / Pj)
III. Determination of Max. Laudability
Maximum loadability identificat ion is important part
of the power systems study. It is conducted in power
transmission system in order to identify the maximum
permissible load that can be sustained by a load bus.
Two reliability test system IEEE 14-Bus and IEEE 30-
Bus [13] were utilized for this test which involved
experiment on several load buses in both test system.
3.1 IEEE-14 case study
In the IEEE 14; three load buses were chosen namely
buses 5, 12 and 14 for the tests. These buses were
selected main ly due to the types of transmission lines
that were connected to them. First, bus 5 was chosen
because it represented the few buses connecting the
main transmission lines (including the voltage-
controlled buses and slack bus) in the system and buses
12 and 14 were chosen randomly among the load buses
(distribution buses). Tests were conducted by gradually
increasing the reactive power loading at selected bus
and the FVSI values for line connected to this bus was
calculated accordingly. The reactive power loading at
the selected bus was increased in stages until it reaches
its voltage stability limit indicated by FVSI value close
to unity. The results for the FVSI values and voltage
magnitude recorded.
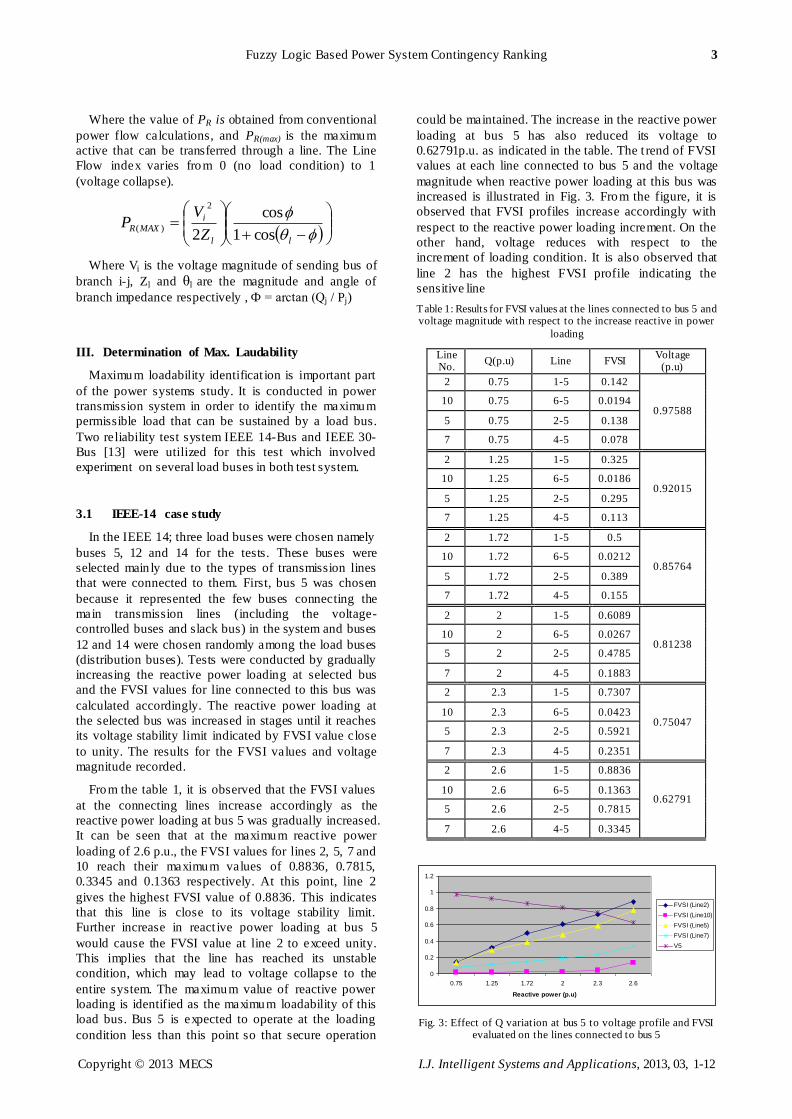
From the table 1, it is observed that the FVSI values
at the connecting lines increase accordingly as the
reactive power loading at bus 5 was gradually increased.
It can be seen that at the maximum react ive power
loading of 2.6 p.u., the FVSI values for lines 2, 5, 7 and
10 reach their maximum values of 0.8836, 0.7815,
0.3345 and 0.1363 respectively. At this point, line 2
gives the highest FVSI value of 0.8836. This indicates
that this line is close to its voltage stability limit.
Further increase in react ive power loading at bus 5
would cause the FVSI value at line 2 to exceed unity.
This implies that the line has reached its unstable
condition, which may lead to voltage collapse to the
entire system. The maximum value of reactive power
loading is identified as the maximum loadability of this
load bus. Bus 5 is expected to operate at the loading
condition less than this point so that secure operation
could be maintained. The increase in the reactive power
loading at bus 5 has also reduced its voltage to
0.62791p.u. as indicated in the table. The t rend of FVSI
values at each line connected to bus 5 and the voltage
magnitude when reactive power loading at this bus was
increased is illustrated in Fig. 3. From the figure, it is
observed that FVSI profiles increase accordingly with
respect to the reactive power loading increment. On the
other hand, voltage reduces with respect to the
increment of loading condition. It is also observed that
line 2 has the highest FVSI profile indicating the
sensitive line
Table 1: Results for FVSI values at the lines connected to bus 5 and voltage magnitude with respect to the increase reactive in power
loading
Line No.
Q(p.u) Line FVSI Voltage
(p.u)
2 0.75 1-5 0.142
0.97588 10 0.75 6-5 0.0194
5 0.75 2-5 0.138
7 0.75 4-5 0.078
2 1.25 1-5 0.325
0.92015 10 1.25 6-5 0.0186
5 1.25 2-5 0.295
7 1.25 4-5 0.113
2 1.72 1-5 0.5
0.85764 10 1.72 6-5 0.0212
5 1.72 2-5 0.389
7 1.72 4-5 0.155
2 2 1-5 0.6089
0.81238 10 2 6-5 0.0267
5 2 2-5 0.4785
7 2 4-5 0.1883
2 2.3 1-5 0.7307
0.75047 10 2.3 6-5 0.0423
5 2.3 2-5 0.5921
7 2.3 4-5 0.2351
2 2.6 1-5 0.8836
0.62791 10 2.6 6-5 0.1363
5 2.6 2-5 0.7815
7 2.6 4-5 0.3345
0
0.2
0.4
0.6
0.8
1
1.2
0.75 1.25 1.72 2 2.3 2.6
Reactive power (p.u)
FVSI (Line2)
FVSI (Line10)
FVSI (Line5)
FVSI (Line7)
V5
Fig. 3: Effect of Q variation at bus 5 to voltage profile and FVSI evaluated on the lines connected to bus 5

4 Fuzzy Logic Based Power System Contingency Ranking
Copyright © 2013 MECS I.J. Intelligent Systems and Applications, 2013, 03, 1-12
Table 2: Results for FVSI values at the lines connected to bus 12 and
voltage magnitude with respect to the increase reactive in power loading
Line No.
Q(p.u) Line FVSI Voltage
(p.u)
12 0.2 6-12 0.1485 1.0154
19 0.2 13-12 0.1147
12 0.35 6-12 0.2626 0.95606
19 0.35 13-12 0.2421
12 0.45 6-12 0.3532 0.90617
19 0.45 13-12 0.3446
12 0.565 6-12 0.4876 0.8275
19 0.565 13-12 0.5
12 0.65 6-12 0.6278 0.74505
19 0.65 13-12 0.6721
12 0.715 6-12 0.8646 0.60021
19 0.715 13-12 0.9881
The trend of FVSI values at each line connected to
bus 12 and the voltage magnitude when reactive power
loading at this bus was increased is illustrated in Fig. 4
0
0.2
0.4
0.6
0.8
1
1.2
0.2 0.35 0.45 0.565 0.65 0.715
Reactive power (p.u)
FVSI (Line12)
FVSI (Line19)
V12
Fig. 4: Effect of Q variation at bus 12 to voltage profile and FVSI
evaluated on the lines connected to bus 12 Table 3: Results for FVSI values at the lines connected to bus 14 and voltage magnitude with respect to the increase reactive in power
loading
Line
No. Q(p.u) Line FVSI
Voltage
(p.u)
17 0.1 9-14 0.072 1.025
20 0.1 13-14 0.062
17 0.2 9-14 0.138 1.0031
20 0.2 13-14 0.136
17 0.35 9-14 0.262 0.94834
20 0.35 13-14 0.242
17 0.5 9-14 0.4121 0.87134
20 0.5 13-14 0.3759
17 0.57 9-14 0.5 0.82192
20 0.57 13-14 0.457
17 0.65 9-14 0.6274 0.74853
20 0.65 13-14 0.5769
17 0.727 9-14 0.88034 0.58707
20 0.727 13-14 0.8288
The trend of FVSI values at each line connected to
bus 14 and the voltage magnitude when reactive power
loading at this bus was increased is illustrated in Fig. 5
0
0.2
0.4
0.6
0.8
1
1.2
0.1 0.2 0.35 0.5 0.57 0.65 0.727
Reactive power (p.u)
FVSI (Line 17)
FVSI (Line20)
V14
Fig. 5: Effect of Q variation at bus 14 to voltage profile and FVSI evaluated on the lines connected to bus 14
3.2 IEEE-30 case study
In the IEEE 30; four load buses were chosen namely
buses 4, 14, 24 and 30 fo r the tests. Tests were
conducted by gradually increasing the reactive power
loading at selected bus and the FVSI values for line
connected to this bus was calculated accordingly. The
reactive power loading at the selected bus was increased
in stages until it reaches its voltage stability limit
indicated by FVSI value close to unity. The results for
the FVSI values and voltage magnitude recorded.
Table 4: Results for FVSI values at the lines connected to bus 4 and voltage magnitude with respect to the increase reactive in power
loading
Line No.
Q (p.u) Line FVSI Voltage
(p.u)
4 0.6 3-4 0.02
0.97675 3 0.6 2-4 0.1208
7 0.6 6-4 0.0676
15 0.6 12-4 0.0446
4 1 3-4 0.0542
0.93596 3 1 2-4 0.212
7 1 6-4 0.0912
15 1 12-4 0.0346
4 2 3-4 0.1883
0.79208 3 2 2-4 0.5
7 2 6-4 0.1764
15 2 12-4 0.0598
4 2.2 3-4 0.2351
0.74672 3 2.2 2-4 0.5889
7 2.2 6-4 0.2045
15 2.2 12-4 0.0814
4 2.43 3-4 0.3496
0.64364 3 2.43 2-4 0.7501
7 2.43 6-4 0.2651
15 2.43 12-4 0.1966

Fuzzy Logic Based Power System Contingency Ranking 5
Copyright © 2013 MECS I.J. Intelligent Systems and Applications, 2013, 03, 1-12
From the table 4, it is observed that the FVSI values
at the connecting lines increase accordingly as the
reactive power loading at bus 4 was gradually increased.
It can be seen that at the maximum react ive power
loading of 2.43 p.u., the FVSI values for lines 3, 4, 7
and 15 reach their maximum values of 0.7501, 0.3496,
0.2651 and 0.1966 respectively. At this point, line 3
gives the highest FVSI value of 0.7501 this indicates
that this line is close to its voltage stability limit.
Further increase in react ive power loading at bus 4
would cause the FVSI value at line 3 to exceed unity.
This implies that the line has reached its unstable
condition, which may lead to voltage collapse to the
entire system. The maximum value of reactive power
loading is identified as the maximum loadability of this
load bus. Bus 4 is expected to operate at the loading
condition less than this point so that secure operation
could be maintained. The increase in the reactive power
loading at bus 4 has also reduced its voltage to 0.64364
p.u. as indicated in the table. The trend of FVSI values
at each line connected to bus 11and the voltage
magnitude when reactive power loading at this bus was
increased is illustrated in Fig. 6. From the figure, it is
observed that FVSI profiles increase accordingly with
respect to the reactive power loading increment. On the
other hand, voltage reduces with respect to the
increment of loading condition. It is also observed that
line 3 has the highest FVSI profile indicating the
sensitive line.
0
0.2
0.4
0.6
0.8
1
1.2
0.6 1 2 2.2 2.43
Reactive power (p.u)
FVSI (Line4)
FVSI (Line3)
FVSI (Line7)
FVSI (Line15)
V4
Fig. 6: Effect of Q variation at bus 4 to voltage profile and FVSI evaluated on the lines connected to bus 4
Table 5: Results for FVSI values at the lines connected to bus 14 and voltage magnitude with respect to the increase reactive in power
loading
Line
No. Q (p.u) Line FVSI
Voltage
(p.u)
17 0.2 12-14 0.148 1.003
20 0.2 15-14 0.1238
17 0.4 12-14 0.3023 0.92612
20 0.4 15-14 0.3067
17 0.55 12-14 0.4618 0.83414
20 0.55 15-14 0.5
17 0.65 12-14 0.6149 0.74576
20 0.65 15-14 0.694
17 0.72 12-14 0.8285 0.61831
20 0.72 15-14 0.9805
The trend of FVSI values at each line connected to
bus 14 and the voltage magnitude when reactive power
loading at this bus was increased is illustrated in Fig. 7.
0
0.2
0.4
0.6
0.8
1
1.2
0.2 0.4 0.55 0.65 0.72
Reactive power (p.u)
FVSI (Line17)
FVSI (Line20)
V14
Fig. 7: Effect of Q variation at bus 14 to voltage profile and FVSI evaluated on the lines connected to bus 14
Table 6: Results for FVSI values at the lines connected to bus 24 and voltage magnitude with respect to the increase reactive in power
loading
Line No.
Q (p.u) Line FVSI Voltage
(p.u)
31 0.4 22-24 0.2131
0.93672 32 0.4 23-24 0.1583
33 0.4 25-24 0.09
31 0.55 22-24 0.331
0.86083 32 0.55 23-24 0.2449
33 0.55 25-24 0.1839
31 0.695 22-24 0.5
0.75775 32 0.695 23-24 0.3719
33 0.695 25-24 0.3216
31 0.75 22-24 0.6
0.69597 32 0.75 23-24 0.4533
33 0.75 25-24 0.4099
31 0.79 22-24 0.7831
0.58687 32 0.79 23-24 0.6067
33 0.79 25-24 0.567
The trend of FVSI values at each line connected to
bus 24 and the voltage magnitude when reactive power
loading at this bus was increased is illustrated in Fig. 8.
0
0.1
0.2
0.3
0.4
0.5
0.6
0.7
0.8
0.9
1
0.4 0.55 0.695 0.75 0.79
Reactive power (p.u)
FVSI (Line31)
FVSI (Line32)
FVSI (Line33)
V24
Fig. 8: Effect of Q variation at bus 24 to voltage profile and FVSI
evaluated on the lines connected to bus 24
6 Fuzzy Logic Based Power System Contingency Ranking
Copyright © 2013 MECS I.J. Intelligent Systems and Applications, 2013, 03, 1-12
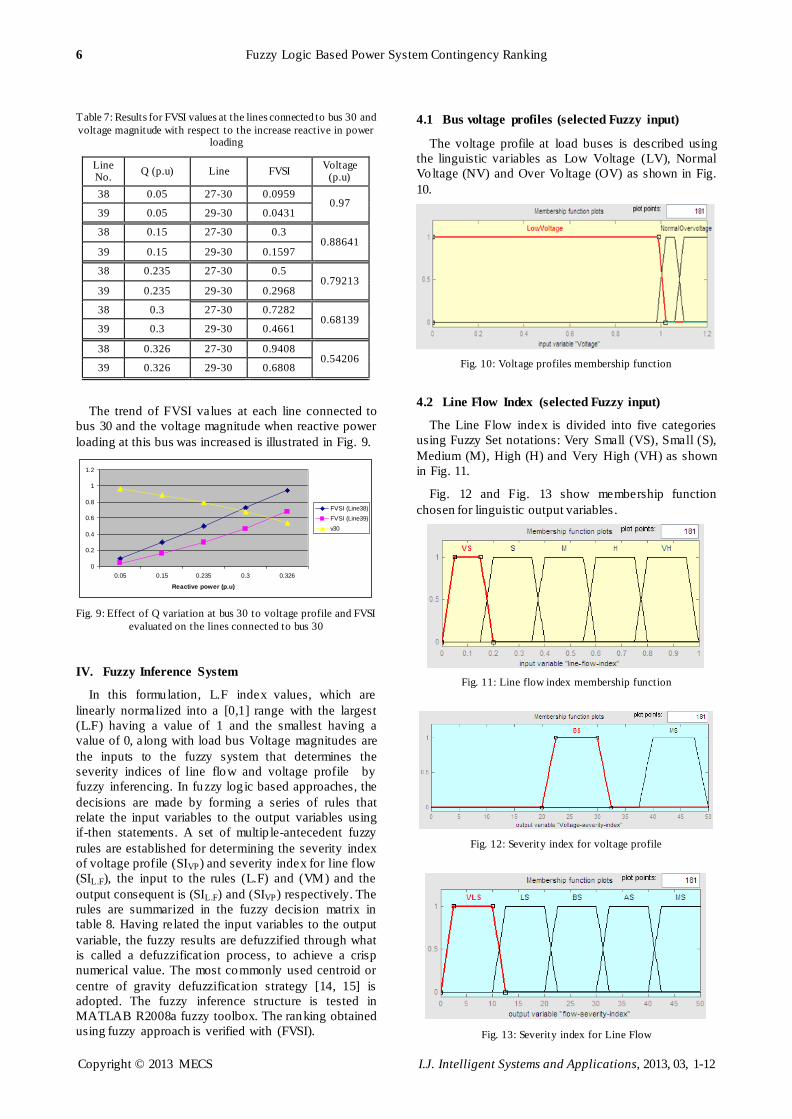
Table 7: Results for FVSI values at the lines connected to bus 30 and
voltage magnitude with respect to the increase reactive in power loading
Line No.
Q (p.u) Line FVSI Voltage
(p.u)
38 0.05 27-30 0.0959 0.97
39 0.05 29-30 0.0431
38 0.15 27-30 0.3 0.88641
39 0.15 29-30 0.1597
38 0.235 27-30 0.5 0.79213
39 0.235 29-30 0.2968
38 0.3 27-30 0.7282 0.68139
39 0.3 29-30 0.4661
38 0.326 27-30 0.9408 0.54206
39 0.326 29-30 0.6808
The trend of FVSI values at each line connected to
bus 30 and the voltage magnitude when reactive power
loading at this bus was increased is illustrated in Fig. 9.
0
0.2
0.4
0.6
0.8
1
1.2
0.05 0.15 0.235 0.3 0.326
Reactive power (p.u)
FVSI (Line38)
FVSI (Line39)
v30
Fig. 9: Effect of Q variation at bus 30 to voltage profile and FVSI
evaluated on the lines connected to bus 30
IV. Fuzzy Inference System
In this formulation, L.F index values, which are
linearly normalized into a [0,1] range with the largest
(L.F) having a value of 1 and the smallest having a
value of 0, along with load bus Voltage magnitudes are
the inputs to the fuzzy system that determines the
severity indices of line flow and voltage profile by
fuzzy inferencing. In fuzzy log ic based approaches, the
decisions are made by forming a series of rules that
relate the input variables to the output variables using
if-then statements. A set of multip le-antecedent fuzzy
rules are established for determining the severity index
of voltage profile (SIVP) and severity index for line flow
(SIL.F), the input to the rules (L.F) and (VM) and the
output consequent is (SIL.F) and (SIVP) respectively. The
rules are summarized in the fuzzy decision matrix in
table 8. Having related the input variables to the output
variable, the fuzzy results are defuzzified through what
is called a defuzzificat ion process, to achieve a crisp
numerical value. The most commonly used centroid or
centre of gravity defuzzificat ion strategy [14, 15] is
adopted. The fuzzy inference structure is tested in
MATLAB R2008a fuzzy toolbox. The ranking obtained
using fuzzy approach is verified with (FVSI).
4.1 Bus voltage profiles (selected Fuzzy input)
The voltage profile at load buses is described using
the linguistic variables as Low Voltage (LV), Normal
Voltage (NV) and Over Voltage (OV) as shown in Fig.
10.
Fig. 10: Voltage profiles membership function
4.2 Line Flow Index (selected Fuzzy input)
The Line Flow index is divided into five categories
using Fuzzy Set notations: Very Small (VS), Small (S),
Medium (M), High (H) and Very High (VH) as shown
in Fig. 11.
Fig. 12 and Fig. 13 show membership function
chosen for linguistic output variables .
Fig. 11: Line flow index membership function
Fig. 12: Severity index for voltage profile
Fig. 13: Severity index for Line Flow

Fuzzy Logic Based Power System Contingency Ranking 7
Copyright © 2013 MECS I.J. Intelligent Systems and Applications, 2013, 03, 1-12
4.3 Fuzzy Rules
The fuzzy rules, which are used for evaluation of
severity indices of bus voltage profiles and line flow
indices, are given in table 8.
Table 8: Fuzzy rules
Input Variable O utput Variable
Voltage SIVP
LV NV OV MS BS MS
L.F index SIL.F
VS S M H VH VLS LS BS AS MS
Where,
VLS: Very Low Severe, LS: Low Severe, BS: Below
Severe, AS: Above Severe, MS: More Severe.
4.4 Fuzzy output (Composite Index)
The overall severity index (Composite index) for a
particular line outage is given by CI = ΣSILF + ΣSIvp
[16] as shown in Fig. 14; Where, ΣSILF is the severity
index of all Line flow index and ΣSIvp is severity index
of all load bus voltage profiles for selected
contingencies. Thus, the overall severity index indicates
the actual severity of the system for a contingency.
Fig. 14: Fuzzy output (Composite Index)
V. Simulation Results
5.1 IEEE-14 bus system
The fuzzy logic approach is tested on IEEE-14 bus
system. The line outages considered for ranking are
listed in table 9.
Table 9: List of selected Contingencies
Contingency No.
Type of Contingency
From to
1 Line Outage 10 11
2 Line Outage 4 9
3 Line Outage 5 6
4 Line Outage 12 13
5 Double Line outage 9 10
13 14
Contingency No.1 analysis:
Tables 10 and table 11 show severity index for
voltage profiles and line flow index calculated using
fuzzy rules
Table 10: Severity indices for voltage profiles
Bus No. Voltage (p.u) SIvp
Bus 4 1.0169 28.3
Bus 5 1.0193 27.6
Bus 7 1.0596 26.3
Bus 9 1.0524 26.3
Bus 10 1.0449 26.3
Bus 11 1.0635 28
Bus 12 1.055 26.3
Bus 13 1.0497 26.3
Bus 14 1.0332 26.3
ΣSIvp = 241.7
8 Fuzzy Logic Based Power System Contingency Ranking
Copyright © 2013 MECS I.J. Intelligent Systems and Applications, 2013, 03, 1-12
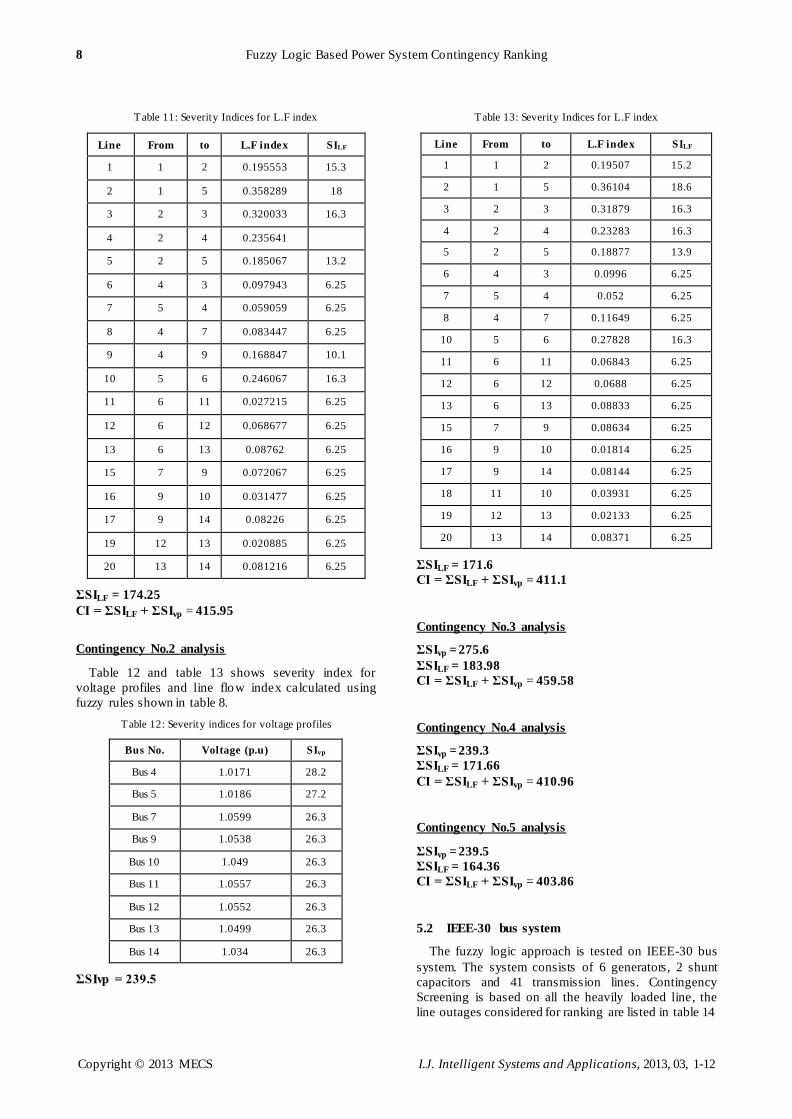
Table 11: Severity Indices for L.F index
Line From to L.F index SILF
1 1 2 0.195553 15.3
2 1 5 0.358289 18
3 2 3 0.320033 16.3
4 2 4 0.235641
5 2 5 0.185067 13.2
6 4 3 0.097943 6.25
7 5 4 0.059059 6.25
8 4 7 0.083447 6.25
9 4 9 0.168847 10.1
10 5 6 0.246067 16.3
11 6 11 0.027215 6.25
12 6 12 0.068677 6.25
13 6 13 0.08762 6.25
15 7 9 0.072067 6.25
16 9 10 0.031477 6.25
17 9 14 0.08226 6.25
19 12 13 0.020885 6.25
20 13 14 0.081216 6.25
ΣSILF = 174.25
CI = ΣSILF + ΣSIvp = 415.95
Contingency No.2 analysis
Table 12 and table 13 shows severity index for
voltage profiles and line flow index calculated using
fuzzy rules shown in table 8.
Table 12: Severity indices for voltage profiles
Bus No. Voltage (p.u) SIvp
Bus 4 1.0171 28.2
Bus 5 1.0186 27.2
Bus 7 1.0599 26.3
Bus 9 1.0538 26.3
Bus 10 1.049 26.3
Bus 11 1.0557 26.3
Bus 12 1.0552 26.3
Bus 13 1.0499 26.3
Bus 14 1.034 26.3
ΣSIvp = 239.5
Table 13: Severity Indices for L.F index
Line From to L.F index SILF
1 1 2 0.19507 15.2
2 1 5 0.36104 18.6
3 2 3 0.31879 16.3
4 2 4 0.23283 16.3
5 2 5 0.18877 13.9
6 4 3 0.0996 6.25
7 5 4 0.052 6.25
8 4 7 0.11649 6.25
10 5 6 0.27828 16.3
11 6 11 0.06843 6.25
12 6 12 0.0688 6.25
13 6 13 0.08833 6.25
15 7 9 0.08634 6.25
16 9 10 0.01814 6.25
17 9 14 0.08144 6.25
18 11 10 0.03931 6.25
19 12 13 0.02133 6.25
20 13 14 0.08371 6.25
ΣSILF = 171.6
CI = ΣSILF + ΣSIvp = 411.1
Contingency No.3 analysis
ΣSIvp = 275.6
ΣSILF = 183.98
CI = ΣSILF + ΣSIvp = 459.58
Contingency No.4 analysis
ΣSIvp = 239.3
ΣSILF = 171.66
CI = ΣSILF + ΣSIvp = 410.96
Contingency No.5 analysis
ΣSIvp = 239.5
ΣSILF = 164.36
CI = ΣSILF + ΣSIvp = 403.86
5.2 IEEE-30 bus system
The fuzzy logic approach is tested on IEEE-30 bus
system. The system consists of 6 generators, 2 shunt
capacitors and 41 transmission lines. Contingency
Screening is based on all the heavily loaded line, the
line outages considered for ranking are listed in table 14

Fuzzy Logic Based Power System Contingency Ranking 9
Copyright © 2013 MECS I.J. Intelligent Systems and Applications, 2013, 03, 1-12
Table 14: List of selected Contingencies
Contingency No. Type of Contingency From to
1 Line Outage 2 5
2 Line Outage 16 17
3 Line Outage 5 7
4 Double Line outage 8 28
6 28
5 Double Line outage 14 15
18 19
Contingency No.1 analysis
Table 15 and table 16 shows severity index for
voltage profiles and line flow index calculated using
fuzzy rules
Table 15: Severity indices for voltage profiles
Bus No. Voltage (p.u) SIvp
Bus3 0.99505 37.9
Bus4 0.98118 43.2
Bus6 0.97038 43.8
Bus7 0.92842 43.8
Bus9 1.0238 26.3
Bus10 1.0171 28.2
Bus12 1.0411 26.3
Bus14 1.0244 26.3
Bus15 1.0178 27.7
Bus16 1.0228 26.3
Bus17 1.0138 30.1
Bus18 1.0051 34.1
Bus19 1.0008 35.8
Bus20 1.004 34.5
Bus21 1.0043 34.4
Bus22 1.0049 34.2
Bus23 1.0034 34.8
Bus24 0.99286 38.7
Bus25 0.98311 42.3
Bus26 0.96479 43.8
Bus27 0.98594 41.1
Bus28 0.96758 43.8
Bus29 0.96527 43.8
Bus30 0.95331 43.8
ΣSIvp = 865
Table 16: Severity Indices for LF index
From To L.F index SILF
1 2 0.212443 16.3
1 3 0.42102 26.3
2 4 0.338385 16.3
3 4 0.109873 6.25
2 6 0.433222 26.3
4 6 0.124829 6.25
7 5 0.323465 16.3
6 7 0.296271 16.3
6 8 0.027194 6.25
6 9 0.062973 6.25
6 10 0.137157 6.25
9 10 0.068137 6.25
4 12 0.269247 16.3
12 14 0.077079 6.25
12 15 0.100466 6.25
12 16 0.07644 6.25
14 15 0.026142 6.25
16 17 0.041595 6.25
15 18 0.059468 6.25
18 19 0.02022 6.25
20 19 0.01551 6.25
10 20 0.061961 6.25
10 17 0.01404 6.25
10 21 0.054117 6.25
10 22 0.051897 6.25
22 21 0.002316 6.25
15 23 0.060376 6.25
22 24 0.05018 6.25
23 24 0.044053 6.25
25 24 0.003431 6.25
25 26 0.076142 6.25
27 25 0.023568 6.25
28 27 0.169291 10.2
27 29 0.10137 6.25
27 30 0.161603 8.68
29 30 0.06504 6.25
28 8 0.004531 6.25
6 28 0.029831 6.25
ΣSILF = 334.23
CI = ΣSILF + ΣSIvp = 1199.23
Contingency No.2 analysis
Table 17 and table 18 shows severity index for
voltage profiles and line flow index

10 Fuzzy Logic Based Power System Contingency Ranking
Copyright © 2013 MECS I.J. Intelligent Systems and Applications, 2013, 03, 1-12
Table 17: Severity indices for voltage profiles
Bus No. Voltage (p.u) SIvp
Bus3 1.0209 26.3
Bus4 1.012 31
Bus6 1.0101 31.9
Bus7 1.0023 35.2
Bus9 1.0495 26.3
Bus10 1.0426 26.3
Bus12 1.0586 26.3
Bus14 1.0435 26.3
Bus15 1.0381 26.3
Bus16 1.0521 26.3
Bus17 1.035 26.3
Bus18 1.0275 26.3
Bus19 1.0244 26.3
Bus20 1.0281 26.3
Bus21 1.0304 26.3
Bus22 1.031 26.3
Bus23 1.0269 26.3
Bus24 1.0204 26.3
Bus25 1.0165 28.5
Bus26 0.99884 36.5
Bus27 1.0227 26.3
Bus28 1.0066 33.5
Bus29 1.0029 35
Bus30 0.99139 39.3
ΣSIvp = 691.7
Contingency No.3 analysis
ΣSIvp = 701.6
ΣSILF = 310.55
CI = ΣSILF + ΣSIvp = 1012.15
Contingency No.4 analysis
ΣSIvp = 793
ΣSILF = 314.15
CI = ΣSILF + ΣSIvp = 1107.15
Contingency No.5 analysis
ΣSIvp = 691.6
ΣSILF = 299.75
CI = ΣSILF + ΣSIvp = 991.35
Table 18: Severity Indices for LF index
From To L.F index SILF
1 2 0.210229 16.3
1 3 0.318498 16.3
2 4 0.202954 16.3
3 4 0.079472 6.25
2 5 0.345205 16.3
2 6 0.257821 16.3
4 6 0.066233 6.25
7 5 0.033011 6.25
6 7 0.079489 6.25
6 8 0.026472 6.25
6 9 0.085544 6.25
6 10 0.171276 10.5
9 10 0.07127 6.25
4 12 0.263275 16.3
12 14 0.070888 6.25
12 15 0.09048 6.25
12 16 0.027741 6.25
14 15 0.021505 6.25
15 18 0.052596 6.25
18 19 0.016665 6.25
20 19 0.016384 6.25
10 20 0.06362 6.25
10 17 0.032211 6.25
10 21 0.050409 6.25
10 22 0.047943 6.25
22 21 0.002559 6.25
15 23 0.048524 6.25
22 24 0.042711 6.25
23 24 0.029169 6.25
25 24 0.00975 6.25
25 26 0.071222 6.25
27 25 0.034026 6.25
28 27 0.175092 11.3
27 29 0.094104 6.25
27 30 0.150227 6.3
29 30 0.060236 6.25
8 28 0.004276 6.25
6 28 0.030325 6.25
ΣSILF = 307.15
CI = ΣSILF + ΣSIvp = 998.85

Fuzzy Logic Based Power System Contingency Ranking 11
Copyright © 2013 MECS I.J. Intelligent Systems and Applications, 2013, 03, 1-12
VI. Performance COMPARISON
In order to evaluate the fuzzy logic based algorithm,
so results obtained will be compared with FVSI results
by calculation of FVSI value fo r every line in the
system using equation (1). Firstly the corresponding
line which gives the highest FVSI must be identified.
During these contingencies No. (1, 2, 3, 4, 5) at IEEE-
14 bus case study, line connected between bus 7 to bus
8 demonstrates the highest FVSI with values 0.1084,
0.1074, 0.1298, 0.1022 and 0.0955 respectively.
At IEEE-30 bus case study, line connected between
bus 9 to bus 11 demonstrates the highest FVSI with
values 0.167, 0.1162, 0.1168, 0.1316 and 0.1139
respectively.
Table 19 and table 20 provide the comparison of
ranking obtained from Fuzzy logic based algorithm and
FVSI method. The rankings obtained from fuzzy logic
method are matched to the results obtained using FVSI
method.
Table 19: Comparison of Contingency Ranking Using Fuzzy logic and FVSI Method at IEEE-14 bus
Contingency No. CI = ΣSILF + ΣSIvp Rank FVSI Rank
1 415.95 2 0.1084 2
2 411.1 3 0.1074 3
3 459.58 1 0.1298 1
4 410.96 4 0.1022 4
5 403.86 5 0.0955 5
Table 20: Comparison of Contingency Ranking Using Fuzzy logic and FVSI Method at IEEE-30 bus
Contingency No. CI = ΣSILF + ΣSIvp Rank FVSI Rank
1 1199.23 1 0.167 1
2 998.85 4 0.1162 4
3 1012.15 3 0.1168 3
4 1107.15 2 0.1316 2
5 991.35 5 0.1139 5
The comparative study shows that there is a close
agreement in the results between Fuzzy algorithm
method and FVSI indicating that this technique is
possible to be implemented practically.
VII. Conclusion
Simultaneous load increase at the selected load buses
was conducted in order to identify the appropriate
loading condition before a system started to lose its
stability, then the contingencies ranked using composite
index provides very useful information about the impact
of the contingency on the system as a whole and helps
in taking necessary control measures to reduce the
severity of the contingency. The fuzzy logic based
algorithm is efficient, simple and effectively ranks the
contingencies. Based on composite index, suitable
location for installing FACTS or any other corrective
actions such as load shedding can be identified to avoid
voltage collapse.
References
[1] Andersson, G.; Donalek "Causes of the 2003 major
grid blackouts in North America and Europe, and
recommended means to improve system dynamic
performance", Power Systems, IEEE Transactions
on Volume 20, Nov. 2005, pp. 1922 - 1928.
[2] Pimjaipong, W.; Junrussa "Blackout Prevention
Plan – The Stability, Reliability and
Security Enhancement in Thailand Power Grid",
Transmission and Distribution Conference and
Exhibition: Asia and Pacific, 2005 IEEE/PES
2005, pp. l - 6.
[3] IEEE Committee Report, "Voltage stability of
power systems: Concepts, analytical tools and
industrial experiences," IEEE Publication No.
90TH0358- 2-PWR, New York, 1990.
[4] Qiuxia Yu et al, ―Adaptability evaluation of
transmission network planning under
deregulation,‖ Universities Power Engineering
Conference, 2007. UPEC 2007. 42nd International
pp. 53-56, 4-6 September 2007

12 Fuzzy Logic Based Power System Contingency Ranking
Copyright © 2013 MECS I.J. Intelligent Systems and Applications, 2013, 03, 1-12
[5] Scott Greene, Ian Dobson and Fernanado L.
Alvarado, ―Contingency Ranking for Voltage
Collapse via Sensitivities from a Single Nose
Curve‖, IEEE Transactions on Power Systems,
Vol.14, No.1, pp. 232-239, Feb 1999.
[6] R. A. Alammari, ―Fuzzy System Applications for
Identification of Weak Buses in Power Systems‖,
The Arabian Journal for Science and Engineering,
Vol. 27, No. 2B, Oct. 2002.
[7] Y.Y. Hong and C.H. Gau, ―Voltage Stability
Indicator for Identification of the Weakest Bus
Area in Power Systems‖, IEE Proceedings
Generation Transmission Distribution, Vol. 144,
No. 4, July 1994.
[8] I. Musirin and T.K. Abdul Rahman, ―Estimating
maximum loadability of weak bus identification
using FVSI‖, IEEE Power Engineering Review,
Nov. 2002.
[9] Y.L. Chen, ―Weak Bus-Oriented Optimal Multi-
objective VAR Planning‖, IEEE Transactions on
power system, Vol.11, No.4, Nov. 1996.
[10] Y.H. Song H.B. Wan, ―Kohonen neural network
based approach to voltage weak buses/area
identification‖, IEE Proceedings Generation
Transmission Distribution, Vol. 144, No. 3, May,
1997.
[11] I. Musirin, ―Novel Fast Voltage Stability Index
(FVSI) for Voltage Stability Analysis in Power
Transmission System‖, Conference on Research
and Development Proceedings, Shah Alam,
Malasia, July 2002.
[12] M. Moghavvemi, O. Faruque ―Real-Time
Contingency Evaluation and Ranking Technique‖ ,
IEEE Proceeding on Generation, Trans mission and
Distribution, Vol. 145, N5, September 1998.
[13] Power System Test Case Archive. Available from:
www.ee.washington.edu.
[14] L.Cox, The Fuzzy systems handbook, 2nd
,
academic press, new york, 1999.
[15] T. Terano, K. Asai, M. Sugeno, Fuzzy system
theory and it’s application academic press, San
Diego, 1991.
[16] Shobha Shankar, Fuzzy Approach to Contingency
Ranking, International Journal of Recent Trends in
Engineering, Vol. 1, No. 1, May 2009
Authors’ Profiles
Almoataz Y. Abdelaziz was born in Cairo, Egypt, on
September 14, 1963. He received the B. Sc. and M. Sc.
degrees in electrical engineering from Ain Shams
University, Cairo, Egypt in 1985, 1990 respectively and
the Ph. D. degree in electrical engineering according to
the channel system between Ain Shams University,
Egypt and Brunel University, England in 1996. He is
currently a professor of electrical power engineering in
Ain Shams University. His research interests include
the applications of art ificial intelligence to power
systems and protection and new optimization
techniques in power systems operation and planning.
He has authored or coauthored more than 120 refereed
journal and conference papers. Dr. Abdelaziz is a
member of the editorial board and a reviewer of
technical papers in several journals. He is also a
member in IET, IEEE and the Egyptian Sub-
Committees of IEC and CIGRE`. Dr. Abdelaziz has
been awarded Ain Shams University Prize for d istinct
researches in 2002 and for international publishing in
2010, 2011 and 2012.
A. T. M. Taha was born in Egypt in 1957. He received
the B.Sc. and M. Sc. degrees in electrical engineering
from Ain Shams University, Cairo, Egypt, and the Ph.D.
degree in electrical engineering from Poly-technique
Academy, Bella Russia, in 1994. He is currently an
Assistant Professor in the Department o f Electric Power
and Machines, Ain Shams University. His research
interests include power system analysis.
M. A. Mostafa was born in Egypt in 1959. He received
the B.Sc. and M.Sc. degrees in electrical engineering
from Ain Shams University, Cairo, Egypt, and the
Ph.D. degree in electrical engineering from Ain Shams
University with joint supervision from Dalhousie
University, Halifax, Canada, in 1995. He is currently a
Professor in the Department of Electric Power and
Machines, Ain Shams University. His research interests
include power system analysis.
A. M. Hassan was born in Riyadh, KSA in 1982. He
received the B. Eng. Degree and M. Sc. in electrical
engineering from Ain Shams University in Cairo, Egypt
in 2004 and 2012, respectively. Currently he is an
electrical engineer in Badr El Din Petroleum Company
(BAPETCO). His research interests include the
application of art ificial intelligent techniques to power
systems operation, protection and planning.
How to cite this paper: A. Y. Abdelaziz, A. T. M. Taha, M. A. Mostafa, A. M. Hassan,"Fuzzy Logic Based Power System
Contingency Ranking", International Journal of Intelligent
Systems and Applications(IJISA), vol.5, no.3, pp.1-12,
2013.DOI: 10.5815/ijisa.2013.03.01