fuzzy logic scheme for tip-sample distance control for a ... · fuzzy logic scheme for tip‐sample...
TRANSCRIPT

886 Vol. 11, December 2013
Fuzzy logic scheme for tip-sample distance control for a low cost near field optical microscope J. A. Márquez1, R. Cortés2, H. R. Siller*1, V. Coello2, D. Escamilla1
1 Centro de innovación en Diseño y Tecnología Tecnológico de Monterrey Monterrey, Nuevo León, México *[email protected] 2 Centro de Investigación Científica y de Educación Superior de Ensenada CICESE, Monterrey Km 9.5 Nueva carretera al Aeropuerto. PIIT. Apodaca, Nuevo León, México ABSTRACT The control of the distance between the surface and the tip-sample of a Scanning Near Field Optical Microscope (SNOM) is essential for a reliable surface mapping. The control algorithm should be able to maintain the system in a constant distance between the tip and the surface. In this system, nanometric adjustments should be made in order to sense topographies at the same scale with an appropriate resolution. These kinds of devices varies its properties through short periods of time, and it is required a control algorithm capable of handle these changes. In this work a fuzzy logic control scheme is proposed in order to manage the changes the device might have through the time, and to counter the effects of the non-linearity as well. Two inputs are used to program the rules inside the fuzzy logic controller, the difference between the reference signal and the sample signal (error), and the speed in which it decreases or increases. A lock-in amplifier is used as data acquisition hardware to sample the high frequency signals used to produce the tuning fork oscillations. Once these variables are read the control algorithm calculate a voltage output to move the piezoelectric device, approaching or removing the tip-probe from the sample analyzed. Keywords: Low-cost SNOM, fuzzy logic, nanometric control, shear-force. RESUMEN El control de la distancia entre la superficie y la punta de sensado de un microscopio de escaneo de campo cercano (SNOM por sus siglas en inglés) es esencial para un mapeo superficial confiable. El algoritmo de control tiene que ser capaz de mantener al sistema a una distancia constante entre la punta y la superficie de interés. Se requieren ajustes nanométricos para poder recuperar una topografía con una resolución apropiada, debido a que los cambios en la superficie son en escala nanométrica. Este tipo de dispositivos cambian sus propiedades a lo largo de un periodo de tiempo muy corto, para resolver este problema se necesita un algoritmo de control que sea capaz de manejar estos cambios. En este trabajo se propone un esquema de lógica difusa para de esta manera poder compensar los cambios que el dispositivo pueda presentar a través del tiempo, y para contrarrestar los efectos producidos por la no linealidad que presenta el sistema. Dos entradas fueron usadas para programar las reglas utilizadas en el controlador de lógica difusa, la diferencia entre la señal de referencia y la señal retroalimentada (error), y la velocidad en la cual disminuye o aumenta. Como dispositivo de adquisición de datos se utilizó un amplificador de amarre de fase para leer las señales de alta frecuencia usadas para producir las oscilaciones del diapasón de cuarzo. Una vez que se adquieren estas variables podemos manipularlas por medio del algoritmo de control para calcular una salida de voltaje la cual mueve el dispositivo piezoeléctrico, retrayendo o extendiendo la punta hacia la muestra analizada. 1. Introduction Recent control methods have been adapted to a huge diversity of systems, due to the rapid growth in technology and process applications [1]. In the case of fuzzy logic, it is a versatile method useful for non-linear processes or systems that are imprecise by definition [2]. This could provide robustness for some applications, like the control of tuning fork
piezoelectric systems commonly used in Shear-force Near-Field Optical Microscopes (SNOM’s). Usually this kind of devices uses PI or PID controllers, which for more common industrial applications are appropriate solutions. A PID controller has a quick control response, allowing the processes to fulfil the desire behaviour, but for higher resolution images the

Fuzzy logic scheme for tip‐sample distance control for a low cost near field optical microscope, J. A. Márquez et al. / 886‐894
Journal of Applied Research and Technology 887
scanning rate should be improved. Most strategies to get this resolution have been focused in the modification of the tuning fork features like Q-factor instead of controller design [3]. This Q-factor is defined by ∆⁄ , where ∆ means full frequency width at the half-maximum of the tuning fork amplitude resonance, and is the resonance frequency [4]. The SNOM implemented in this work uses a shear-force technique consisting in a fiber that maintains a constant amplitude vibration through a control mechanism. In this scheme, a tip-probe is perpendicularly aligned to the sample as it approaches to the surface in a horizontal array. Typically, the device vibrates laterally at one of its fundamental mechanical resonance modes, in the range of 10-100 KHz, in which the vibration is reduced due the presence of shear forces [3]. In order to generate the vibration mode of the tip, a quartz tuning fork (QTF) is implemented. This sensing device has been used in many applications as a mean of signal sensing, particularly for acoustic and force microscopy. Due to its physical feature consisting in a high mechanical quality factor Q, the tuning fork provides a very high sensitivity. By using a quartz tuning fork in the sensing task, the setup can perceive an electrical signal proportional to the shear forces that attenuate the vibration of the probe. This property make the sensing task practical to implement and operate, compared to optical force measurements techniques. Furthermore, it can be designed to work in any frequency between 10 and 150 KHz [3]. Shear-force distance regulation has practically become a standard component of most SNOMs today. Its development was primarily driven by the need for enabling the image of non-conducting and conducting surfaces. The tip in the other hand has an important role in the sensing task; it should be built carefully to fit inside the depression of the sample and gather information about the topography. If the tip is too wide it could stock in a depression of the sample and the scanning resolution could be affected [5]. Additionally, systems which are able to combine the SNOM with other kind of technologies have been built, like the Atomic Force Microscope
(AFM). This microscope is capable to sense the physical characteristics of the surface, and the valuable optical information that a tip of optic fiber can gather. This arrangement allows the system to use both technologies; as a consequence the outcome configuration built with a dual feedback control. This scheme makes the system capable to receive optical and physical information [6]. Several changes have been made to SNOM technology through years, not only in the sensing section but in the setup. For example, novel techniques as Phase-lock improve the starting time avoiding the phase sweep, enabling the working point of the quartz tuning fork [7]. The recent SNOM perceives two different sources of information, it is capable to provide physical information sensing the shear-force of the surfaces, and gathering at the same time optical information. It is important to point out that both the physical and the optical data are obtained with the same part of the device, the tip, which is generally based in two principles: a localized source or a sub-wavelength sink built in the cut-off region of an optical fiber. The localized source can be a fluorescent molecule, a quantum dot, a plasmonic edge mode or a nano-metallic particle. The sub-wavelength is simply an aperture opened inside a metal coated optical fiber, which has been elongated below its cut-off diameter [8]. The SNOM is an instrument capable of evolving according to the technology growth, its operation principle makes it modular, as an opportunity to improve the existing components and develop new ones. There is no need to change the entire system. The challenges to surpass are the sample speed and the cost reduction of the device itself. This work describes a low cost SNOM hardware structure, and proposed fuzzy logic as an appropriate principle for controlling the accuracy of the system in nanoscale positioning. The tuning fork can be replaced for a bimorph-based cantilever incorporating Q-enhancement feedback. Working as a shear-force sensor, the bimorph-based cantilever is very sensitive and particularly suitable for biological imaging in liquid [9]. Also the tip holder can be modified to obtain better results, according this research, changing the classical SNOM into a more specialized instrument for some surface samples [10].
Fuzzy logic scheme for tip‐sample distance control for a low cost near field optical microscope, J. A. Márquez et al. / 886‐894
Vol. 11, December 2013 888
2. Theoretical framework The use of Fuzzy Logic in order to control a physical system helps to manipulate the process using human way of thinking. It’s distinguishing mark in rule-based systems [11; 12], is the ability to deal with situations in which making a sharp distinction between boundaries is very difficult [13]. All decisions are made based on propositional variables, which can be some characteristics of the system response. For example, the error can be divided in several cases like very big, positive, small, zero, etc., everyone have values in the close interval of [0 1] [14]. Fuzzy Logic technique can be separate in four concepts [12, 13]: Fuzzy sets: Sets with smooth boundaries.
Linguistic variables: Variables whose values
are both qualitatively and quantitatively describe by a fuzzy set.
Possibility distributions: Constrains on the
value of a linguistic variable imposed by assigning it a fuzzy set.
Fuzzy if-then rules: A knowledge
representation scheme for describing a functional mapping or a logic formula that generalizes an implication in two-valued logic.
In the Fuzzy inference engine, Fuzzy Logic principles are used to combine Fuzzy if-then rules. There are several configurations for the interpretations of these rules called inference engines. Most commons are Mamdani implication, Takashi-Segeno-Kang (TSK) model and Tsukamoto model [15]. In this work, Mamdani type is used in order to manipulate the inputs, multiple antecedents by some rules combinations and by t-norms [16]. When a Mamdani-type Fuzzy Logic base-rule system is considered to compose the model structure, the linguistic fuzzy model so obtained consists of a set of linguistic descriptions regarding the behavior of the system being modeled [17]. The inputs are the error ( ), and the change rate of the error value (∆ ) with a sampling time ( ). These two variables are measured and calculated in order to produce the control response ( ) at a time ( ). This control response is the one keeping the system in the work point the entire mapping process. It makes the tip-probe get closer
or move farther to the surface in order to gather topographic data. To calculate e the current process output , the desire process output is needed. As well the current error and the previous error 1 are needed to calculate ∆ . The equations below show the calculus of both error parameters (Eq. 1 and Eq. 2):
(1) ∆ 1 (2) The output of the control ( ) is calculated through the centroid defuzzifier technique, being μ and μ membership functions the centroid defuzzifier is given as (Eq. 3):
(3) Where the membership function for the output set A has been discretized into N points [16]. 3. Research approach 3.1 Experimental setup The experiment setup is shown in Figure 1. The main components in this setup are data acquisition, digital control and amplification. This system is able to approach surfaces at nanometer distance. The SNOM configuration consists of a combination of low cost components and commercial devices, reducing the final investment. The quality of SNOM images is largely governed by the light-transmitting aperture defined at the probe tip shown in Figure 2. Nowadays, low cost piezoelectric actuators are well-known commercial devices able to achieve high displacement resolution. The hardware configuration value does not exceed $15,000 US dollars. For amplifying signals, a STANFORD SR830 is a lock-in amplifier with a sampling time up to 102 kHz combined with a self-digital function generator making the whole system more centralized. A sinusoidal electrical signal from the lock-in amplifier is used to excite the quartz tuning fork (32.768 kHz) providing a RMS value proportional to the oscillation amplitude. This value is sent to a DAQ device NI USB-6009, with a sampling time up

Fuzzy logic scheme for tip‐sample distance control for a low cost near field optical microscope, J. A. Márquez et al. / 886‐894
Journal of Applied Research and Technology 889
to 48 Kb/S. Here the mathematical actions needed to calculate a voltage output to move the piezoelectric PZT actuator are calculated.
Figure 1. Experimental setup diagram (Numbers are explained in Table 1)
Table 1. Figure 1 Line descriptions The tuning fork with the tip-probe coupled is attached to the bimorph PZT plates excited with the voltage output of the DAQ amplified, allowing the system to sense and move in nanoscale. For this setup, an amplifier circuit (Table 1), has the task to amplify the outcome voltage of the DAQ. This setup generates initially 0-5 volts (DAQ), sufficient to reach up to 160 volts with an Apex PA88 amplifier. This voltage changes cause the movement of the plates of the bimorph PZT and consequently, the tuning fork and the optic fiber tip-probe movement to explore the sample surface. The software used for programming the different functions of the system, and for developing the interface is LabVIEW 2010. According to Fuzzy Logic scheme, both fuzzy engine and defuzzification were programed by the user. No
fuzzy logic toolkits were implemented to help neither the data processing nor the control actions.
Figure 2. Tip-sample dimensions, in the left the length of the tip is compared with a millimeter ruler, and in the right
side is compared with the width of a needle 3.2 Control optimization The control algorithm was optimized, allowing the system to have a better resolution and a faster response. This upgrade makes the error between the reference point and the current position converges to zero faster and smoother, showing accurate information about the topography of the sample surface. Figure 3 show the membership functions of both inputs and the output of the fuzzy logic control are triangular in the middle. The functions on the sides are linear with saturation reaching the value of 1. There are no singletons, in order to improve resolution. All the functions are continuous and there are 3 membership functions for every input as well for the output, which are negative (N), zero (Z) and positive (P). See Table 2. The Fuzzy Logic algorithm processed the inputs of the system and calculates an output which is called u. This u is the amount of voltage it has to be added to the current voltage (DAQ output) in order to reduce e (error). Eventually the addition of these small values will make the system reach the desire value or position. It is important to choose the correct values for the control action, because high values can make the process unstable, and low values can make it slow. To fulfill the control task this parameters have to be a very accurate values. Large voltage changes are needed to move the system fast but not too large to produce oscillations that will more time to stabilize.

Fuzzy logic scheme for tip‐sample distance control for a low cost near field optical microscope, J. A. Márquez et al. / 886‐894
Vol. 11, December 2013 890
Figure 3. Fuzzy Logic membership functions
Table 2. Rules of the Fuzzy Logic 3.3 Auto-Tune Algorithm Figure 4 shows the frequency sweep of tuning fork. The main purpose of the Auto-Tune Algorithm is to increase system efficiency to save time when the tuning fork is tuned at its maximum resonance frequency. Localize the optimal point with the bare eye is a difficult task. The nearest the tuning is excited to its maximum sensibility more accurate measures will be obtained. Manual tunes takes approximately 1 or 2 minutes depending on the experience of the operator. With the proposed algorithm the tuning operation takes approximately 10 seconds, enabling the system to work at its greater sensing potential. The proposed auto tuning algorithm has the following steps: 1) Frequency sweep: A sweep that covers frequencies before the maximum (-500Hz) and after (+500Hz) is expected. 2) Recording data: Save the data corresponding to the amplitude and the frequency of the whole sweep.
3) Assign the frequency: Once the sweep finish, take the value of frequency where the amplitude is greater than the others. For this procedure a computer compatible function generator is needed so it can be programed with the aid of LabVIEW or any other software.
Figure 4. Frequency sweep of a tuning fork 3.4 Shear-force location In order to conduct the tip to a shear force section, 2 different approaches have to be done: 1) Large scale approximation: The first step to get closer to the sample surface should be done by micrometrical steps. The surface and the tip are separated by micrometers to protect the tip from collisions cause from vibration and external interaction. These steps increase the speed of the system and decrease the set up time. 2) Small scale approximation: Once the system is close enough to be reachable by the bimorph piezoelectric, the device move the tip until it sensed the shear-force section. The most sensible approach is the large scale. The shear-force area is small and the steps made in this point are capable of breaking the tip if the surface is hit. A distance reference indicator is needed to know when should be the right time to change to the small scale approximation.

Fuzzy logic scheme for tip‐sample distance control for a low cost near field optical microscope, J. A. Márquez et al. / 886‐894
Journal of Applied Research and Technology 891
For approaching the system to the large scale Young’s interference fringes were used. The propagating components produced by this phenomenon are collected with a CCD camera, and the interference fringes are observed [18]. This particular arrangement is based in a He-Ne laser (638 nm) introduced to one side of the tip, which goes out to the other end (the sharp end) closer to the sample surface used to sense the shear-force. The sample surface is a glass prism used like a mirror, which reflects the light conducted by the tip simulating another source of light (a virtual light source). The light of this new source interacts with the light of the tip. When both sources are close enough the interference fringes appears like vertical straight lines shown in Figure 5. Getting closer to the sample surface makes the lines to increase its area and move to the right side of the screen. As a consequence some lines don’t fit the camera sight and the remains become wider. An example of this variation is shown in Figure 5. For this experiment the large scale approximation is done until only one red line fits the entire screen of the webcam’s view. The small scale approximation starts once the system approach using large scale procedure is done. This approach is made through software with the interface made in LabVIEW, and end when the system decreases the value of its oscillation amplitude. This oscillation is produced by the sinusoidal signal exited with the lock-in amplifier, that decrease in amplitude means the shear-force area is located.
Figure 5. Interference fringes created at the sample surface (a) shoes the fringes form when the tip is far
away, while (b) shows the fringes when the tip is closer to the sample
4. Experimental results An example of the control response of the system setup described before is depicted in Figure 6. Using the Fuzzy Logic algorithm, the figure shows the speed and stability this control method can reach. A response of the system using a PID controller is shown in Fig. 8, in order to compare performance between these two methods. Both experiments were designed for forcing the system to move, and were made with similar environmental conditions (same day, same location) with the tuning fork tuned at the same frequency. The experiments consisted in changing the reference position in equal magnitudes, in a condition in which the process should reach the position the shortest time possible, keeping the position until other change in reference occurs. Several features of control quality can be discovered by these tests. In this experiment settling time, overshoot and steady state error were measured and compared. The faster the system can reach the desire position, shorter the time of the mapping process. Increasing stability can make the system resolution improve either, which means more details of the sensed surface can be gathered in a single mapping task.
Figure 6. System response with fuzzy logic feedback control algorithm
The Figure 6 shows how the system reacts to changes in the reference position with the proposed fuzzy control scheme. The time to reach

Fuzzy logic scheme for tip‐sample distance control for a low cost near field optical microscope, J. A. Márquez et al. / 886‐894
Vol. 11, December 2013 892
the targeted position is between 8 and 11 milliseconds for changes of 0.1 millivolts of magnitude. The stability according to these parameters is ±0.01 millivolt which allows the system to resolve surfaces within these boundaries. The control surface of the algorithm is shown in Figure 7, in which the variation of the amplitude represents changes in position. Small amplitudes mean the surface is close to the tip, while greater amplitudes represent the surface moving away from the tip. This means that changing the amplitude set point is equal to force the system to move the tip away or closer to the sample surface. As Figure 8 shows, a very remarkable difference can be observed with the PID controller. The system reacts as fast as the configuration with the Fuzzy Logic method, but the stability is much better for the Fuzzy algorithm. The PID controller makes the system stabilized between 8 and 10 millisecond. Both methods are equal at this point, but the variation the system has once it’s stabilized has a magnitude of ±0.02, twice of the Fuzzy variation. It is logic that the resolution of the system for this change in position will be the half compared with the first experiment. In this case, by using Fuzzy Logic scheme, the performance of the entire system is better. See Table 3.
Figure 7. Control behavior of the Fuzzy Inference System (FIS) according to the rules selected, (a) is the figure to an input-output map with the error and error derivative
as inputs and the manipulation as the output, (b) corresponding control surface produce
for the combination of the rules with the membership functions designed
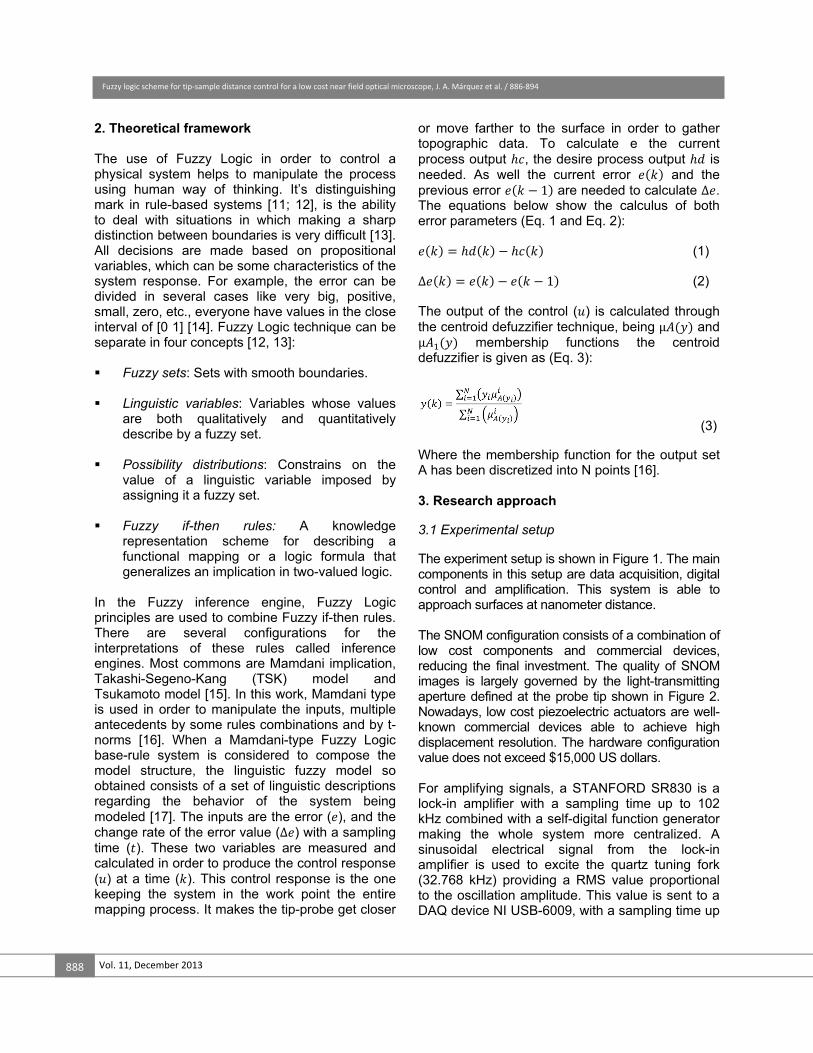
Figure 8. System response with a PID controller The results obtained above were made with the tuning fork tuned at the maximum resonance amplitude. The Figure 9 shows the results of the Fuzzy Logic algorithm controlling the system with tuning fork tuned at anti-resonance frequency, where the amplitude is the minimum. This zone appears to be more linear and the system is able to reach the desire position faster. However anti-resonance configuration makes harder for the control technique to maintain the tip at a constant distance with the surface. For this scheme the feedback changes the system perceives, are larger than the changes when the tuning fork is tuned at maximum resonance. The system in this state is able to reach the desire position approximately between 6 and 9 milliseconds. This configuration is 2 milliseconds faster than the one with the tuning fork tuned at its maximum frequency. The stability variation is ±0.015 millivolts one half greater than the first scheme. The selection of the tuned frequency depends which the goals of the experiment are. If time saving is priority this configuration works better, but if greater resolution is the main objective, the first configuration provides better results.
Table 3. Controllers performance parameters
Fuzzy logic scheme for tip‐sample distance control for a low cost near field optical microscope, J. A. Márquez et al. / 886‐894
Journal of Applied Research and Technology 893
Figure 9. System response with fuzzy logic feedback control algorithm with the system tuned at
minimum amplitude.
5. Conclusions The findings of this works can be summarized as follows: Data acquisition, pre-amplification and wave generation devices were compacted in a single hardware arrangement, which make the system more achievable to implement. The sensitivity of the system has been optimized for working with 2 configurations of the tuning fork, for maximum and minimum amplitude. Depending on the objective of sensing, these configurations could be changed: For increasing the speed minimum amplitude is better, and for better accuracy, maximum amplitude should be selected. The auto tune algorithm presented in this work is a tool to deal with environmental variations and it helps to tune the system in its maximum sensing capacity. The fuzzy scheme tested presented better performance parameters in comparison with PID controller, due to the inherent non linearity of the system, its repeatability and accuracy, for both configurations of the tuning fork. Additionally, it shows a constant performance in comparison with PID when dealing with set point changes.
Acknowledgements The authors acknowledge financial support from CONACyT project 127589. The authors of this paper want to thank Dr. Juan Merlo for his support in this work and technical assistance. Additional support was provided by The Research Chair of Intelligent Machines at Tecnológico de Monterrey. References [1] P.A. López and R. Aguilar, “Dynamic nonlinear feedback for temperature control of continuous stirred reactor with complex behavior” J. Appl. Res. Technol., vol. 7, no. 2, pp. 202-217, 2009. [2] J.L. Pérez et al. “Electronic model of a dubois fuzzy integration neuron” J. Appl. Res. Technol., vol. 7, no. 1, pp. 73-82, 2009. [3] D. Escamilla et al. "Feedback Scheme Based On Fuzzy Control for Shear Force Control" Ninth Electronics, Robotics and Automotive Mechanics Conference (CERMA), Cuernavaca, Mexico, 2012, pp. 171-175. [4] K. Karrai, and R.D. Grober, “Piezoelectric tip-sample distance control for near field optical microscopes” Appl. Phys. L., vol. 66, no. 14, pp. 1842-1844. 1995. [5] C. Durkan, and I.V. Shvets, “Study of shear force as a distance regulation mechanism for scanning near-field optical microscopy” Jpn. J. Appl. Phys., vol. 79, no. 3, pp. 1219-1223, 1996. [6] A. Egawa, et al., “High-speed scanning by dual feedback control in SNOM/AFM” J. Microsc., vol. 194, no. 2-3, pp. 325-328, 1999. [7] W.A. Atia, and C.C. Davis, “A phase-locked shear-force microscope for distance regulation in near-field optical microscopy” Appl. Phys. L., vol. 70, no. 4, pp. 405-407, 1997. [8] G.C.D. Frances et al., “SNOM signal near plasmonic nanostructures: an analogy with fluorescence decays channels” J. Microsc., vol. 229, no. 2, pp. 302-306, 2008. [9] F.H. Lei et al. “Shear force near-field optical microscope based on Q-controlled bimorph sensor for biological imaging in liquid” J. Microsc., vol. 216, no. 3, pp. 229-233, 2004. [10] G. Longo, et al. “Optical super-resolution using higher harmonics and different acquisition modes in an aperture tapping SNOM” Phys. Status Solidi B, vol. 247, no. 8., pp. 2056-2060, 2010.

Fuzzy logic scheme for tip‐sample distance control for a low cost near field optical microscope, J. A. Márquez et al. / 886‐894
Vol. 11, December 2013 894
[11] D. Rangel et al. “Intelligent Positioning Fuzzy Servomechanism Under PWM Nonlinear Load”. J. Appl. Res. Technol, vol. 8, no.1, pp. 87-100, 2009. [12] F. Lara et al. “Minimal fuzzy microcontroller implementation for didactic applications” J. Appl. Res. Technol. vol. 1, no. 2, pp. 137-147, 2002. [13] J. Yen, and R. Langari, “Fuzzy logic: intelligence, control and information, John Yen and Reza Langari” Upper Saddle River, N. J. Prentice Hall, 1999c, 1999. [14] J.L. Pérez et al. “Dynamic Fuzzy Logic Functor” J. Appl. Res. Technol, vol. 6, no. 2, pp. 84-94. 2008. [15] N. Hung et al. “First Course in Fuzzy and Neural Control” Boca Raton, London, New York, Washington, D.C., Chapman & Hall/CRC, , 2003. [16] O. Cordón, “A historical review of evolutionary learning methods for Mamdani-type fuzzy rule-based systems: Designing interpretable genetic fuzzy systems.” Int. J. Approx. Reason., vol. 52, no. 6, pp. 894-913, 2011. [17] J. M. Mendel, “Uncertain rule-based fuzzy lofic systems: Introduction and New Directions”, Upper Saddle River, N. J., Prentice Hall, c2001, 2001. [18] R. Cortes et al. “Interference in Far-field Radiation of Evanescent Fields” Surf. Rev. Lett., vol. 18, no 6, pp. 261-265, 2011.