fy 17 cafr document - doug
TRANSCRIPT
Independent Auditors’ ReportManagement’s Discussion and Analysis


INDEPENDENT AUDITORS’ REPORT
To the Honorable Mayor, City Council, and City Manager,City of Palm Coast, Florida:
Report on the Financial Statements
We have audited the accompanying financial statements of the governmental activities, the business-type activities, each major fund, and the aggregate remaining fund information of the City of Palm Coast, Florida, as of and for the year ended September 30, 2017, and the related notes to the financial statements, which collectively comprise the City’s basic financial statements as listed in the table of contents.
Management’s Responsibility for the Financial StatementsCity of Palm Coast, Florida’s management is responsible for the preparation and fair presentation of these financial statements in accordance with accounting principles generally accepted in the United States of America; this includes the design, implementation, and maintenance of internal control relevant to the preparation and fair presentation of financial statements that are free from material misstatement, whether due to fraud or error.
Auditors’ ResponsibilityOur responsibility is to express opinions on these financial statements based on our audit. We conducted our audit in accordance with auditing standards generally accepted in the United States of America and the standards applicable to financial audits contained in Government Auditing Standards, issued by the Comptroller General of the United States. Those standards require that we plan and perform the audit to obtain reasonable assurance about whether the financial statements are free from material misstatement.
An audit involves performing procedures to obtain audit evidence about the amounts and disclosures in the financial statements. The procedures selected depend on the auditors’ judgment, including the assessment of the risks of material misstatement of the financial statements, whether due to fraud or error. In making those risk assessments, the auditor considers internal control relevant to the City’s preparation and fair presentation of the financial statements in order to design audit procedures that are appropriate in the circumstances, but not for the purpose of expressing an opinion on the effectiveness of the City’s internal control. Accordingly, we express no such opinion. An audit also includes evaluating the appropriateness of accounting policies used and the reasonableness of significant accounting estimates made by management, as well as evaluating the overall presentation of the financial statements.
We believe that the audit evidence we have obtained is sufficient and appropriate to provide a basis for our audit opinions.
OpinionsIn our opinion, the financial statements referred to above present fairly, in all material respects, the respective financial position of the governmental activities, the business-type activities, each major fund, and the aggregate remaining fund information of the City of Palm Coast, Florida, as of September 30, 2017, and the respective changes in financial position and, where applicable, cash flows thereof for the year then ended in accordance with accounting principles generally accepted in the United States of America.
Other Matters
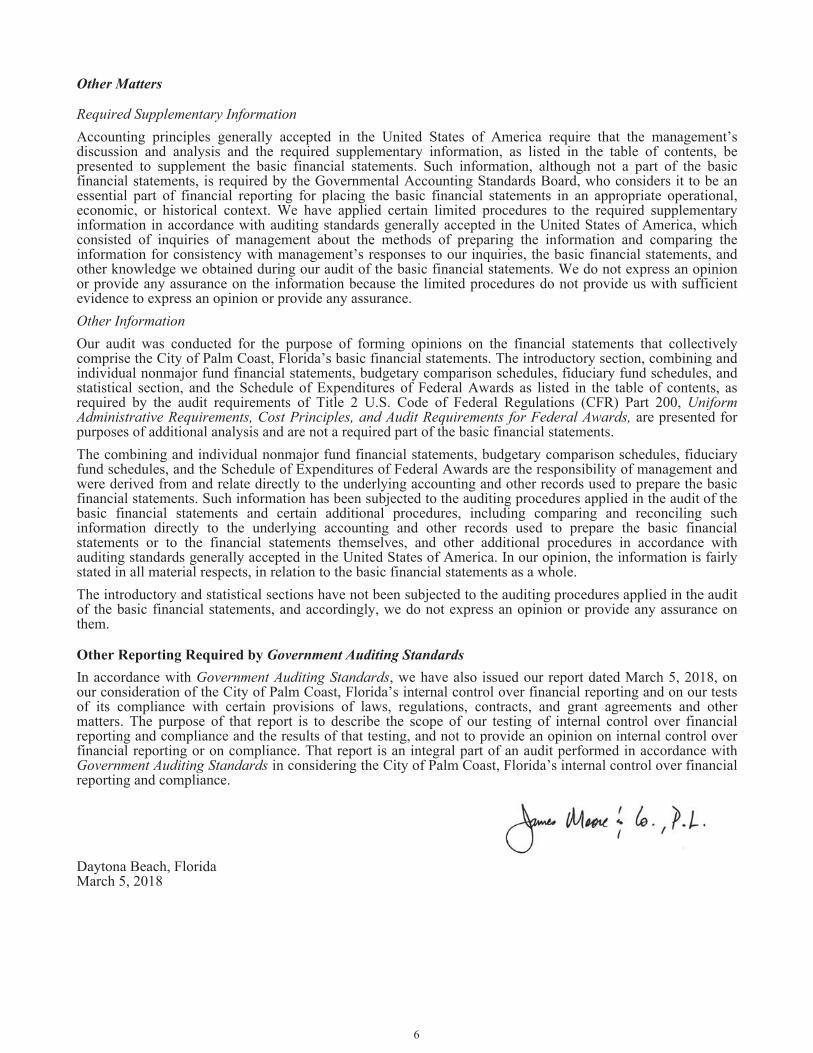
Required Supplementary InformationAccounting principles generally accepted in the United States of America require that the management’s discussion and analysis and the required supplementary information, as listed in the table of contents, be presented to supplement the basic financial statements. Such information, although not a part of the basic financial statements, is required by the Governmental Accounting Standards Board, who considers it to be an essential part of financial reporting for placing the basic financial statements in an appropriate operational, economic, or historical context. We have applied certain limited procedures to the required supplementary information in accordance with auditing standards generally accepted in the United States of America, which consisted of inquiries of management about the methods of preparing the information and comparing the information for consistency with management’s responses to our inquiries, the basic financial statements, and other knowledge we obtained during our audit of the basic financial statements. We do not express an opinion or provide any assurance on the information because the limited procedures do not provide us with sufficient evidence to express an opinion or provide any assurance.Other InformationOur audit was conducted for the purpose of forming opinions on the financial statements that collectively comprise the City of Palm Coast, Florida’s basic financial statements. The introductory section, combining and individual nonmajor fund financial statements, budgetary comparison schedules, fiduciary fund schedules, and statistical section, and the Schedule of Expenditures of Federal Awards as listed in the table of contents, as required by the audit requirements of Title 2 U.S. Code of Federal Regulations (CFR) Part 200, Uniform Administrative Requirements, Cost Principles, and Audit Requirements for Federal Awards, are presented for purposes of additional analysis and are not a required part of the basic financial statements.The combining and individual nonmajor fund financial statements, budgetary comparison schedules, fiduciary fund schedules, and the Schedule of Expenditures of Federal Awards are the responsibility of management and were derived from and relate directly to the underlying accounting and other records used to prepare the basic financial statements. Such information has been subjected to the auditing procedures applied in the audit of the basic financial statements and certain additional procedures, including comparing and reconciling such information directly to the underlying accounting and other records used to prepare the basic financial statements or to the financial statements themselves, and other additional procedures in accordance with auditing standards generally accepted in the United States of America. In our opinion, the information is fairly stated in all material respects, in relation to the basic financial statements as a whole.The introductory and statistical sections have not been subjected to the auditing procedures applied in the audit of the basic financial statements, and accordingly, we do not express an opinion or provide any assurance on them.
Other Reporting Required by Government Auditing StandardsIn accordance with Government Auditing Standards, we have also issued our report dated March 5, 2018, on our consideration of the City of Palm Coast, Florida’s internal control over financial reporting and on our tests of its compliance with certain provisions of laws, regulations, contracts, and grant agreements and other matters. The purpose of that report is to describe the scope of our testing of internal control over financial reporting and compliance and the results of that testing, and not to provide an opinion on internal control over financial reporting or on compliance. That report is an integral part of an audit performed in accordance with Government Auditing Standards in considering the City of Palm Coast, Florida’s internal control over financial reporting and compliance.
Daytona Beach, FloridaMarch 5, 2018

MANAGEMENT’S DISCUSSION AND ANALYSIS


MANAGEMENT'S DISCUSSION AND ANALYSIS
As management of the City of Palm Coast, we offer readers of the City of Palm Coast’s financial statements this narrative overview and analysis of the financial activities of the City of Palm Coast for the fiscal year ended September 30, 2017. We encourage readers to consider the information presented here in conjunction with additional information that we have furnished in our letter of transmittal, which can be found on pages vii-x of this report.
The City of Palm Coast management’s discussion and analysis is designed to (a) assist the reader in focusing on significant financial issues, (b) provide an overview of the City's financial activity, (c) identify changes in the City's financial position (its ability to address the next and subsequent years challenges), (d) identify any material deviations from the financial plan (the approved budget), and (e) identify individual fund issues or concerns.
Financial Highlights
The assets and deferred outflows of the City of Palm Coast exceeded its liabilities and deferred inflows at theclose of fiscal year 2017 by $479,942,892. Of this amount, $41,305,216 may be used to meet the City’songoing obligations to citizens and creditors.The City's total net position increased by $28,251,716. Over $9 million of the increase was the result ofincreased utility revenue due to planned rate increases and customer growth as well as related impact feecollections. The balance of the increase was primarily due to donated capital asset infrastructure received.As of the close of fiscal year 2017, the City’s governmental funds reported combined ending fund balances of$15,675,222 an increase of $234,121 over the prior year. The increase in combined ending fund balanceswas primarily due to increased revenues from development related impact fees less a planned and budgeteduse of capital projects fund balance for City projects.At the end of fiscal year 2017, unassigned fund balance in the general fund was $6,784,518 or 19.6% of totalgeneral fund expenditures.The City of Palm Coast’s total debt increased by $14,617,481 during the current fiscal year. This was primarilydue additional withdrawals from the State Revolving Fund Loan WW180420 for the construction of wastewatertreatment plant II, net of, annual principal payments on outstanding debt.The application of GASB Statement No. 68 resulted in recording of a Net Pension Liability and Asset, as wellas related Deferred Inflow and Outflows. The net result of these transactions was a decrease in unrestrictednet position of $997,641.
Overview of the Financial Statements
This discussion and analysis is intended to serve as an introduction to the City of Palm Coast’s basic financial statements. The City of Palm Coast’s basic financial statements are comprised of three components: 1) government-wide financial statements, 2) fund financial statements, and 3) notes to the financial statements. This report also contains other supplementary information in addition to the basic financial statements themselves.
Government-wide financial statements. The government-wide financial statements are designed to provide readers with a broad overview of the City of Palm Coast’s finances, in a manner similar to a private-sector business.
The statement of net position presents information on all of the City of Palm Coast’s assets, deferred outflows, liabilities, and deferred inflows, with the difference between these reported as net position. Over time, increases or decreases in net position may serve as a useful indicator of whether the financial position of the City of Palm Coast is improving or deteriorating.

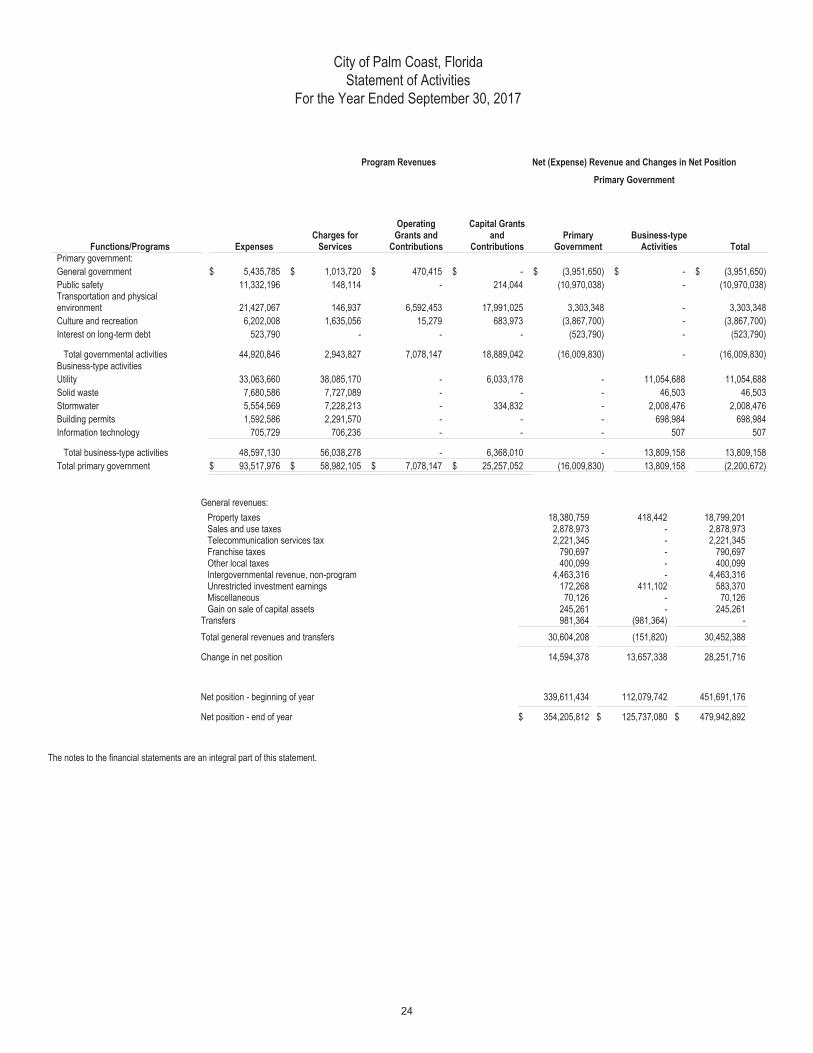
The statement of activities presents information showing how the City’s net position changed during the most recent fiscal year. All changes in net position are reported as soon as the underlying event giving rise to the change occurs, regardless of the timing of related cash flows. Thus, revenues and expenses are reported in this statement for some items that will only result in cash flows in future periods (e.g., uncollected taxes and earned but unused vacation leave).
Both of the government-wide financial statements distinguish functions of the City of Palm Coast that are principally supported by taxes and intergovernmental revenues (governmental activities) from other functions that are intended to recover all or a significant portion of their costs through user fees and charges (business-type activities). The governmental activities of the City of Palm Coast include general government, public safety, transportation and physical environment, and culture and recreation. The business-type activities of the City of Palm Coast include a water and sewer utility, solid waste collection, stormwater management, building permits, and information technology.
The government-wide financial statements can be found on pages 23-24 of this report.
Fund Financial Statements. A fund is a grouping of related accounts that is used to maintain control over resources that have been segregated for specific activities or objectives. The City of Palm Coast, like other state and local governments, uses fund accounting to ensure and demonstrate compliance with finance-related legal requirements. All of the funds of the City of Palm Coast can be divided into three categories: governmental funds, proprietary funds, and fiduciary funds.
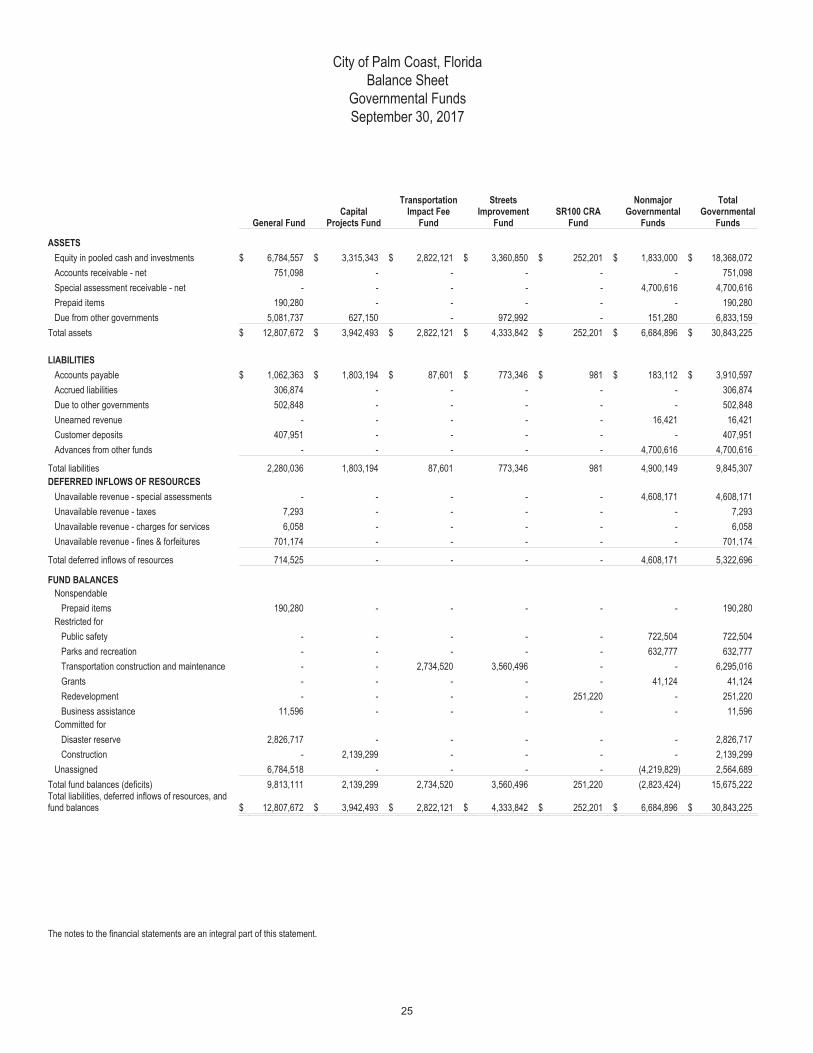
Governmental funds. Governmental funds are used to account for essentially the same functions reported as governmental activities in the government-wide financial statements. However, unlike the government-wide financial statements, governmental fund financial statements focus on near-term inflows and outflows of spendable resources, as well as, on balances of spendable resources available at the end of the fiscal year. Such information may be useful in evaluating a government’s near-term financing requirements.
Because the focus of governmental funds is narrower than that of the government-wide financial statements, it is useful to compare the information presented for governmental funds with similar information for governmental activities in the government-wide financial statements. By doing so, readers may better understand the long-term impact of the government’s near-term financing decisions. Both the governmental fund balance sheet and the governmental fund statement of revenues, expenditures, and changes in fund balance provide a reconciliation to facilitate this comparison between governmental funds and governmental activities.
The City of Palm Coast maintains twelve individual governmental funds. Seven of the governmental funds are classified as nonmajor and are summarized under this heading in the governmental fund presentation. Information is presented separately in the governmental fund balance sheet and in the governmental fund statement of revenues, expenditures, and changes in fund balances for the general fund, capital projects fund, transportation impact fee fund, streets improvement fund, and SR100 CRA fund, which are considered to be major funds. Data from the nonmajor governmental funds are combined into a single, aggregated presentation. Individual fund data for nonmajor governmental funds is provided in the form of combining statements elsewhere in this report.
The City adopts an annual appropriation budget for its general, capital projects, transportation impact fee, streets improvement, SR100 CRA and nonmajor governmental funds. A budgetary comparison schedule has been provided for these funds to demonstrate compliance with this budget.
The basic governmental fund financial statements can be found on pages 25-28 of this report. Proprietary funds. The City of Palm Coast maintains two different types of proprietary funds. Enterprise funds are used to report the same functions presented as business-type activities in the government-wide financial statements.

The City of Palm Coast uses enterprise funds to account for its water and sewer utility, solid waste collection, stormwater management, building permits, and information technology (IT). Internal service funds are an accounting device used to accumulate and allocate costs internally among the City of Palm Coast's various functions. The City of Palm Coast uses internal service funds to account for its fleet of vehicles, communications, facilities maintenance and self-insured health program. Because these services predominantly benefit governmental rather than business-type functions, they have been included within governmental activities in the government-wide financial statements.
Proprietary funds provide the same type of information as the government-wide financial statements, only in more detail. The proprietary fund financial statements provide separate information for the water and sewer utility, stormwater management, and solid waste collection major funds, as well as, the building permits, and information technology (IT) nonmajor funds. Data from the nonmajor proprietary funds are combined into a single, aggregated presentation. Individual fund data for nonmajor proprietary funds is provided in the form of combining statements elsewhere in this report. The internal service funds are also presented in the proprietary fund financial statements, but not included in the totals for proprietary funds. Individual fund data for internal service funds is provided in the form of combining statements elsewhere in this report.
The basic proprietary fund financial statements can be found on pages 29-34 of this report.
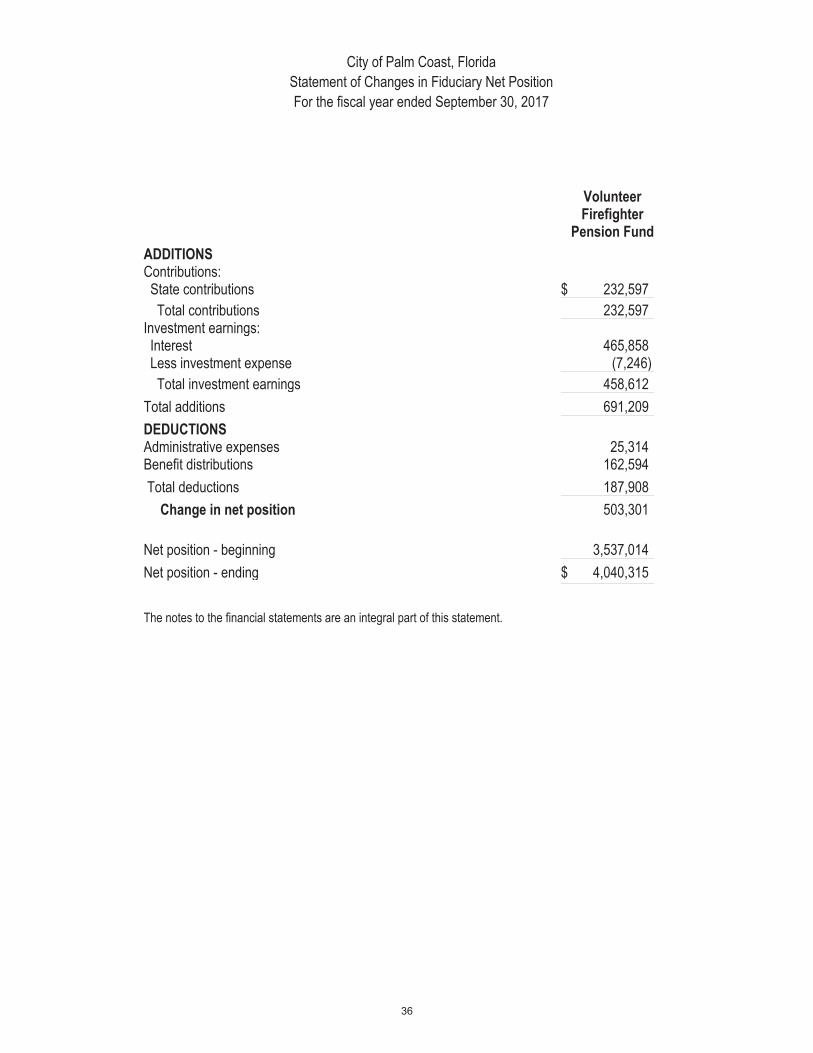
Fiduciary funds. Fiduciary funds are used to account for resources held for the benefit of parties outside the government. Fiduciary funds are not reflected in the government-wide financial statement because the resources of those funds are not available to support the City of Palm Coast’s own programs. The accounting used for fiduciary funds is similar to that used for proprietary funds. The City maintains one fiduciary fund, which is the volunteer firefighters’ pension fund.
The basic fiduciary fund financial statements can be found on pages 35-36 of this report.
Notes to the financial statements. The notes provide additional information that is essential to a full understanding of the data provided in the government-wide and fund financial statements. The notes to the financial statements can be found on pages 37-87 of this report.
Other information. In addition to the basic financial statements and accompanying notes, this report also presents certain required supplementary information. This includes budget and actual comparisons for the general fund and major special revenue funds with adopted budgets. This also includes the City of Palm Coast’s progress in funding its obligation to provide pension benefits to the volunteer firefighters, select public safety employees, and its Other Postemployment Benefits (OPEB) obligation. Required supplementary information can be found on pages 90-101 of this report.
Government-wide Overall Financial Analysis
As noted earlier, net position may serve over time as a useful indicator of a government’s financial position. In the case of the City of Palm Coast, assets and deferred outflows exceeded liabilities and deferred inflows by $479,942,892 at the close of the most recent fiscal year.
Of the net position, 8.61% falls in the unrestricted category. These may be used to meet ongoing obligations to citizens and creditors. Approximately 4.88% of net position represents resources that are subject to external restrictions. By far, the largest portion of the City of Palm Coast’s net position (86.51) reflects its investment in capital assets (e.g., land, buildings, and equipment); less any related debt used to acquire those assets that is still outstanding. These capital assets are used to provide services to citizens and therefore are not available for future

spending. Although the investment in capital assets is reported net of related debt used to acquire the assets, it should be noted that the resources needed to repay this debt must be provided from other sources since the capital assets themselves cannot be used to liquidate these liabilities.
At the end of the current fiscal year, the City of Palm Coast is able to report positive balances in all three categories of net position for the government as a whole. For the prior fiscal year, all categories were also positive.
Table I City of Palm Coast's Net Position
Governmental Activities Business-type Activities Total
2017 2016 2017 2016 2017 2016
Current and other assets $ 44,046,481 $ 39,882,122 $ 58,543,273 $ 51,603,840 $ 102,589,754 $ 91,485,962
Capital assets 339,155,898 326,499,371 246,433,725 227,070,014 585,589,623 553,569,385
Total assets 383,202,379 366,381,493 304,976,998 278,673,854 688,179,377 645,055,347
Total deferred outflows of resources 1,574,494 1,627,351 1,209,630 1,326,959 2,784,124 2,954,310
Long-term liabilities 14,645,166 14,683,427 178,848,693 164,192,951 193,493,859 178,876,378
Other liabilities 15,575,060 13,384,595 1,043,395 3,109,475 16,618,455 16,494,070
Total liabilities 30,220,226 28,068,022 179,892,088 167,302,426 210,112,314 195,370,448
Total deferred inflows of resources 350,835 329,388 557,460 618,645 908,295 948,033
Net position:
Net investment in capital
assets 330,790,898 317,474,371 84,435,596 72,761,895 415,226,494 390,236,266
Restricted 7,954,237 5,537,610 15,456,945 14,009,367 23,411,182 19,546,977
Unrestricted 15,460,677 16,599,453 25,844,539 25,308,480 41,305,216 41,907,933
Total net position $ 354,205,812 $ 339,611,434 $ 125,737,080 $ 112,079,742 $ 479,942,892 $ 451,691,176
Governmental Activities
Governmental activities increased the City of Palm Coast’s net position by $14,594,378 during the current fiscal year. Factors include revenues in excess of expenditures in the general fund, accumulation of impact fees due to increased development in the community, capital assets infrastructure donated to the City, and planned use of capital projects fund balance . Long-term liabilities decreased $38,261 primarily due to principal payments made, net of an increase in the FRS net pension liability for the year. Governmental activities unrestricted net position decreased by $1,138,776. The primary driver for this was due to hurricane expenditures incurred in excess of anticipated FEMA grant reimbursements. Capital grants and contributions increased $11,745,653 primarily due to donated capital asset infrastructure received during the fiscal year, net of completion of grant funded road projects. Operating grants and contributions increased $4,666,964 primarily due to several CDBG projects that were done during fiscal year 2017, and FEMA hurricane reimbursements expected. Property taxes increased $788,549 due to a 5% increase in taxable value throughout the City. The millage rate remained flat. Changes in general government and transportation and physical environment expenses offset due to a reorganization during the fiscal year. Transportation and physical environment expenditures increased by $3,847,276 mainly due to hurricane expenditures incurred.

Table II City of Palm Coast's Changes in Net Position
Governmental Activities Business-type Activities Total
2017 2016 2017 2016 2017 2016 Revenues:Program revenues:
Charges for services $ 2,943,827 $ 2,776,765 $ 56,038,278 $ 54,645,631 $ 58,982,105 $ 57,422,396 Operating grants and contributions 7,078,147 2,411,183 - - 7,078,147 2,411,183 Capital grants and contributions 18,889,042 7,143,389 6,368,010 5,121,164 25,257,052 12,264,553
General revenues: Property taxes 18,380,759 17,592,210 418,442 363,863 18,799,201 17,956,073 Other taxes 6,291,114 6,303,559 - - 6,291,114 6,303,559 Intergovernmental 4,463,316 4,299,085 - - 4,463,316 4,299,085 Other 487,655 529,701 411,102 482,167 898,757 1,011,868
Total revenues 58,533,860 41,055,892 63,235,832 60,612,825 121,769,692 101,668,717
Expenses: General government 5,435,785 3,471,694 - - 5,435,785 3,471,694 Public safety 11,332,196 11,013,862 - - 11,332,196 11,013,862
Transportation and physical environment 21,427,067 17,579,791 - - 21,427,067 17,579,791 Parks and recreation 6,202,008 6,136,059 - - 6,202,008 6,136,059
Utility - - 33,063,660 31,562,957 33,063,660 31,562,957 Solid waste - - 7,680,586 7,349,686 7,680,586 7,349,686 Stormwater - - 5,554,569 6,473,450 5,554,569 6,473,450 Building permits - - 1,592,586 1,516,413 1,592,586 1,516,413 Information technology - - 705,729 985,726 705,729 985,726 Interest on long-term debt 523,790 578,231 - - 523,790 578,231
Total expenses 44,920,846 38,779,637 48,597,130 47,888,232 93,517,976 86,667,869 Increase (decrease) in net position before transfers 13,613,014 2,276,255 14,638,702 12,724,593 28,251,716 15,000,848 Transfers 981,364 1,157,742 (981,364) (1,157,742) - - Increase (decrease) in net position 14,594,378 3,433,997 13,657,338 11,566,851 28,251,716 15,000,848 Net position - beginning 339,611,434 336,177,437 112,079,742 100,512,891 451,691,176 436,690,328
Net position - ending $ 354,205,812 $ 339,611,434 $ 125,737,080 $ 112,079,742 $ 479,942,892 $ 451,691,176

–
–

–
–

type activities increased the City of Palm Coast’s net position by
Financial Analysis of the Government’s Funds
. As a measure of the general fund’s liquidity, it ma
The fund balance of the City of Palm Coast’s general fund increased by $903,056 during the current fiscal year.
The City of Palm Coast’s proprietary funds provide the same type of information found in the


The City of Palm Coast’s
Additional information on the City of Palm Coast’s capital assets can be found in
the City of Palm Coast’s long

Next Year’s Budget and Rates


City of Palm Coast, Florida Statement of Net Position
September 30, 2017
Governmental Activities
Business-Type Activities Total
ASSETS Equity in pooled cash and investments $ 30,360,364 $ 19,895,727 $ 50,256,091 Accounts receivable - net 5,453,963 7,801,695 13,255,658 Due from other governments 6,835,112 8,379,747 15,214,859 Prepaid items 212,402 82,949 295,351 Inventories 28,078 798,030 826,108 Restricted assets:
Equity in pooled cash and investments - 21,585,125 21,585,125 Net pension asset 1,156,562 - 1,156,562 Capital assets not being depreciated
Land 91,294,729 13,889,568 105,184,297 Construction in progress 12,100,659 31,215,063 43,315,722
Capital assets, net of accumulated depreciation Building and improvements other than buildings 46,854,727 61,756,145 108,610,872 Infrastructure 179,789,792 139,133,465 318,923,257 Equipment 9,115,991 439,484 9,555,475
Total assets 383,202,379 304,976,998 688,179,377 Deferred outflows of resources:
Deferred outflows related to pensions 1,574,494 - 1,574,494 Deferred loss on refunding - 1,209,630 1,209,630
Total deferred outflows of resources 1,574,494 1,209,630 2,784,124
LIABILITIES Accounts payable and other current liabilities 4,723,036 1,748,401 6,471,437 Due to other governments 1,102,848 11,905 1,114,753 Internal balances 9,324,804 (9,324,804) - Customer deposits 407,951 3,716,833 4,124,784 Unearned revenue 16,421 114,489 130,910 Payable from restricted assets:
Accrued bond interest payable - 1,893,375 1,893,375 Accrued loan interest payable - 122,644 122,644 Accounts payable - 1,756,238 1,756,238 Contracts payable - 1,004,314 1,004,314
Noncurrent liabilities: Due within one year 814,389 5,408,060 6,222,449 Due in more than one year 10,452,915 173,440,633 183,893,548
Net pension liability 3,377,862 - 3,377,862
Total liabilities 30,220,226 179,892,088 210,112,314 Deferred inflows of resources:
Deferred gain on refunding - 557,460 557,460 Deferred inflows relating to pensions 350,835 - 350,835
Total deferred inflows of resources 350,835 557,460 908,295
NET POSITION Net investment in capital assets 330,790,898 84,435,596 415,226,494 Restricted for:
Construction - 2,139,473 2,139,473 Debt service - 4,929,014 4,929,014 Renewal and replacements - 8,388,458 8,388,458 Public safety 722,504 - 722,504Parks and recreation 632,777 - 632,777Transporation construction and maintenance 6,295,016 - 6,295,016 Redevelopment 251,220 - 251,220Grants 52,720 - 52,720
Unrestricted 15,460,677 25,844,539 41,305,216
Total net position $ 354,205,812 $ 125,737,080 $ 479,942,892
The notes to the financial statements are an integral part of this statement.

City of Palm Coast, FloridaStatement of Net Position
Proprietary FundsSeptember 30, 2017
Business-type Activities-Enterprise Funds
Utility FundSolid Waste
FundStormwater
Fund
Nonmajor Enterprise
Funds
TotalEnterprise
Funds
Governmental Activities -
Internal Service Funds
ASSETSCurrent assets:
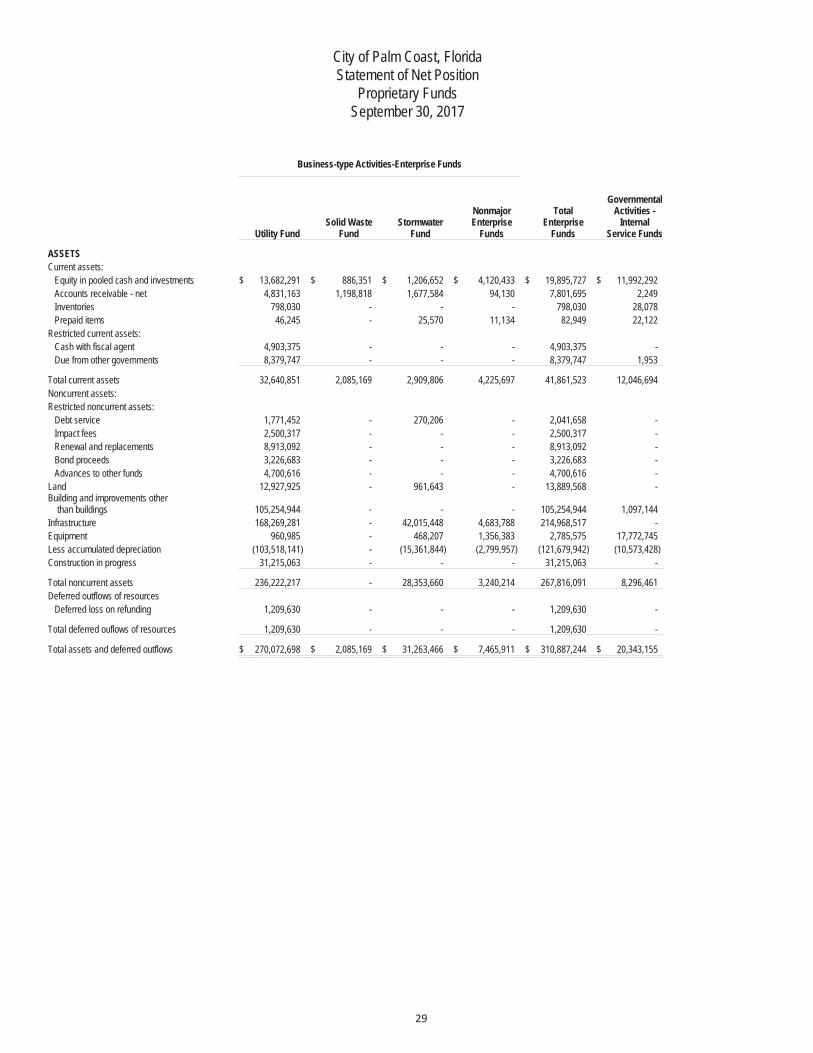
Equity in pooled cash and investments $ 13,682,291 $ 886,351 $ 1,206,652 $ 4,120,433 $ 19,895,727 $ 11,992,292Accounts receivable - net 4,831,163 1,198,818 1,677,584 94,130 7,801,695 2,249Inventories 798,030 - - - 798,030 28,078Prepaid items 46,245 - 25,570 11,134 82,949 22,122
Restricted current assets:Cash with fiscal agent 4,903,375 - - - 4,903,375 -Due from other governments 8,379,747 - - - 8,379,747 1,953
Total current assets 32,640,851 2,085,169 2,909,806 4,225,697 41,861,523 12,046,694Noncurrent assets:Restricted noncurrent assets:
Debt service 1,771,452 - 270,206 - 2,041,658 -Impact fees 2,500,317 - - - 2,500,317 -Renewal and replacements 8,913,092 - - - 8,913,092 -Bond proceeds 3,226,683 - - - 3,226,683 -Advances to other funds 4,700,616 - - - 4,700,616 -
Land 12,927,925 - 961,643 - 13,889,568 -Building and improvements other than buildings 105,254,944 - - - 105,254,944 1,097,144Infrastructure 168,269,281 - 42,015,448 4,683,788 214,968,517 -Equipment 960,985 - 468,207 1,356,383 2,785,575 17,772,745Less accumulated depreciation (103,518,141) - (15,361,844) (2,799,957) (121,679,942) (10,573,428)Construction in progress 31,215,063 - - - 31,215,063 -
Total noncurrent assets 236,222,217 - 28,353,660 3,240,214 267,816,091 8,296,461Deferred outflows of resources
Deferred loss on refunding 1,209,630 - - - 1,209,630 -
Total deferred ouflows of resources 1,209,630 - - - 1,209,630 -
Total assets and deferred outflows $ 270,072,698 $ 2,085,169 $ 31,263,466 $ 7,465,911 $ 310,887,244 $ 20,343,155

City of Palm Coast, FloridaStatement of Net Position (continued)
Proprietary FundsSeptember 30, 2017
Business-type Activities-Enterprise Funds
Utility FundSolid Waste
FundStormwater
Fund
Nonmajor Enterprise
Funds
TotalEnterprise
Funds
Governmental Activities -
Internal Service Funds
LIABILITIESCurrent liabilities:
Accounts payable $ 651,546 $ 624,320 $ 168,621 $ 132,837 $ 1,577,324 $ 123,601Claims payable - - - - - 374,022Due to other governments - - - 11,905 11,905 600,000Loans payable 1,498,000 - 367,906 17,649 1,883,555 -Compensated absences 371,792 - 47,177 95,536 514,505 17,352Accrued liabilities 118,199 - 20,949 31,929 171,077 7,942Customer deposits 3,716,833 - - - 3,716,833 -Unearned revenue - - - 114,489 114,489 -
Current liabilities payable from rstrd assets:Current maturities of bonds payable 3,010,000 - - - 3,010,000 -Accrued bond interest payable 1,893,375 - - - 1,893,375 -Accrued loan interest payable 112,504 - 10,140 - 122,644 -Accounts payable 1,756,238 - - - 1,756,238 -Contract payable 1,004,314 - - - 1,004,314 -
Total current liabilities 14,132,801 624,320 614,793 404,345 15,776,259 1,122,917Noncurrent liabilities:
Compensated absences 524,680 - 45,930 195,941 766,551 44,863Net OPEB obligation 253,516 - 160,378 71,472 485,366 28,994Bonds payable 83,068,817 - - - 83,068,817 -Loans payable 80,356,682 - 8,747,320 15,897 89,119,899 -
Total noncurrent liabilities 164,203,695 - 8,953,628 283,310 173,440,633 73,857Deferred inflows of resources
Deferred gain on refunding 557,460 - - - 557,460 -
Total deferred inflows of resources 557,460 - - - 557,460 -
Total liabilities and deferred inflows 178,893,956 624,320 9,568,421 687,655 189,774,352 1,196,774
NET POSITIONNet investment in capital assets 62,260,700 - 18,968,228 3,206,668 84,435,596 8,296,461Restricted for construction 2,139,473 - - - 2,139,473 -Restricted for renewal & replacements 8,388,458 - - - 8,388,458 -Restricted for debt service 4,668,948 - 260,066 - 4,929,014 -Unrestricted 13,721,163 1,460,849 2,466,751 3,571,588 21,220,351 10,849,920
Total net position $ 91,178,742 $ 1,460,849 $ 21,695,045 $ 6,778,256 121,112,892 $ 19,146,381
Adjustment to reflect the consolidation of internal service fund activities related to enterprise funds. 4,624,188$125,737,080
The notes to the financial statements are an integral part of this statement.
City of Palm Coast, FloridaStatement of Revenues, Expenses, and Changes in Net Position
Proprietary FundsFor the Year Ended September 30, 2017
Business-type Activities - Enterprise Funds
Utility FundSolid Waste
FundStormwater
Fund
Nonmajor Enterprise
Funds
TotalEnterprise
Funds
Governmental Activities -
Internal Service Funds
OPERATING REVENUESCharges for services:
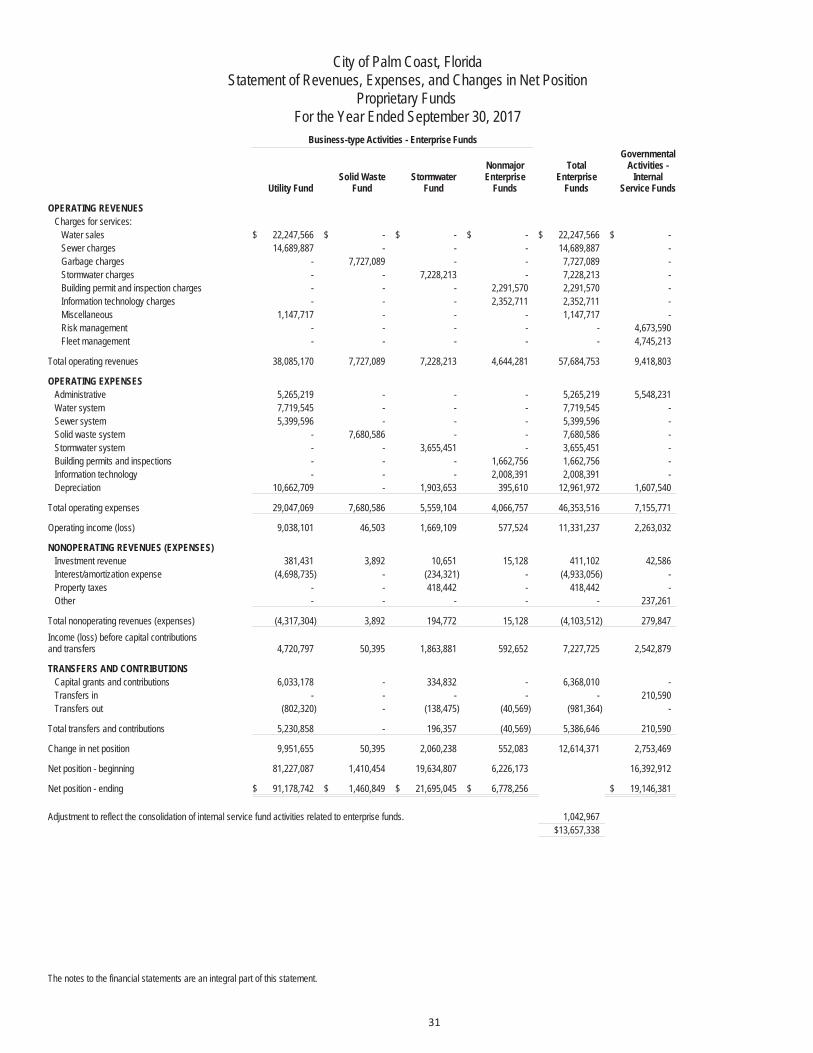
Water sales $ 22,247,566 $ - $ - $ - $ 22,247,566 $ -Sewer charges 14,689,887 - - - 14,689,887 -Garbage charges - 7,727,089 - - 7,727,089 -Stormwater charges - - 7,228,213 - 7,228,213 -Building permit and inspection charges - - - 2,291,570 2,291,570 -Information technology charges - - - 2,352,711 2,352,711 -Miscellaneous 1,147,717 - - - 1,147,717 -Risk management - - - - - 4,673,590Fleet management - - - - - 4,745,213
Total operating revenues 38,085,170 7,727,089 7,228,213 4,644,281 57,684,753 9,418,803
OPERATING EXPENSESAdministrative 5,265,219 - - - 5,265,219 5,548,231Water system 7,719,545 - - - 7,719,545 -Sewer system 5,399,596 - - - 5,399,596 -Solid waste system - 7,680,586 - - 7,680,586 -Stormwater system - - 3,655,451 - 3,655,451 -Building permits and inspections - - - 1,662,756 1,662,756 -Information technology - - - 2,008,391 2,008,391 -Depreciation 10,662,709 - 1,903,653 395,610 12,961,972 1,607,540
Total operating expenses 29,047,069 7,680,586 5,559,104 4,066,757 46,353,516 7,155,771
Operating income (loss) 9,038,101 46,503 1,669,109 577,524 11,331,237 2,263,032
NONOPERATING REVENUES (EXPENSES)Investment revenue 381,431 3,892 10,651 15,128 411,102 42,586Interest/amortization expense (4,698,735) - (234,321) - (4,933,056) -Property taxes - - 418,442 - 418,442 -Other - - - - - 237,261
Total nonoperating revenues (expenses) (4,317,304) 3,892 194,772 15,128 (4,103,512) 279,847Income (loss) before capital contributions and transfers 4,720,797 50,395 1,863,881 592,652 7,227,725 2,542,879
TRANSFERS AND CONTRIBUTIONSCapital grants and contributions 6,033,178 - 334,832 - 6,368,010 -Transfers in - - - - - 210,590Transfers out (802,320) - (138,475) (40,569) (981,364) -
Total transfers and contributions 5,230,858 - 196,357 (40,569) 5,386,646 210,590
Change in net position 9,951,655 50,395 2,060,238 552,083 12,614,371 2,753,469
Net position - beginning 81,227,087 1,410,454 19,634,807 6,226,173 16,392,912
Net position - ending $ 91,178,742 $ 1,460,849 $ 21,695,045 $ 6,778,256 $ 19,146,381
Adjustment to reflect the consolidation of internal service fund activities related to enterprise funds. 1,042,967$13,657,338
The notes to the financial statements are an integral part of this statement.

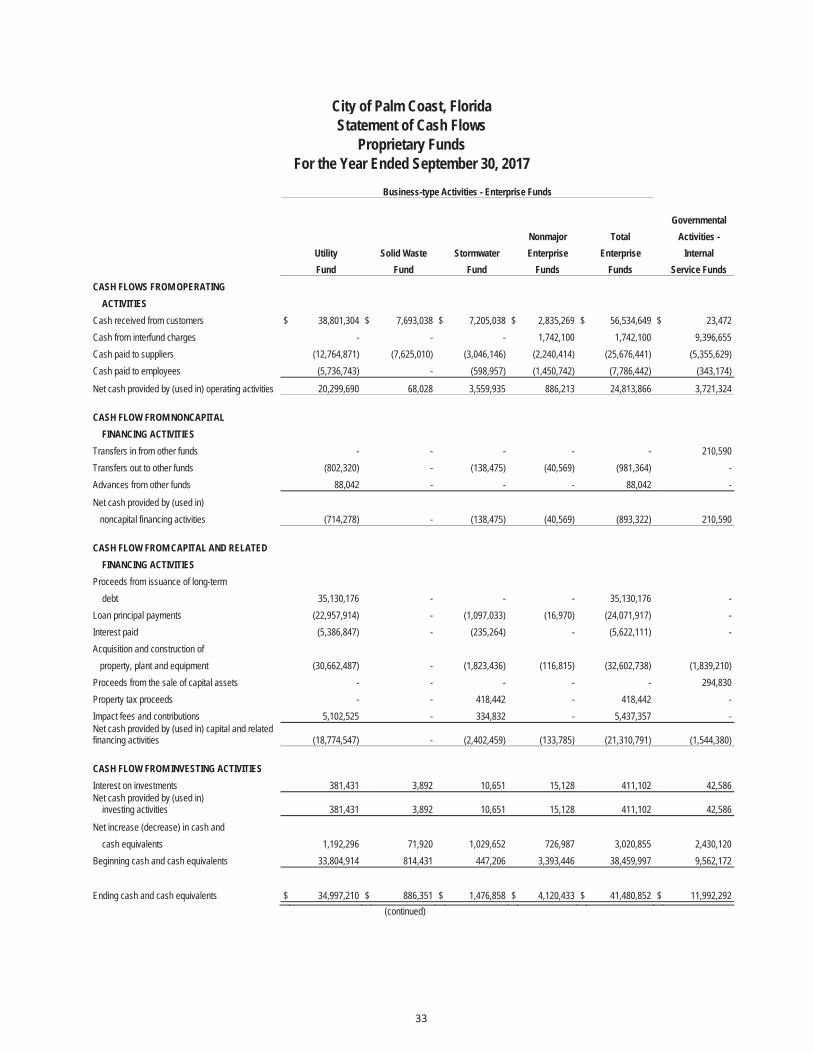
City of Palm Coast, FloridaStatement of Cash Flows
Proprietary FundsFor the Year Ended September 30, 2017
Business-type Activities - Enterprise Funds
GovernmentalNonmajor Total Activities -
Utility Solid Waste Stormwater Enterprise Enterprise InternalFund Fund Fund Funds Funds Service Funds
CASH FLOWS FROM OPERATING ACTIVITIESCash received from customers $ 38,801,304 $ 7,693,038 $ 7,205,038 $ 2,835,269 $ 56,534,649 $ 23,472 Cash from interfund charges - - - 1,742,100 1,742,100 9,396,655 Cash paid to suppliers (12,764,871) (7,625,010) (3,046,146) (2,240,414) (25,676,441) (5,355,629)Cash paid to employees (5,736,743) - (598,957) (1,450,742) (7,786,442) (343,174)
Net cash provided by (used in) operating activities 20,299,690 68,028 3,559,935 886,213 24,813,866 3,721,324
CASH FLOW FROM NONCAPITAL FINANCING ACTIVITIESTransfers in from other funds - - - - - 210,590 Transfers out to other funds (802,320) - (138,475) (40,569) (981,364) -Advances from other funds 88,042 - - - 88,042 -
Net cash provided by (used in)noncapital financing activities (714,278) - (138,475) (40,569) (893,322) 210,590
CASH FLOW FROM CAPITAL AND RELATED FINANCING ACTIVITIESProceeds from issuance of long-term debt 35,130,176 - - - 35,130,176 -Loan principal payments (22,957,914) - (1,097,033) (16,970) (24,071,917) -Interest paid (5,386,847) - (235,264) - (5,622,111) -Acquisition and construction of
property, plant and equipment (30,662,487) - (1,823,436) (116,815) (32,602,738) (1,839,210)Proceeds from the sale of capital assets - - - - - 294,830 Property tax proceeds - - 418,442 - 418,442 -Impact fees and contributions 5,102,525 - 334,832 - 5,437,357 -Net cash provided by (used in) capital and related financing activities (18,774,547) - (2,402,459) (133,785) (21,310,791) (1,544,380)
CASH FLOW FROM INVESTING ACTIVITIESInterest on investments 381,431 3,892 10,651 15,128 411,102 42,586 Net cash provided by (used in) investing activities 381,431 3,892 10,651 15,128 411,102 42,586
Net increase (decrease) in cash and cash equivalents 1,192,296 71,920 1,029,652 726,987 3,020,855 2,430,120 Beginning cash and cash equivalents 33,804,914 814,431 447,206 3,393,446 38,459,997 9,562,172
Ending cash and cash equivalents $ 34,997,210 $ 886,351 $ 1,476,858 $ 4,120,433 $ 41,480,852 $ 11,992,292 (continued)

City of Palm Coast, FloridaStatement of Cash Flows (continued)
Proprietary FundsFor the Year Ended September 30, 2017
Business-type Activities - Enterprise Funds
GovernmentalNonmajor Total Activities -
UtilitySolid Waste Stormwater Enterprise Enterprise Internal
Fund Fund Fund Fund FundService Funds
RECONCILIATION OF OPERATING INCOME TO NET CASH PROVIDED BY OPERATING ACTIVITIESOperating income (loss) $ 9,038,101 $ 46,503 $ 1,669,109 $ 577,524 $ 11,331,237 $ 2,263,032 Adjustment to reconcile operating income (loss) to net cash provided by operating activities
Depreciation and amortization 10,662,709 - 1,903,653 395,610 12,961,972 1,607,540 Change in assets and liabilities:
Accounts receivable 672,764 (34,051) (23,175) (52,442) 563,096 1,324 Inventories (261,734) - - - (261,734) (6,473) Prepaids (70) - (2,440) 991 (1,519) (702) Accounts payable 102,556 55,576 (27,751) (54,308) 76,073 (152,163) Accrued liabilities (1,563) - 42,756 4,780 45,973 8,744 Customer deposits 47,976 - - (14,470) 33,506 - Compensated absences 43,557 - (2,217) 28,528 69,868 22
Net cash provided by (used in) operating activities $ 20,304,296 $ 68,028 $ 3,559,935 $ 886,213 $ 24,818,472 $ 3,721,324
CASH AND CASH EQUIVALENTS CLASSIFIED AS: Equity in pooled cash and investments
In current assets $ 13,682,291 $ 886,351 $ 1,206,652 $ 4,120,433 $ 19,895,727 $ 11,992,292 Restricted equity in pooled cash and
investmentsCash with fiscal agent 4,903,375 - - - 4,903,375 -Debt service 1,771,452 - 270,206 - 2,041,658 -Impact Fees 2,500,317 - - - 2,500,317 Renewal and replacements 8,913,092 - - - 8,913,092 -Bond proceeds 3,226,683 - - - 3,226,683 -
Total restricted equity in pooled cash and investments 21,314,919 - 270,206 - 21,585,125 -
Total cash and cash equivalents $ 34,997,210 $ 886,351 $ 1,476,858 $ 4,120,433 $ 41,480,852 $ 11,992,292
NONCASH CAPITAL AND RELATED FINANCING ACTIVITIES:
Developer contributions of capital assets $ 680,723 $ - $ - $ - $ 680,723 $ -
The notes to the financial statements are an integral part of this statement.

NOTES TO FINANCIAL STATEMENTS
September 30, 2017

–
lieu of taxes and other charges between the government’s water and
–
–
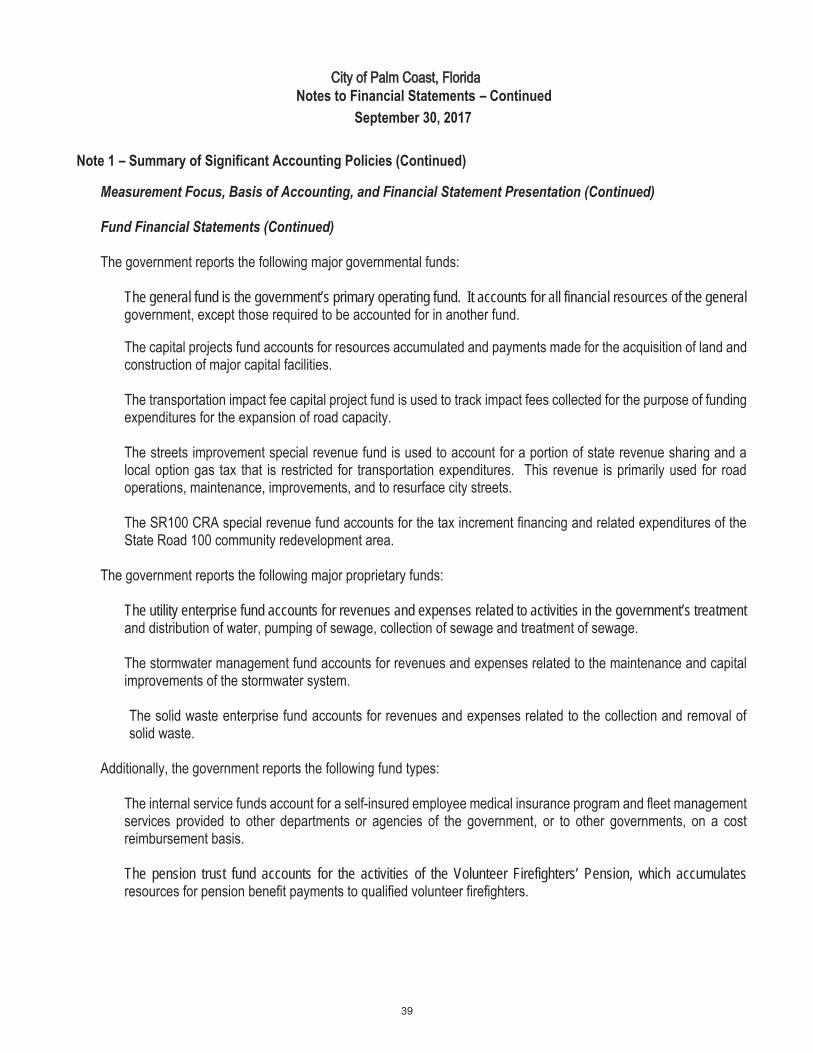
The general fund is the government’s primary operating fund. It accounts for all financial resources of the general
The utility enterprise fund accounts for revenues and expenses related to activities in the government’s treatment
The pension trust fund accounts for the activities of the Volunteer Firefighters’ Pension, which accumulates
–
–
–
–
fund’s principal ongoing activities. The principal operating revenues of the City’s enterprise funds and the internal
The City’s cash and cash equivalents are cash on hand, demand deposi
year are referred to as either “due to/from other funds” (i.e., the current portion of interfund loans) or “advances to/from other funds” (i.e., the nonreported as “due to/from other funds.” Any residual balances outstanding between governmental
wide financial statements as “internal balances".

–
–

–
–

–
–
–
–

–
–

City of Palm Coast, Florida Notes to Financial Statements – Continued
September 30, 2017
Note 1 – Summary of Significant Accounting Policies (Continued)
Compensated Absences
Employees may accumulate vacation and sick leave with certain limitations as to the number of hours of accumulation. General employees are paid 100% of their accumulated vacation pay and sick leave when they terminate up to a maximum of 320 hours for vacation and 320 hours for sick leave (448 hours each for fire department personnel), as long as they are not dismissed with cause or fail to meet the 10 day notice requirement for voluntary resignations. The related liability for this policy is reported as incurred in the government-wide and proprietary fund financial statements. A liability for those amounts is recorded in governmental funds only if the liability has matured as a result of employee resignations or retirements. The liability for compensated absences includes salary-related benefits, where applicable.
Proprietary funds operating and nonoperating revenues and expenses
Proprietary funds distinguish operating revenues and expenses from nonoperating items. Operating revenues and expenses generally result from providing services and producing and delivering goods in connection with a proprietary fund's principal ongoing operations. The principal operating revenues of the utility, solid waste, stormwater and other proprietary funds along with internal service funds are charges to customers for sales and services. Operating expenses for these funds include the cost of sales and services, administrative expenses, and depreciation on capital assets. All revenues and expenses not meeting this definition are reported as nonoperating revenues and expenses.
Recently Issued and Adopted Accounting Pronouncements
The Governmental Accounting Standards Board (“GASB”) has issued several pronouncements that have effective dates that may impact future financial statements. Listed below are pronouncements with required implementation dates effective for subsequent fiscal years that have not yet been implemented. Management has not currently determined what, if any, impact implementation of the following will have on the City’s financial statements:
1. GASB issued Statement No. 75, Accounting and Financial Reporting for Postemployment Benefits Other ThanPensions, in June 2015, which establishes standards for recognizing and measuring liabilities, deferred outflows ofresources, deferred inflows of resources, and expense/expenditures. GASB 75 seeks to improve accounting andfinancial reporting by state and local governments for postemployment benefits other than pensions. The provisionsin GASB 75 are effective for fiscal years beginning after June 15, 2017.
2. GASB issued Statement No. 82, Pension Issues—An Amendment of GASB Statements No. 67, No. 68, and No. 73,in March 2016. GASB 82 addresses issues regarding (1) the presentation of payroll-related measures in requiredsupplementary information, (2) the selection of assumptions and the treatment of deviations from the guidance in anActuarial Standard of Practice for financial reporting purposes, and (3) the classification of payments made byemployers to satisfy employee (plan member) contribution requirements. The provisions in GASB 82 are effective forperiods beginning after either June 15, 2016 or June 15, 2017, if certain assumptions are met.
City of Palm Coast, Florida Notes to Financial Statements – Continued
September 30, 2017
Note 1 – Summary of Significant Accounting Policies (Continued)
Recently Issued and Adopted Accounting Pronouncements (Continued)
3. GASB issued Statement No. 83, Certain Asset Retirement Obligations, in November 2016. GASB 83 addressesaccounting and financial reporting for certain asset retirement obligations (AROs), which are legally enforceableliabilities associated with the retirement of a tangible capital asset. The provisions in GASB 81 are effective forperiods beginning after June 15, 2018.
4. GASB issued Statement No. 84, Fiduciary Activities, in January 2017. GASB 84 improved guidance regarding theidentification and reporting of fiduciary activities. The provisions in GASB 84 are effective for periods beginning afterDecember 15, 2018.
5. GASB issued Statement No. 85, Omnibus 2017, in March 2017. GASB 85 improves guidance addressing severaldifferent accounting and financial reporting issues identified during the implementation and application of certainGASB pronouncements. The provisions in GASB 85 are effective for periods beginning after June 15, 2017.
6. GASB issued Statement No. 86, Certain Debt Extinguishment Issues, in May 2017. GASB 86 improves consistencyin accounting and financial reporting for in-substance defeasance of debt by providing guidance for transactions inwhich cash and other monetary assets acquired with only existing resources. The provisions in GASB 86 areeffective for periods beginning after June 15, 2017.
7. GASB issued Statement No. 87, Leases, in June 2017. GASB 87 aims to better meet the information needs offinancial statement users by improving accounting and financial reporting for leases by governments. The provisionsin GASB 87 are effective for periods beginning after December 15. 2019.
–
–
––
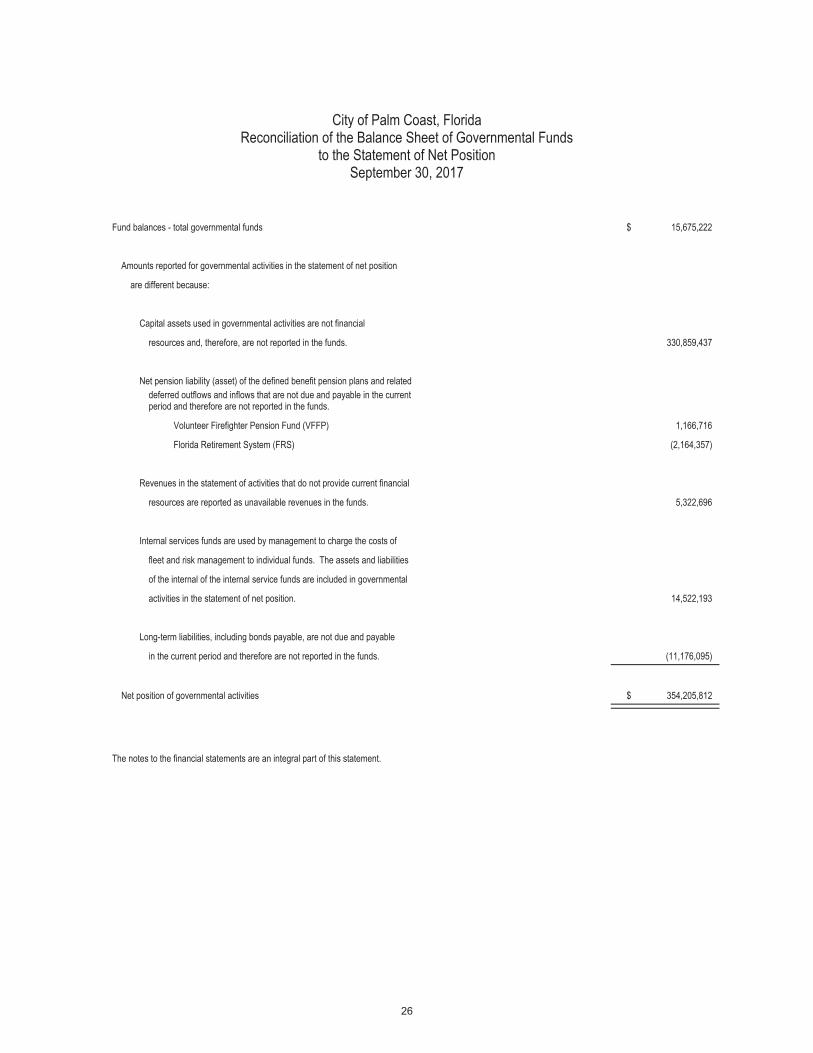
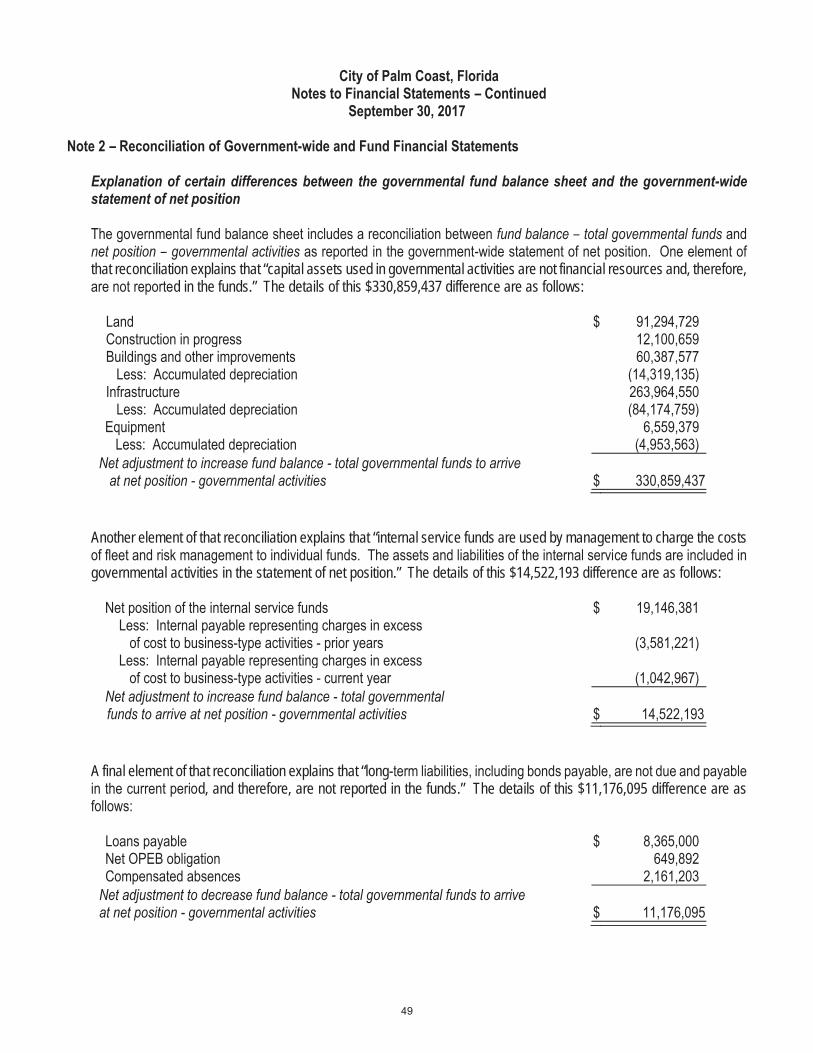
that reconciliation explains that “capital assets used in governmental activities are not financial resources and, therefore,d in the funds.” The details of this $330,859,437 difference are as follows:
Another element of that reconciliation explains that “internal service funds are used by management to charge the costs
governmental activities in the statement of net position.” The details of this $14,522,193 difference are as follows:
A final element of that reconciliation explains that “longd, and therefore, are not reported in the funds.” The details of this $11,176,095 difference are as

–
–
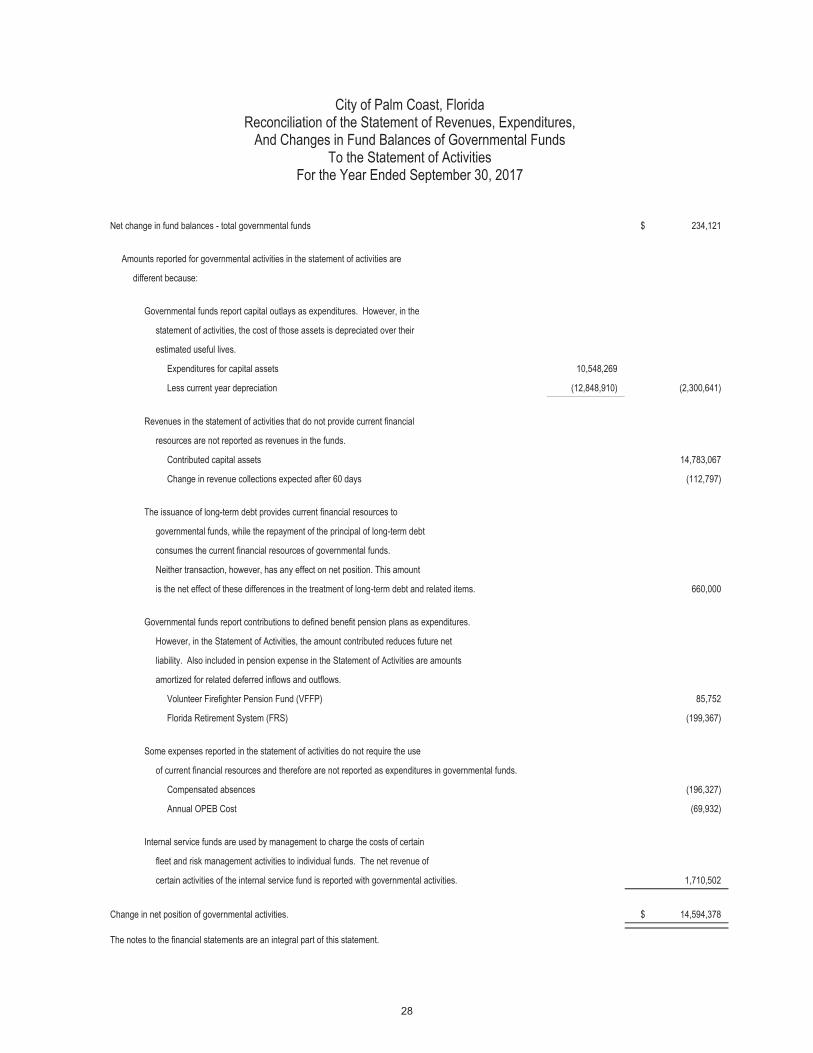
–ion states that “the issuance
–

City of Palm Coast, FloridaNotes to Financial Statements – Continued
September 30, 2017
Note 4 – Deposits and Investments
Deposits
At year-end, the carrying amount of the City's deposits was $7,920,889 and the bank balance was $9,931,440. All bank deposits were fully covered by federal depository insurance and by deposits held in banks that are members of the State of Florida's Collateral Pool as specified under Florida law. Florida Statutes provide for collateral pooling by banks and savings and loans. This limits local government deposits to "authorized depositories". Included in the carrying amount of the City deposits is $8,233 in petty cash.
Investments
The City follows guidelines of Florida Statute Section 218.415, which allows the following investments:The Local Government Surplus Funds Trust FundSEC registered money market funds with the highest credit quality rating from a nationally recognized ratingagencyInterest bearing time deposits or savings accounts in qualified public depositoriesDirect obligations of the U.S. TreasuryFederal Agencies and instrumentalitiesSupranational bondsCommercial paperCorporate bonds
As of September 30, 2017, the City has the following investments:
Percentage AverageInvestment Type Fair Value of Total MaturitiesFlorida Prime LGIP $ 12,458,796 21.11 51 Days U.S. Government Agencies 15,405,675 26.11 1-3 YearsU.S. Treasuries 16,729,217 28.35 1-3 YearsCorporate Issues 11,318,591 19.18 1-5 YearsMunicipal Bonds 1,002,028 1.70 1-3 YearsForeign Issues 2,102,645 3.56 1-3 Years
$ 59,016,952
The City categorizes its fair value measurements within the fair value hierarchy established by generally accepted accounting principles. The hierarchy is based on the valuation inputs used to measure the fair value of the asset. Level 1 inputs are quoted prices in active markets for identical assets; Level 2 inputs are significant other observable inputs; Level 3 are significant unobservable inputs. The City has the following recurring fair value measurements as of September 30,2017:
Fixed Income Securities - Valued using pricing models maximizing the use of observable inputs for similarsecurities. This includes basing value on yield currently available on comparable securities of the issuerswith similar credit ratings.

City of Palm Coast, FloridaNotes to Financial Statements – Continued
September 30, 2017
Note 4 – Deposits and Investments (Continued)
The following table summarizes the assets and liabilities of the City for which fair values are determined on a recurring bases as of September 30, 2017:
Quoted Pricesin Active
Markets for Significant SignificantIdentical Assets
Observable Inputs
Unobservable Inputs
Investment Type Amount (Level 1) (Level 2) (Level 3) Fair ValueU.S. Government Agencies $ 15,405,675 $ - $ 15,405,675 $ - $ 15,405,675 U.S. Treasuries 16,729,217 - 16,729,217 - 16,729,217Corporate Issues 11,318,591 - 11,318,591 - 11,318,591Municipal Bonds 1,002,028 - 1,002,028 - 1,002,028Foreign Issues 2,102,645 2,102,645 2,102,645
Total investments by fair value level $ 46,558,156 $ - $ 46,558,156 $ - $ 46,558,156
Investments measured at the net asset value (NAV)External Investment Pool: SBA Florida Prime $ 12,458,796 Total investments measured at NAV 12,458,796 Total investments measured at fair value $ 59,016,952
The City’s investments in the Florida Local Government Surplus Funds Trust Fund Investment Pool (Florida PRIME), a Securities and Exchange Commission rule 2a7-like external investment pool, are similar to money market funds in which shares are owned in the fund rather than the underlying investments. The Florida PRIME investment pool is administered by the State Board of Administration (SBA) pursuant to section 218.405 of the Florida Statutes.
The pool invests in short–term, high-quality fixed income securities. To be considered high-quality, the security must be rated highest in the short-term rating category by one or more nationally recognized statistical ratings organizations, or deemed to be of comparable quality by the investment manager. Florida PRIME meets all of the necessary criteria to elect to measure all of the investments in the fund at amortized cost. The account balance of this fund is considered to be the fair value of this investment. As of September 30, 2017, Standard and Poor's Ratings Services assigned its "AAAm" principal stability fund rating to Florida PRIME. The occurrence of an event that has a material impact on liquidity or operations of the trust fund can cause limits on contributions or withdrawals. During the fiscal year there were no redemption fees or maximum transaction amounts, or any other requirements that serve to limit a participant's daily access to 100% of their account value. Separate financial statements for the pool are available by contacting the Florida State Board of Administration.

City of Palm Coast, FloridaNotes to Financial Statements – Continued
September 30, 2017
Note 4 – Deposits and Investments (Continued)
Interest Rate Risk. The City’s investment policy limits the maturities of operating funds to a maximum of twenty-four (24) months. Bond reserves, construction funds, and other non-operating funds cannot exceed maturities of ten (10)years. Longer maturities, not to exceed thirty (30) years, may be used in special circumstances. The maximumlength to maturity for an investment in any U.S. Government Agency security is ten (10) years from the date ofpurchase.
Credit Risk. The City’s investment policy allows investment in high grade corporate notes and government sponsored agencies with a minimum A rating by Standard and Poor’s. Commercial paper is required to have a rating of A-1 by Standard and Poor’s. Foreign Issues requirements are that the US is a shareholder and voting member with a long term debt rating of "AAA" category, or a short term debt rating of A-1 or higher, by any two NRSROs at the time of purchase. As of September 30, 2017, the City’s investments in U.S. Government Agencies were rated AA+, commercial paper rated A-1, corporate and municipal bonds rated between A- and AAA by Standard & Poor’s, and foreign issues were rated AAA by Standard and Poor's and Aaa by Moody's.
Concentrations of Credit Risk. The City’s investment policy allows a maximum of seventy-five (75) percent of available funds to be invested in U.S. Government Agencies. As of September 30, 2017, the City’s largest agency investment is in the Federal Home Loan Bank (FHLB).
Cash with fiscal agent as of September 30, 2017 totaled $4,903,375. This amount represents the semi-annual utility bond principal and interest payments on deposit with the distributing agent.
Note 5 – Receivables
Amounts are aggregated into single accounts receivable (net of allowance for uncollectibles) line for certain funds and aggregated columns. Below is a detail of receivables, including applicable allowances for uncollectible accounts:
Special Allowance forAccounts Assessments Doubtful
Receivable Receivable Accounts TotalsGeneral Fund $ 751,098 $ - $ - $ 751,098 Nonmajor Governmental Funds - 4,700,616 - 4,700,616Utility Fund 5,284,725 - (453,562) 4,831,163Solid Waste Fund 1,316,191 - (117,373) 1,198,818Stormwater Fund 2,047,305 - (369,721) 1,677,584Nonmajor Enterprise Funds 97,238 - (3,108) 94,130 Fleet Management Fund 2,249 - - 2,249
Totals $ 9,498,806 $ 4,700,616 $ (943,764) $ 13,255,658
The special assessments receivable is the amount due from property owners within the Old Kings Road Special Assessment District (see Note 15). The amount due as of September 30, 2017 represents the balance remaining on the financing of the expansion and realignment of Old Kings Road.

–
–

–
–
–

City of Palm Coast, Florida Notes to Financial Statements – Continued
September 30, 2017
Note 8 – Interfund Receivables, Payables, and Transfers (Continued)
Interfund transfers:
Transfer In: Transfer out: Capital Streets
General Fund
Projects Fund
Improvement Fund
SR 100 CRA Fund
Fleet Fund
Nonmajor Governmental Total
General Fund $ - $ - $ $ 594,922 $ 69,376 $ - $ 664,298 Utility Fund 725,136 - - 77,184 - 802,320 Transportation Impact Fee Fund - 33,514 700,000 - - 106,083 839,597 Capital Projects Fund - - - - 130,000 130,000 SR100 CRA Fund - 575,000 - - - 575,000 Stormwater Fund 99,679 - - 38,796 - 138,475 Nonmajor Governmental - 230,000 - - - 230,000 Nonmajor Proprietary 15,335 - - 25,234 - 40,569
Total transfers out $ 840,150 $ 838,514 $ 700,000 $ 594,922 $ 210,590 $ 236,083 $ 3,420,259
Transfers from the General Fund are generally made to establish reserves for future capital expenditures, possible emergency related expenditures, and to move unrestricted general fund revenues to finance various programs that are accounted for in other funds in accordance with budgetary authorizations. The transfers to the Capital Projects Fund are for the funding of restroom facilities at different park locations, and for the funding of a Community Wing at City Hall. Transfers to the CRA Fund represent base property tax collections within the redevelopment area and to fund capital expenditures. Other transfers from the Utility Fund, Stormwater Fund, Nonmajor Governmental and Nonmajor Proprietary Funds are in lieu of tax transfers, maintenance transfers, and to establish reserves for future capital expenditures. The transfer from the Transportation Impact Fee Fund to Nonmajor Governmental Funds are impact fee collections related to the Old Kings Road Special Assessment District. Transfers to the Fleet Fund are to purchase new additions to the Fleet from the various responsible departments.
Note 9 – Leases and Agreements
Interlocal Agreements:
The City maintains an interlocal agreement with the Flagler County Sheriff for law enforcement services. The agreement provides for additional services above the base level of service provided by the Sheriff on a County-wide basis. For 2017, the total cost was $2,702,136.
Lease of City Owned Facilities:
The City leases various facilities to telecommunications companies, who provide wireless phone and Internet access to the public. The leases are for a five year period, with renewal options for an additional five years. Annual lease payments increase by the U.S. Consumer Price Index or 3 to 4%, whichever is greater. For fiscal year 2017, the total amount of these lease payments were $296,798.

–
–
–
–

City of Palm Coast, Florida Notes to Financial Statements – Continued
September 30, 2017
Note 10 – Long-Term Debt (Continued)
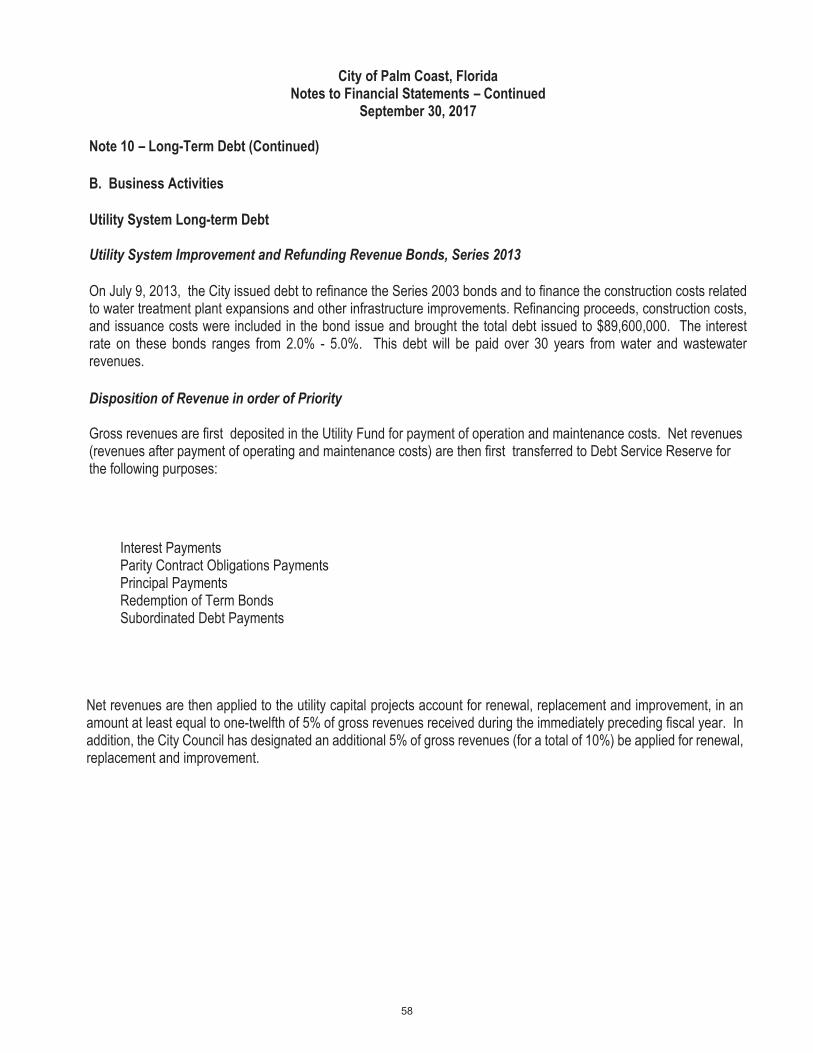
Utility System Improvement and Refunding Revenue Bonds, Series 2013 (Continued)
Any remaining net revenues after the above items are funded are considered surplus and may be used for any lawful purpose of the City.
The Series 2013 bonds are not secured by insurance or the reserve fund. During the fiscal year ended September 30, 2016, Standard & Poor's and Fitch provided an A+ rating on this bond issue.
Early Optional Redemption
The Series 2013 bonds maturing on or after October 1, 2024 are redeemable prior to their stated dates of maturity, at the option of the City, in whole or in part on any date on or after October 1, 2023, at the redemption prices equal to the principal amount of the Series 2013 Bonds to be redeemed plus interest accrued to the date of redemption.
Debt Service
Annual debt service requirements to maturity for the bonds are as follows:
Year Ending September 30, Principal Interest
2018 $ 3,010,000 $ 3,636,250 2019 3,160,000 3,478,250 2020 3,320,000 3,312,250 2021 3,485,000 3,138,000 2022 3,660,000 2,955,000
2023-2027 21,255,000 11,689,750 2028-2032 26,955,000 5,849,013 2033-2037 16,405,000 792,893
$ 81,250,000 $ 34,851,406
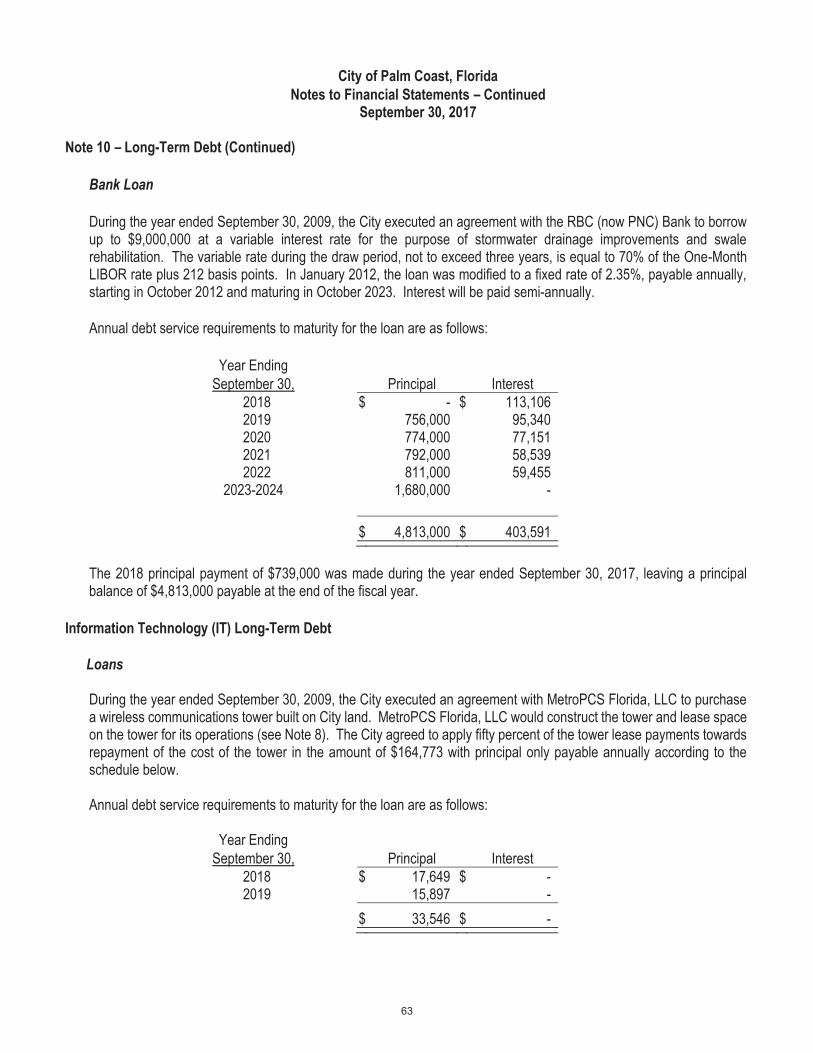
Bank Loans
During year ended September 30, 2016, the City executed an agreement with Ameris Bank to borrow funds in order to refinance the Series 2007 Utility Revenue Bonds. These bonds were originally used to finance a water treatment plant and related infrastructure. The loan principal of $40,193,000 is payable annually with interest at a rate of 2.48% payable semi-annually through October 2036.
City of Palm Coast, FloridaNotes to Financial Statements – Continued
September 30, 2017
Note 10 – Long-Term Debt (Continued)
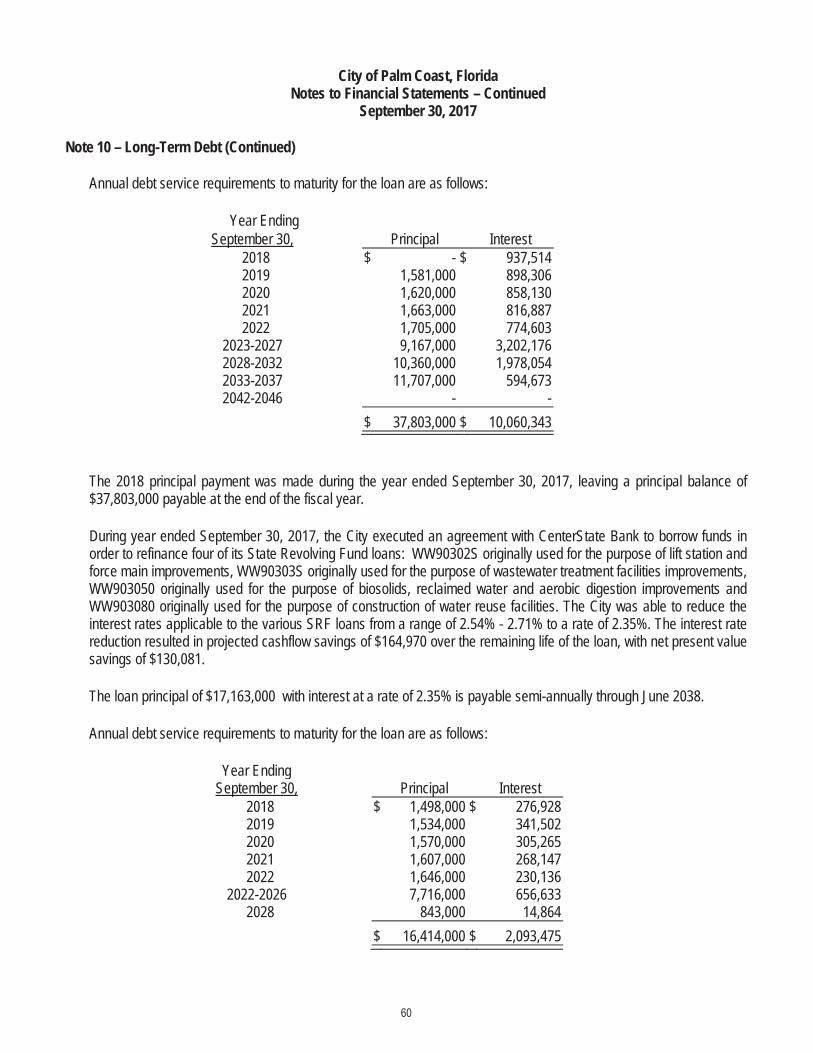
Annual debt service requirements to maturity for the loan are as follows:
Year EndingSeptember 30, Principal Interest
2018 $ - $ 937,514 2019 1,581,000 898,306 2020 1,620,000 858,130 2021 1,663,000 816,887 2022 1,705,000 774,603
2023-2027 9,167,000 3,202,176 2028-2032 10,360,000 1,978,054 2033-2037 11,707,000 594,673 2042-2046 - -
$ 37,803,000 $ 10,060,343
The 2018 principal payment was made during the year ended September 30, 2017, leaving a principal balance of $37,803,000 payable at the end of the fiscal year.
During year ended September 30, 2017, the City executed an agreement with CenterState Bank to borrow funds in order to refinance four of its State Revolving Fund loans: WW90302S originally used for the purpose of lift station and force main improvements, WW90303S originally used for the purpose of wastewater treatment facilities improvements, WW903050 originally used for the purpose of biosolids, reclaimed water and aerobic digestion improvements and WW903080 originally used for the purpose of construction of water reuse facilities. The City was able to reduce the interest rates applicable to the various SRF loans from a range of 2.54% - 2.71% to a rate of 2.35%. The interest rate reduction resulted in projected cashflow savings of $164,970 over the remaining life of the loan, with net present value savings of $130,081.
The loan principal of $17,163,000 with interest at a rate of 2.35% is payable semi-annually through June 2038.
Annual debt service requirements to maturity for the loan are as follows:
Year EndingSeptember 30, Principal Interest
2018 $ 1,498,000 $ 276,928 2019 1,534,000 341,502 2020 1,570,000 305,265 2021 1,607,000 268,147 2022 1,646,000 230,136
2022-2026 7,716,000 656,633 2028 843,000 14,864
$ 16,414,000 $ 2,093,475

–
–
–
–
–
–

City of Palm Coast, Florida Notes to Financial Statements – Continued
September 30, 2017
Note 10 – Long-Term Debt (Continued)
Changes in long-term debt
During the year ended September 30, 2017, the following changes in long-term debt occurred:
Beginning Ending Due Within Governmental Activities: Balance Additions Reductions Balance One Year SR100 CRA Loans $ 9,025,000 $ - $ (660,000) $ 8,365,000 $ -Net OPEB Obligation 599,132 79,754 - 678,886 -Net Pension Liability 3,032,226 345,636 - 3,377,862 -Compensated Absences 2,027,069 1,225,168 (1,028,819) 2,223,418 814,389 Long-term debt $ 14,683,427 $ 1,650,558 $ (1,688,819) $ 14,645,166 $ 814,389
Business Type Activities:Utility Revenue Bonds $ 84,120,000 $ - $ (2,870,000) $ 81,250,000 $ 3,010,000 Premiums 5,353,487 - (524,670) 4,828,817 - Total Revenue Bonds 89,473,487 - (3,394,670) 86,078,817 3,010,000State Revolving FundLoans 28,128,909 21,963,946 (18,152,947) 31,939,908 1,515,649Bank and Other Loans 44,949,517 17,163,000 (3,048,971) 59,063,546 367,906Net OPEB Obligation 429,850 55,516 - 485,366 -Compensated Absences 1,211,188 821,291 (751,423) 1,281,056 514,505
Long-term debt $ 164,192,951 $ 40,003,753 $ (25,348,011) $ 178,848,693 $ 5,408,060
Internal service funds predominantly serve the governmental funds. Accordingly, long-term liabilities for them areincluded as part of the above totals for governmental activities. At year end, $62,215 of internal service fund compensated absences and $28,994 of net OPEB obligation are included in the above amounts. For governmental activities, compensated absences, net pension liability and net postemployment benefit obligations (OPEB) are generally liquidated by the general fund.

–
–
Volunteer Firefighters’ Pension Plan

–
–
Volunteer Firefighters’ Pension Plan
er’s Pension Plan is a single employer defined benefit pension plan that provides pensions for qualified volunteers pursuant to Florida Statute, Chapter 175. The City adopted a “local law” plan
The City of Palm Coast Volunteer Firefighter’s Pension Plan provides retirement, disability, and death benefits.
benefit will be actuarially reduced by three percent for each year by which the member’s age at retiremmember’s normal retirement age. Each member will become one hundred percent vested at normal retirement age,
mber’s normal retirement date (unreduced) or early retirement date (reduced). There are no

–
–
Volunteer Firefighters’ Pension Plan (Continued)

City of Palm Coast, Florida Notes to Financial Statements – Continued
September 30, 2017
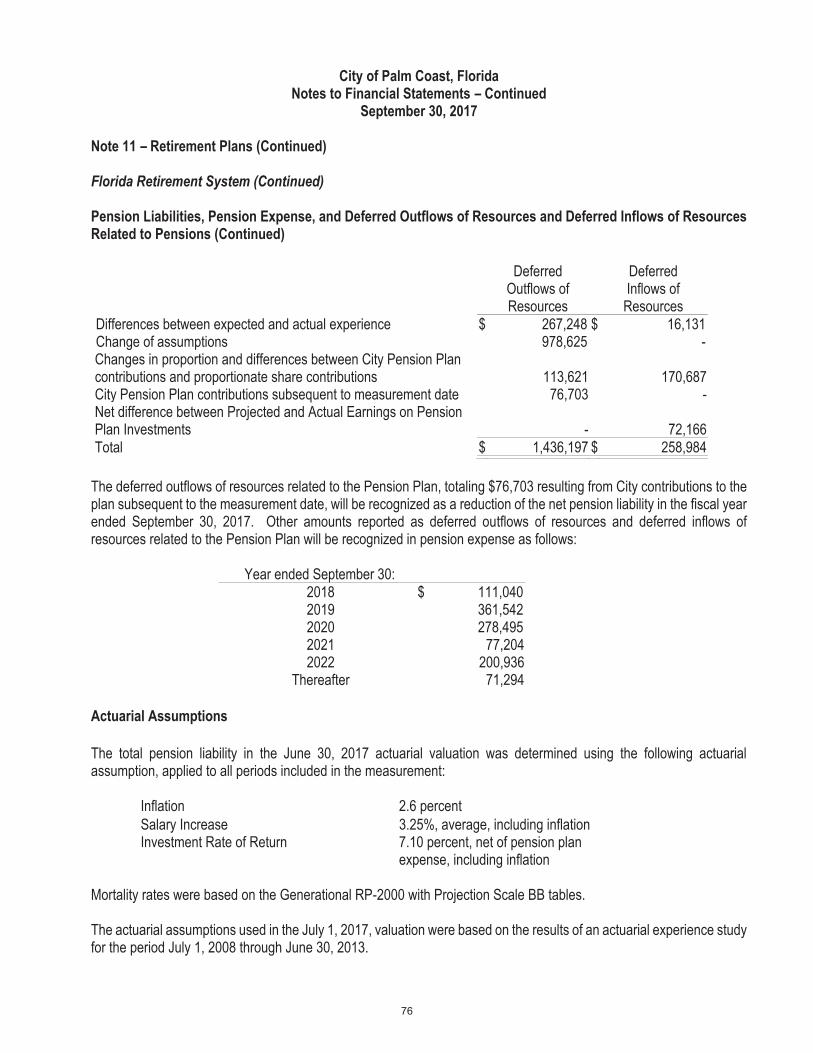
Note 11 – Retirement Plans (Continued)
Volunteer Firefighters’ Pension Plan (Continued)
Actuarial Assumptions
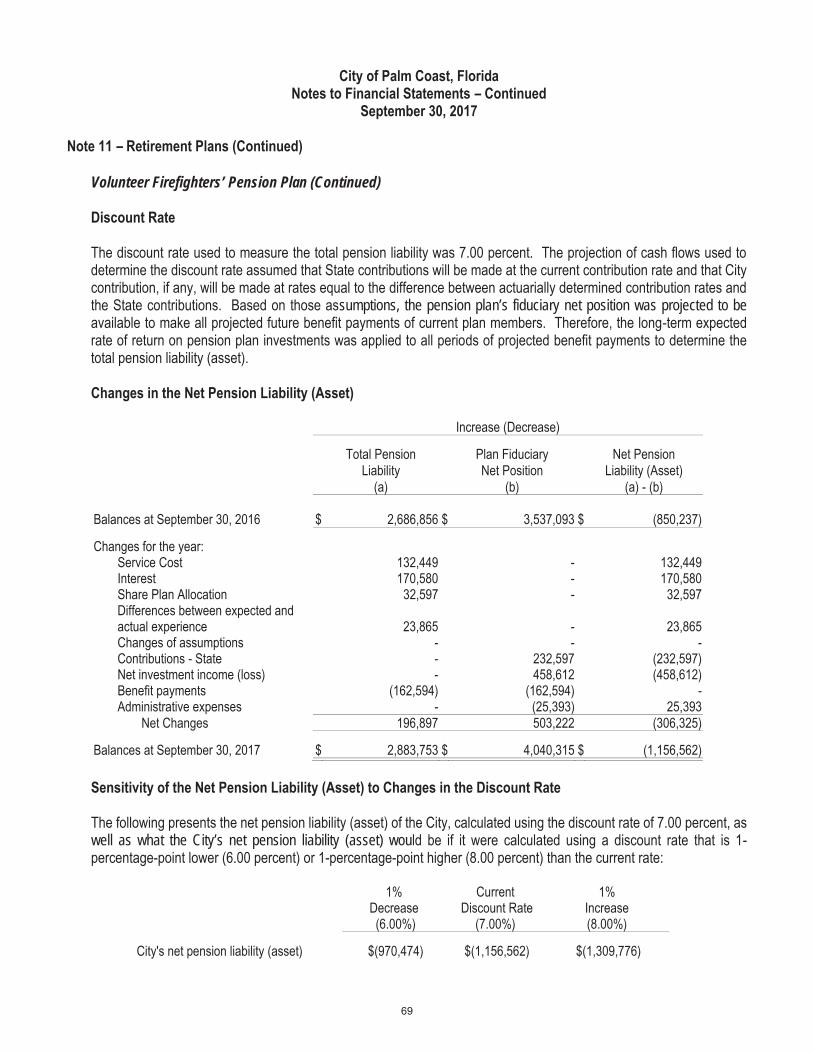
The total pension liability (asset) was determined by an actuarial valuation as of Oct 1, 2016 updated to September 30, 2017 using the following actuarial assumptions, applied to all periods included in the measurement:
Inflation 3.0 percent Salary Increase n/a, unpaid volunteers Discount Rate 7.00 percent Investment Rate of Return 7.00 percent
Mortality rates healthy lives were based on the RP-2000 Generational, 100% Annuitant White Collar, Scale BB for females and RP2000 Generational, 10% Annuitant White Collar /90% Annuitant Blue Collar, Scale BB for males. Mortality rates disabled lives were based on 60% RP2000 Disabled Female set forward two years / 40% Annuitant White Collar with no setback, no projection scale for females and 60% RP2000 Disabled Male setback four years / 40% Annuitant White Collar with no setback, no projection scale for males.
The date of the most recent experience study for which significant assumptions are based upon is not available.
The actuarial valuation utilized the entry age normal actuarial cost method. The amortization method is level dollar and the period is 30 years and is closed. The asset valuation method utilized the historical geometric 4-year average Market Value return. Plan assets are reported at fair value.
The long-term expected rate of return on pension plan investments was determined using a building-block method which best estimate ranges of expected future real rates of return (expected returns, net of pension plan investment expense and inflation) are developed for each major asset class. For 2017 the inflation rate assumption of the investment advisor was 2.90%. These ranges are combined to produce the long-term expected rate of return by weighting the expected future real rates of return by the target asset allocation percentage and by adding expected inflation. Best estimates of arithmetic real rates of return for each major asset class included in the pension plan’s target asset allocation as of September 30, 2017 (see discussion of the pension plan’s investment policy) are summarized in the following table:
Asset Class
Target Allocation Long Term Expected Real Rate of Return
U.S. Large Cap Equity 34% 5.10% U.S. Small Cap Equity 11% 5.60% International Equity 15% 5.60% Core Real Estate 10% 4.50% Core Bonds 12% 1.40% Core Plus 18% 1.70% Total 100%
–
–
Volunteer Firefighters’ Pension Plan (Continued)
sumptions, the pension plan’s fiduciary net position was projected to be
well as what the City’s net pension liability (asset) wou

City of Palm Coast, Florida Notes to Financial Statements – Continued
September 30, 2017
Note 11 – Retirement Plans (Continued)
Volunteer Firefighters’ Pension Plan (Continued)
Pension Plan Fiduciary Net Position
The plan does not issue a separate financial report. Information about the plan's fiduciary net position is available on pages 35-36 of this report.
Pension Expense, Deferred Outflows and Inflows of Resources
For the year ended September 30, 2017, the City recognized pension expense (benefit) of $146,845. On September 30, 2017, the City reported Deferred Outflows of Resources and Deferred Inflows of Resources related to pensions from the following sources:
Deferred Outflows of Resources
Deferred Inflows of Resources
Differences between Expected and Actual Experience $ 19,092 $ 67,254 Changes of assumptions 111,387 - Net difference between Projected and Actual Earnings on Pension Plan Investments - 53,071 Total $ 130,479 $ 120,325
Amounts reported as deferred outflows of resources and deferred inflows of resources related to pensions will be recognized in pension expense as follows:
Year ended September 30: 2018 $ 34,983 2019 34,983 2020 (22,694) 2021 (37,118) 2022 - Thereafter -
Investment Policy
The Plan’s policy in regard to the allocation of invested assets is established and may be amended by the Board by a majority vote of its members. It is the policy of the Board to pursue an investment strategy that reduces risk through the prudent diversification of the portfolio across a broad selection of distinct asset classes. The pension plan’s investment policy discourages the use of cash equivalents, except for liquidity purposes, and aims to refrain from dramatically shifting asset class allocations over short time spans. The following was the Board’s adopted asset allocation policy as of September 30, 2017:
City of Palm Coast, Florida Notes to Financial Statements – Continued
September 30, 2017
Note 11 – Retirement Plans (Continued)
Volunteer Firefighters’ Pension Plan (Continued)
Investment Policy (Continued)
Investments
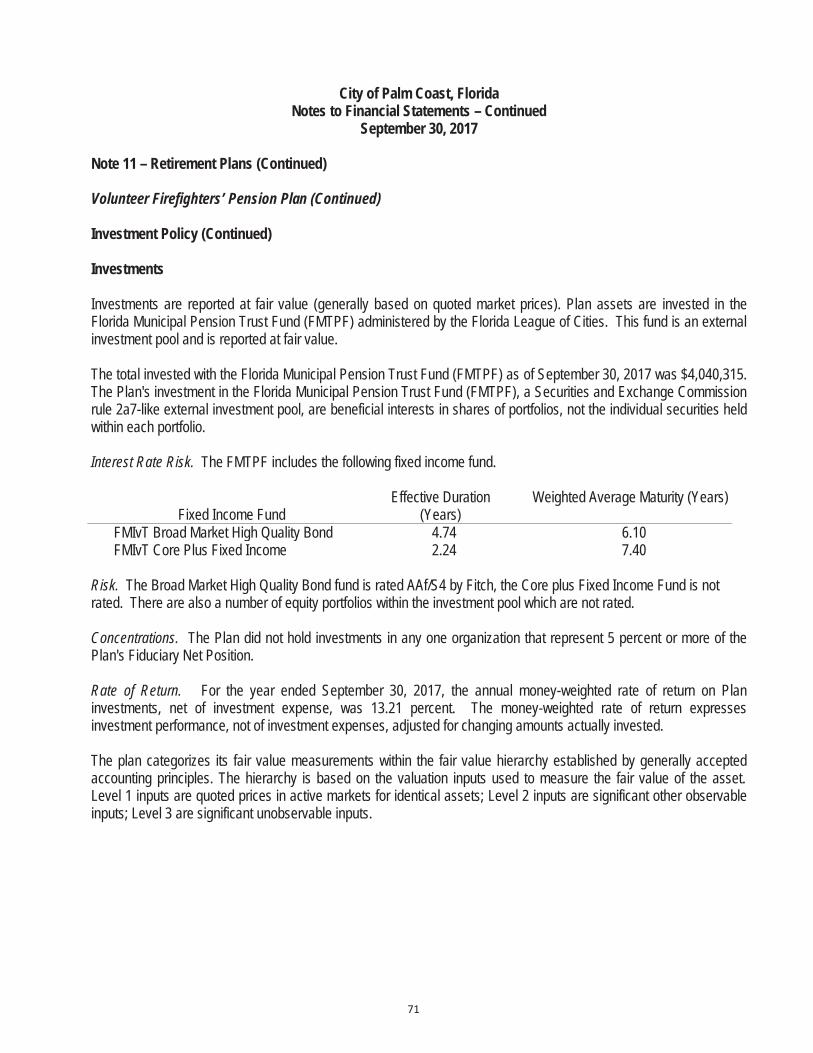
Investments are reported at fair value (generally based on quoted market prices). Plan assets are invested in the Florida Municipal Pension Trust Fund (FMTPF) administered by the Florida League of Cities. This fund is an external investment pool and is reported at fair value.
The total invested with the Florida Municipal Pension Trust Fund (FMTPF) as of September 30, 2017 was $4,040,315. The Plan's investment in the Florida Municipal Pension Trust Fund (FMTPF), a Securities and Exchange Commission rule 2a7-like external investment pool, are beneficial interests in shares of portfolios, not the individual securities held within each portfolio.
Interest Rate Risk. The FMTPF includes the following fixed income fund.
Fixed Income Fund Effective Duration
(Years) Weighted Average Maturity (Years)
FMIvT Broad Market High Quality Bond 4.74 6.10 FMIvT Core Plus Fixed Income 2.24 7.40
Risk. The Broad Market High Quality Bond fund is rated AAf/S4 by Fitch, the Core plus Fixed Income Fund is not rated. There are also a number of equity portfolios within the investment pool which are not rated.
Concentrations. The Plan did not hold investments in any one organization that represent 5 percent or more of the Plan's Fiduciary Net Position.
Rate of Return. For the year ended September 30, 2017, the annual money-weighted rate of return on Plan investments, net of investment expense, was 13.21 percent. The money-weighted rate of return expresses investment performance, not of investment expenses, adjusted for changing amounts actually invested.
The plan categorizes its fair value measurements within the fair value hierarchy established by generally accepted accounting principles. The hierarchy is based on the valuation inputs used to measure the fair value of the asset. Level 1 inputs are quoted prices in active markets for identical assets; Level 2 inputs are significant other observable inputs; Level 3 are significant unobservable inputs.

City of Palm Coast, Florida Notes to Financial Statements – Continued
September 30, 2017
Note 11 – Retirement Plans (Continued)
Volunteer Firefighters’ Pension Plan (Continued)
Investments (Continued)
The following table summarizes the assets and liabilities of the Plan for which fair values are determined on a recurring bases as of September 30, 2017:
Quoted Prices
in Active Markets for Significant Significant
Identical Observable Unobservable Assets Inputs Inputs
Investment Type Amount (Level 1) (Level 2) (Level 3) Fair Value Broad Market High Quality Bond $ 634,330 $ - $ 634,330 $ - $ 634,330 Core Plus Fixed Income 933,313 - - 933,313 933,313 High Quality Growth 323,225 - 323,225 - 323,225 Diversified Value 319,185 - 319,185 - 319,185 Russell 1000 Enhanced Index 941,393 - 941,393 - 941,393 Diversified Small to Mid Cap 444,435 - 444,435 - 444,435 International Blend 428,273 - 428,273 - 428,273
Total investments by fair value level $ 4,024,154 $ - $ 3,090,841 $ 933,313 $ 4,024,154 Uninvested Cash 16,161
Total investments at fair value $ 4,040,315
Reserves
During the year ended September 30, 2015, the City established a reserve amount per Ordinance 2015-02, and further revised per Ordinance 2015-10. The reserve was established at 20% of the September 30, 2013 Excess State Monies Reserve of $1,505,738, plus an allocation of annual earnings (losses), totaling $301,147. This reserve can be used to supplement the defined benefit funding in the event that fire insurance premium tax contributions are insufficient to pay the actuarially determined current costs and amortized unfunded past service cost, if any, as provided in Chapter 112, Florida Statutes. Subsequent to year end Ordinance 2015-10 was revised per Ordinance 2017-21 to establish the reserve to the Excess State Monies Reserve of $1,505,738 and any future premium tax revenues in excess of $200,000, beginning with plan year ending September 30, 2017.
City of Palm Coast, Florida Notes to Financial Statements – Continued
September 30, 2017
Note 11 – Retirement Plans (Continued)
Florida Retirement System
General Information
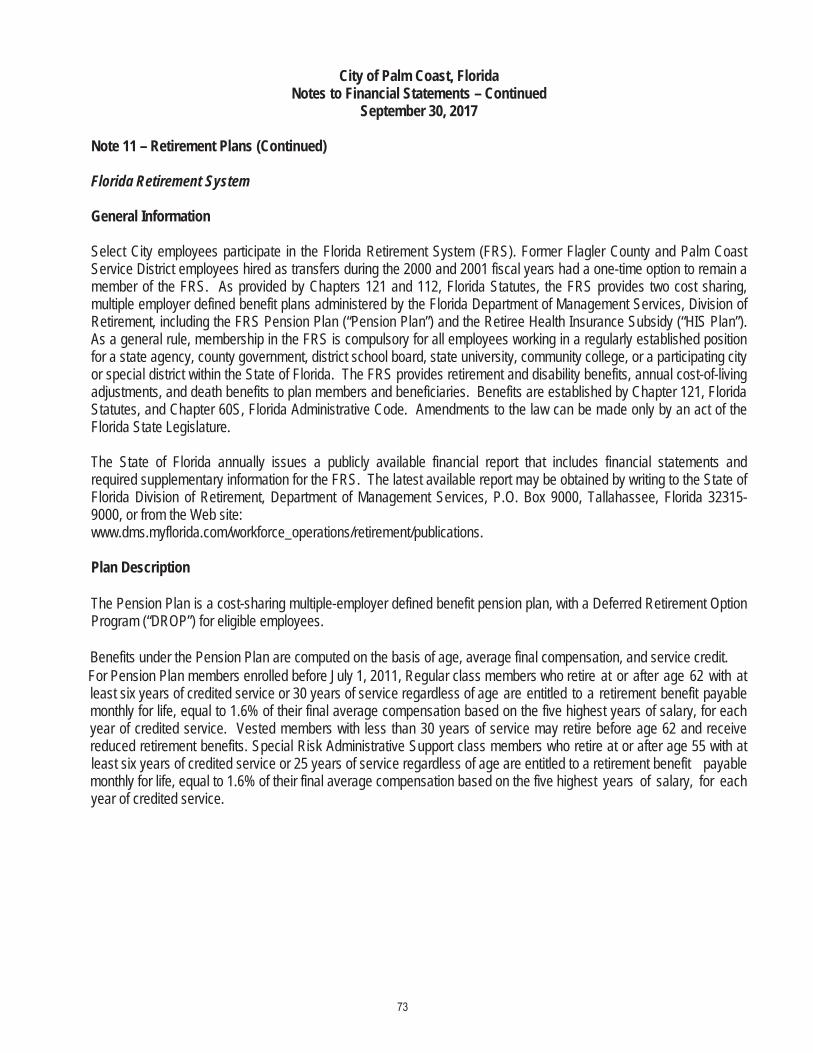
Select City employees participate in the Florida Retirement System (FRS). Former Flagler County and Palm Coast Service District employees hired as transfers during the 2000 and 2001 fiscal years had a one-time option to remain a member of the FRS. As provided by Chapters 121 and 112, Florida Statutes, the FRS provides two cost sharing, multiple employer defined benefit plans administered by the Florida Department of Management Services, Division of Retirement, including the FRS Pension Plan (“Pension Plan”) and the Retiree Health Insurance Subsidy (“HIS Plan”). As a general rule, membership in the FRS is compulsory for all employees working in a regularly established position for a state agency, county government, district school board, state university, community college, or a participating city or special district within the State of Florida. The FRS provides retirement and disability benefits, annual cost-of-living adjustments, and death benefits to plan members and beneficiaries. Benefits are established by Chapter 121, Florida Statutes, and Chapter 60S, Florida Administrative Code. Amendments to the law can be made only by an act of the Florida State Legislature.
The State of Florida annually issues a publicly available financial report that includes financial statements and required supplementary information for the FRS. The latest available report may be obtained by writing to the State of Florida Division of Retirement, Department of Management Services, P.O. Box 9000, Tallahassee, Florida 32315-9000, or from the Web site: www.dms.myflorida.com/workforce_operations/retirement/publications.
Plan Description
The Pension Plan is a cost-sharing multiple-employer defined benefit pension plan, with a Deferred Retirement Option Program (“DROP”) for eligible employees.
Benefits under the Pension Plan are computed on the basis of age, average final compensation, and service credit. For Pension Plan members enrolled before July 1, 2011, Regular class members who retire at or after age 62 with at least six years of credited service or 30 years of service regardless of age are entitled to a retirement benefit payable monthly for life, equal to 1.6% of their final average compensation based on the five highest years of salary, for each year of credited service. Vested members with less than 30 years of service may retire before age 62 and receive reduced retirement benefits. Special Risk Administrative Support class members who retire at or after age 55 with at least six years of credited service or 25 years of service regardless of age are entitled to a retirement benefit payable monthly for life, equal to 1.6% of their final average compensation based on the five highest years of salary, for each year of credited service.

–
–
rvice. Elected Officers’ class members who retire at or after age 62 with at least six years of credited
Regular, Senior Management Service, and Elected Officers’ class members, and to age 60 or 30 years of service

–
–
—— —
—22.71% and 21.43%; Elected Officers’— —
The City’s contributions, including employee contributions, to the Pension Plan totaled $33
proportionate share of the Pension Plan’s net
The City’s proportionate share of the net pension liability was based on the City’s 2016
–
–

City of Palm Coast, Florida Notes to Financial Statements – Continued
September 30, 2017
Note 11 – Retirement Plans (Continued)
Florida Retirement System (Continued)
Actuarial Assumptions (Continued)
The long-term expected rate of return on Pension Plan investments was not based on historical returns, but instead is based on a forward-looking capital market economic model. The allocation policy’s description of each asset class was used to map the target allocation to the asset classes shown below. Each asset class assumption is based on a consistent set of underlying assumptions and includes an adjustment for the inflation assumption. The target allocation and best estimates of arithmetic and geometric real rates of return for each major asset class are summarized in the following table:
Asset Class
TargetAllocation (1)
Annual Arithmetic Return
Compound Annual (Geometric) Return Standard
Deviation
Cash 1.0% 3.0% 3.0% 1.8% Fixed Income 18.0% 4.5% 4.4% 4.2% Global Equity 53.0% 7.8% 6.6% 17.0% Private Equity 6.0% 11.5% 7.8% 30.0% Strategic Investments 12.0% 6.1% 5.6% 9.7% Real Estate (property) 10.0% 6.6% 5.9% 12.8% Total 100%
Assumed Inflation - Mean 2.60% 1.9%
(1) As outlined in the Plan's investment policy
Discount Rate
The discount rate used to measure the total pension liability was 7.10%. The Pension Plan’s fiduciary net position was projected to be available to make all projected future benefit payments of current active and inactive employees. Therefore, the discount rate for calculation the total pension liability is equal to the long-term expected rate of return.
Sensitivity of the Net Pension Liability to Changes in the Discount Rate
The following represents the City’s proportionate share of the net pension liability calculated using the discount rate of 7.10%, as well as what the City’s proportionate share of the net pension liability would be if it were calculated using a discount rate that is one percentage point lower (6.10%) or one percentage point higher (8.10%) than the current rate:
1% Decrease (6.10%)
Current DiscountRate (7.10%)
1% Increase (8.10%)
City's net pension liability $ 5,270,475 $ 2,911,962 $ 953,855

–
–
Detailed information regarding the Pension Plan’s fiduciary net position is available in the separately issued FRS
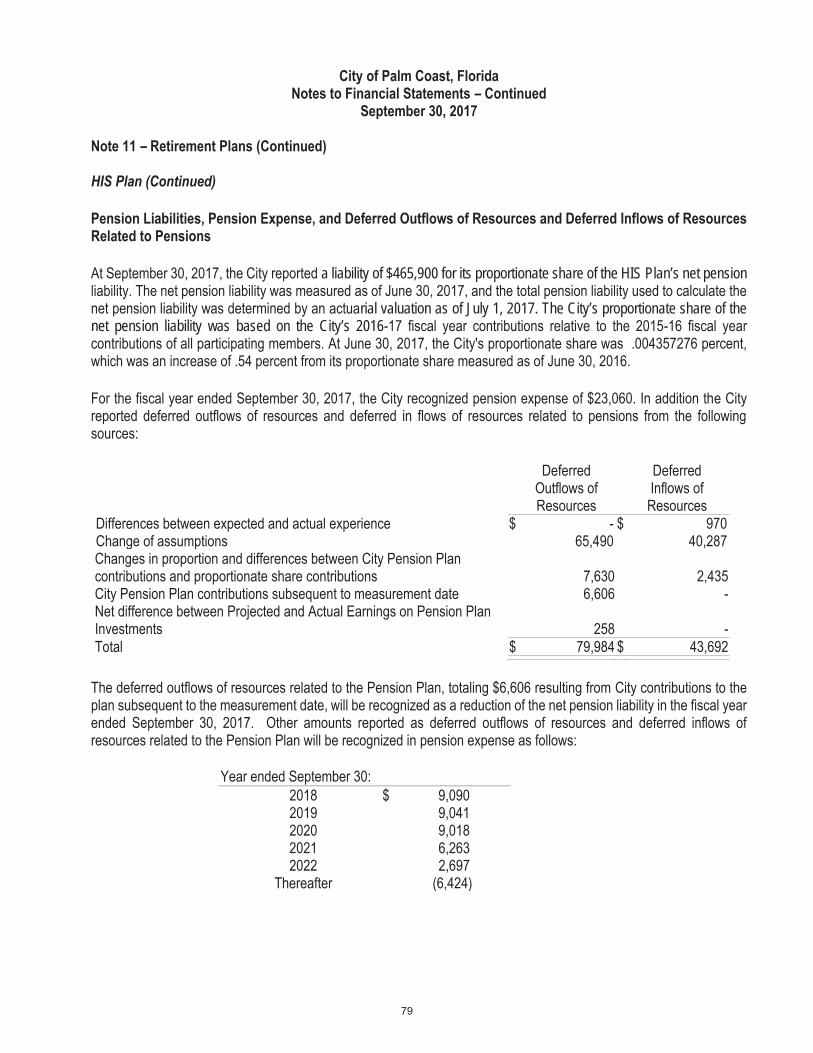
The City’s contributions to the HIS Plan totaled $23,339 for the fiscal year ended September 30, 2017.
–
–
a liability of $465,900 for its proportionate share of the HIS Plan’s net pension
rial valuation as of July 1, 2017. The City’s proportionate share of the net pension liability was based on the City’s 2016

–
–
The following represents the City’s proportionate share of the net pension liabi3.58%, as well as what the City’s proportionate share of the net pension liability would be if it were calculated using a
IS Plan’s fiduciary net position is available in the separately issued FRS Pension

–
–
–
The City provides retirees with the option to purchase health insurance from the City’s single employer, experience rated health insurance plan (Plan) that provides medical benefits to active and eligible retirees at the City’s gras mandated by Florida Statute 112.0801. This requirement creates an implicit rate subsidy benefit for the retirees’

–
–
The City’s annual other postemployment benefit cost (expense) is calculated based on the annual required contribution

–
–
–


–
–
–

–
–
l be between ten percent and twenty percent of the following year’s budgeted expenditures.
Unrestricted net position, at year end, will be between ten percent and twenty percent of the following year’s budgeted
Unrestricted net position, at year end, will be between ten percent and twenty percent of the following year’s budgeted
Unrestricted net position, at year end, will be between ten percent and twenty percent of the following year’s budgeted

–
–


REQUIRED SUPPLEMENTARY INFORMATION

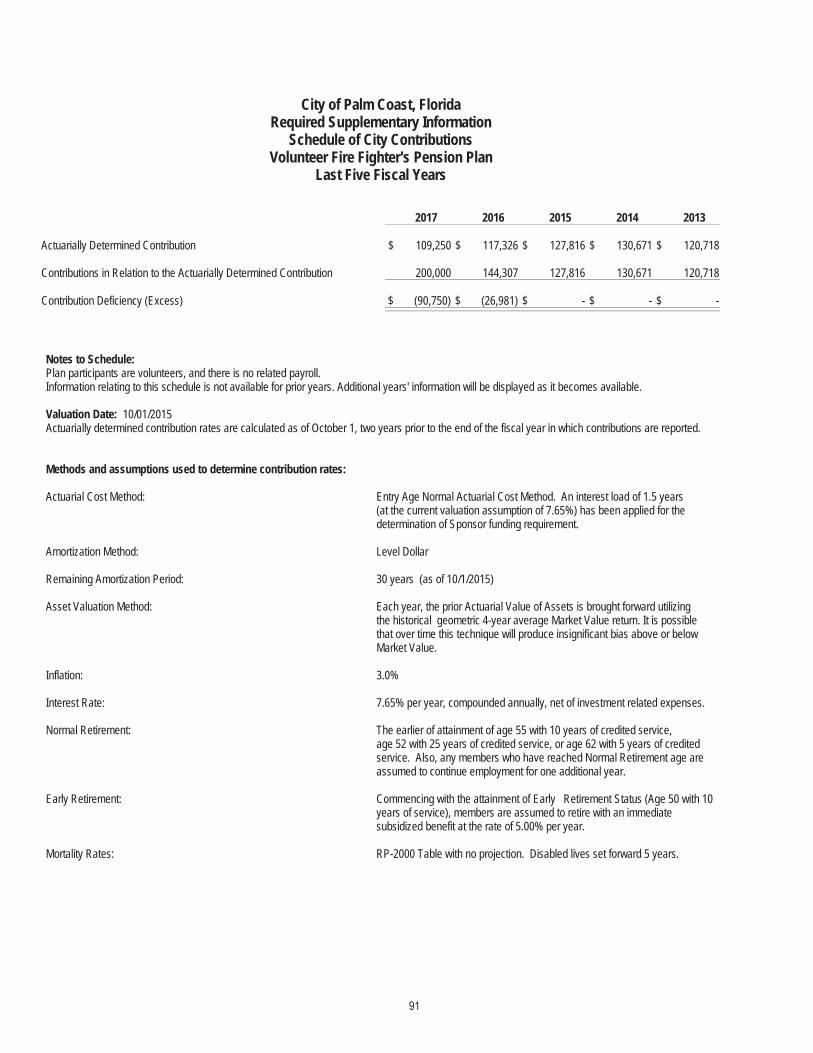
City of Palm Coast, Florida Required Supplementary Information
Schedule of City Contributions Volunteer Fire Fighter's Pension Plan
Last Five Fiscal Years
2017 2016 2015 2014 2013
Actuarially Determined Contribution $ 109,250 $ 117,326 $ 127,816 $ 130,671 $ 120,718
Contributions in Relation to the Actuarially Determined Contribution 200,000 144,307 127,816 130,671 120,718
Contribution Deficiency (Excess) $ (90,750) $ (26,981) $ - $ - $ -
Notes to Schedule: Plan participants are volunteers, and there is no related payroll. Information relating to this schedule is not available for prior years. Additional years' information will be displayed as it becomes available.
Valuation Date: 10/01/2015 Actuarially determined contribution rates are calculated as of October 1, two years prior to the end of the fiscal year in which contributions are reported.
Methods and assumptions used to determine contribution rates:
Actuarial Cost Method: Entry Age Normal Actuarial Cost Method. An interest load of 1.5 years (at the current valuation assumption of 7.65%) has been applied for the determination of Sponsor funding requirement.
Amortization Method: Level Dollar
Remaining Amortization Period: 30 years (as of 10/1/2015)
Asset Valuation Method: Each year, the prior Actuarial Value of Assets is brought forward utilizing the historical geometric 4-year average Market Value return. It is possible that over time this technique will produce insignificant bias above or below Market Value.
Inflation: 3.0%
Interest Rate: 7.65% per year, compounded annually, net of investment related expenses.
Normal Retirement: The earlier of attainment of age 55 with 10 years of credited service, age 52 with 25 years of credited service, or age 62 with 5 years of credited service. Also, any members who have reached Normal Retirement age are assumed to continue employment for one additional year.
Early Retirement: Commencing with the attainment of Early Retirement Status (Age 50 with 10 years of service), members are assumed to retire with an immediate subsidized benefit at the rate of 5.00% per year.
Mortality Rates: RP-2000 Table with no projection. Disabled lives set forward 5 years.


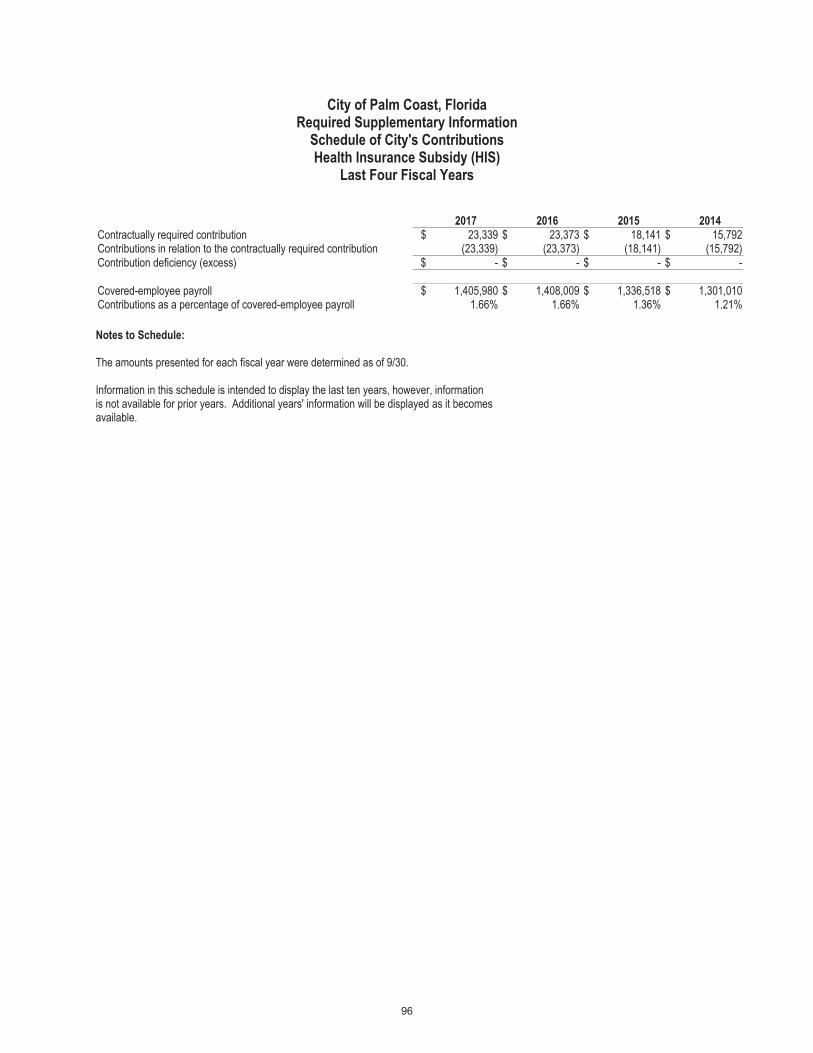


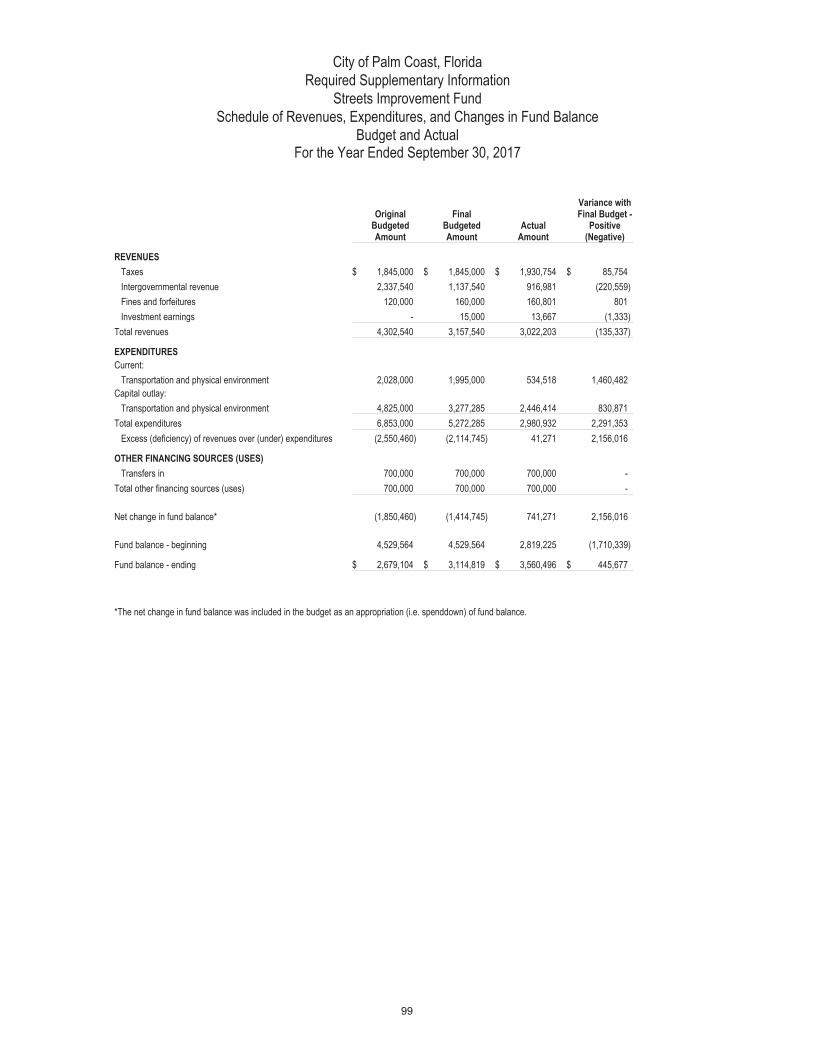


–


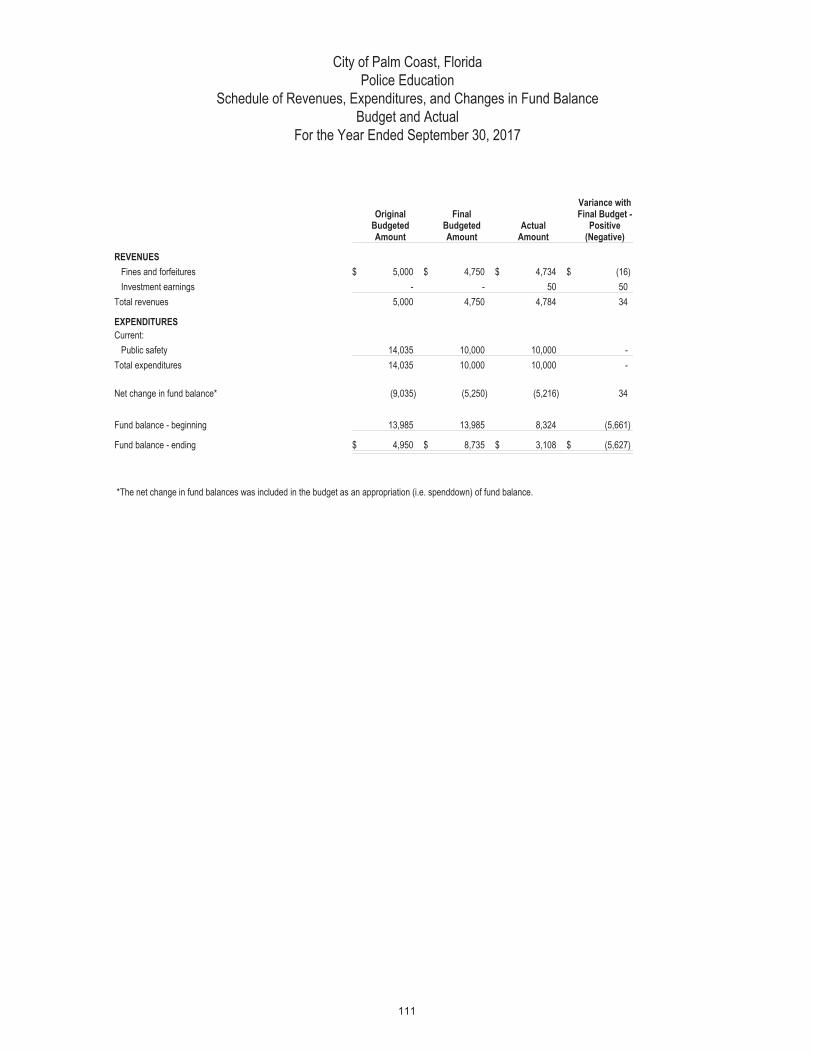
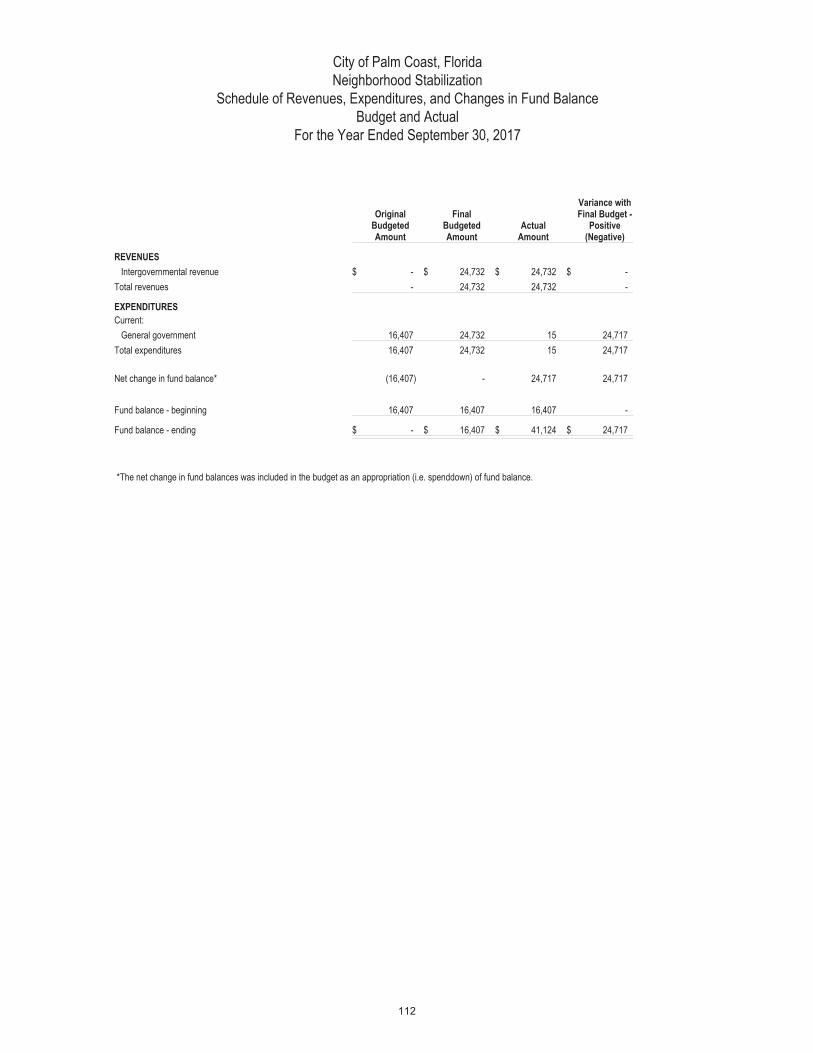
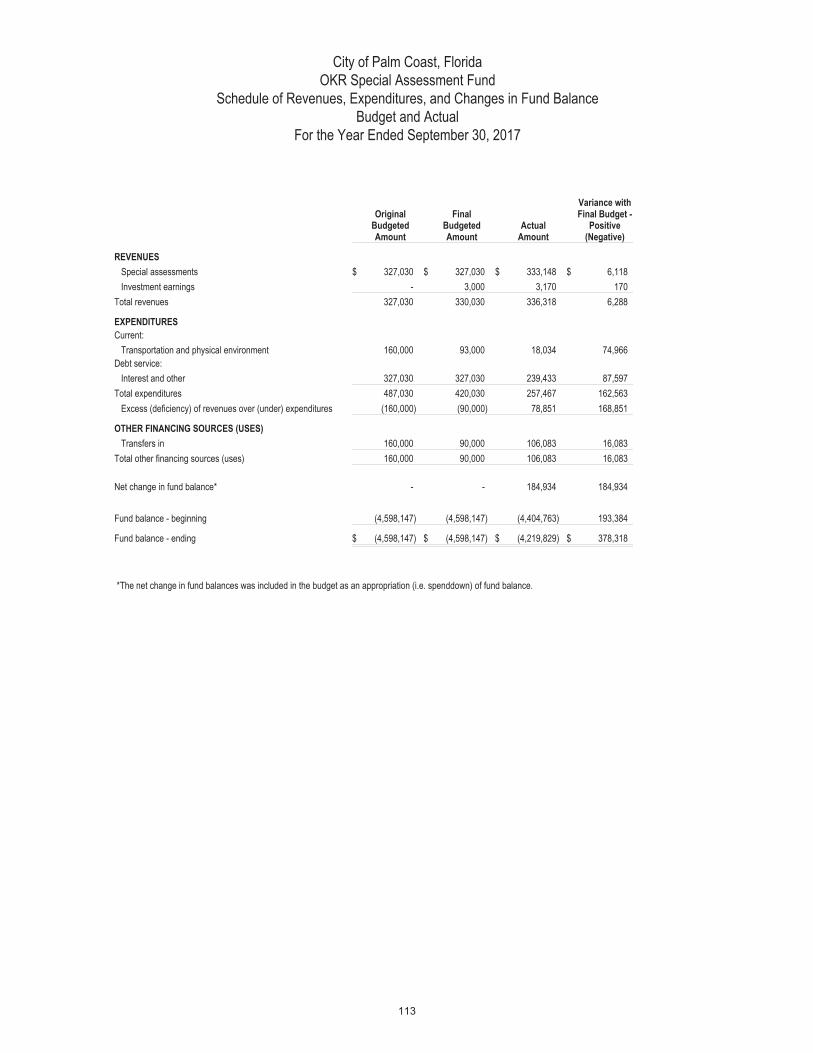
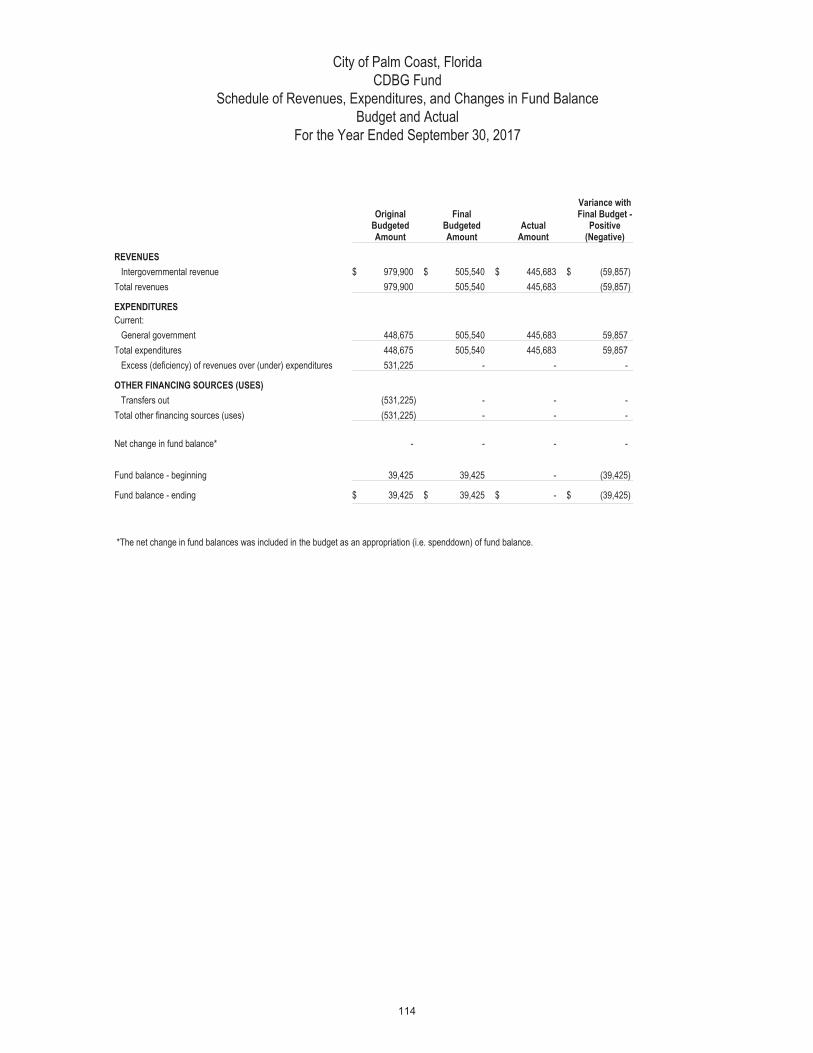


COMBINING NONMAJOR ENTERPRISE FUND STATEMENTS

This page intentionally left blank
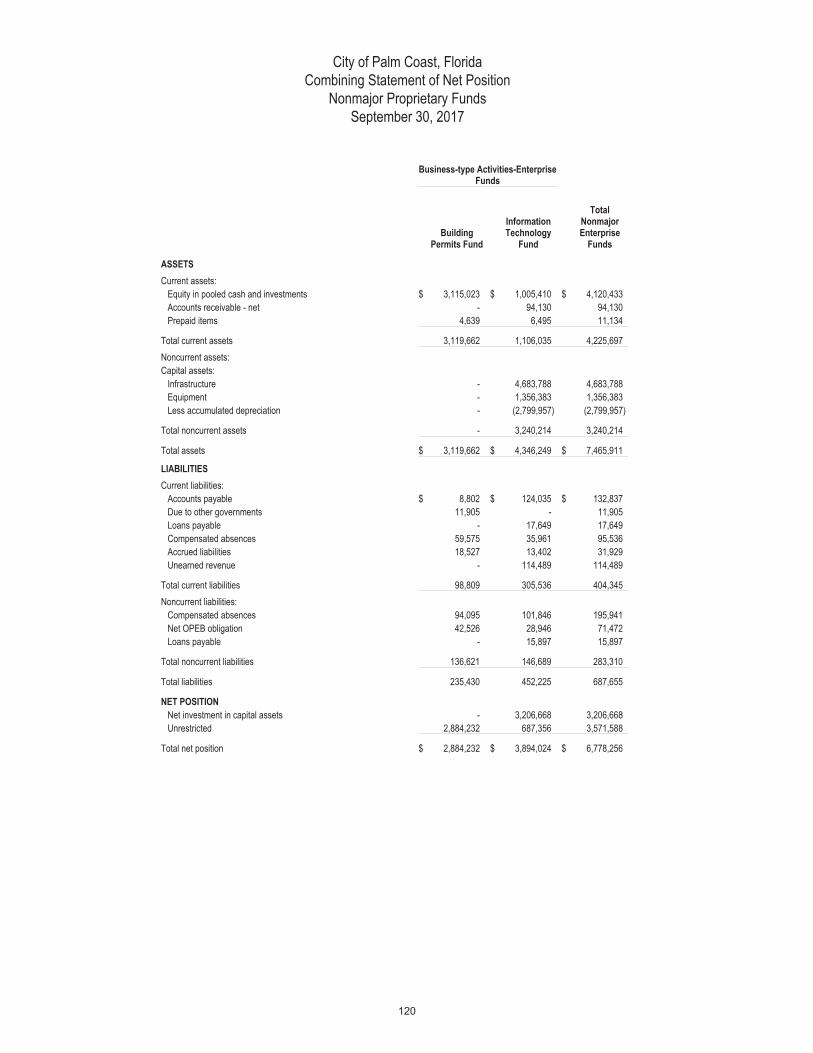

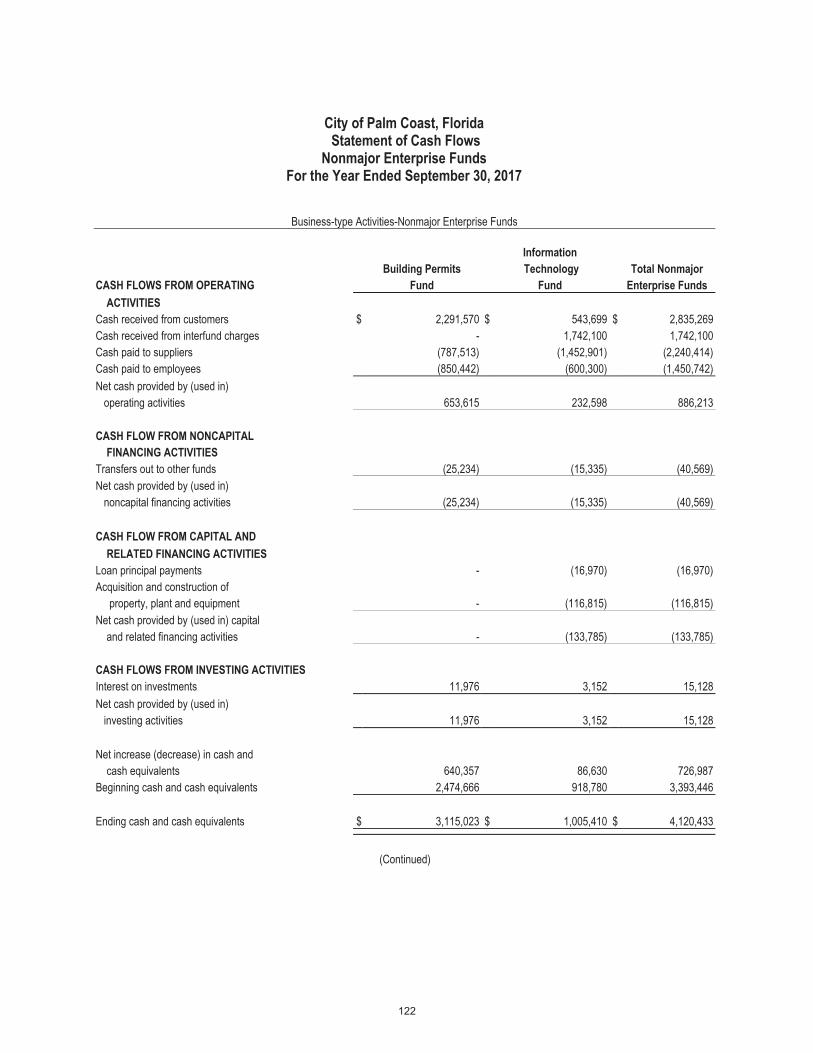
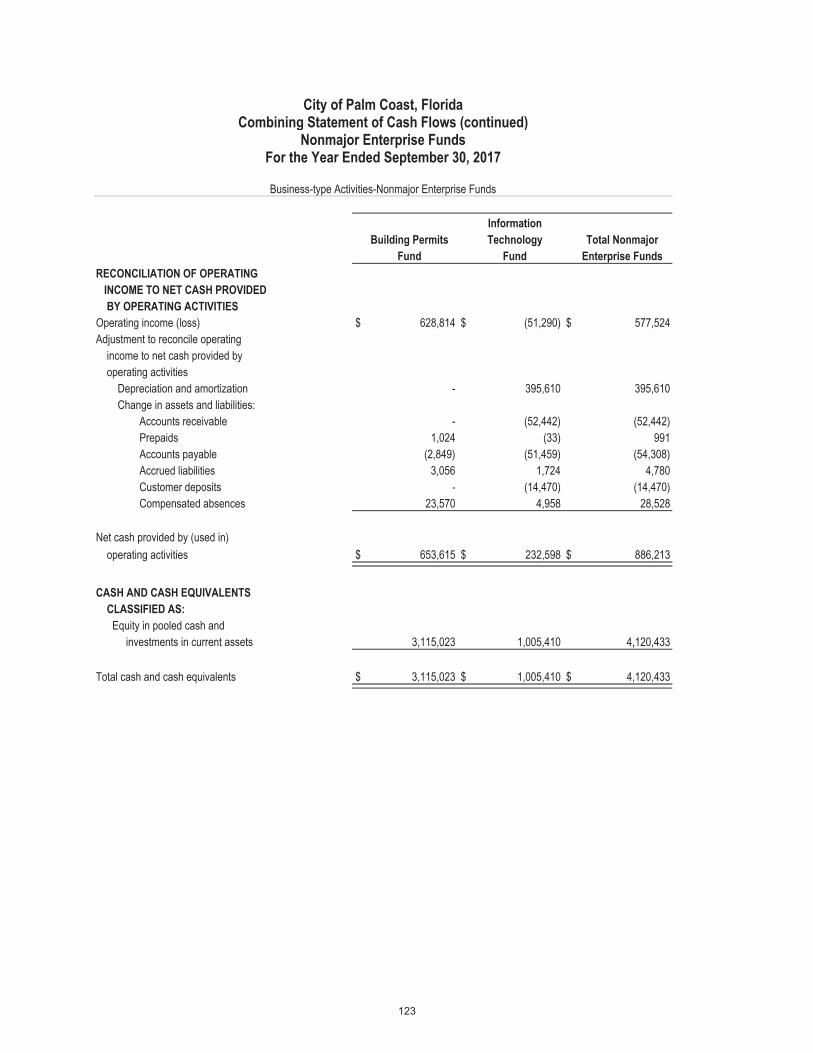

This page intentionally left blank
INTERNAL SERVICE FUNDS

City of Palm Coast, FloridaCombining Statement of Net Position
Internal Service FundsSeptember 30, 2017
Internal Service Funds
Self Insured Health Fund Fleet Fund
Total Internal Service Funds
ASSETSCurrent assets:
Equity in pooled cash and investments $ 3,792,113 $ 8,200,179 $ 11,992,292Accounts receivable - net - 2,249 2,249Inventories - 28,078 28,078Prepaid items - 22,122 22,122Due from other governments - 1,953 1,953
Total current assets 3,792,113 8,254,581 12,046,694Noncurrent assets:Capital assets:
Building and improvements other than buildings - 1,097,144 1,097,144Equipment - 17,772,745 17,772,745Less accumulated depreciation - (10,573,428) (10,573,428)
Total noncurrent assets - 8,296,461 8,296,461
Total assets $ 3,792,113 $ 16,551,042 $ 20,343,155
LIABILITIESCurrent liabilities:
Accounts payable $ - $ 123,601 $ 123,601Claims payable 374,022 - 374,022Due to other governments - 600,000 600,000Compensated absences - 17,352 17,352Accrued liabilities - 7,942 7,942
Total current liabilities 374,022 748,895 1,122,917Noncurrent liabilities:
Compensated absences - 44,863 44,863Net OPEB obligation - 28,994 28,994
Total noncurrent liabilities - 73,857 73,857
Total liabilities 374,022 822,752 1,196,774
NET POSITIONNet investment in capital assets - 8,296,461 8,296,461Unrestricted 3,418,091 7,431,829 10,849,920
Total net position $ 3,418,091 $ 15,728,290 $ 19,146,381

City of Palm Coast, FloridaCombining Statement of Revenues, Expenses, and Changes in Net Position
Internal Service FundsFor the Year Ended September 30, 2017
Internal Service Funds
Self Insured Health Fund Fleet Fund
Total Internal Service Funds
OPERATING REVENUESCharges for services:
Risk management $ 4,673,590 $ - $ 4,673,590Fleet management - 4,745,213 4,745,213
Total operating revenues 4,673,590 4,745,213 9,418,803
OPERATING EXPENSESAdministrative 3,322,796 2,225,435 5,548,231Depreciation - 1,607,540 1,607,540
Total operating expenses 3,322,796 3,832,975 7,155,771
Operating income (loss) 1,350,794 912,238 2,263,032
NONOPERATING REVENUES (EXPENSES)Investment revenue 11,842 30,744 42,586Other - 237,261 237,261
Total nonoperating revenues (expenses) 11,842 268,005 279,847
Income (loss) before capital contributions and transfers 1,362,636 1,180,243 2,542,879
TRANSFERS AND CONTRIBUTIONSTransfers in - 210,590 210,590
Total transfers and contributions - 210,590 210,590
Change in net position 1,362,636 1,390,833 2,753,469
NET POSITION
Net position - beginning 2,055,455 14,337,457 16,392,912
Net position - ending $ 3,418,091 $ 15,728,290 $ 19,146,381
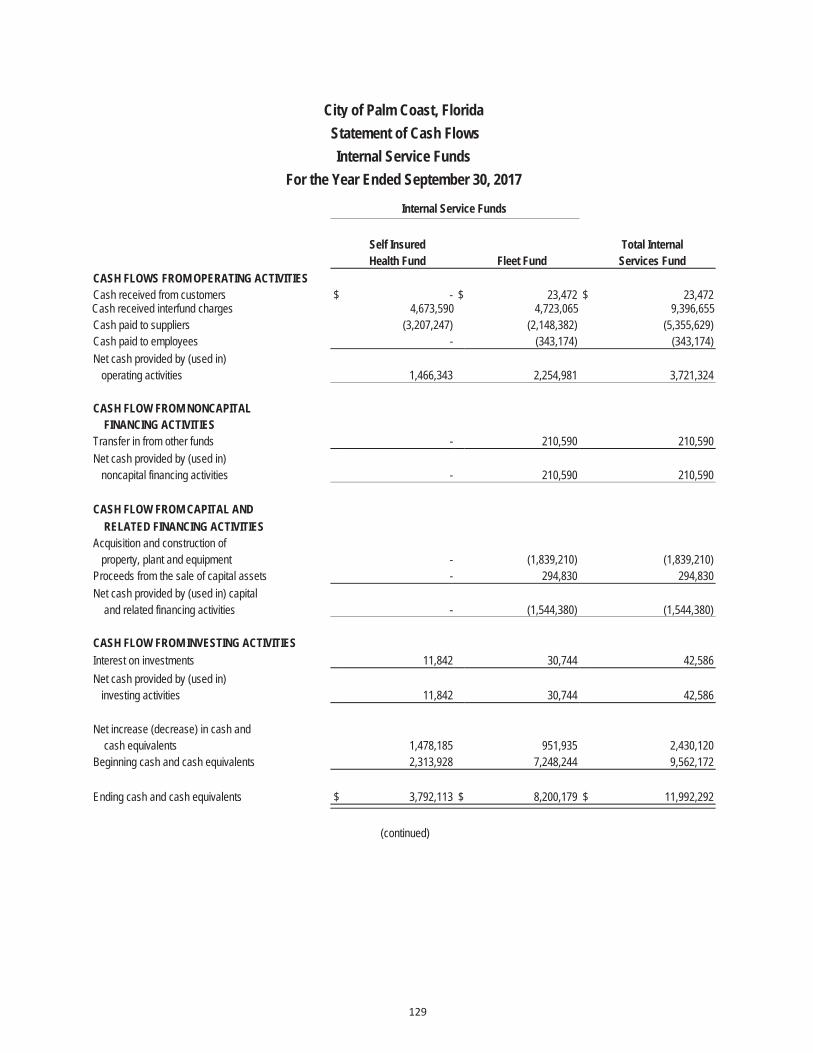
City of Palm Coast, FloridaStatement of Cash FlowsInternal Service Funds
For the Year Ended September 30, 2017
Internal Service Funds
Self Insured Total InternalHealth Fund Fleet Fund Services Fund
CASH FLOWS FROM OPERATING ACTIVITIESCash received from customers $ - $ 23,472 $ 23,472 Cash received interfund charges 4,673,590 4,723,065 9,396,655 Cash paid to suppliers (3,207,247) (2,148,382) (5,355,629)Cash paid to employees - (343,174) (343,174)Net cash provided by (used in)
operating activities 1,466,343 2,254,981 3,721,324
CASH FLOW FROM NONCAPITALFINANCING ACTIVITIES
Transfer in from other funds - 210,590 210,590 Net cash provided by (used in)
noncapital financing activities - 210,590 210,590
CASH FLOW FROM CAPITAL ANDRELATED FINANCING ACTIVITIES
Acquisition and construction ofproperty, plant and equipment - (1,839,210) (1,839,210)
Proceeds from the sale of capital assets - 294,830 294,830 Net cash provided by (used in) capital
and related financing activities - (1,544,380) (1,544,380)
CASH FLOW FROM INVESTING ACTIVITIESInterest on investments 11,842 30,744 42,586 Net cash provided by (used in)
investing activities 11,842 30,744 42,586
Net increase (decrease) in cash and cash equivalents 1,478,185 951,935 2,430,120
Beginning cash and cash equivalents 2,313,928 7,248,244 9,562,172
Ending cash and cash equivalents $ 3,792,113 $ 8,200,179 $ 11,992,292
(continued)
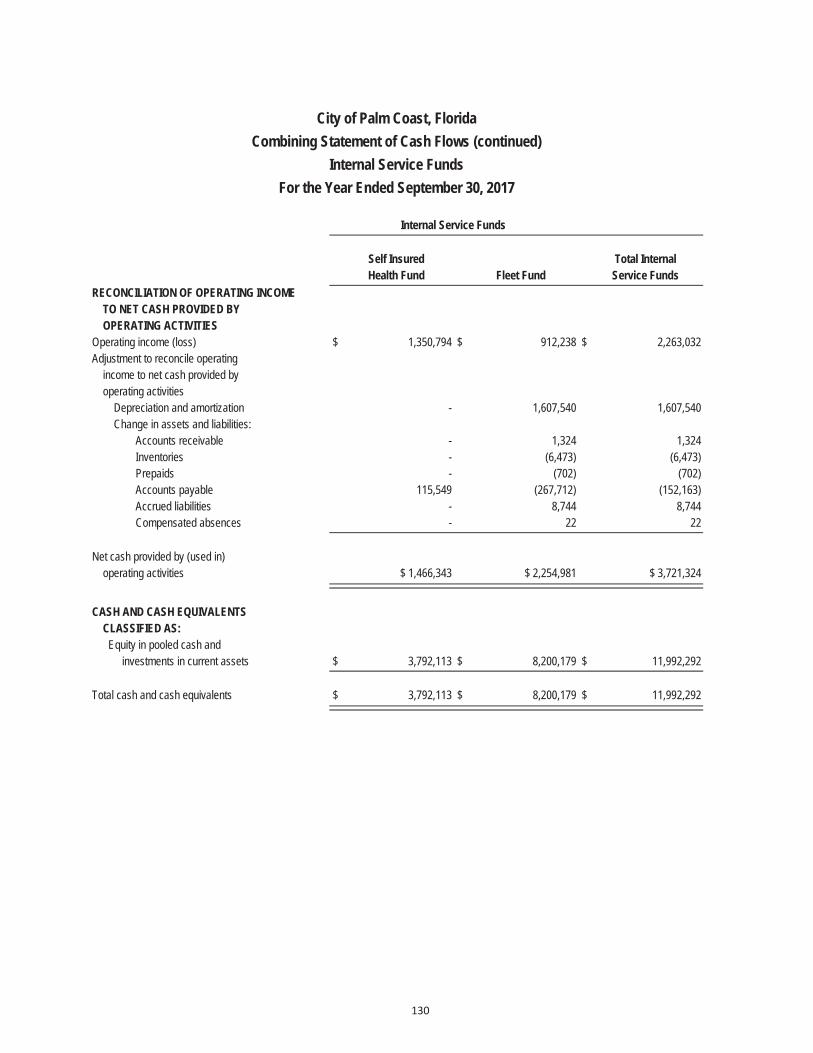
City of Palm Coast, FloridaCombining Statement of Cash Flows (continued)
Internal Service FundsFor the Year Ended September 30, 2017
Internal Service Funds
Self Insured Total InternalHealth Fund Fleet Fund Service Funds
RECONCILIATION OF OPERATING INCOMETO NET CASH PROVIDED BYOPERATING ACTIVITIES
Operating income (loss) $ 1,350,794 $ 912,238 $ 2,263,032 Adjustment to reconcile operating
income to net cash provided byoperating activities
Depreciation and amortization - 1,607,540 1,607,540 Change in assets and liabilities:
Accounts receivable - 1,324 1,324 Inventories - (6,473) (6,473)Prepaids - (702) (702)Accounts payable 115,549 (267,712) (152,163)Accrued liabilities - 8,744 8,744 Compensated absences - 22 22
Net cash provided by (used in)operating activities $ 1,466,343 $ 2,254,981 $ 3,721,324
CASH AND CASH EQUIVALENTSCLASSIFIED AS:Equity in pooled cash and
investments in current assets $ 3,792,113 $ 8,200,179 $ 11,992,292
Total cash and cash equivalents $ 3,792,113 $ 8,200,179 $ 11,992,292