fy 2009 results - fin
TRANSCRIPT

FY 2009 ResultsFY 2009 Results
2
1.1. TREVI Group at a Glance TREVI Group at a Glance
2. FY 09 Financial Results
3. Foundations Sector
4. Drilling Sector
5. Appendix

3
PETREVEN starts drilling activities in Venezuela (HH Technology)
TREVI Group: TREVI Group: HistoryHistory
1957
1999
1969 1983 1997
2000 2004 2008/2009
WATSON
ASC
GALANTE S.A.
Established PalificazioniGeom. Davide Trevisani, (future TREVI SpA)
Established SOILMEC, part of
the future mechanical division
Pali Trevisani becomes TREVI SPA Acquisition of
TREVI ICOS Corporation (Boston,
Massachusetts
Acquisition of SWISSBORING in
Middle East
Established DRILLMEC.Acquisition of
RODIO, historical world leader in the foundation field
listed at Milan Stock Exchange
completion of 3 acquisitions:
TREVI Group: TREVI Group: MissionMission
4
We plan,We plan,execute execute and offerand offer
technologiestechnologies and and innovative servicesinnovative servicesfor any kind of work for any kind of work
in the field of in the field of foundation engineeringfoundation engineering

TREVI Group: VisionTREVI Group: Vision
55
Becoming the Becoming the main main
technological technological partnerpartner in the in the field of soil field of soil foundation foundation engineering engineering and in the and in the
research and research and development development of water and of water and
energy energy resourcesresources
Well Founded Well Founded
RootsRoots

• Onshore Drilling
• Long term contracts
• Latin America emerging
Player
• Hydraulic Rotary Rigs
• Cranes
• Jet Grouting
• Tunnel Consolidation
• Casing Oscillators
• Extractors
• Drilling Tools
• etc.
• Automatic Rigs
(HH Series)
• Land rigs
• Derricks & Offshore
• Mobile Drilling Rigs
• Hydraulic Top Drives
• Triplex Mud Pumps
• Deep Foundations
• Geotechnical Works
• Marine Works
• Tunnel Consolidation
• Automated Car Parks
• Environment
TREVI GroupTREVI Group
6
SERVICESDivision
MECHANICAL Division
Projects for renewable energy
Special foundation services Oil drilling services Oil drilling rigs Special foundation rigs

UniqueUnique Business Business ModelModel
Technological InnovationProcess Innovation
STRENGTHENING MARKET LEADERSHIPSTRENGTHENING MARKET LEADERSHIP
FOUNDATION EQUIPMENTS AND DRILLING RIGSFOUNDATION AND DRILLING SERVICES
7

8
Based on Not Consolidated Data
Total
Total Revenues
RevenuesFY09:
FY09:
EUR 1.035,8
EUR 1.035,8 m
lnmln
8
AddedAdded ValueValue FY09:FY09:€€ 347,1 347,1 mlnmln
One Group: Two Points of View One Group: Two Points of View
Services Division 53,0%
Mechanical Division47,0%
Foundations Division64,5%
Drilling Division35,5%
Services Divis ion 72,9%
Mechanical Divis ion
27,1%

TREVI Group: Global TREVI Group: Global PresencePresence
SOILMEC Division
DRILLMEC Division
PETREVEN DivisionVenezuela
U.S.A.Boston
Mozambique
Nigeria Oman
GermanyItaly
Hong Kong
Japan
China
Singapore
Italy (Piacenza)
U.S.A.Houston
Argentina
Colombia
New Zealand
France
Peru
UK
Austria
Venezuela
Argentina
Algeria
India
Philippines
Panama
Germany
TREVIDivision
Angola
U.S.A.Dallas
Colombia
U.S.A. Fort Worth
Saudi Arabia
Australia
Libya
45 Operating Companies in 32 Countries – 53 Business Units
9
Brazil
Canada
U.A.E.
Qatar
Italy (Cesena)Italy

10
1. TREVI Group at a Glance
2. FY 09 2. FY 09 Financial ResultsFinancial Results
3. Foundations Sector
4. Drilling Sector
5. Appendix

31/12/2009 % 31/12/2008 %
REVENUES 1.035,8 100,0% 1.069,2 100,0%
EBITDA 181,8 17,6% 166,3 15,6%
EBIT 117,4 11,3% 127,6 11,9%
FINANCIAL COSTS (17,4) -1,7% (17,2) -1,6%
TAXES (20,4) -2,0% (31,8) -3,0%
NET PROFIT 82,2 7,9% 74,7 7,0%
31/12/2009 % 31/12/2008
NET CAPITAL EMPLOYED 759,7 557,4
EQUITY 315,9 235,3
NET FINANCIAL POSITION 443,8 322,1
BACKLOG 780,3 1.109,0
31/12/2009 % 31/12/2008
NFP / EBITDA 2,4X 1,9X
NFP / EQUITY 1,4X 1,4X
31/12/2009 % 31/12/2008
EMPLOYEES 6.064 5.898
Financial Financial HighlightsHighlightsEuro mln
Euro mln
NET PROFIT + 10,0%NET PROFIT + 10,0%
EBIT EBIT -- 8,0%8,0%
REVENUES REVENUES -- 3,1%3,1%
INV. CAP. + 36,3%INV. CAP. + 36,3%
EQUITY + 34,2%EQUITY + 34,2%
NFP + 37,8%NFP + 37,8%
EBITDA + 9,3%EBITDA + 9,3%
BACKLOG BACKLOG –– 29,6%29,6%
11
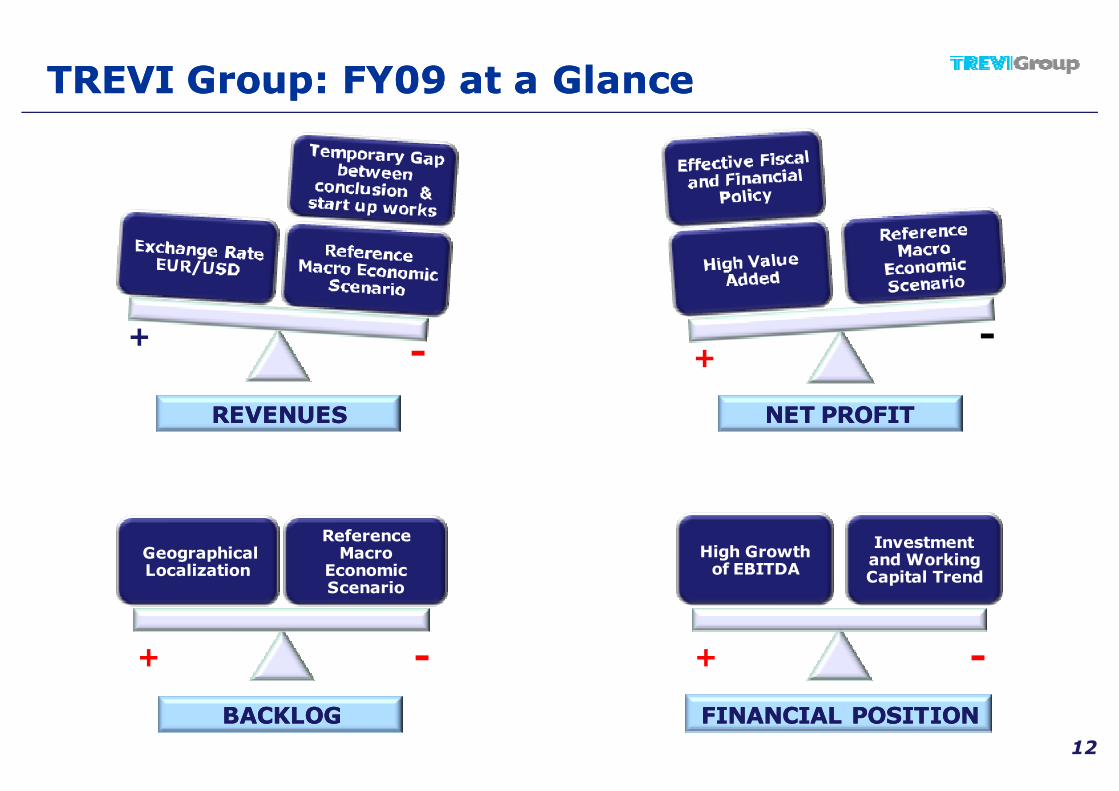
+- +
-
+ -
High Growth of EBITDA
Investment and Working Capital Trend
+ -
Geographical Localization
Reference Macro
Economic Scenario
REVENUESREVENUES NET PROFITNET PROFIT
BACKLOGBACKLOG
12
TREVI Group: FY09 at a GlanceTREVI Group: FY09 at a Glance
FINANCIAL POSITIONFINANCIAL POSITION

Total Total RevenuesRevenues and and ValueValue AddedAdded
13
1999 2000 2001 2002 2003 2004 2005 2006 2007 2008 2009
263,0304,0
349,7 340,1366,6 366,4
498,0
642,4
841,6
1.069,2 1.035,8
92,9 104,0 105,2 111,0 127,1 123,2149,3
190,3
255,6
313,2347,1
Revenues
Value Added
Eur Mln

FY05 FY06 FY07 FY08 FY09
100,8 109,5 141,4 127,9 131,5
53,884,9
139,1 178,8
55,255,9
89,0
91,091,9
115,648,6
61,9
102,3118,4
121,7
89,1
99,2
126,3
132,3
149,9
114,6
165,3
188,9
364,0
421,5
34,9
32,6
52,5
55,840,3
Far East and Others
Middle East and Asia
Africa
Latin America
U.S.A. and Canada
Europe (Italy excl.)
Italy
Geographical BreakdownGeographical Breakdown
14
498,0
642,4
1.035,8
841,6
1.069,2
Eur mln

EbitdaEbitda MarginMargin
15
498,0
642,4
841,6
1.069,21.035,8
11,1%
13,3%
15,9%15,6%
17,6%
0%
5%
10%
15%
20%
25%
0
200
400
600
800
1.000
1.200
FY05 FY06 FY07 FY08 FY09
Ebitda Margin
Eur mln
Revenues EBITDA Margin

EbitEbit MarginMargin
16
498,0
642,4
841,6
1.069,21.035,8
5,8%
9,0%
12,3% 11,9%11,3%
0%
5%
10%
15%
20%
25%
0
200
400
600
800
1.000
1.200
FY05 FY06 FY07 FY08 FY09
Ebit Margin
Eur mln
Revenues EBIT Margin%

Eur mln FY09 g% YoY FY08
Special Foundation Services (TREVI) 495,2 8,6% 456,1
Drilling Services (PETREVEN) 65,4 0,8% 64,9
Interdivisional Adjustments and Eliminations (6,3) (3,2)
Sub-Total Foundations and Drilling Services 554,2 7,0% 517,8
Machines for Special Foundations (SOILMEC) 187,4 -41,3% 319,2Drilling Rigs (DRILLMEC) 310,5 7,5% 288,8Interdivisional Adjustments and Eliminations (1,4) (0,8)
Sub-Total Mechanical Division 496,4 -18,2% 607,2
Parent Company 15,0 13,5
Interdivisional Eliminations (29,8) (69,4)
TOTAL CONSOLIDATED REVENUES 1.035,8 -3,1% 1.069,2
RevenuesRevenues BeforeBefore and and AfterAfter ConsolidationConsolidation
17

GEOGRAPHICAL AREA Eur mln 31/12/2009 %
Latin America 135,8 17,4%
Middle East and Asia 215,5 27,6%U.S.A. and Canada 204,3 26,2%
Italy 97,3 12,5%
Europe (excl. Italy) 28,3 3,6%Africa 89,7 11,5%
Far East 5,1 0,7%Others 4,4 0,6%
TOTAL 780,3 100%
BacklogBacklog
4%
26%
12%
58%
Euro mln
FY05 FY06 FY07 FY08 FY09
517,0
709,3636,8
1.109,0
780,3
329,0 316,3431,9
700,7
482,6
188,0320,5
277,3
408,2
297,8
18Foundations Sector Drilling Sector

322,1
159,5
20,4
171,1
80,3
17,4 4,7 3,4
443,8
Net Financial PositionNet Financial Position
INVESTMENTS INTERESTS OTHER NFP FY09NFP FY08 EBIT + D&A TAXES ∆WORKING CAPITAL
FREE CASH FLOW
- 112,3 mln Euro
Eur mln
19
EXCHANGE DIFFERENCES

148,0126,0
175,7
142,6
322,1
443,8
3,6x
2,3x2,1x
1,1x
1,9x
2,4x
0,0x
0,5x
1,0x
1,5x
2,0x
2,5x
3,0x
3,5x
4,0x
4,5x
0
50
100
150
200
250
300
350
400
450
PFN PFN / EBITDA
Net Financial PositionNet Financial Position
NFP/EQUITY
FY 05 FY 06 FY 07 FY 08 FY 09
1,4x1,4x0,9x1,4x1,2x
Euro mln
FY 04
1,8x
20EBITDA/NET INTERESTS 10,4x9,7x9,8x8,2x6,2x5,7x
NFP NFP / EBITDA

0
50
100
150
200
250
300
350
400
450
500
2004 2005 2006 2007 2008 2009 2009
EQUITY and NFPEQUITY and NFP
Euro mln
EQUITY NFP
80,9102,1
127,4
163,5
235,3
315,9
443,8
21
77%
23%
Short Term Debt
Long Term Debt

22
Foundations and Drilling ServicesFoundations and Drilling Services
Not Consolidated Data
361,5
401,2
517,8
554,2
9,2%
11,2%
13,3%
15,0%14,2%
16,2%
18,3%
24,7%
7%
12%
17%
22%
27%
90
140
190
240
290
340
390
440
490
540
590
FY06 FY07 FY08 FY09Margin %
Euro m
ln
FY07 FY08
Revenues Ebit% Ebitda%
Italy15%
Europe (excl. Italy)1%
U.S.A. and Canada12%
Latin America21%Africa
24%
Middle East and Asia25%
Far East2%

310,0
464,9
607,2
496,4
10,2%
13,7%
11,4%
7,3%
12,9%
15,5%
12,9%
9,2%
6%
8%
10%
12%
14%
16%
18%
20%
22%
24%
80
180
280
380
480
580
FY06 FY07 FY08 FY09Margin %
Euro m
ln
23
Mechanical DivisionMechanical Division
Not Consolidated Data
FY07 FY08
Revenues Ebit% Ebitda%
Italy11%
Europe (excl.
Italy)10%
U.S.A. and
Canada10%
Latin America1%
Africa4%
Middle East and Asia
57%
Far East5%
Others
2%

24
1. TREVI Group at a Glance
2. FY 09 Financial Results
3. 3. Foundations SectorFoundations Sector
4. Drilling Sector
5. Appendix

EstimatedEstimated Global Global GDP% inGDP% in 20102010
Estimated Global Estimated Global GDP% GDP% in 2011in 2011
Source: Goldman Sachs 11.01.2010
TREVI Group, in order to catch all businessopportunities coming worldwide will establish newbusiness presences through its Trevi division;starting from 2009 until now SOILMEC hasestablished newbranches:
o SOILMEC WUJIANG (China)o SOILMEC DO BRAZIL (Brazil)o SOILMEC INDIA (India)
Emerging Markets are able to emphasize allindustrial skills and the flexible organization of TREVIGroup.
Tables show estimates related to the globalGDP trend during the period 2010 – 2011.
Major performances in particular (see redline) are referred to China, India and otherEmerging Markets.
All the above mentioned countries will showin the next couple of years a continuousgrowing trend of their GDP especially throughmajor investments in infrastructures.
Outlook: Construction Sector Outlook: Construction Sector
25Source: Goldman Sachs 11.01.2010

TREVI in the WorldTREVI in the World
26
• U.S.A.
• Canada
• Panama
• Santo Domingo
• Colombia
• Argentina
• Perù
• Venezuela
• New Zealand
• Philippines
• Hong Kong
• Thailand
• Saudi Arabia
• Oman
• Qatar
• Other U.A.E.
• Algeria
• Angola
• Libya
• Mozambique
• Nigeria
• Ivory Coast
• Austria
• Italy
• Sweden
Project in SwedenProject in USA

TREVI Group: TREVI Group: UnitedUnited StatesStates
27
WOLF CREEK
AWARD: 2008 in JV 50%
TOT AMOUNT (USD): 341,400,000
C LIENT: CORPS of ENGINEERS
OBJECTIVE: Restoration of the Dam through an installation of a Concrete Wall in the inner part of the Dam located in the county of Russell, Kentucky.
NEW ORLEANS (PHASE I)
AWARD: 2009
TOT AMOUNT (USD): 116,000,000
C LIENT: CORPS of ENGINEERS
OBJECTIVE: Consolidation and embankments’ restoration of the canals in New Orleans (Louisiana) damaged by the Katrina Hurricane.
HERBERT HOOVER (PHASE I)AWARD: 2008
TOT AMOUNT (USD): 39,000,000
C LIENT: CORPS of ENGINEERS
OBJECTIVE: Extraordinary Job of maintenance in the Dam located in the State of Florida through the insertion of a Plastic Impermeable Wall.
LouisianaFlorida
Kentucky

TREVI Group: AfricaTREVI Group: Africa
Project in Nigeria
Project in Algeria
Project in Ivory Coast
The localization of all projects shown hererepresents a sample of areas in which theGroup is working in Africa. In some ofthese areas (Nigeria and Algeria) the Groupis historically present since many years.The experience gained and the formation ofspecialized local manpower founded strongbases for a further development allowingthe Group to award new importantprojects.
Project in Angola
28

TREVI Group: Middle EastTREVI Group: Middle East
29
TREVI Group through its controlled companySWISSBORING Overseas Corporation Ltd., isestablished in the Middle East region since 1973.
The table on side shows estimates related to thevolume of investments for every country includedn the region during the year 2010.
The total value of investments (in $bln) isextremely relevant and includes many projectsrelated to major infrastructures.
Arabia Saudita
Yemen
Oman
UAE
Iraq Iran
Siria
Kuwait
Bahrain
Qatar

Trevi Trevi OverviewOverview
(*) Not Consolidated Data30
FY05 FY06 FY07 FY08 FY09
282,1
338,3357,6
456,1
495,2
DRIVERS THE FUTURE
Strengthening of Strengthening of market leadership market leadership
in existing in existing geographical areasgeographical areas
Focus on “big” Focus on “big” infrastructural and infrastructural and
technological technological projectsprojects
Selective growth in Selective growth in new geographical new geographical
areasareas
Looking for new Looking for new market niches to market niches to
addressaddress
Stimulus Plans Stimulus Plans focused on focused on
infrastructural infrastructural expenditures expenditures
Focusing on project Focusing on project with strong with strong technological technological challengeschallenges
(General Specialty (General Specialty Contractor)Contractor)
Focusing on Focusing on maritime projects maritime projects
REVENUES (*) FY05 – FY09

Eastern
Europe
Ireland
Portugal
Austria
Belgium
Switzerland
Netherlands
Spain
UKItaly
FranceGermany
(10%)
(5%)
5%
10%
(1%) 1% 2% 3%
2009E-2012E GDP CAGR (%)
Outlook: Construction Sector in Europe Outlook: Construction Sector in Europe
Construction Sector and GDPConstruction Sector and GDP Public Financial Resources Public Financial Resources Allocated by CIPEAllocated by CIPE
The table on left side shows estimates of thegrowth of GDP and construction sector announcedby each European country. Considering only majorEuropean countries (Germany, France, UK andItaly) the outlook is quite positive even if it showslow growth rates.
The table above shows in which projects the CIPEhas allocated Public Financial Resources. Themajor part shall be assigned to new projects notyet published (33,2%) and to new projectsalready assigned to General Contractors (47,5%).
31
Source: Note by ANCE on CIPE Plan – 16.03.2010
2009E-2012EConstruction CAGR (%)
= EUR100bn of 2009E Construction Value
Source: Merril Lynch, 12.04.2010
Values in milion of Euro Ammount %
Works in progress 1.051,0 15,8%
Works already assigned to General Contractors 3.166,8 47,5%
New works to be published 2.215,2 33,2%
New works already published 200,1 3,0%
New assigned works 20,2 0,3%
Not Infrastructural works 12,0 0,2%
TOTAL 6.665,3 100%

TREVI: TREVI: ProjectsProjects in Italyin Italy
32
METRO of NAPOLIARCO MIRELLI
CONSOLIDATION of “CAMPANILE PIAZZA SAN MARCO”

33
PROV. of BOLOGNAPORRETTANA
BOLOGNA – TREVI PARK
MORBEGNO – Project in PEDEMONTANA
TREVI: TREVI: ProjectsProjects in Italyin Italy

Soilmec: Extended Global NetworkSoilmec: Extended Global Network
34
Boston
Houston
Dallas
Headquarter CESENA
(Italy)
Sydney
Assembling/ManufacturingNetwork
Germany
SOILMEC WUJIANG China
SOILMEC BRAZIL
Sao Paulo
SOILMEC India

AustraliaAustralia
SR SR SeriesSeriesSRSR--9090
SRSR--9090
Soilmec: Range of ProductsSoilmec: Range of Products
SR 80SR 80
SR 70SR 70
Excadrill 10Excadrill 10
Model 2500Model 2500
PSMPSM--88
Excadrill 5Excadrill 5
PSM PSM --2020
PSMPSM--8B8B
HousingMicropiles
CommercialReal Estate
Major Infrastructures
35

Soilmec: Soilmec: BaumaBauma 2010 2010 –– New ProductsNew Products
SC-65
36
SM-3During the BAUMA 2010 SOILMEC presented
several new products (see pictures).
These equipments for special foundation (low,
medium and high tonnage), meet high standard of
safety and do include new important technologies in
order to develop considerably the drilling performances and the
service offered to clients.
New Cab
SR-30SM-5 Transport Isometric
SC-65

Soilmec: Extended Range of ProductsSoilmec: Extended Range of Products
Housing
Micropiles
Real Estate
Major Infrastructures
37
Commercial
SCSC--6565
SCSC--100 Hydraulic 100 Hydraulic Crawler CraneCrawler Crane
SRSR--3030
SMSM--55
SMSM--33
SMSM--1818 SRSR--90 TTJ90 TTJ

SoilmecSoilmec OverviewOverview
(*) Not Consolidated Data38
FY05 FY06 FY07 FY08 FY09
132,5
190,5
280,9
319,2
187,4
DRIVERS THE FUTURE
Residential Sector Residential Sector (House & (House &
Commercial) Commercial) strongly impacted strongly impacted
by crisisby crisis
Strong Strong InsourcingInsourcingof productionof production
Opening of new Opening of new geographical geographical
markets for the markets for the medium term medium term developmentdevelopment
Launching of new Launching of new products and products and
addressing new addressing new market nichesmarket niches
Stimulus Plans Stimulus Plans often delayed in often delayed in many Countries many Countries
Strengthening of Strengthening of market share in the market share in the existing markets existing markets
REVENUES (*) FY05 – FY09

39
1. TREVI Group at a Glance
2. FY 09 Financial Results
3. Foundations Sector
4. 4. Drilling SectorDrilling Sector
5. Appendix

40
Oil & Gas OutlookOil & Gas Outlook
0
100
200
300
400
500
2000 2001 2002 2003 2004 2005 2006 2007 2008 2009e 2010e 2011e 2012e
GLOBAL INVESTMENTS IN GLOBAL INVESTMENTS IN E&PE&P (US$ bln)
Source: Merrill Lynch 20.01.2010
OIL PRICE ESTIMATES
Source: stime UBS
The table on left side showsestimated global investments (inUS$ bln) in E&P.
After the reduction ofinvestments during the year2009, the table shows aprogressive estimated increase ofinvestments for the period 2010to 2012.
This level of investments will besupported by a stable Oil Pricetrend.
4Q09 2009 1Q10 2Q10E 3Q10E 4Q10E 2010E 2011E 2012E 2013E
WTI ($/bbl) 78.00 62.30 75.00 74.00 74.00 77.00 75.00 80.00 80.00 80.00
Brent ($/bbl) 76.00 62.60 74.00 73.00 73.00 76.00 74.00 79.00 79.00 79.00

OGDCL
ONGC
Pet roChina
Pet r onas
PTT
S inopec
Ecopet rol
PDVSA
Pemex
Pet r obr as
Abu Dhabi NOC
Egypt ian Gener al Pet r ol eum
Nat ional Oil Corp
NNPC
PDO
Qatar Pet roleum
Saudi Ar am co
Sonangol
Sonat rach
BP
Chevron
ConocoPhill ips
Exxon Mob il
Royal Dutch/Shel l
Tot al
Gazprom
Gazprom Nef t
Lukoil
Novatek
Rosnef t
Surgutnef tegaz
TNK-BP
BG Gr oup
Eni
OMV
Repsol
Santos
Statoil Hydro
Woodside
Af ren
BowLeven
Cai rn Energy
Dana Dragon
Lundin
Pr emier
Regal
Salamander
Soco Tull ow
Anadarko
Apache
CNR
Cenovus
Chesapeake
Devon
EnCana
EOG Res
Hess
Marathon
Murphy Nexen
Noble
Occidental
Pet rohawk Pl ains Explo
Range Res Suncor
Tal ism an
Wil li ams Cos
(5.0)
0.0
5.0
10.0
15.0
20.0
25.0
(50%) (40%) (30%) (20%) (10%) 0% 10% 20% 30% 40% 50% 60% 70% 80% 90% 100% 110% 120%
41
Investments of Oil CompaniesInvestments of Oil Companies
Change in % 2010 Capex vs 2009 Capex
2010 Capex($m)
NOCs
Majors
Russia
Altri E&Ps
Euro E&Ps
USA/Canada
INVESTMENTS 2009 vs 2010 FOR A SAMPLE OF OIL COMPANIES INVESTMENTS 2009 vs 2010 FOR A SAMPLE OF OIL COMPANIES
The table above shows the change of investments between 2010 and 2009 and the volume of suchinvestments related to a sample of major Oil Companies .
The major part of such Oil Companies will show higher volumes of investments with an average aggregategrowth in 2010 equal to about 9,4%.
’09-’10
Change
% Capex ’10
of Total
NOC 14.2% 37.9%
� Asian 21.5% 11.1%
� Latam 9.1% 12.0%
� MENA 13.3% 14.9%
Majors (0.5%) 33.0%
US/Canadian Independents
19.2% 14.6%
Russian 19.8% 9.8%
Other E&Ps 1.1% 3.3%
Euro E&Ps 8.9% 1.4%
All 9.4% 100.0%
Source: Merril Lynch 12.04.2010

DrillmecDrillmec: : ExtendedExtended Global NetworkGlobal Network
DRILLMEC Branches
Houston (USA) – OIL&GAS Division
Headquarter PIACENZA (Italy)
OIL&GAS Division
Drillmec Division, in order to improvethe relationship with its customers andto catch all major opportunities comingfrom the market, during last few yearshas extended its global networkestablishing new branches in mainstrategic areas.
During the period 2009/2010 theDivision established a new productionunit in Houston, Texas where will berealized both conventional rigs andhydraulic drilling rigs(series HH).
42
Gorizia (Italy)PUMPS Division
Parma (Italy)WATER Division
In the South American region Drillmec takes
advantage from the local presence of

Different & Complementary TechnologiesDifferent & Complementary Technologies
REDUCTION REDUCTION ofof AREAAREA
REDUCTION REDUCTION ofof COSTSCOSTS
INCREASED PERFORMANCEINCREASED PERFORMANCE
INCREASED SECURITYINCREASED SECURITY
43
RIG RIG -- UP UP in Italyin Italy
Main Advantages for clients are the following:
• Reduction of Costs
• Security of Operating
• Reduction of Risks

DrillmecDrillmec: HH : HH RigsRigs DeliveredDelivered
RUSSIA
AUSTRALIA
ICELAND
EGYPT
LIBYA
SYRIA
ARGENTINA
COLOMBIA
U.S.A
UKRAINE
PERU’
VENEZUELA
UK ITALY
BRAZIL
CHINA
LEBANON
FRANCEGERMANY
NETHERLANDS
CONGO
ROMANIA
KSA
44

45
DrillmecDrillmec: : ConventionalConventional RigsRigs-- KazakhstanKazakhstan
Drillmec S.p.A., has won a contract from Saipem S.p.A. to build and testtwo oil drill rigs each of 3,000 HP.
The two rigs, to be sited on artificial islands in Kazakhstan, as part ofthe development of the Kashagan oil field, are designed to function inthe particular conditions that characterise the northern part of theCaspian Sea, a harsh climate and tight environmental controls.
Project in Kazakhstan
3000 Hp RIG

46
DrillmecDrillmec: Full Products Range : Full Products Range (*)(*)
(*) Sample of Clients
WATER OIL & GAS GEOTHERMAL
Conventional Technology
HydraulicTechnology

Drillmec OverviewDrillmec Overview
(*) Not Consolidated Data47
FY05 FY06 FY07 FY08 FY09
75,4
126,6
194,1
288,8310,5
DRIVERS THE FUTURE
Drilling Drilling AcademyAcademy
Strategic Strategic Partnership Partnership
with clients and with clients and competitorscompetitors
Outsourcing Outsourcing CapabilitiesCapabilities
Widening of Widening of commercial commercial network and network and strengthening strengthening relationshiprelationship
Increasing Increasing production capacity production capacity
HH: Technological HH: Technological InnovationInnovation Widening products Widening products
rangerange
REVENUES (*) FY05 – FY09

PetrevenPetreven: : Operative Operative RigsRigs
2005
4 rigs
2006
8 rigs
2007
9 rigs
ARGENTINA
5 rigs HH100
-Petrobras (2)
-Chevron Texaco (1)
-Repsol YPF (2)
VENEZUELA
1 rig HH300
Petrobras
1 rig HH200
Petrooritupano
COLOMBIA
1 rig HH100
Petrominerales
PERU
2 rig HH100
Petrobras
2008/2009
10 rigs
AWARDS FOR SECURITY
48

Petreven: Rigs Competitive AdvantagePetreven: Rigs Competitive Advantage
VENEZUELA
ARGENTINA
IMPIANTO: HH200–HH300
CLIENTE:
IMPIANTO: H103-H104-H105-H106-H108
CLIENTE:
PERU’
IMPIANTO: H107-H109
CLIENTE:
COLOMBIA
IMPIANTO: G102
CLIENTE:
49
HH Technology
Security
Performance
People
Petreven division is taking advantage of both afavoured access to the HH Hydraulic technologyand its important track record in all referencecountries. The current and expected stability ofthe Oil Price shall increase opportunities for afurther growth.
TREND 2010/2011

Petreven OverviewPetreven Overview
(*) Not Consolidated Data50
FY05 FY06 FY07 FY08 FY09
16,0
25,2
46,6
64,9 65,4
DRIVERS THE FUTURE
Preferential access Preferential access to HH series to HH series technology technology
Historical strong Historical strong presence in Latin presence in Latin
AmericaAmerica
Constant growth Constant growth with “acquisition” with “acquisition”
of new rigsof new rigs
Development of Development of commercial and commercial and technological technological partnerships partnerships
High operating and High operating and safety standardssafety standards
Further Further development of development of
know how know how (especially with (especially with
regard to Hydraulic regard to Hydraulic Rigs)Rigs)
REVENUES (*) FY05 – FY09

51
1. TREVI Group at a Glance
2. FY 09 Financial Results
3. Foundations Sector
4. Drilling Sector
5. 5. AppendixAppendix

INCOME STATEMENT FY09 INCOME STATEMENT FY09 vsvs FY08FY08
52
Eur 000 FY09 FY08 %
TOTAL REVENUES 1.035.815 1.069.155 -3,1%
Changes in inventories of finished and semi-finished products 38.912 82.351
Increase in fixed assets for internal use 20.607 50.278
Other non-ordinary operating revenues 0 0
VALUE OF PRODUCTION 1.095.334 1.201.784 -8,9%
Raw materials and external services 735.642 878.107
Other operating costs 12.553 10.465
VALUE ADDED 347.139 313.212 10,8%
Personnel expenses 165.331 146.904
EBITDA 181.808 166.307 9,3%
% total revenues 17,6% 15,6%
Depreciation 42.161 32.398
Provisions and write-downs 22.287 6.308
EBIT 117.361 127.601 -8,0%
% total revenues 11,3% 11,9%
Financial revenues (expenses) (17.423) (17.176)
Gains/(losses) on exchange rates 4.694 (1.250)
Gains/(losses) on 0 0
EBT 104.631 109.175 -4,2%
Tax 20.427 31.820
Minorities 2.046 2.694
GROUP NET PROFIT 82.158 74.661 10,0%
% total revenues 7,9% 7,0%

BALANCE SHEET: FY 2009BALANCE SHEET: FY 2009
(*) Taking into account IAS 11 53
FY09 FY08 %
Fixed assets
- Tangible fixed assets 319.838 294.464
- Intangible fixed assets 13.695 6.073
- Financial fixed assets 4.588 5.036
Net working capital
- Inventories 356.199 335.551
- Trade receivables 316.215 315.581
- Trade payables (-) (169.979) (340.223)
- Pre-payments (-) (82.733) (67.126)
- Other assets (liabilities) 18.652 23.456
776.475 572.813 36%
(16.799) (15.391)
759.676 557.422 36%
302.225 226.436
13.667 8.903
443.783 322.084
759.676 557.422 36%
Group net shareholders' funds
Minorities' share of net shareholders' funds
Net financial position
TOTAL SOURCES OF FINANCING
Eur 000
Post-employment benefits (-)
Fixed assets plus net working capital
NET INVESTED CAPITAL
Financed by:

TREVI Group: AWARDSTREVI Group: AWARDS
54
DYNAMISM PERFORMANCE
SECURITYQUALITY
AWARD MEDIOBANCA 2009
AWARD LEONARDO 2009
AWARDAT KEARNEY 2009
AWARD MAESTRIA 2009
Award to TREVI Group as Best Dynamic Italian Middle Company
Award to TREVI Group as one of the Best Companies which promote the “Italian Quality” worldwide
Award to TREVI Group for the best combination of growth of revenues and return for shareholders during last 5
years
Award to PETREVEN C.A. (established in Colombia) as Company with the Best Security and Management System
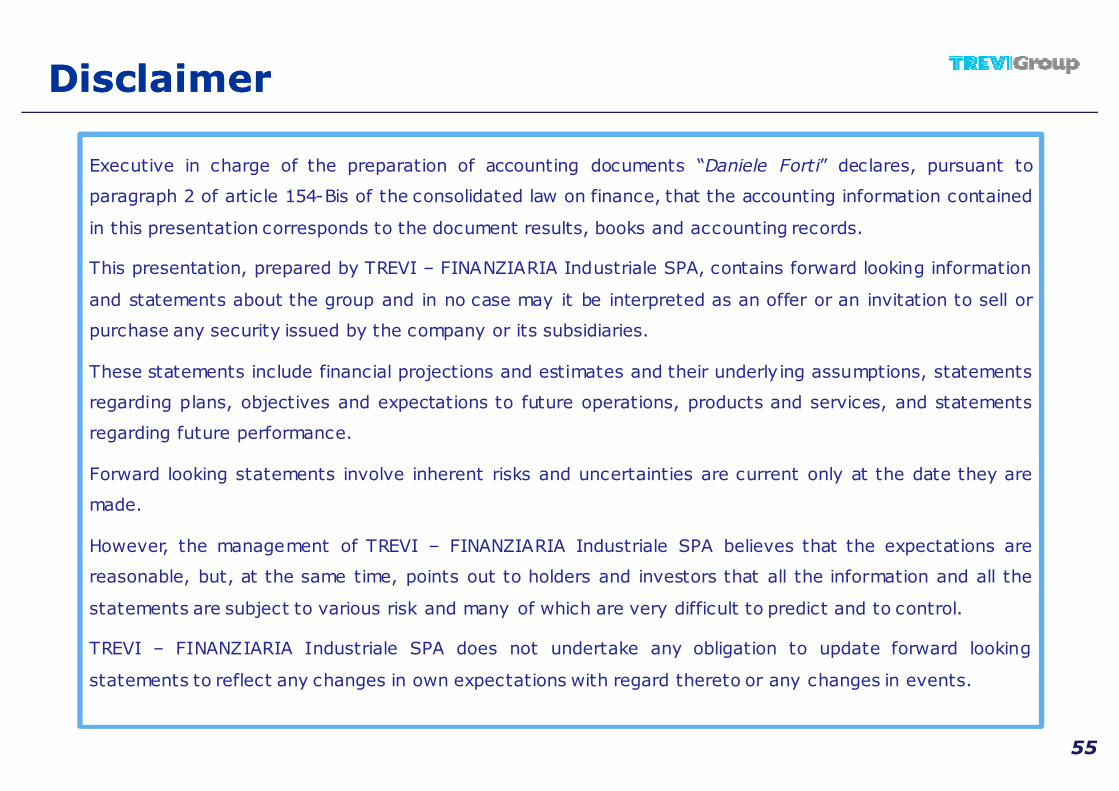
DisclaimerDisclaimer
55
Executive in charge of the preparation of accounting documents “Daniele Forti” declares, pursuant to
paragraph 2 of article 154-Bis of the consolidated law on finance, that the accounting information contained
in this presentation corresponds to the document results, books and accounting records.
This presentation, prepared by TREVI – FINANZIARIA Industriale SPA, contains forward looking information
and statements about the group and in no case may it be interpreted as an offer or an invitation to sell or
purchase any security issued by the company or its subsidiaries.
These statements include financial projections and estimates and their underlying assumptions, statements
regarding plans, objectives and expectations to future operations, products and services, and statements
regarding future performance.
Forward looking statements involve inherent risks and uncertainties are current only at the date they are
made.
However, the management of TREVI – FINANZIARIA Industriale SPA believes that the expectations are
reasonable, but, at the same time, points out to holders and investors that all the information and all the
statements are subject to various risk and many of which are very difficult to predict and to control.
TREVI – FINANZIARIA Industriale SPA does not undertake any obligation to update forward looking
statements to reflect any changes in own expectations with regard thereto or any changes in events.

56
InvestorInvestor Relations TeamRelations Team
Stefano CampanaStefano Campana [email protected]@trevifin.comSimone NanniSimone Nanni [email protected]@trevifin.comMatteo ScarpelliniMatteo Scarpellini [email protected]@trevifin.comCristina TrevisaniCristina Trevisani [email protected]@trevifin.com