fy 2015 results – february 2 , 2016 -...
TRANSCRIPT

FY 2015 ResultsFebruary 2nd , 2015
FY 2015 Results – February 2nd, 2016

FY 2015 ResultsFebruary 2nd , 2015
This document, and in particular the section entitled “2016 Outlook”, contains forward-looking statements. These statements may include termssuch as “may”, “will”, “expect”, “could”, “should”, “intend”, “estimate”, “anticipate”, “believe”, “remain”, “on track”, “design”, “target”,“objective”, “goal”, “forecast”, “projection”, “outlook”, “prospects”, “plan”, or similar terms. Forward-looking statements are not guarantees offuture performance. Rather, they are based on the Group’s current expectations and projections about future events and, by their nature, aresubject to inherent risks and uncertainties. They relate to events and depend on circumstances that may or may not occur or exist in the future and,as such, undue reliance should not be placed on them.Actual results may differ materially from those expressed in such statements as a result of a variety of factors, including: the Group’s ability topreserve and enhance the value of the Ferrari brand; the success of Ferrari’s Formula 1 racing team and the expenses the Group incurs for Formula 1activities; the Group’s ability to keep up with advances in high performance car technology and to make appealing designs for its new models; theGroup’s low volume strategy; the ability of Maserati, the Group’s engine customer, to sell its planned volume of cars; changes in client preferencesand automotive trends; changes in the general economic environment and changes in demand for luxury goods, including high performance luxurycars, which is highly volatile; the impact of increasingly stringent fuel economy, emission and safety standards; the Group’s ability to successfullycarry out its growth strategy and, particularly, the Group’s ability to grow its presence in emerging market countries; competition in the luxuryperformance automobile industry; reliance upon a number of key members of executive management and employees; the performance of theGroup’s dealer network on which the Group depend for sales and services; increases in costs, disruptions of supply or shortages of componentsand raw materials; disruptions at the Group’s manufacturing facilities in Maranello and Modena; the Group’s ability to provide or arrange foradequate access to financing for its dealers and clients; the performance of the Group’s licensees for Ferrari-branded products; the Group’s abilityto protect its intellectual property rights and to avoid infringing on the intellectual property rights of others; product recalls, liability claims andproduct warranties; exchange rate fluctuations, interest rate changes, credit risk and other market risks; potential conflicts of interest due todirector and officer overlaps with the Group’s largest shareholders and other factors discussed elsewhere in this document.Any forward-looking statements contained in this document speak only as of the date of this document and the Company does not undertake anyobligation to update or revise publicly forward-looking statements. Further information concerning the Group and its businesses, including factorsthat could materially affect the Company’s financial results, is included in the Company’s reports and filings with the U.S. Securities and ExchangeCommission, the AFM and CONSOB.
2
SAFE HARBOUR STATEMENT

FY 2015 ResultsFebruary 2nd , 2015BEST EVER RESULTS: FY 2015
Shipments at 7,664 units, increased by 6% vs. previous year• V8 up 17%: success of California T, 458 Speciale A and the newly launched 488 GTB more than
offsetting the end of life-cycle of 458 Italia and 458 Spider• V12 down 24%: F12berlinetta and FF at 4th and 5th year of commercialization
respectively, F12tdf shipments started in December 2015
Financial results • Net revenues at €2.85 billion • Adjusted EBITDA* at €748 million, margin up by 110bps• Net profit of €290 million• Net Debt* at €1,938 million (€797 million - net of self-liquidating financial receivables portfolio)• Free Cash Flow* of €390 million• Distribution of €0.46 per common share**
New key product launched and recent events • Recently presented F12tdf • Scuderia Ferrari achieved 16 podiums, with Sebastian Vettel winning three races the past season• January 3rd:Ferrari completed its spin-off from FCA• January 4th:first day of trading at Milan Stock Exchange
2016 Outlook***• Shipments: ˜7,900 including supercars• Net revenues: >€2.9 billion• Adjusted EBITDA: >€770 million• Net debt: <€1,950 billion (<€750 million range - net of funded self-liquidating financial
receivables portfolio) including distribution to shareholders**3*Reconciliation to non-gaap financial measures are provided in the appendix
**Subject to approval of the 2015 annual accounts and review of other relevant financial statements by the Board of Directors*** Assuming FX consistent with current market conditions

FY 2015 ResultsFebruary 2nd , 2015
4
FY 2015 HIGHLIGHTS
566
(1,938)
Shipments (units)
Total shipments up 6% driven by an 17% increase in V8, which was partially offset by a 24% decrease in V12
Adjusted EBITDA*(€M and margin %) 693
748
FY'14
FY'15
2,762
2,854
FY'14
FY'15
404
473
FY'14
FY'15
Net revenues up 3% (-3% at constant FX) led by cars and spare parts (+€136M)
136
390
FY'14
FY'15
7,255
7,664
FY'14
FY'15
Adjusted EBITDA increased by 8% driven by strong adjusted EBIT, partially offset by lower D&A in line with 458 family phase-outEBITDA at €719 million (vs. €678 million in FY ‘14), including one-time extra bonus payment in December to all Ferrari employees and IPO/spin-off costs
Free Cash Flow* (€M)
Net revenues (€M)
Adjusted EBIT*(€M and margin %)
Net Cash/(Net Debt*) (€M)
Free Cash Flow primarily driven by strong increase in cash from operating activities which included the following one-time cash inflows: the sale of investment properties; the reimbursement of the financing of inventory related to the establishment of the Maserati standalone business in China; and the sale of the financial assets portfolios of FFS S.p.A. and FFS KK; partially offset by the one-time extra bonus payment in December to all Ferrari employees
Net debt at €1,938 million due to the capital reorganization in connection with our IPO and spin-off partially offset by the strong Free Cash Flow generation
Adj. EBIT growth primarily driven by volume and FX, partially offset by mixEBIT at €444 million up 14% vs. last year, including one-time extraordinary payment in December to all Ferrari employees and IPO/spin-off costs
• Americas: €801M (+40%) due to volumes, LaFerrari and FX
• EMEA: €780 (-12%) due to lower shipments to Middle East and FX
• Greater China: €239M (-11%) due to lower shipments and mix
• Rest of APAC €260M (+23%) due to higher shipments, partially offset by mix
16.6%
14.6%
26.2%
25.1%
Dec. 31, 2015
Dec. 31, 2014
*Reconciliation to non-gaap financial measures are provided in the appendix

FY 2015 ResultsFebruary 2nd , 2015
5
FY 2015 – SHIPMENTS BY HUB1
AmericasAmericas’ shipments increased by 7%
• USA – Ferrari’s largest single market grew largely due to V8 thanks to the increased commitment to CaliforniaT and continued contribution of LaFerrari
• LaFerrari shipments to US commenced in Q2 2014
Greater ChinaGreater China’s shipments decreased by almost 10%
• HK and Taiwan – shipments increased by 22% year-on-year driven by increased sales of California T and 458 Speciale A
• China mainland – shipments dropped by 22% due to 458 family phase out and F12berlinetta being at its 4th year of commercialization
EMEAEMEA’s shipments increased by more than 2%
• UK –Ferrari’s largest market in EU was up 5% thanks to 458 Speciale A and by California T
• Strong performance in Italy (+17%) thanks to CaliforniaT, 458 Speciale A and the newly launched 488GTB; slowdown in Germany,as a result of the lower planned allocation, and in the Middle East mainly due to F12berlinetta being at its 4th year of commercialization
Rest of APACRest of APAC’s shipments increased by 26%
• Australia – shipments up by 44% driven by California T and 458 Speciale. Australia became fully operational in 2015 vs. 2014 start-up phase
• Japan – shipments increased by 33% thanks to the favorable market conditions; the growth was mainly driven by California T and 458 Speciale
Americas34%
(34% PY)
EMEA44% (45% PY)
Greater China8% (9% PY)
Rest of APAC14% (12% PY)
Note 1, refer to notes to the presentation in the Appendix

FY 2015 ResultsFebruary 2nd , 2015
• €136M increase in Cars and spare parts due to higher volumes led by California T, 458 Speciale A and new models 488 GTB and 488 Spider, which are replacing the 458 family
• €92M decrease in Engines mainly attributable to a slowdown in shipments to Maserati
6
NET REVENUES BRIDGE FY 2014-2015
1,944 2,080
311 219417 44190 136 (92) 24 24 114
2,762 2,854
FY 2014 Cars and spare parts Engines Sponsorship,commercial and
brand
Other FY 2015
Cars and spare parts Engines Sponsorship, commercial and brand Other
Notes 2,3,4 and 5, refer to notes to the presentation in the Appendix
2 3
4
5
+3%(-3% constant FX)
Net revenues (€m)

FY 2015 ResultsFebruary 2nd , 2015
Adjusted EBIT (€m)
7
ADJUSTED EBIT BRIDGE FY 2014-2015
Margin15.7%
Margin19.4%
Adjusted EBIT* (€m)
• Increased volume by 383 cars (excluding LaFerrari) thanks to California T, 458 Speciale A and the newly launched 488 GTB. Positive margin contribution from personalization.
• Negative mix effect due to growth of V8 vs. V12, partially offset by sales of LaFerrari and special car FXX K • Industrial costs and R&D growth attributable to the 2016 development of the power unit for F1 racing activity partially
offset by a lower R&D on road cars (primarily D&A of 458 family) and efficiencies on production costs• Higher SG&A costs mainly due to focus on directly operated retail stores, corporate costs and F1 racing activities• FX positive impact on transaction exchange rate net of hedging (mainly due to USD and GBP, partially offset by JPY)• Other includes better result from brand and commercial activities and supporting activities including Financial Services
Adj. EBITDA693
25.1%
Adj. EBITDA748
26.2%
Adj. EBIT FY'14 Vol Mix Ind. Costs R&D SG&A FX Other Adj. EBIT FY'15
404
45 (6) (3) (15)41 7 473
Margin14.6%
Margin16.6%
*Reconciliation to non-gaap financial measures are provided in the appendix

FY 2015 ResultsFebruary 2nd , 2015
Net Cash/(Net Debt*) bridge (€m)
8
NET CASH BRIDGE DECEMBER 31, 2014 – DECEMBER 31, 2015
(31)
432
748
(39)(145)
121
(317)
22
(54) (9)
Cash anddeposits
net of debt
(39)748Net Cash (145) (9)22(317)121 (54)
FCF €390m
(2,800)
134
(31)
Cash
Debt net of deposits
183
(2,121)
(2,800)
(1,938)566
*Reconciliation to non-gaap financial measures are provided in the appendix

FY 2015 ResultsFebruary 2nd , 2015
(379)
(2,800)
(2,091)
3,211
9
NET DEBT ANALYSIS – FY2015
Net Debt Analysis (€m)
Net Cash 566 (2,800) (Net Debt)
3221,076
(131)
(1,120)390
19 20
(15)
(35) (20)
(54)
(2,257)
(3)
- 390 -(31) (9)
(9)
(54)
(1) Includes the repayment of the FCA Note for €2.8 billion and other debt due to FCA (mostly by FFS Inc) for €411 million. The debt was repaid using the proceeds of : i) a €500 million bridge loan; ii) a €1,500 term loan; and iii) €91 million in other third-party debt, as well as €1 billion taken out of deposits in FCA cash management pools and available cash
Cash and deposits
Third-party debt
FCA debt
Cash and deposits
Third-party debt
FCA debt
(1,938)

FY 2015 ResultsFebruary 2nd , 2015
10
DEBT MATURITY SCHEDULE
€/million Total Debt at Dec 31, 2015 = €2,260 million
* The €500 million Bridge Facility is expected to be repaid with a proceeds of a bond issue in 2016.
** A loan with a third-party bank with a balance of USD 150 million (€138 million) at December 31, 2015, which is due in 2016, is expected to be extended for 18 months to 2017.
167
3 23 13 2 1
253
253
500 *
167
3
333 333 333 333
0
100
200
300
400
500
600
700
800
900
1,000
2016 2017 2018 2019 2020
Term Loan Bridge Facility Other financial liabilities
253
500*
167
138**
3 3 2 1
335 334336336
920

FY 2015 ResultsFebruary 2nd , 2015
11
2016 OUTLOOK
Shipments ˜7,900
Net revenues >€2.9 billion
Adj. EBITDA >€770 million
Net Debt* <€1,950 billion
assuming FX consistent with current market conditions
* (<€750 million - net of funded self-liquidating financial receivables portfolio) including distribution of common shares to shareholders subject to the approval of the 2015 annual accounts and review of other relevant financial statements by the Board of Directors
FY 2015 ResultsFebruary 2nd , 2015
12
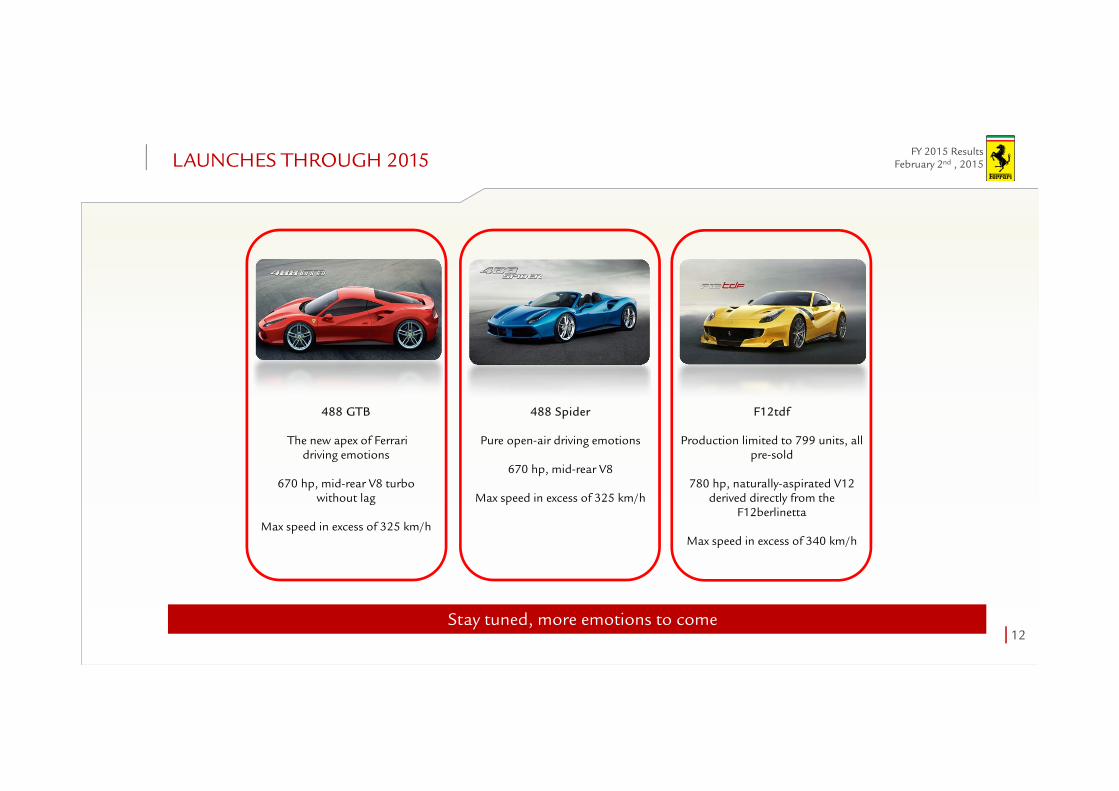
LAUNCHES THROUGH 2015
F12tdf
Production limited to 799 units, all pre-sold
780 hp, naturally-aspirated V12 derived directly from the
F12berlinetta
Max speed in excess of 340 km/h
488 GTB
The new apex of Ferrari driving emotions
670 hp, mid-rear V8 turbo without lag
Max speed in excess of 325 km/h
488 Spider
Pure open-air driving emotions
670 hp, mid-rear V8
Max speed in excess of 325 km/h
Stay tuned, more emotions to come

FY 2015 ResultsFebruary 2nd , 2015
13
FORMULA 1 IN 2015
1st place in the Malaysia, Hungary and Singapore GPs
16 podiums this year
S.Vettel 3rd in Driver’s Championship @ 278pts
Constructor’s Championship
1. Mercedes 7032. Scuderia Ferrari 4283. Williams 2574. Red Bull Racing 1875. Force India 136
Getting ready for the 2016 season, see you in Melbourne on March 18th - 20th

FY 2015 ResultsFebruary 2nd , 2015
14
2015 CLIENT RELATION ACTIVITIES
Ferrari International CavalcadeSan Francisco, August 10-15
50 customers attended
Creating unique driving experience for Ferraristi and nurturing brand
awareness
Ferrari Tribute to Chinese Culture
More than 500 customers and prospects attended
Events from April through October
Ferrari CavalcadeRome June, 25-30
More than 100 customers attended
Since 2012, Ferrari’s most exclusive global driving event
Ferrari Tribute to Mille Miglia
More than 60 customers attended
Ferrari’s proprietary event opening the classic Mille Miglia race
Open to all Ferraris built from 1958
Setting the tone for another year of exclusive events

FY 2015 ResultsFebruary 2nd , 2015
15
FERRARI BRAND AND STORE PRESENCE
Licensing activity67 Licensing Partners covering 21 product categories 10th Anniversary Collection with PUMALicense scope extension with Burago (die-cast models)Start of new partnership with Lego
Ferrari StoreOpening of new 750sqm Milan flagship storeNow managing 12 directly operated stores and 23 franchised locations, including 2Ferrari Store Junior in 15 Markets
E-commerceMore than 6.5M visitors and more than 39,000 orders processed in 2015
MuseumsRecord year with 464,000 visitors
Expanding the brand’s strength

FY 2015 ResultsFebruary 2nd , 2015
16
SUBSEQUENT EVENTS: JAN 3rd SPIN-OFF AND JAN 4th MILAN LISTING
Current Shareholding Structure after spin-off
EXOR S.p.A. Other FCA Shareholders
Ferrari N.V.
Ferrari S.p.A.
Public Shareholders Mr. Piero Ferrari
Fiat Chrysler Automobiles N.V.
10%~ 10%
~80%
~30 % ~70 %
EXOR S.p.A. Free Float
Ferrari N.V.
Ferrari S.p.A.
Mr. Piero Ferrari
~24 % ~66 %~10 %
Previous Shareholding Structure
100%
100%

FY 2015 ResultsFebruary 2nd , 2015
Q&A

FY 2015 ResultsFebruary 2nd , 2015
Appendix

FY 2015 ResultsFebruary 2nd , 2015
19
NOTES TO THE PRESENTATION
1. Shipments geographical breakdownEMEA includes: Italy, UK, Germany, Switzerland, France, Middle East (includes the United Arab Emirates, Saudi Arabia, Bahrain, Lebanon, Qatar, Oman and Kuwait) and Rest of EMEA (includes Africa and the otherEuropean markets not separately identified); Americas includes: United States of America, Canada, Mexico, the Caribbean and Central and South America; Greater China includes: China, Hong Kong and Taiwan; Rest of APAC includes: Japan, Australia, Singapore, Indonesia and South Korea
2. Includes the net revenues generated from shipments of our cars, including any personalization revenue generated on these cars and sales of spare parts
3. Includes the net revenues generated from the sale of engines to Maserati for use in their cars, and the revenues generated from the rental of engines to other Formula 1 racing teams.
4. Includes the net revenues earned by our Formula 1 racing team through sponsorship agreements and our share of the Formula 1 World Championship commercial revenues and net revenues generated through the Ferrari brand, including merchandising, licensing and royalty income
5. Primarily includes interest income generated by the Ferrari Financial Services group and net revenues from the management of the Mugello racetrack

FY 2015 ResultsFebruary 2nd , 2015
20
GROUP SHIPMENTS
3,274 3,351 ˜3,400
2,462 2,640 ˜2,700
675 610 ˜700 844
1,063 ˜1,100
FY 2014 FY 2015 FY 2016E
EMEA Americas Greater China Rest of APAC
~7,900
7,2557,664

FY 2015 ResultsFebruary 2nd , 2015
21
KEY PERFORMANCE METRICS
Q4 ‘15 Q4 ‘14 €m, except as otherwise stated FY ‘15 FY ‘14
2,021 1,975 Worldwide shipments (units) 7,664 7,255
744 751 Net revenues 2,854 2,762
85 115 EBIT 444 389
24 - Adjustments 29 15
109 115 Adjusted EBIT1 473 404
(5) 2 Net financial (expenses)/income (10) 9
80 117 Profit before taxes 434 398
25 38 Income tax expense 144 133
31.8% 32.8% Effective tax rate 33.2% 33.5%
55 79 Net profit 290 265
0.28 0.41 EPS 1.52 1.38
157 193 EBITDA1 719 678
181 193 Adjusted EBITDA1 748 693
1 Reconciliation to non-gaap financial measures are provided in the appendix

FY 2015 ResultsFebruary 2nd , 2015
Operations are monitored through the use of various Non-GAAP financial measures that may not be comparable to other similarly titled measures of other companies
Accordingly, investors and analysts should exercise appropriate caution in comparing these supplemental financial measures to similarly titled financial measures reported by other companies
We believe that these supplemental financial measures provide comparable measures of its financial performance which then facilitate management’s ability to identify operational trends, as well as make decisions regarding future spending, resource allocations and other operational decisions
Adjusted Earnings Before Interest and Taxes (“Adjusted EBIT”) represents EBIT as adjusted for income and costs, which are significant in nature, but expected to occur infrequently
EBITDA is defined as net profit before income tax expense, net financial expenses/(income) and depreciation and amortization. Adjusted EBITDA is defined as EBITDA as adjusted for income and costs, which are significant in nature, but expected to occur infrequently
Net Cash/(Net Debt) is defined as cash and cash equivalents plus cash deposits in FCA Group cash management pools less debt
Free Cash Flow is one of management’s primary key performance indicators to measure the Group’s performance and is defined as cash flows from operating activities less cash flows used in investing activities.Free Cash Flow is subject to month to month fluctuations due to, among others, production volumes, activity of our financial services portfolio, timing of tax payments and capital expenditures
Non-GAAP financial measures
22
NON-GAAP FINANCIAL MEASURES

FY 2015 ResultsFebruary 2nd , 2015
23
RECONCILIATION OF NON-GAAP MEASURES: ADJ. EBIT
Q4 ‘15 Q4 ‘14 € million FY ‘15 FY ‘14
85 115 EBIT 444 389
- -Expense related to the
resignation of the former Chairman
- 15
24 -
Income and expenses incurred in connection with our IPO
and separation and Employeesextra bonus
29 -
109 115 Adjusted EBIT 473 404

FY 2015 ResultsFebruary 2nd , 2015
24
RECONCILIATION OF NON-GAAP MEASURES: EBITDA
Q4 ‘15 Q4 ‘14 € million FY ‘15 FY ‘14
55 79 Net profit 290 265
25 38 Income tax expense 144 133
5 (2) Net financialexpenses/(income) 10 (9)
72 78 Amortization and depreciation 275 289
157 193 EBITDA 719 678

FY 2015 ResultsFebruary 2nd , 2015
25
RECONCILIATION OF NON-GAAP MEASURES: ADJ. EBITDA
Q4 ‘15 Q4 ‘14 € million FY ‘15 FY ‘14
157 193 EBITDA 719 678
- -Expense related to the
resignation of the former Chairman
- 15
24 -
Income and expenses incurred in connection with our IPO
and separation and Employeesextra bonus
29 -
181 193 Adjusted EBITDA 748 693

FY 2015 ResultsFebruary 2nd , 2015
26
RECONCILIATION OF NON-GAAP MEASURES: FREE CASH FLOW
Q4 ‘15 Q4 ‘14 € million FY ‘15 FY ‘14
173 131Cash flows from operating
activities 707 426
(121) (122)Cash flows used in investing
activities (317) (290)
52 9 Free Cash Flow 390 136

FY 2015 ResultsFebruary 2nd , 2015
27
RECONCILIATION OF NON-GAAP MEASURES: NET CASH/(NET DEBT)
€ million December 31, 2015 December 31, 2014
Cash and cash equivalents 183 134
Deposits in FCA Group cash management pools
139 942
Financial liabilities with FCA Group (3) (379)
Financial liabilities with third parties (2,257) (131)
Total Net Cash/(Net Debt) (1,938) 566