fy 2017 results - eon.com · provisions calculated with a real discount rate of 0.0% as opposed ......
TRANSCRIPT

FY 2017 resultsFinancial Details
Contacts, Calendar & Disclaimer
1
2
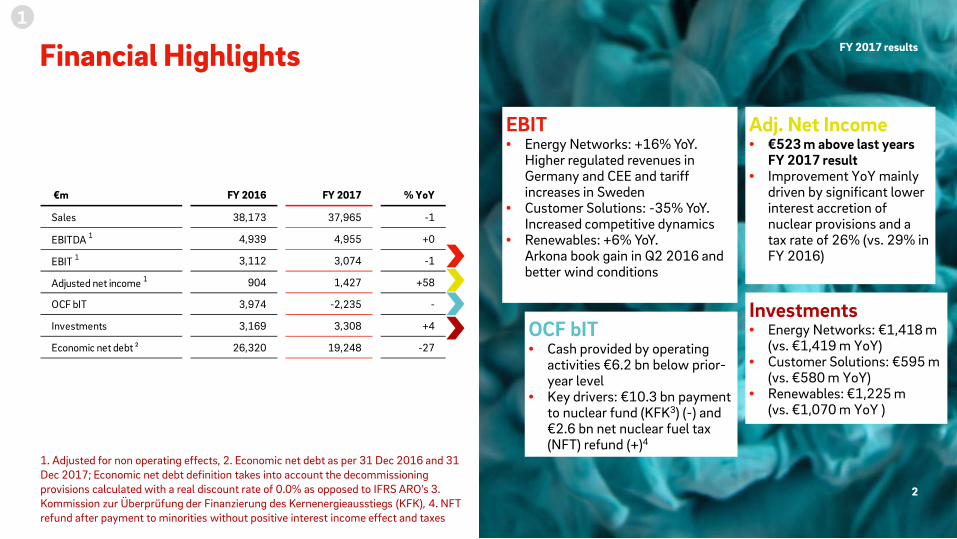
Financial Highlights
€m FY 2016 FY 2017 % YoY
Sales 38,173 37,965 -1
EBITDA 1 4,939 4,955 +0
EBIT 1 3,112 3,074 -1
Adjusted net income 1 904 1,427 +58
OCF bIT 3,974 -2,235 -
Investments 3,169 3,308 +4
Economic net debt ² 26,320 19,248 -27
2
FY 2017 results
EBIT• Energy Networks: +16% YoY.
Higher regulated revenues in Germany and CEE and tariff increases in Sweden
• Customer Solutions: -35% YoY. Increased competitive dynamics
• Renewables: +6% YoY.Arkona book gain in Q2 2016 and better wind conditions
OCF bIT• Cash provided by operating
activities €6.2 bn below prior-year level
• Key drivers: €10.3 bn payment to nuclear fund (KFK3) (-) and €2.6 bn net nuclear fuel tax (NFT) refund (+)4
Adj. Net Income• €523 m above last years
FY 2017 result• Improvement YoY mainly
driven by significant lower interest accretion of nuclear provisions and a tax rate of 26% (vs. 29% in FY 2016)
1. Adjusted for non operating effects, 2. Economic net debt as per 31 Dec 2016 and 31 Dec 2017; Economic net debt definition takes into account the decommissioning provisions calculated with a real discount rate of 0.0% as opposed to IFRS ARO’s 3. Kommission zur Überprüfung der Finanzierung des Kernenergieausstiegs (KFK), 4. NFT refund after payment to minorities without positive interest income effect and taxes
1
Investments• Energy Networks: €1,418 m
(vs. €1,419 m YoY)• Customer Solutions: €595 m
(vs. €580 m YoY)• Renewables: €1,225 m
(vs. €1,070 m YoY )
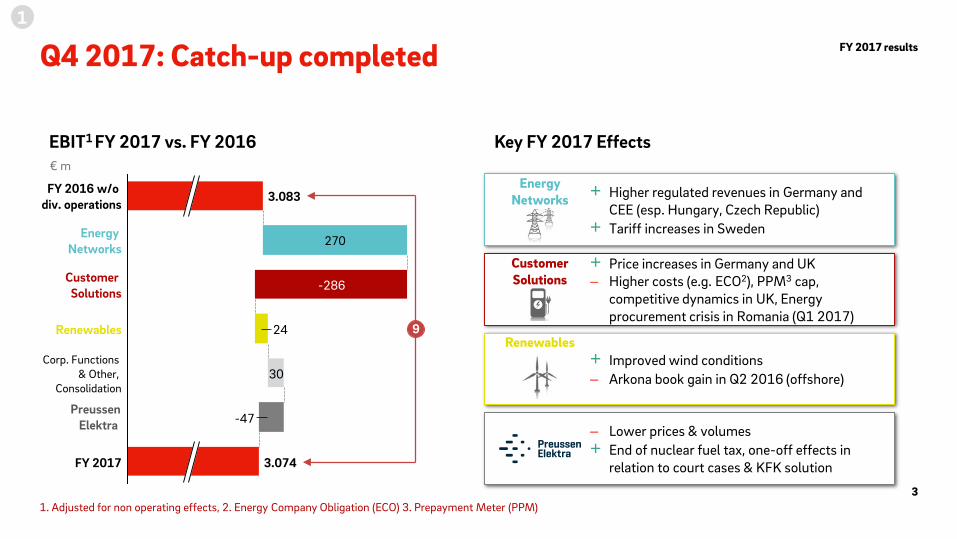
– Lower prices & volumes+ End of nuclear fuel tax, one-off effects in
relation to court cases & KFK solution
+ Higher regulated revenues in Germany and CEE (esp. Hungary, Czech Republic)
+ Tariff increases in Sweden
+ Price increases in Germany and UK – Higher costs (e.g. ECO2), PPM3 cap,
competitive dynamics in UK, Energy procurement crisis in Romania (Q1 2017)
+ Improved wind conditions– Arkona book gain in Q2 2016 (offshore)
Q4 2017: Catch-up completed
270Energy Networks
Renewables
Customer Solutions
FY 2016 w/o div. operations
Corp. Functions & Other,
Consolidation
-47
30
24
-286
3.083
3.074
9
FY 2017
EBIT1 FY 2017 vs. FY 2016€ m
1. Adjusted for non operating effects, 2. Energy Company Obligation (ECO) 3. Prepayment Meter (PPM) 3
Energy Networks
Customer Solutions
Renewables
PreussenElektra
Key FY 2017 Effects
1FY 2017 results

Highlights
Segment: Energy Networks
• Germany: + Regulatory effects+ Lower maintenance cost
• Sweden: + Tariff increases
• CEE & Turkey: + Tariff increases in Hungary+ Higher allowed revenues in Czech Republic
Energy Networks
417
398 474
379
894
1,941
FY 2016
1,050
1,671
CEE & Turkey
+16%
Sweden
FY 2017
Germany
1. Adjusted for non operating effects
EBIT1 € m
€m FY 2016 FY 2017 % YoY FY 2016 FY 2017 % YoY FY 2016 FY 2017 % YoY FY 2016 FY 2017 % YoY
Revenue 13,205 14,199 +8 1,029 1,072 +4 1,658 1,719 +4 15,892 16,990 +7
EBITDA 1 1,507 1,641 +9 562 632 +12 610 654 +7 2,679 2,927 +9
EBIT 1 894 1,050 +17 398 474 +19 379 417 +10 1,671 1,941 +16 thereof Equity-method earnings 66 74 +12 0 0 - 63 44 -30 129 118 -9 OCFbIT 1,588 2,451 +54 575 640 +11 605 605 +0 2,768 3,696 +34 Investments 846 702 -17 291 345 +19 282 371 +32 1,419 1,418 -0
TotalGermany Sweden CEE & Turkey
4
Det
ails
1FY 2017 results

Segment: Customer Solutions
Customer Solutions Highlights
• Germany: – Lower power & gas margins due to higher prices especially TSO2
fees– Provision building in Q4 2017+ Price increases as per Q2 2017
• UK: – Higher ECO3 costs & FX weakening– Price cap on PPM4 customers– Competitive dynamics
• Other: – Energy procurement crisis in Romania in Q1 2017
215 158
365250
232
118
-35%
Other
UK
Germany
FY 2017
526
FY 2016
812
EBIT1 € m
1. Adjusted for non operating effects 2. Transmission system operator (TSO) 3. Energy Company Obligation (ECO) 4. Prepayment meter (PPM)
€m FY 2016 FY 2017 % YoY FY 2016 FY 2017 % YoY FY 2016 FY 2017 % YoY FY 2016 FY 2017 % YoY
Revenue 7,781 7,452 -4 7,791 7,205 -8 6,796 6,910 +2 22,368 21,567 -4
EBITDA 1 299 192 -36 460 353 -23 351 302 -14 1,110 847 -24
EBIT 1 232 118 -49 365 250 -32 215 158 -27 812 526 -35 thereof Equity-method earnings 0 0 - 0 0 - 10 14 +40 10 14 +40 OCFbIT 351 317 -10 435 403 -7 381 247 -35 1,167 967 -17 Investments 73 75 +3 220 211 -4 287 309 +8 580 595 +3
TotalUKGermany Other
5
Det
ails
1FY 2017 results

• Offshore: + Better wind conditions especially in Q4 2017– Arkona book gain in Q2 2016
• Onshore: + COD of Colbeck’s Corner in May 2016+ Higher production of US wind farms
Segment: Renewables
Renewables Highlights
117
338 337
92
+6%
Offshore/Other
Onshore/Solar
FY 2017
454
FY 2016
430
EBIT1 € m
1. Adjusted for non operating effects
€m FY 2016 FY 2017 % YoY FY 2016 FY 2017 % YoY FY 2016 FY 2017 % YoY
Revenue 728 927 +27 629 677 +8 1,357 1,604 +18
EBITDA 1 308 299 -3 488 486 -0 796 785 -1
EBIT 1 92 117 +27 338 337 -0 430 454 +6 thereof Equity-method earnings 15 24 +60 OCFbit 699 601 -14 Investments 1,070 1,225 +14
Onshore Wind / Solar Offshore Wind / Others Total
6
Det
ails
1FY 2017 results

Segment: PreussenElektra
PreussenElektra Highlights
506553
-8%
FY 2017FY 2016
– Lower volumes due to Brokdorf outage– Lower achieved power prices+ End of nuclear fuel tax payments in 2016+ One-off effects in relation to court cases & KFK solution
Hedged Prices Germany (€/MWh) as of 31 Dec 2017
EBIT1 € m
1. Adjusted for non operating effects
€m FY 2016 FY 2017 % YoY
Revenue 1,538 1,585 +3
EBITDA 1 644 654 +2
EBIT 1 553 506 -8 thereof Equity-method earnings 63 55 -13 OCFbIT 93 -7,357 -Investments 15 14 -7
PreussenElektra
7
28
27
32
37
2019
2018
2017
2016
98%
66%
100%
Det
ails
100%
1FY 2017 results

Adjusted Net Income
€m FY 2016 FY 2017 % YoY
EBITDA 1 4,939 4,955 +0
Depreciation/amortization -1,827 -1,881 -3
EBIT 1 3,112 3,074 -1
Economic interest expense (net) -1,452 -744 +49
EBT 1 1,660 2,330 +40
Income Taxes on EBT 1 -478 -613 -28
% of EBT 1 -29% -26% -
Non-controlling interests -278 -290 -4
Adjusted net income 1 904 1,427 +58
1. Adjusted for non operating effects8
1
Economic interest expense (net)• Improvement mainly driven
by significant lower interest accretion of nuclear provisions (~€750m), while other interest expenses were up (~€60m) Tax rate
• Tax rate of 26% (vs. 29% in FY 2016)
EPS (€ per share)€0.67
Adjusted Net Income• Up 58% over
prior year
FY 2017 results
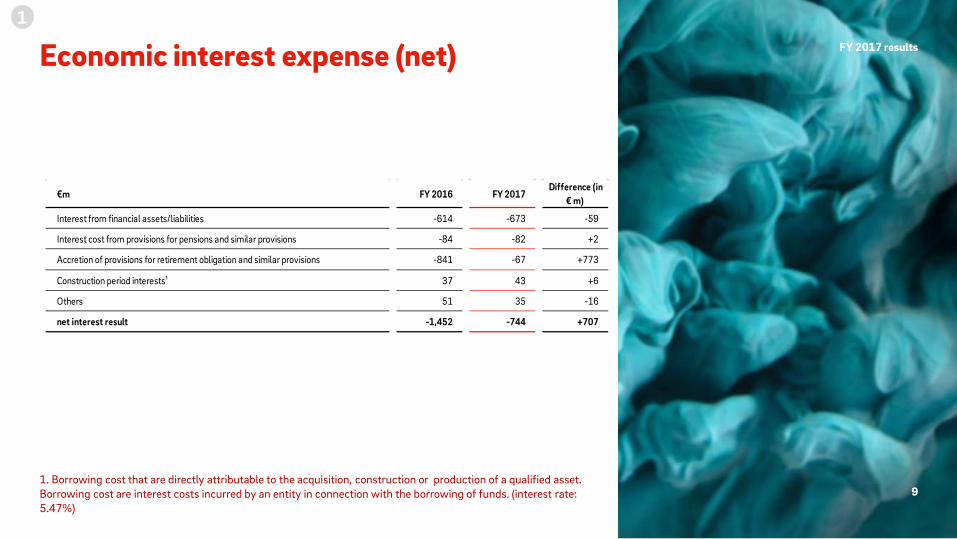
Economic interest expense (net)
€m FY 2016 FY 2017 Difference (in
€ m)
Interest from financial assets/liabilities -614 -673 -59
Interest cost from provisions for pensions and similar provisions -84 -82 +2
Accretion of provisions for retirement obligation and similar provisions -841 -67 +773
Construction period interests¹ 37 43 +6
Others 51 35 -16
net interest result -1,452 -744 +707
1. Borrowing cost that are directly attributable to the acquisition, construction or production of a qualified asset. Borrowing cost are interest costs incurred by an entity in connection with the borrowing of funds. (interest rate: 5.47%)
9
1FY 2017 results
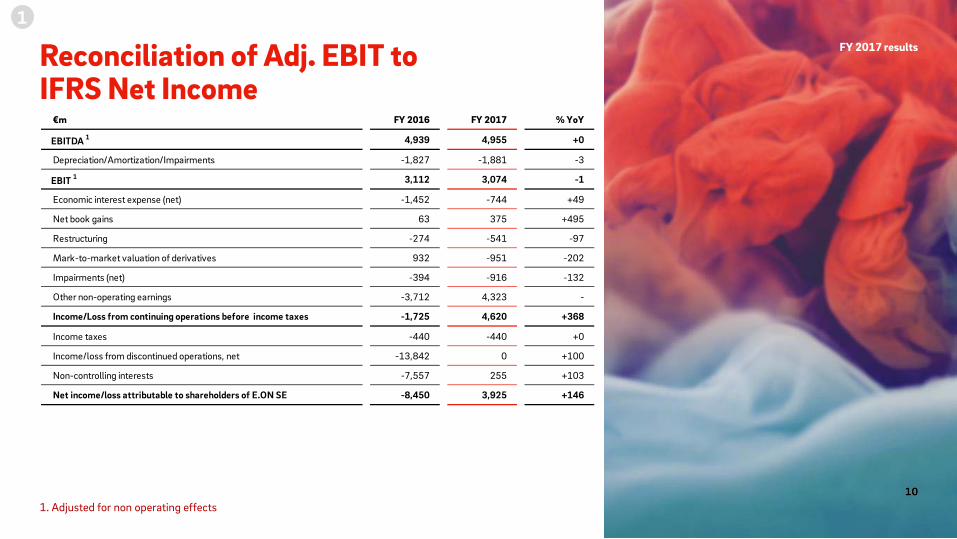
Reconciliation of Adj. EBIT to IFRS Net Income
€m FY 2016 FY 2017 % YoY
EBITDA 1 4,939 4,955 +0
Depreciation/Amortization/Impairments -1,827 -1,881 -3
EBIT 1 3,112 3,074 -1
Economic interest expense (net) -1,452 -744 +49
Net book gains 63 375 +495
Restructuring -274 -541 -97
Mark-to-market valuation of derivatives 932 -951 -202
Impairments (net) -394 -916 -132
Other non-operating earnings -3,712 4,323 -
Income/Loss from continuing operations before income taxes -1,725 4,620 +368
Income taxes -440 -440 +0
Income/loss from discontinued operations, net -13,842 0 +100
Non-controlling interests -7,557 255 +103
Net income/loss attributable to shareholders of E.ON SE -8,450 3,925 +146
1. Adjusted for non operating effects
1
1010
FY 2017 results

Changes in WC
0.6
Cash Adjustments3
-0.1
EBITDA1
5.0
FCF
0.9
Capex
-3.3
OCF
4.3
Tax Payments
-0.5
Interest Payments5
-0.7
OCF bIT4
5.4
CCR2: + 109%
High cash conversion rate2 of 109% supported by strong operating cash flow
FY 2017€ bn
1. Adjusted for non operating effects, 2. Cash Conversion Rate: OCF bIT / EBITDA, adjusted for NFT and KFK effects, 3. Net non cash effective EBITDA items incl. provision utilizations, 4. Adjusted for KFK and NFT effects , 5. Adjusted for NFT effects
11
1FY 2017 results

END improves significantly due to high cash flow and refund of nuclear fuel tax
Others
0.6
-3.3
-3.6
-10.6
-0.9
-21.4
-4.0
END FY 2016
-5.0
OCF2
4.3
InvestmentsKFK payment to government
fund4
3.1
Cash impact of NFT
Refund3
-10.3
1.35-26.3
END FY 2017
+7.1
-19.2
ABB5
0.8
Dividend
0.4
-0.6
Divestments Pensions AROs6
10.1
Nuc. decomm.
cost savings
0.6
€ bnEND1 FY 2017 vs. FY 2016
Differences occur due to rounding.1. Economic net debt definition takes into account the decommissioning provisions calculated with a real discount rate of 0.0% as opposed to IFRS ARO’s. 2. OCF adjusted for KFK and NFT effects, 3. Nuclear Fuel Tax (NFT) after payment to minorities including positive interest income effect, before taxes 4. Kommissionzur Überprüfung der Finanzierung des Kernenergieausstiegs (KFK), 5. Accelerated Book Build (ABB), 6. Includes transfer of nuclear storage liabilities to government fund
AROs Net financial positionPension provisions
12
Operating Cash Flow:-3.0
1FY 2017 results
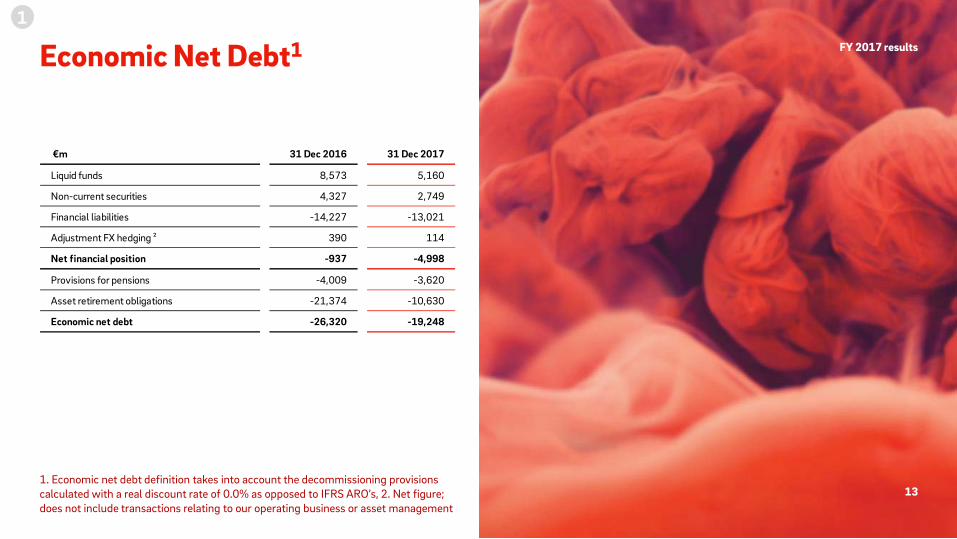
Economic Net Debt1
1. Economic net debt definition takes into account the decommissioning provisions calculated with a real discount rate of 0.0% as opposed to IFRS ARO’s, 2. Net figure; does not include transactions relating to our operating business or asset management
13
1
€m 31 Dec 2016 31 Dec 2017
Liquid funds 8,573 5,160
Non-current securities 4,327 2,749
Financial liabilities -14,227 -13,021
Adjustment FX hedging ² 390 114
Net financial position -937 -4,998
Provisions for pensions -4,009 -3,620
Asset retirement obligations -21,374 -10,630
Economic net debt -26,320 -19,248
FY 2017 results

Cash effective investments by unit
€m FY 2016 FY 2017 % YoY
Energy Networks 1,419 1,418 -0
Customer Solutions 580 595 +3
Renewables 1,070 1,225 +14
Corporate Functions & Other 106 53 -50
Consolidation -21 3 +114
PreussenElektra 15 14 -7
Investments 3,169 3,308 +4
14
1FY 2017 results
0.6
2023
0.4
2022
0.1
2021
0.8
2020 2025
0.0
2024
1.4
≥2026
4.7
2019
1.1
2018
2.0
OtherYENUSDGBPEUR
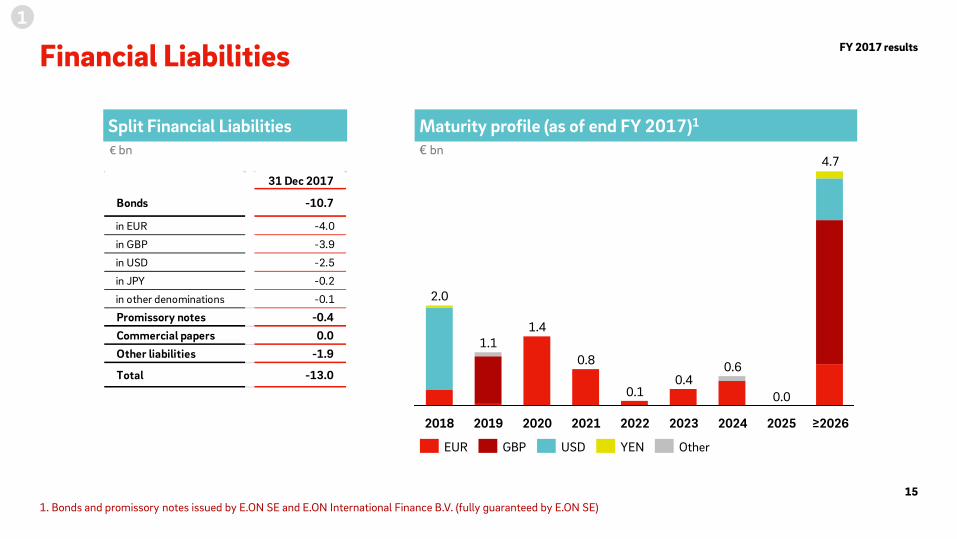
Financial Liabilities
Split Financial Liabilities€ bn
31 Dec 2017
Bonds -10.7
in EUR -4.0
in GBP -3.9
in USD -2.5
in JPY -0.2
in other denominations -0.1
Promissory notes -0.4 Commercial papers 0.0 Other liabilities -1.9
Total -13.0
1
15
Maturity profile (as of end FY 2017)1
€ bn
1. Bonds and promissory notes issued by E.ON SE and E.ON International Finance B.V. (fully guaranteed by E.ON SE)
FY 2017 results

E.ON Investor Relations contacts
T +49 (201) 184 [email protected]
Alexander Karnick T+49 (201) 184 28 38Head of Investor Relations [email protected]
Martina Burger T +49 (201) 184 28 07Manager Investor Relations [email protected]
Dr. Stephan Schönefuß T +49 (201) 184 28 22Manager Investor Relations [email protected]
16
Andreas Thielen T +49 (201) 184 28 15Manager Investor Relations [email protected]
2FY 2017 results

Financial calendar & important links
Financial calendar
May 8, 2018 Quarterly Statement: January – March 2018
May 9, 2018 2018 Annual Shareholders Meeting
May 14, 2018 Dividend Payment
August 8, 2018 Half-Year Financial Report: January – June 2018
November 14, 2018 Quarterly Statement: January – September 2018
March 13, 2019 Annual Report 2018
Important links
Presentations https://www.eon.com/en/investor-relations/presentations.html
Annual Reports https://www.eon.com/en/investor-relations/financial-publications/annual-report.html
Interim Reports https://www.eon.com/en/investor-relations/financial-publications/interim-report.html
Shareholder Meeting https://www.eon.com/en/investor-relations/shareholders-meeting.html
Bonds / Creditor Relations https://www.eon.com/en/investor-relations/bonds.html
17
2FY 2017 results
Disclaimer
This presentation contains information relating to E.ON Group ("E.ON") that must not be relied upon for any purpose and may not be redistributed, reproduced,published, or passed on to any other person or used in whole or in part for any other purpose. By accessing this document you agree to abide by the limitations set outin this document as well as any limitations set out on the webpage of E.ON SE on which this presentation has been made available.This document is being presented solely for informational purposes. It should not be treated as giving investment advice, nor is it intended to provide the basis for anyevaluation or any securities and should not be considered as a recommendation that any person should purchase, hold or dispose of any shares or other securities.The information contained in this presentation may comprise financial and similar information which is neither audited nor reviewed and should be consideredpreliminary and subject to change.Some of the information presented herein is based on statements by third parties. No representation or warranty, express or implied, is made as to, and no relianceshould be placed on, the fairness, accuracy, completeness or correctness of this information or any other information or opinions contained herein, for any purposewhatsoever.This presentation may contain forward-looking statements based on current assumptions and forecasts made by E.ON management and other information currentlyavailable to E.ON. Various known and unknown risks, uncertainties and other factors could lead to material differences between the actual future results, financialsituation, development or performance of the company and the estimates given here. E.ON does not intend, and does not assume any liability whatsoever, to updatethese forward-looking statements or to conform them to future events or developments.Neither E.ON nor any respective agents of E.ON undertake any obligation to provide the recipient with access to any additional information or to update thispresentation or any information or to correct any inaccuracies in any such information.Certain numerical data, financial information and market data (including percentages) in this presentation have been rounded according to established commercialstandards. As a result, the aggregate amounts (sum totals or interim totals or differences or if numbers are put in relation) in this presentation may not correspond in allcases to the amounts contained in the underlying (unrounded) figures appearing in the consolidated financial statements. Furthermore, in tables and charts, theserounded figures may not add up exactly to the totals contained in the respective tables and charts.