fy 2018 operating per capita cost report - corrections.az.gov · arizona department of corrections...
TRANSCRIPT

ARIZONA DEPARTMENT OF CORRECTIONS
Charles L. Ryan, Director
FY 2018 Operating Per Capita Cost Report
ADC FY 2018 Operating Per Capita Cost ReportDate Prepared: January 23, 2019

ARIZONA STATE PRISON PRIVATE / CONTRACT
COMPLEXES (ASPC) PRISON BEDS
ASPC-Douglas Central Arizona Correctional Facility (CACF) (Florence) [GEO]
ASPC-Eyman Florence West [GEO]
ASPC-Florence Kingman-Cerbat [GEO]*
ASPC-Lewis Kingman-Huachuca [GEO]*
ASPC-Perryville Marana [MTC]*
ASPC-Phoenix Phoenix West [GEO]
ASPC-Safford Red Rock [CoreCivic]
ASPC-Tucson
ASPC-Winslow
ASPC-Yuma *Government owned, contract operated
ARIZONA DEPARTMENT OF CORRECTIONS (ADC)
FY 2018 PRISON FACILITIES
ADC FY 2018 Operating Per Capita Cost Report

Section I Methodology 1
- Introduction………………………………………………………………………………………………………………………………………………………………………………………………3
- Methodology………………………………………………………………………………………………………………………………………………………………………………………………4
- Summary of Allocation Methodology………………………………………………………………………………………………………………………………………………………………………………5
Section II Fiscal Year 2018 Per Capita Cost Summary 7
- Expenditure Summary……………………………………………………………………………………………………………………………………………………………………..8
- State Prison Expenditures by Prison Unit…………………………………………………………………………………………………………………………………….10
- State Prison Minimum Custody Unit Expenditures…………………………………………………………………………………………………………………………..12
- State Prison Medium Custody Unit Expenditures……………………………………………………………………………………………………………………………13
- State Prison Close Custody Unit Expenditures………………………………………………………………………………………………………………………………14
- State Prison Maximum Custody Unit Expenditures………………………………………………………………………………………………………………………….15
Section III Fiscal Year 2018 Per Capita Cost Detail By Function & Object 17
- Complex Expenditure Detail By Function…………………………………………………………………………………………………………………………………….18
- Complex Expenditure Detail By Object…………………………………………………………………………………………………………………………………….20
- Custody Level Expenditure Detail By Function…………………………………………………………………………………………………………………………………….22
- Custody Level Expenditure Detail By Object…………………………………………………………………………………………………………………………………….24
TABLE OF CONTENTS
Identifies the report methodology for allocating costs and a chart depicting how complex direct, unit direct, and indirect costs are
distributed by function. The cost assignment and adjustment methodologies for calculating the per diem costs are identified and
explained.
Provides the FY 2018 overall annual operating costs and per diem costs for state prisons, private prisons and community corrections.
Provides more detail of the composition of annual operating and per diem costs.
ADC FY 2018 Operating Per Capita Cost Report

Section IV Operational Differences Between State & Private Prison Operations 27
- Inmate Management Functions……………………………………………………………………………………………………………………………………………………………………..28
- State Prison Capabilities for Medical, Mental Health and Dental Services………………………………………………………………………………………………………………………………………………………31
- Contract Medical, Mental Health and Dental Criteria……………………………………………………………………………………………………………………………………………………………………..32
- Other Placement Criteria Exclusions………………………………………………………………………………………………………………………………………………………33
- Complexity of Objective Cost Evaluations………………………………………………………………………………………………………………………………….36
Section V Historical Information 39
Historical reports including average daily population (ADP), state, contracted and other per diem rates.
- Historical ADP…………………………………………………………………………………………………………………………………………………….41
- State Prisons Costs…………………………………………………………………………………………………………………………………………………….42
- Contracted Prison Beds Costs…………………………………………………………………………………………………………………………………………………….43
- Adult Parole and Home Arrest…………………………………………………………………………………………………………………………………………………….44
- Community Supervision…………………………………………………………………………………………………………………………………………………….45
- Other Costs (Lease Purchase, One-time Costs, County Jails Pending Intake and Building Renewal)…………………………………………………………………………………………………………………………………………………….46
- Other Historical Information…………………………………………………………………………………………………………………………………….48
- List of Acronyms…………………………………………………………………………………………………………………………………….52
TABLE OF CONTENTS (Continued)
Identifies and compares inmate management functions that may be provided by state and/or contract bed providers, as well as medical,
mental health and dental contract exclusions and restrictions. The section also identifies other inmate placement limitations for contract
prison bed providers. The information is provided to clarify the differences in inmate placement for contract beds, as opposed to state
prisons, which cannot exclude inmates sentenced to the Department regardless of custody level, sentenced offense or health status.
ADC FY 2018 Operating Per Capita Cost Report

Section I Methodology 1
- Introduction………………………………………………………………………………………………………………………………………………………………………………………………3
- Methodology………………………………………………………………………………………………………………………………………………………………………………………………4
- Summary of Allocation Methodology………………………………………………………………………………………………………………………………………………………………………………5
Section I
Identifies the report methodology for allocating costs and a chart depicting how complex direct, unit direct, and indirect costs are distributed
by function. The cost assignment and adjustment methodologies for calculating the per diem costs are identified and explained.
ADC FY 2018 Operating Per Capita Cost Report 1

THIS PAGE INTENTIONALLY LEFT BLANK
ADC FY 2018 Operating Per Capita Cost Report 2

INTRODUCTION
The Arizona Department of Corrections (Department) publishes the Operating Per Capita Cost Report annually to analyze expenditures for the incarceration
of inmates sentenced to the Department including felons who have been released and are monitored under community supervision.
Operating Per Capita Cost Report History
The Department has provided average daily costs annually for state prisons since FY 1983 and included Private Prisons beginning in FY 1995. The report
has been prepared annually by Department staff with the exception of FY 2005 through FY 2007 when it was prepared by a contracted vendor. Section V of
the report contains historical information including average daily population (ADP), state, contracted and other per diem rates.
Cost Comparisons
The state and private per diem costs included in the report should not be used for state and private cost comparisons. Laws 2012, 2nd Regular Session,
Chapter 302 (S.B. 1531) repealed A.R.S. 41-1609.01 (L) which required the Department to conduct a cost comparison. The cost comparison has been
omitted due to this legislative change and because of the complexity in determining an objective report methodology. Section IV describes in more detail the
limitations of the report and the complicating factors of making accurate cost comparisons between state and private prisons. For example, the Operating Per
Capita Report continues to exclude capital construction costs for state constructed and operated buildings whereas capital construction and financing costs
are included for private facilities except for ASP-Marana and ASP-Kingman.
In an effort to provide up-to-date annual expenditure and per diem costs the Department continues to publish the Operating Per Capita Cost Report. A.R.S.
41-1609.01 (G) requires that a proposal for new private beds shall not be accepted unless the proposal offers cost savings to this state. This particular statute
is relevant in the evaluation of new private beds. When required by statute, the Operating Per Capita Cost Report provides a starting point for comparisons.
However, other factors, such as construction and financing costs, must be analyzed and adjustments will be required to determine whether cost savings exist.
ADC FY 2018 Operating Per Capita Cost Report 3

The process of allocating expenses is based on a combination of direct expenditures and a defined methodology of indirect expenditures (see chart in
Section I). Actual direct expenses are identified for all state prison units, private prison units and community supervision. Expenditures that are not
assigned directly to a prison unit through AFIS, such as divisional support functions, are analyzed and allocated as either direct or indirect
expenditures. These allocations are calculated using the following criteria: ADP, FTE and vehicle fleet assignments.
Financial information contained in this report was obtained from Department's expenditure data for appropriated funds as reported in Arizona
Financial Information System (AFIS - the state’s accounting system) for FY 2018 and includes administrative adjustments through September 30,
2018. Expenditures from non-appropriated funds are not included in the report. The costs used in the analysis include all elements of salary and
employee related expenditures (including employee and employer pension costs and health insurance costs), all other operating expenses (including
travel, utilities, inmate food, per diem payments for inmate health care and private prison operators, etc.), and equipment (capital and non-capital).
METHODOLOGY
Daily Per Capita Cost:
Expenses for highly specialized units/functions, Certificate of Participation payments for State Prisons and ASP-Kingman, State building renewal
costs, and those costs relating to inmates pending transport to ADC from county jails are excluded from the calculation of per diem costs and identified
separately.
The report includes information on the ADP of all inmates housed within the Department's state operated prisons, contracted prison beds and offenders
in community supervision. The ADP does not include inmates sentenced to the Department that are pending transport to Department intake facilities,
or other prison beds located in Arizona that house federal or other state(s) sentenced inmates. The ADP is developed using the grand total of inmates,
which includes both inside and outside inmate counts obtained from the Department's daily "Institutional Capacity & Committed Population" reports.
The ADP for FY 2018 began on July 1, 2017 and ended on June 30, 2018.
The "Operating Per Capita Cost Report" provides the total annual cost and average daily cost incurred by the Department to incarcerate inmates within
state operated prisons, private prison beds, and to monitor parolees on community supervision. The report includes all Department costs, not just
housing related costs.
ADC FY 2018 Operating Per Capita Cost Report 4

ARIZONA DEPARTMENT OF CORRECTIONS
SUMMARY OF ALLOCATION METHODOLOGY
COMPLEX ALLOCATION
METHODOLOGY
UNIT ALLOCATION
METHODOLOGY STATE PRISONS CONTRACT PRISON BEDS
COMMUNITY
CORRECTIONS
COMPLEX DIRECT
Central Private Prison Contract Monitoring DIRECT ADP NO YES NO
Complex Admin/Central Costs DIRECT DIRECT, ADP YES NO NO
Complex Business Office/Warehouse DIRECT DIRECT, ADP YES NO NO
Complex Records DIRECT ADP YES NO NO
Complex Security DIRECT DIRECT, ADP YES NO NO
Counseling/Treatment ADP ADP YES NO NO
Discharge DIRECT DIRECT, ADP YES YES NO
Fleet/Motor Pool DIRECT, VEHICLES DIRECT, ADP, FTE YES YES YES
Health Monitoring/Administration DIRECT, ADP DIRECT, ADP YES YES NO
Inspector General DIRECT, ADP ADP YES YES NO
Intake DIRECT ADP YES NO NO
Maintenance DIRECT DIRECT, ADP YES NO NO
Off Ops Divisional Support DIRECT, ADP, FTE DIRECT, ADP, FTE YES YES YES
Service Dog DIRECT, ADP DIRECT, ADP YES NO NO
Training DIRECT, FTE FTE YES NO NO
Utilities/Fixed Costs DIRECT DIRECT, ADP YES NO NO
Warden's Office DIRECT ADP YES NO NO
UNIT DIRECT
Community Corrections/Reentry Centers DIRECT DIRECT NO NO YES
Counseling/Treatment DIRECT ADP YES NO NO
Education DIRECT DIRECT, ADP YES NO NO
Food Service DIRECT DIRECT, ADP YES NO NO
Health Contract Pmts DIRECT, ADP ADP YES NO NO
Maintenance DIRECT DIRECT YES NO NO
Private Prison Per Diem DIRECT DIRECT NO YES NO
Religious Services DIRECT ADP YES NO NO
Unit Contract Monitoring DIRECT DIRECT, ADP NO YES NO
Unit Management & Support DIRECT DIRECT YES NO NO
Unit Security DIRECT DIRECT YES NO NO
WIPP DIRECT DIRECT, ADP YES YES NO
INDIRECT
Administrative Services ADP ADP YES YES YES
Agency Support DIRECT, FTE ADP, FTE YES YES YES
Business & Finance ADP, FTE ADP, FTE YES YES YES
Director's Office ADP ADP YES YES YES
Education ADP ADP YES NO NO
Engineering & Facilities ADP ADP YES NO NO
Health Monitoring/Administration ADP ADP YES NO NO
Human Services FTE FTE YES YES YES
Information Technology DIRECT, ADP ADP YES YES YES
Inmate Programs & Reentry Administration ADP, FTE ADP, FTE YES YES YES
Inspector General ADP, FTE ADP, FTE YES YES YES
Off Ops Divisional Support ADP ADP YES YES NO
Reentry Preparation ADP ADP YES YES NO
Religious Services ADP ADP YES NO NO
Training FTE FTE YES YES YES
FTE = Full Time Equivalent Position
ADP = Average Daily Population
EXPENSES ALLOCATED TO:
ADC FY 2018 Operating Per Capita Cost Report 5

THIS PAGE INTENTIONALLY LEFT BLANK
ADC FY 2018 Operating Per Capita Cost Report 6
Section II Fiscal Year 2018 Per Capita Cost Summary 7
- Expenditure Summary……………………………………………………………………………………………………………………………………………………………………..8
- State Prison Expenditures by Prison Unit…………………………………………………………………………………………………………………………………….10
- State Prison Minimum Custody Unit Expenditures…………………………………………………………………………………………………………………………..12
- State Prison Medium Custody Unit Expenditures……………………………………………………………………………………………………………………………13
- State Prison Close Custody Unit Expenditures………………………………………………………………………………………………………………………………14
- State Prison Maximum Custody Unit Expenditures………………………………………………………………………………………………………………………….15
Section II
Provides the FY 2018 overall annual operating costs and per diem costs for state prisons, private prisons and community corrections.
ADC FY 2018 Operating Per Capita Cost Report 7

ARIZONA DEPARTMENT OF CORRECTIONSEXPENDITURE SUMMARY
ANNUAL PER CAPITA COST
OPERATIONS CUSTODY ADP UNIT DIRECT
COMPLEX
DIRECT TOTAL DIRECT
TOTAL
INDIRECTTOTAL EXPENSE
1
DIRECT INDIRECT TOTAL
DAILY PER
CAPITA
COST
STATE PRISON COMPLEXES
ASPC-Douglas 1,780 38,199,882$ 13,969,940$ 52,169,821$ 3,357,276$ 55,527,097$ 29,302.30$ 1,885.69$ 31,187.99$ 85.45$
ASPC-Eyman 5,384 105,426,974 20,250,589 125,677,563 7,577,684 133,255,247 23,344.09 1,407.52 24,751.61 67.81$
ASPC-Florence 3,883 77,840,676 20,816,426 98,657,103 5,717,014 104,374,116 25,404.83 1,472.17 26,876.99 73.64$
ASPC-Lewis 5,527 105,522,953 27,316,608 132,839,561 8,255,624 141,095,185 24,034.22 1,493.66 25,527.89 69.94$
ASPC-Perryville 4,036 65,162,861 21,984,133 87,146,993 5,837,216 92,984,209 21,590.28 1,446.14 23,036.42 63.11$
ASPC-Safford 1,386 28,490,685 9,821,746 38,312,431 2,361,939 40,674,370 27,652.42 1,704.76 29,357.18 80.43$
ASPC-Tucson 4,982 99,104,023 32,837,136 131,941,159 8,341,430 140,282,589 26,481.45 1,674.18 28,155.63 77.14$
ASPC-Winslow 1,483 31,295,048 11,247,252 42,542,300 2,548,067 45,090,366 28,690.52 1,718.42 30,408.93 83.31$
ASPC-Yuma 4,680 81,975,607 18,377,765 100,353,373 6,801,996 107,155,369 21,445.32 1,453.57 22,898.89 62.74$
Subtotal State Prisons All 33,141 633,018,710 176,621,595 809,640,305 50,798,243 860,438,548 24,430.02 1,532.78 25,962.81 71.131
EXCLUDED PARTIAL YEAR BEDS AND/OR SPECIALIZED UNITS
ASPC-Phoenix 596 20,683,804 8,950,081 29,633,885 1,629,668 31,263,5532
Subtotal Excluded Beds 596 20,683,804 8,950,081 29,633,885 1,629,668 31,263,553
TOTAL STATE PRISONS 33,737 653,702,514 185,571,675 839,274,190 52,427,912 891,702,101
PRIVATE PRISONS
Florence West - DWI Min 490 8,904,492 161,882 9,066,374 207,493 9,273,867 18,521.70 423.89 18,945.59 51.91
Florence West Min 234 3,588,948 77,386 3,666,334 99,190 3,765,524 15,668.09 423.89 16,091.98 44.09
Kingman - Cerbat Min 1,834 27,191,208 585,810 27,777,018 762,318 28,539,336 15,143.12 415.59 15,558.71 42.63
Marana Min 490 8,640,397 304,111 8,944,507 210,300 9,154,807 18,265.28 429.45 18,694.73 51.22
Phoenix West Min 488 7,717,323 158,225 7,875,547 210,698 8,086,246 16,128.50 431.49 16,560.00 45.37
Subtotal Minimum Custody 3,536 56,042,367 1,287,413 57,329,780 1,490,000 58,819,780 16,214.09 421.40 16,635.49 45.58
CACF Med 1,275 25,668,136 406,729 26,074,865 529,370 26,604,235 20,449.27 415.16 20,864.43 57.16
Kingman - Huachuca Med 1,517 22,490,596 484,539 22,975,136 630,534 23,605,670 15,143.12 415.59 15,558.71 42.63
Red Rock Med 1,973 47,433,064 634,875 48,067,939 831,570 48,899,509 24,361.63 421.45 24,783.09 67.90
Subtotal Medium Custody 4,765 95,591,796 1,526,143 97,117,939 1,991,475 99,109,414 20,379.81 417.90 20,797.71 56.98
TOTAL PRIVATE PRISONS 8,301 151,634,163 2,813,556 154,447,719 3,481,474 157,929,193 18,605.47 419.39 19,024.86 52.12
TOTAL STATE & PRIVATE PRISONS 42,038 805,336,677 188,385,231 993,721,909 55,909,386 1,049,631,295 23,638.66 1,329.97 24,968.63 68.41
COMMUNITY SUPERVISION
Community Corrections Min 5,296 15,750,917 70,954 15,821,871 2,594,606 18,416,477 2,987.34 489.89 3,477.23 9.53
Pima Reentry Center (PRC) Min 72 2,769,425 14,916 2,784,340 146,023 2,930,364 38,725.18 2,030.92 40,756.10 111.66
Maricopa Reentry Center (MRC) Min 50 1,732,200 10,455 1,742,655 102,239 1,844,893 34,783.53 2,040.69 36,824.22 100.893
TOTAL COMMUNITY SUPERVISION 5,418 20,252,541 96,324 20,348,866 2,842,868 23,191,734 3,755.58 524.68 4,280.26 11.73
ACCOUNTING ADJUSTMENTS/EXCLUSIONS
Lease Purchase Payments 36,986,700 0 36,986,700 0 36,986,700 4
Building Renewal 5,106,881 0 5,106,881 0 5,106,881County Jails Pending Transport to ADC 386,164 0 386,164 0 386,164
TOTAL ACCOUNTING ADJUSTMENTS 42,479,745$ -$ 42,479,745$ -$ 42,479,745$
GRAND TOTAL ADP & EXPENDITURES 47,456 868,068,964$ 188,481,555$ 1,056,550,520$ 58,752,254$ 1,115,302,774$
see footnotes on following page
ADC FY 2018 Operating Per Capita Cost Report 8
ARIZONA DEPARTMENT OF CORRECTIONSEXPENDITURE SUMMARY
Footnotes for Expenditure Summary
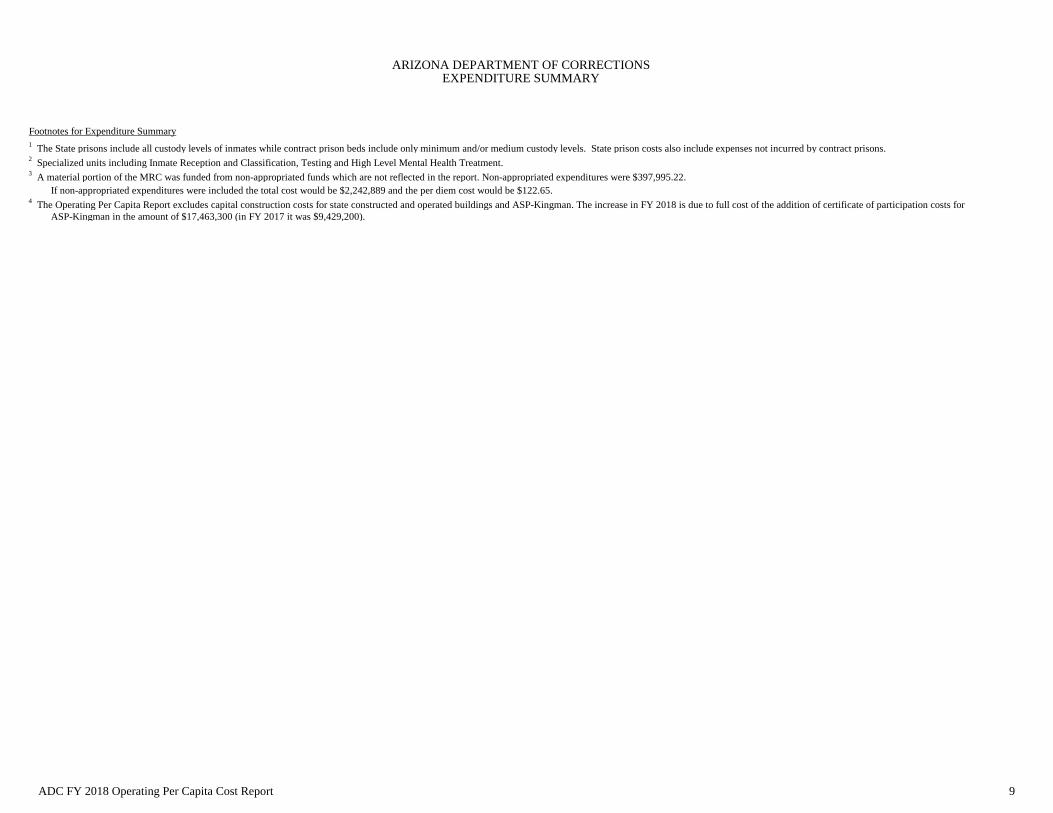
1 The State prisons include all custody levels of inmates while contract prison beds include only minimum and/or medium custody levels. State prison costs also include expenses not incurred by contract prisons.
2 Specialized units including Inmate Reception and Classification, Testing and High Level Mental Health Treatment.
3 A material portion of the MRC was funded from non-appropriated funds which are not reflected in the report. Non-appropriated expenditures were $397,995.22.
If non-appropriated expenditures were included the total cost would be $2,242,889 and the per diem cost would be $122.65.4 The Operating Per Capita Report excludes capital construction costs for state constructed and operated buildings and ASP-Kingman. The increase in FY 2018 is due to full cost of the addition of certificate of participation costs for
ASP-Kingman in the amount of $17,463,300 (in FY 2017 it was $9,429,200).
ADC FY 2018 Operating Per Capita Cost Report 9

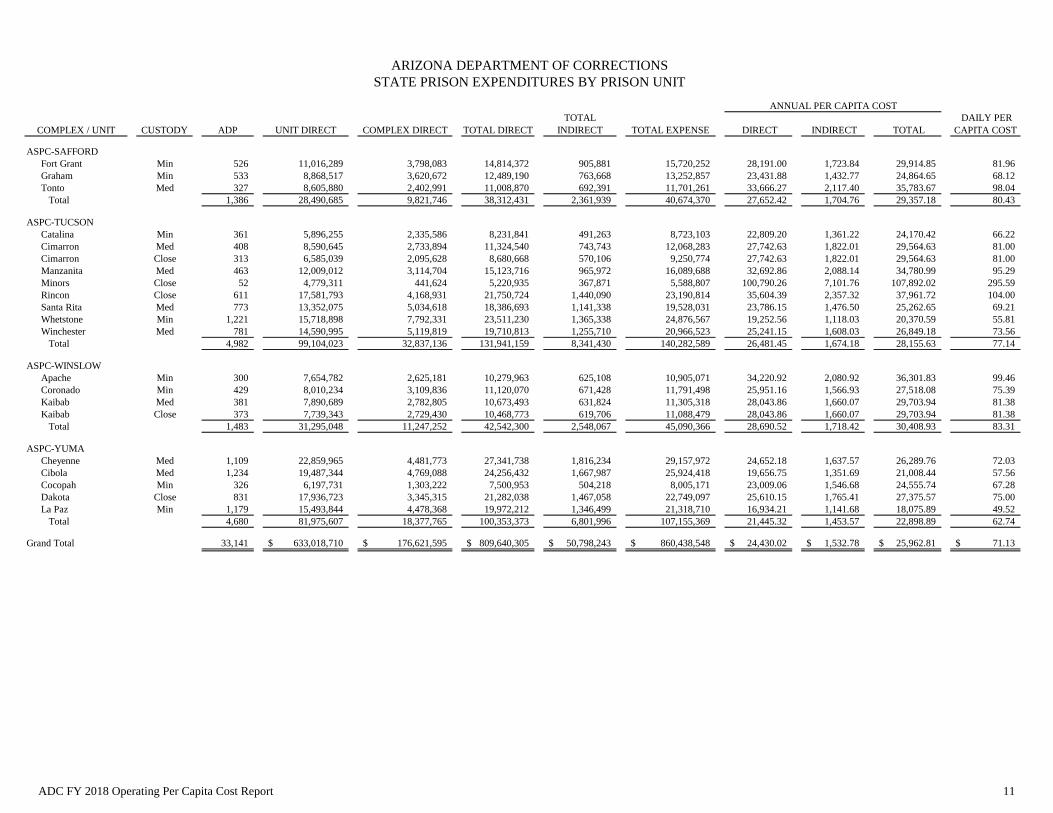
ARIZONA DEPARTMENT OF CORRECTIONS
STATE PRISON EXPENDITURES BY PRISON UNIT
CUSTODY ADP UNIT DIRECT COMPLEX DIRECT TOTAL DIRECT
TOTAL
INDIRECT TOTAL EXPENSE DIRECT INDIRECT TOTAL
DAILY PER
CAPITA COST
ASPC-DOUGLAS
Gila Min 799 14,154,746$ 6,154,158$ 20,308,903$ 1,267,502$ 21,576,406$ 25,424.27 1,586.76 27,011.02 74.00
Mohave Med 982 24,045,136 7,815,782 31,860,918 2,089,773 33,950,691 32,458.15 2,128.95 34,587.09 94.76
Total 1,780 38,199,882 13,969,940 52,169,821 3,357,276 55,527,097 29,302.30 1,885.69 31,187.99 85.45
ASPC-EYMAN
Browning Max 833 21,157,889 3,295,658 24,453,548 1,582,204 26,035,752 29,341.91 1,898.49 31,240.40 85.59
Browning Close 24 611,837 95,303 707,140 45,754 752,894 29,341.91 1,898.49 31,240.40 85.59
Cook Med 1,289 20,724,765 4,663,590 25,388,356 1,454,034 26,842,390 19,702.28 1,128.38 20,830.66 57.07
Meadows Med 1,260 20,340,260 4,606,605 24,946,864 1,468,824 26,415,688 19,792.82 1,165.36 20,958.18 57.42
Meadows Close 77 1,245,849 282,156 1,528,005 89,966 1,617,971 19,792.82 1,165.36 20,958.18 57.42
Rynning Close 800 16,058,924 3,068,965 19,127,889 1,129,855 20,257,744 23,912.85 1,412.49 25,325.35 69.38
SMU I Close 373 8,580,861 1,438,198 10,019,059 613,190 10,632,249 26,839.16 1,642.62 28,481.78 78.03
SMU I Max 727 16,706,589 2,800,113 19,506,702 1,193,856 20,700,559 26,839.16 1,642.62 28,481.78 78.03
Total 5,384 105,426,974 20,250,589 125,677,563 7,577,684 133,255,247 23,344.09 1,407.52 24,751.61 67.81
ASPC-FLORENCE
Central Close 755 21,132,749 4,143,940 25,276,689 1,557,051 26,833,740 33,474.62 2,062.05 35,536.67 97.36
Central Max 245 6,842,745 1,341,800 8,184,546 504,170 8,688,716 33,474.62 2,062.05 35,536.67 97.36
East Med 684 12,313,451 3,811,553 16,125,004 852,573 16,977,577 23,571.12 1,246.27 24,817.39 67.99
Globe Min 231 6,101,338 1,604,126 7,705,463 441,579 8,147,043 33,400.36 1,914.08 35,314.45 96.75
North Min 1,025 16,481,692 5,262,715 21,744,407 1,236,643 22,981,050 21,214.06 1,206.48 22,420.54 61.43
South Med 944 14,968,702 4,652,292 19,620,994 1,124,996 20,745,990 20,784.95 1,191.73 21,976.68 60.21
Total 3,883 77,840,676 20,816,426 98,657,103 5,717,014 104,374,116 25,404.83 1,472.17 26,876.99 73.64
ASPC-LEWIS
Bachman Min 425 7,729,624 2,102,276 9,831,900 639,518 10,471,418 23,161.13 1,506.52 24,667.65 67.58
Bachman Med 267 4,865,384 1,323,270 6,188,654 402,542 6,591,196 23,161.13 1,506.52 24,667.65 67.58
Barchey Med 837 14,400,825 4,105,833 18,506,659 1,164,996 19,671,655 22,105.42 1,391.54 23,496.96 64.38
Buckley Close 748 14,835,124 3,715,518 18,550,643 1,181,588 19,732,230 24,810.28 1,580.30 26,390.57 72.30
Morey Close 830 16,599,677 4,119,371 20,719,048 1,299,833 22,018,882 24,968.73 1,566.44 26,535.17 72.70
Rast Close 519 13,193,423 2,592,636 15,786,060 854,649 16,640,709 30,433.89 1,647.68 32,081.57 87.89
Rast Max 324 8,246,208 1,692,995 9,939,203 744,961 10,684,164 30,657.63 2,297.84 32,955.47 90.29
Stiner Med 1,234 18,911,101 5,968,221 24,879,322 1,478,489 26,357,811 20,158.26 1,197.93 21,356.19 58.51
Sunrise/Eagle Point Min 344 6,741,587 1,696,486 8,438,072 489,047 8,927,119 24,557.84 1,423.30 25,981.14 71.18
Total 5,527 105,522,953 27,316,608 132,839,561 8,255,624 141,095,185 24,034.22 1,493.66 25,527.89 69.94
ASPC-PERRYVILLE
Lumley Med 55 1,374,005 321,592 1,695,597 122,277 1,817,874 30,998.11 2,235.41 33,233.52 91.05
Lumley Close 500 12,554,434 2,938,424 15,492,857 1,117,258 16,610,115 30,998.11 2,235.41 33,233.52 91.05
Piestewa Min 247 4,274,855 1,338,264 5,613,120 371,521 5,984,641 22,771.28 1,507.19 24,278.46 66.52
San Carlos Min 1,262 15,321,901 6,680,822 22,002,723 1,430,109 23,432,832 17,440.33 1,133.57 18,573.90 50.89
San Pedro Min 434 6,682,488 2,345,315 9,027,803 595,948 9,623,751 20,787.02 1,372.20 22,159.22 60.71
Santa Cruz Med 769 11,879,264 4,157,186 16,036,449 1,059,413 17,095,862 20,845.51 1,377.11 22,222.62 60.88
Santa Maria Med 379 7,635,737 2,097,299 9,733,035 642,757 10,375,792 25,707.96 1,697.72 27,405.68 75.08
Santa Rosa Min 392 5,440,178 2,105,231 7,545,408 497,933 8,043,341 19,268.15 1,271.53 20,539.69 56.27
Total 4,036 65,162,861 21,984,133 87,146,993 5,837,216 92,984,209 21,590.28 1,446.14 23,036.42 63.11
COMPLEX / UNIT
ANNUAL PER CAPITA COST
ADC FY 2018 Operating Per Capita Cost Report 10
ARIZONA DEPARTMENT OF CORRECTIONS
STATE PRISON EXPENDITURES BY PRISON UNIT
CUSTODY ADP UNIT DIRECT COMPLEX DIRECT TOTAL DIRECT
TOTAL
INDIRECT TOTAL EXPENSE DIRECT INDIRECT TOTAL
DAILY PER
CAPITA COST COMPLEX / UNIT
ANNUAL PER CAPITA COST
ASPC-SAFFORD
Fort Grant Min 526 11,016,289 3,798,083 14,814,372 905,881 15,720,252 28,191.00 1,723.84 29,914.85 81.96
Graham Min 533 8,868,517 3,620,672 12,489,190 763,668 13,252,857 23,431.88 1,432.77 24,864.65 68.12
Tonto Med 327 8,605,880 2,402,991 11,008,870 692,391 11,701,261 33,666.27 2,117.40 35,783.67 98.04
Total 1,386 28,490,685 9,821,746 38,312,431 2,361,939 40,674,370 27,652.42 1,704.76 29,357.18 80.43
ASPC-TUCSON
Catalina Min 361 5,896,255 2,335,586 8,231,841 491,263 8,723,103 22,809.20 1,361.22 24,170.42 66.22
Cimarron Med 408 8,590,645 2,733,894 11,324,540 743,743 12,068,283 27,742.63 1,822.01 29,564.63 81.00
Cimarron Close 313 6,585,039 2,095,628 8,680,668 570,106 9,250,774 27,742.63 1,822.01 29,564.63 81.00
Manzanita Med 463 12,009,012 3,114,704 15,123,716 965,972 16,089,688 32,692.86 2,088.14 34,780.99 95.29
Minors Close 52 4,779,311 441,624 5,220,935 367,871 5,588,807 100,790.26 7,101.76 107,892.02 295.59
Rincon Close 611 17,581,793 4,168,931 21,750,724 1,440,090 23,190,814 35,604.39 2,357.32 37,961.72 104.00
Santa Rita Med 773 13,352,075 5,034,618 18,386,693 1,141,338 19,528,031 23,786.15 1,476.50 25,262.65 69.21
Whetstone Min 1,221 15,718,898 7,792,331 23,511,230 1,365,338 24,876,567 19,252.56 1,118.03 20,370.59 55.81
Winchester Med 781 14,590,995 5,119,819 19,710,813 1,255,710 20,966,523 25,241.15 1,608.03 26,849.18 73.56
Total 4,982 99,104,023 32,837,136 131,941,159 8,341,430 140,282,589 26,481.45 1,674.18 28,155.63 77.14
ASPC-WINSLOW
Apache Min 300 7,654,782 2,625,181 10,279,963 625,108 10,905,071 34,220.92 2,080.92 36,301.83 99.46
Coronado Min 429 8,010,234 3,109,836 11,120,070 671,428 11,791,498 25,951.16 1,566.93 27,518.08 75.39
Kaibab Med 381 7,890,689 2,782,805 10,673,493 631,824 11,305,318 28,043.86 1,660.07 29,703.94 81.38
Kaibab Close 373 7,739,343 2,729,430 10,468,773 619,706 11,088,479 28,043.86 1,660.07 29,703.94 81.38
Total 1,483 31,295,048 11,247,252 42,542,300 2,548,067 45,090,366 28,690.52 1,718.42 30,408.93 83.31
ASPC-YUMA
Cheyenne Med 1,109 22,859,965 4,481,773 27,341,738 1,816,234 29,157,972 24,652.18 1,637.57 26,289.76 72.03
Cibola Med 1,234 19,487,344 4,769,088 24,256,432 1,667,987 25,924,418 19,656.75 1,351.69 21,008.44 57.56
Cocopah Min 326 6,197,731 1,303,222 7,500,953 504,218 8,005,171 23,009.06 1,546.68 24,555.74 67.28
Dakota Close 831 17,936,723 3,345,315 21,282,038 1,467,058 22,749,097 25,610.15 1,765.41 27,375.57 75.00
La Paz Min 1,179 15,493,844 4,478,368 19,972,212 1,346,499 21,318,710 16,934.21 1,141.68 18,075.89 49.52
Total 4,680 81,975,607 18,377,765 100,353,373 6,801,996 107,155,369 21,445.32 1,453.57 22,898.89 62.74
Grand Total 33,141 633,018,710$ 176,621,595$ 809,640,305$ 50,798,243$ 860,438,548$ 24,430.02$ 1,532.78$ 25,962.81$ 71.13$
ADC FY 2018 Operating Per Capita Cost Report 11
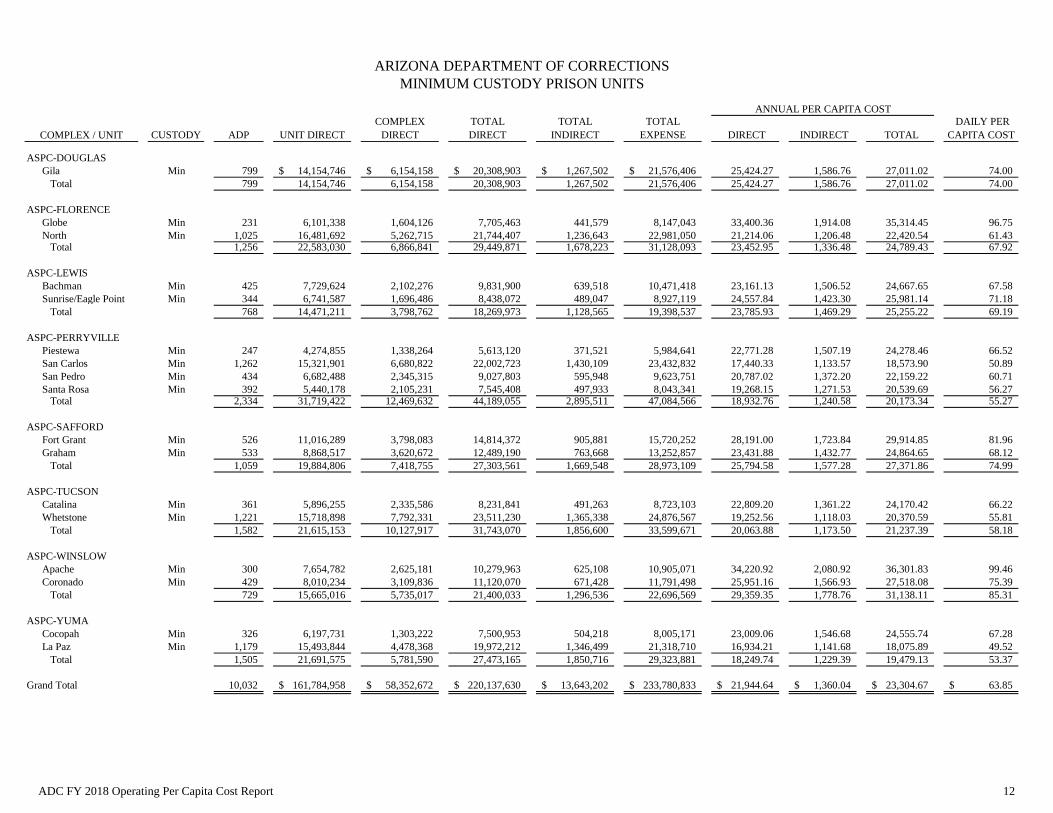
ARIZONA DEPARTMENT OF CORRECTIONS
MINIMUM CUSTODY PRISON UNITS
CUSTODY ADP UNIT DIRECT
COMPLEX
DIRECT
TOTAL
DIRECT
TOTAL
INDIRECT
TOTAL
EXPENSE DIRECT INDIRECT TOTAL
DAILY PER
CAPITA COST
ASPC-DOUGLAS
Gila Min 799 14,154,746$ 6,154,158$ 20,308,903$ 1,267,502$ 21,576,406$ 25,424.27 1,586.76 27,011.02 74.00
Total 799 14,154,746 6,154,158 20,308,903 1,267,502 21,576,406 25,424.27 1,586.76 27,011.02 74.00
ASPC-FLORENCE
Globe Min 231 6,101,338 1,604,126 7,705,463 441,579 8,147,043 33,400.36 1,914.08 35,314.45 96.75
North Min 1,025 16,481,692 5,262,715 21,744,407 1,236,643 22,981,050 21,214.06 1,206.48 22,420.54 61.43 Total 1,256 22,583,030 6,866,841 29,449,871 1,678,223 31,128,093 23,452.95 1,336.48 24,789.43 67.92
ASPC-LEWIS
Bachman Min 425 7,729,624 2,102,276 9,831,900 639,518 10,471,418 23,161.13 1,506.52 24,667.65 67.58
Sunrise/Eagle Point Min 344 6,741,587 1,696,486 8,438,072 489,047 8,927,119 24,557.84 1,423.30 25,981.14 71.18
Total 768 14,471,211 3,798,762 18,269,973 1,128,565 19,398,537 23,785.93 1,469.29 25,255.22 69.19
ASPC-PERRYVILLE
Piestewa Min 247 4,274,855 1,338,264 5,613,120 371,521 5,984,641 22,771.28 1,507.19 24,278.46 66.52
San Carlos Min 1,262 15,321,901 6,680,822 22,002,723 1,430,109 23,432,832 17,440.33 1,133.57 18,573.90 50.89
San Pedro Min 434 6,682,488 2,345,315 9,027,803 595,948 9,623,751 20,787.02 1,372.20 22,159.22 60.71
Santa Rosa Min 392 5,440,178 2,105,231 7,545,408 497,933 8,043,341 19,268.15 1,271.53 20,539.69 56.27 Total 2,334 31,719,422 12,469,632 44,189,055 2,895,511 47,084,566 18,932.76 1,240.58 20,173.34 55.27
ASPC-SAFFORD
Fort Grant Min 526 11,016,289 3,798,083 14,814,372 905,881 15,720,252 28,191.00 1,723.84 29,914.85 81.96
Graham Min 533 8,868,517 3,620,672 12,489,190 763,668 13,252,857 23,431.88 1,432.77 24,864.65 68.12
Total 1,059 19,884,806 7,418,755 27,303,561 1,669,548 28,973,109 25,794.58 1,577.28 27,371.86 74.99
ASPC-TUCSON
Catalina Min 361 5,896,255 2,335,586 8,231,841 491,263 8,723,103 22,809.20 1,361.22 24,170.42 66.22
Whetstone Min 1,221 15,718,898 7,792,331 23,511,230 1,365,338 24,876,567 19,252.56 1,118.03 20,370.59 55.81
Total 1,582 21,615,153 10,127,917 31,743,070 1,856,600 33,599,671 20,063.88 1,173.50 21,237.39 58.18
ASPC-WINSLOW
Apache Min 300 7,654,782 2,625,181 10,279,963 625,108 10,905,071 34,220.92 2,080.92 36,301.83 99.46
Coronado Min 429 8,010,234 3,109,836 11,120,070 671,428 11,791,498 25,951.16 1,566.93 27,518.08 75.39
Total 729 15,665,016 5,735,017 21,400,033 1,296,536 22,696,569 29,359.35 1,778.76 31,138.11 85.31
ASPC-YUMA
Cocopah Min 326 6,197,731 1,303,222 7,500,953 504,218 8,005,171 23,009.06 1,546.68 24,555.74 67.28
La Paz Min 1,179 15,493,844 4,478,368 19,972,212 1,346,499 21,318,710 16,934.21 1,141.68 18,075.89 49.52
Total 1,505 21,691,575 5,781,590 27,473,165 1,850,716 29,323,881 18,249.74 1,229.39 19,479.13 53.37
Grand Total 10,032 161,784,958$ 58,352,672$ 220,137,630$ 13,643,202$ 233,780,833$ 21,944.64$ 1,360.04$ 23,304.67$ 63.85$
COMPLEX / UNIT
ANNUAL PER CAPITA COST
ADC FY 2018 Operating Per Capita Cost Report 12

ARIZONA DEPARTMENT OF CORRECTIONS
MEDIUM CUSTODY PRISON UNITS
CUSTODY ADP UNIT DIRECT
COMPLEX
DIRECT
TOTAL
DIRECT
TOTAL
INDIRECT
TOTAL
EXPENSE DIRECT INDIRECT TOTAL
DAILY PER
CAPITA COST
ASPC-DOUGLAS
Mohave Med 982 24,045,136$ 7,815,782$ 31,860,918$ 2,089,773$ 33,950,691$ 32,458.15$ 2,128.95$ 34,587.09$ 94.76$
Total 982 24,045,136 7,815,782 31,860,918 2,089,773 33,950,691 32,458.15 2,128.95 34,587.09 94.76
ASPC-EYMAN
Cook Med 1,289 20,724,765 4,663,590 25,388,356 1,454,034 26,842,390 19,702.28 1,128.38 20,830.66 57.07
Meadows Med 1,260 20,340,260 4,606,605 24,946,864 1,468,824 26,415,688 19,792.82 1,165.36 20,958.18 57.42
Total 2,549 41,065,025 9,270,195 50,335,220 2,922,859 53,258,079 19,747.05 1,146.67 20,893.71 57.24
ASPC-FLORENCE
East Med 684 12,313,451 3,811,553 16,125,004 852,573 16,977,577 23,571.12 1,246.27 24,817.39 67.99
South Med 944 14,968,702 4,652,292 19,620,994 1,124,996 20,745,990 20,784.95 1,191.73 21,976.68 60.21
Total 1,628 27,282,153 8,463,845 35,745,998 1,977,569 37,723,567 21,955.65 1,214.65 23,170.30 63.48
ASPC-LEWIS
Bachman Med 267 4,865,384 1,323,270 6,188,654 402,542 6,591,196 23,161.13 1,506.52 24,667.65 67.58
Barchey Med 837 14,400,825 4,105,833 18,506,659 1,164,996 19,671,655 22,105.42 1,391.54 23,496.96 64.38
Stiner Med 1,234 18,911,101 5,968,221 24,879,322 1,478,489 26,357,811 20,158.26 1,197.93 21,356.19 58.51
Total 2,339 38,177,310 11,397,325 49,574,635 3,046,028 52,620,663 21,198.42 1,302.50 22,500.92 61.65
ASPC-PERRYVILLE
Lumley Med 55 1,374,005 321,592 1,695,597 122,277 1,817,874 30,998.11 2,235.41 33,233.52 91.05
Santa Cruz Med 769 11,879,264 4,157,186 16,036,449 1,059,413 17,095,862 20,845.51 1,377.11 22,222.62 60.88
Santa Maria Med 379 7,635,737 2,097,299 9,733,035 642,757 10,375,792 25,707.96 1,697.72 27,405.68 75.08
Total 1,203 20,889,005 6,576,077 27,465,081 1,824,447 29,289,528 22,838.09 1,517.09 24,355.17 66.73
ASPC-SAFFORD
Tonto Med 327 8,605,880 2,402,991 11,008,870 692,391 11,701,261 33,666.27 2,117.40 35,783.67 98.04
Total 327 8,605,880 2,402,991 11,008,870 692,391 11,701,261 33,666.27 2,117.40 35,783.67 98.04
ASPC-TUCSON
Cimarron Med 408 8,590,645 2,733,894 11,324,540 743,743 12,068,283 27,742.63 1,822.01 29,564.63 81.00
Manzanita Med 463 12,009,012 3,114,704 15,123,716 965,972 16,089,688 32,692.86 2,088.14 34,780.99 95.29
Santa Rita Med 773 13,352,075 5,034,618 18,386,693 1,141,338 19,528,031 23,786.15 1,476.50 25,262.65 69.21
Winchester Med 781 14,590,995 5,119,819 19,710,813 1,255,710 20,966,523 25,241.15 1,608.03 26,849.18 73.56
Total 2,425 48,542,727 16,003,035 64,545,762 4,106,762 68,652,525 26,620.10 1,693.72 28,313.82 77.57
ASPC-WINSLOW
Kaibab Med 381 7,890,689 2,782,805 10,673,493 631,824 11,305,318 28,043.86 1,660.07 29,703.94 81.38
Total 381 7,890,689 2,782,805 10,673,493 631,824 11,305,318 28,043.86 1,660.07 29,703.94 81.38
ASPC-YUMA
Cheyenne Med 1,109 22,859,965 4,481,773 27,341,738 1,816,234 29,157,972 24,652.18 1,637.57 26,289.76 72.03
Cibola Med 1,234 19,487,344 4,769,088 24,256,432 1,667,987 25,924,418 19,656.75 1,351.69 21,008.44 57.56
Total 2,343 42,347,309 9,250,861 51,598,170 3,484,221 55,082,391 22,021.33 1,487.01 23,508.34 64.41
Grand Total 14,175 258,845,233$ 73,962,915$ 332,808,148$ 20,775,873$ 353,584,021$ 23,478.03$ 1,465.64$ 24,943.67$ 68.34$
COMPLEX / UNIT
ANNUAL PER CAPITA COST
ADC FY 2018 Operating Per Capita Cost Report 13

ARIZONA DEPARTMENT OF CORRECTIONS
CLOSE CUSTODY PRISON UNITS
CUSTODY ADP UNIT DIRECT
COMPLEX
DIRECT TOTAL DIRECT
TOTAL
INDIRECT
TOTAL
EXPENSE DIRECT INDIRECT TOTAL
DAILY PER
CAPITA COST
ASPC-EYMAN
Browning Close 24 611,837$ 95,303$ 707,140$ 45,754$ 752,894$ 29,341.91$ 1,898.49$ 31,240.40$ 85.59$
Meadows Close 77 1,245,849 282,156 1,528,005 89,966 1,617,971 19,792.82 1,165.36 20,958.18 57.42
Rynning Close 800 16,058,924 3,068,965 19,127,889 1,129,855 20,257,744 23,912.85 1,412.49 25,325.35 69.38
SMU I Close 373 8,580,861 1,438,198 10,019,059 613,190 10,632,249 26,839.16 1,642.62 28,481.78 78.03
Total 1,275 26,497,471 4,884,623 31,382,093 1,878,764 33,260,858 24,623.06 1,474.12 26,097.18 71.50
ASPC-FLORENCE
Central Close 755 21,132,749 4,143,940 25,276,689 1,557,051 26,833,740 33,474.62 2,062.05 35,536.67 97.36
Total 755 21,132,749 4,143,940 25,276,689 1,557,051 26,833,740 33,474.62 2,062.05 35,536.67 97.36
ASPC-LEWIS
Buckley Close 748 14,835,124 3,715,518 18,550,643 1,181,588 19,732,230 24,810.28 1,580.30 26,390.57 72.30
Morey Close 830 16,599,677 4,119,371 20,719,048 1,299,833 22,018,882 24,968.73 1,566.44 26,535.17 72.70
Rast Close 519 13,193,423 2,592,636 15,786,060 854,649 16,640,709 30,433.89 1,647.68 32,081.57 87.89
Total 2,096 44,628,225 10,427,526 55,055,751 3,336,070 58,391,821 26,264.55 1,591.48 27,856.04 76.32
ASPC-PERRYVILLE
Lumley Close 500 12,554,434 2,938,424 15,492,857 1,117,258 16,610,115 30,998.11 2,235.41 33,233.52 91.05
Total 500 12,554,434 2,938,424 15,492,857 1,117,258 16,610,115 30,998.11 2,235.41 33,233.52 91.05
ASPC-TUCSON
Cimarron Close 313 6,585,039 2,095,628 8,680,668 570,106 9,250,774 27,742.63 1,822.01 29,564.63 81.00
Minors Close 52 4,779,311 441,624 5,220,935 367,871 5,588,807 100,790.26 7,101.76 107,892.02 295.59
Rincon Close 611 17,581,793 4,168,931 21,750,724 1,440,090 23,190,814 35,604.39 2,357.32 37,961.72 104.00
Total 976 28,946,143 6,706,184 35,652,327 2,378,067 38,030,394 36,544.00 2,437.54 38,981.54 106.80
ASPC-WINSLOW
Kaibab Close 373 7,739,343 2,729,430 10,468,773 619,706 11,088,479 28,043.86 1,660.07 29,703.94 81.38
Total 373 7,739,343 2,729,430 10,468,773 619,706 11,088,479 28,043.86 1,660.07 29,703.94 81.38
ASPC-YUMA
Dakota Close 831 17,936,723 3,345,315 21,282,038 1,467,058 22,749,097 25,610.15 1,765.41 27,375.57 75.00
Total 831 17,936,723 3,345,315 21,282,038 1,467,058 22,749,097 25,610.15 1,765.41 27,375.57 75.00
Grand Total 6,806 159,435,088$ 35,175,441$ 194,610,528 12,353,976$ 206,964,504$ 28,596.07$ 1,815.29$ 30,411.36$ 83.32$
COMPLEX / UNIT
ANNUAL PER CAPITA COST
ADC FY 2018 Operating Per Capita Cost Report 14

ARIZONA DEPARTMENT OF CORRECTIONS
MAXIMUM CUSTODY PRISON UNITS
CUSTODY ADP UNIT DIRECT
COMPLEX
DIRECT TOTAL DIRECT
TOTAL
INDIRECT
TOTAL
EXPENSE DIRECT INDIRECT TOTAL
DAILY PER
CAPITA COST
ASPC-EYMAN
Browning Max 833 21,157,889$ 3,295,658$ 24,453,548$ 1,582,204$ 26,035,752$ 29,341.91$ 1,898.49$ 31,240.40$ 85.59$
SMU I Max 727 16,706,589 2,800,113 19,506,702 1,193,856 20,700,559 26,839.16 1,642.62 28,481.78 78.03
Total 1,560 37,864,479 6,095,772 43,960,250 2,776,061 46,736,311 28,176.04 1,779.30 29,955.33 82.07
ASPC-FLORENCE
Central Max 245 6,842,745 1,341,800 8,184,546 504,170 8,688,716 33,474.62 2,062.05 35,536.67 97.36
Total 245 6,842,745 1,341,800 8,184,546 504,170 8,688,716 33,474.62 2,062.05 35,536.67 97.36
ASPC-LEWIS
Rast Max 324 8,246,208 1,692,995 9,939,203 744,961 10,684,164 30,657.63 2,297.84 32,955.47 90.29
Total 324 8,246,208 1,692,995 9,939,203 744,961 10,684,164 30,657.63 2,297.84 32,955.47 90.29
Grand Total 2,129 52,953,432$ 9,130,567$ 62,083,999$ 4,025,192$ 66,109,191$ 29,162.48$ 1,890.74$ 31,053.22$ 85.08$
COMPLEX / UNIT
ANNUAL PER CAPITA COST
ADC FY 2018 Operating Per Capita Cost Report 15

THIS PAGE INTENTIONALLY LEFT BLANK
ADC FY 2018 Operating Per Capita Cost Report 16
Section III Fiscal Year 2018 Per Capita Cost Detail By Function & Object 17
- Complex Expenditure Detail By Function…………………………………………………………………………………………………………………………………….18
- Complex Expenditure Detail By Object…………………………………………………………………………………………………………………………………….20
- Custody Level Expenditure Detail By Function…………………………………………………………………………………………………………………………………….22
- Custody Level Expenditure Detail By Object…………………………………………………………………………………………………………………………………….24
Section III
Provides more detail of the composition of annual operating and per diem costs.
ADC FY 2018 Operating Per Capita Cost Report 17

ARIZONA DEPARTMENT OF CORRECTIONS
ANNUAL COMPLEX EXPENDITURE DETAIL BY FUNCTION
ASPC-
DOUGLAS
ASPC-
EYMAN
ASPC-
FLORENCE
ASPC-
LEWIS
ASPC-
PERRYVILLE
ASPC-
SAFFORD
ASPC-
TUCSON
ASPC-
WINSLOW
ASPC-
YUMA
STATE
TOTAL
PRIVATE
PRISONS
COMPLEX DIRECT
Central Private Prison Contract Monitoring -$ -$ -$ -$ -$ -$ -$ -$ -$ -$ 1,023,580$
Complex Admin/Central Costs 1,118,334 7,726,170 2,659,246 4,187,137 1,084,578 1,262,101 2,771,071 696,443 2,134,540 23,639,620 -
Complex Business Office/Warehouse 471,143 845,504 924,124 727,775 542,085 774,398 949,681 538,001 765,283 6,537,993 -
Complex Records 241,870 251,423 359,414 324,350 443,989 166,679 512,382 211,920 403,614 2,915,643 -
Complex Security 6,624,607 2,430,391 8,501,198 10,897,174 10,176,045 3,883,091 16,455,450 4,875,148 6,933,910 70,777,013 -
Counseling/Treatment 32,309 97,698 70,472 100,300 73,249 25,143 90,416 26,908 84,919 601,414 -
Discharge 6,478 8,825 7,053 9,715 33,213 10,157 22,094 3,819 14,288 115,641 28,198
Fleet/Motor Pool 518,890 808,665 853,333 875,885 717,480 443,029 1,137,006 398,993 605,696 6,358,976 50,496
Health Monitoring/Administration 103,483 502,251 330,335 517,586 417,944 190,234 601,863 202,125 361,337 3,227,159 138,814
Inspector General 352,338 757,401 318,499 787,258 490,068 262,292 780,601 382,944 560,814 4,692,216 48,504
Intake - - - - 87,545 - 20,154 - - 107,699 -
Maintenance 1,053,660 725,800 547,422 1,163,235 1,886,359 246,888 720,001 815,113 504,323 7,662,800 -
Off Ops Divisional Support 357,731 1,058,394 769,309 1,088,993 796,209 279,858 985,857 298,907 922,092 6,557,351 1,523,963
Service Dog 449,076 430,815 742,014 558,970 454,268 443,574 540,471 529,718 517,866 4,666,774 -
Training 800,716 1,287,150 1,055,937 1,508,525 1,062,669 523,760 1,638,893 534,034 1,216,529 9,628,212 -
Utilities/Fixed Costs 1,579,032 3,005,863 3,389,241 4,214,814 3,334,168 1,125,550 5,126,625 1,429,642 3,050,089 26,255,025 -
Warden's Office 260,273 314,239 288,829 354,890 384,264 184,994 484,571 303,535 302,464 2,878,058 -
Subtotal 13,969,940 20,250,589 20,816,426 27,316,608 21,984,133 9,821,746 32,837,136 11,247,252 18,377,765 176,621,595 2,813,556
UNIT DIRECT
Counseling/Treatment 119,017 35,583 198,498 1,490 112,479 249 186,176 - - 653,492 -
Education 1,110,174 1,913,122 1,866,200 2,279,359 2,046,263 1,076,219 2,258,480 731,267 1,457,274 14,738,358 -
Food Service 2,154,543 6,697,825 4,774,955 6,894,278 3,734,248 1,620,798 5,779,037 1,732,821 5,570,445 38,958,950 -
Health Contract Pmts 7,630,853 23,143,104 16,671,879 23,698,786 17,445,917 5,762,720 21,782,512 6,126,471 19,979,854 142,242,097 -
Maintenance 76,321 709,504 1,100,324 164,160 193 305,724 245,400 270,782 411,176 3,283,585 -
Private Prison Per Diem - - - - - - - - - - 147,558,492
Religious Services 132,883 310,196 292,521 340,228 235,507 174,579 337,136 97,786 239,815 2,160,651
Unit Contract Monitoring - - - - - - - - - - 2,240,237
Unit Management & Support 654,739 2,408,947 1,733,706 2,230,419 1,507,559 943,426 2,372,369 1,106,582 1,861,333 14,819,079 -
Unit Security 25,922,224 68,856,975 50,010,591 68,683,754 39,230,650 18,163,731 65,106,865 20,745,479 51,266,827 407,987,094 -
WIPP 399,128 1,351,718 1,192,002 1,230,479 850,046 443,240 1,036,048 483,859 1,188,884 8,175,404 1,835,434
Subtotal 38,199,882 105,426,974 77,840,676 105,522,953 65,162,861 28,490,685 99,104,023 31,295,048 81,975,607 633,018,710 151,634,163
INDIRECT
Administrative Services 17,450 52,767 38,062 54,173 39,562 13,580 48,834 14,533 45,865 324,828 81,363
Agency Support 1,260,782 2,516,057 1,906,811 2,794,272 1,911,919 851,434 3,014,628 942,304 2,232,353 17,430,560 91,022
Business & Finance 208,420 558,926 413,763 593,146 426,360 156,677 560,920 167,108 495,127 3,580,447 673,621
Director's Office 223,431 675,628 487,347 693,624 506,548 173,873 625,267 186,084 587,254 4,159,057 1,041,760
Education 48,523 146,727 105,838 150,635 110,007 37,760 135,790 40,412 127,534 903,226 -
Engineering & Facilities 113,547 343,353 247,669 352,498 257,427 88,362 317,759 94,568 298,442 2,113,626 -
Health Monitoring/Administration 158,875 480,418 346,537 493,214 360,190 123,636 444,607 132,319 417,578 2,957,374 -
Human Services 629,370 1,212,452 977,196 1,431,999 979,814 436,359 1,544,927 461,467 1,144,029 8,817,613 34,004
Information Technology 388,071 876,809 645,792 899,042 687,190 256,901 853,189 271,988 804,109 5,683,092 1,287,073
Inspector General 128,368 309,618 235,007 339,161 240,185 93,821 334,630 99,780 279,374 2,059,944 138,886
IPR Administration 68,189 136,678 108,918 159,165 109,598 47,688 169,050 50,480 127,876 977,642 27,278
Off Ops Divisional Support 21,804 65,932 47,559 67,689 49,432 16,968 61,018 18,159 57,308 405,869 101,662
Religious Services 4,969 15,025 10,838 15,425 11,265 3,867 13,905 4,138 13,060 92,493 -
Training 64,854 124,938 100,696 147,561 100,966 44,965 159,198 47,552 117,887 908,617 4,807
Reentry Preparation 20,621 62,356 44,979 64,017 46,751 16,047 57,708 17,174 54,200 383,856 -
Subtotal 3,357,276 7,577,684 5,717,014 8,255,624 5,837,216 2,361,939 8,341,430 2,548,067 6,801,996 50,798,243 3,481,474
Grand Total 55,527,097$ 133,255,247$ 104,374,116$ 141,095,185$ 92,984,209$ 40,674,370$ 140,282,589$ 45,090,366$ 107,155,369$ 860,438,548$ 157,929,193$
ADC FY 2018 Operating Per Capita Cost Report 18

ARIZONA DEPARTMENT OF CORRECTIONS
DAILY COMPLEX EXPENDITURE DETAIL BY FUNCTION
ASPC-
DOUGLAS
ASPC-
EYMAN
ASPC-
FLORENCE
ASPC-
LEWIS
ASPC-
PERRYVILLE
ASPC-
SAFFORD
ASPC-
TUCSON
ASPC-
WINSLOW
ASPC-
YUMA
STATE
TOTAL
PRIVATE
PRISONS
ADP 1,780 5,384 3,883 5,527 4,036 1,386 4,982 1,483 4,680 33,141 8,301
COMPLEX DIRECT
Central Private Prison Contract Monitoring -$ -$ -$ -$ -$ -$ -$ -$ -$ -$ 0.34$
Complex Admin/Central Costs 1.72 3.93 1.88 2.08 0.74 2.50 1.52 1.29 1.25 1.95 -
Complex Business Office/Warehouse 0.73 0.43 0.65 0.36 0.37 1.53 0.52 0.99 0.45 0.54 -
Complex Records 0.37 0.13 0.25 0.16 0.30 0.33 0.28 0.39 0.24 0.24 -
Complex Security 10.19 1.24 6.00 5.40 6.91 7.68 9.05 9.01 4.06 5.85 -
Counseling/Treatment 0.05 0.05 0.05 0.05 0.05 0.05 0.05 0.05 0.05 0.05 -
Discharge 0.01 0.00 0.00 0.00 0.02 0.02 0.01 0.01 0.01 0.01 0.01
Fleet/Motor Pool 0.80 0.41 0.60 0.43 0.49 0.88 0.63 0.74 0.35 0.53 0.02
Health Monitoring/Administration 0.16 0.26 0.23 0.26 0.28 0.38 0.33 0.37 0.21 0.27 0.05
Inspector General 0.54 0.39 0.22 0.39 0.33 0.52 0.43 0.71 0.33 0.39 0.02
Intake - - - - 0.06 - 0.01 - - 0.01 -
Maintenance 1.62 0.37 0.39 0.58 1.28 0.49 0.40 1.51 0.30 0.63 -
Off Ops Divisional Support 0.55 0.54 0.54 0.54 0.54 0.55 0.54 0.55 0.54 0.54 0.50
Service Dog 0.69 0.22 0.52 0.28 0.31 0.88 0.30 0.98 0.30 0.39 -
Training 1.23 0.66 0.74 0.75 0.72 1.04 0.90 0.99 0.71 0.80 -
Utilities/Fixed Costs 2.43 1.53 2.39 2.09 2.26 2.23 2.82 2.64 1.79 2.17 -
Warden's Office 0.40 0.16 0.20 0.18 0.26 0.37 0.27 0.56 0.18 0.24 -
Subtotal 21.50 10.31 14.69 13.54 14.92 19.42 18.06 20.78 10.76 14.60 0.93
UNIT DIRECT
Counseling/Treatment 0.18 0.02 0.14 0.00 0.08 0.00 0.10 - - 0.05 -
Education 1.71 0.97 1.32 1.13 1.39 2.13 1.24 1.35 0.85 1.22 -
Food Service 3.32 3.41 3.37 3.42 2.53 3.21 3.18 3.20 3.26 3.22 -
Health Contract Pmts 11.74 11.78 11.76 11.75 11.84 11.40 11.98 11.32 11.70 11.76 -
Maintenance 0.12 0.36 0.78 0.08 0.00 0.60 0.13 0.50 0.24 0.27 -
Private Prison Per Diem - - - - - - - - - - 48.70
Religious Services 0.20 0.16 0.21 0.17 0.16 0.35 0.19 0.18 0.14 0.18 -
Unit Contract Monitoring - - - - - - - - - - 0.74
Unit Management & Support 1.01 1.23 1.22 1.11 1.02 1.87 1.30 2.04 1.09 1.23 -
Unit Security 39.89 35.04 35.28 34.05 26.63 35.92 35.80 38.33 30.02 33.73 -
WIPP 0.61 0.69 0.84 0.61 0.58 0.88 0.57 0.89 0.70 0.68 0.61
Subtotal 58.78 53.65 54.92 52.31 44.23 56.34 54.50 57.82 47.99 52.33 50.05
INDIRECT
Administrative Services 0.03 0.03 0.03 0.03 0.03 0.03 0.03 0.03 0.03 0.03 0.03
Agency Support 1.94 1.28 1.35 1.39 1.30 1.68 1.66 1.74 1.31 1.44 0.03
Business & Finance 0.32 0.28 0.29 0.29 0.29 0.31 0.31 0.31 0.29 0.30 0.22
Director's Office 0.34 0.34 0.34 0.34 0.34 0.34 0.34 0.34 0.34 0.34 0.34
Education 0.07 0.07 0.07 0.07 0.07 0.07 0.07 0.07 0.07 0.07 -
Engineering & Facilities 0.17 0.17 0.17 0.17 0.17 0.17 0.17 0.17 0.17 0.17 -
Health Monitoring/Administration 0.24 0.24 0.24 0.24 0.24 0.24 0.24 0.24 0.24 0.24 -
Human Services 0.97 0.62 0.69 0.71 0.67 0.86 0.85 0.85 0.67 0.73 0.01
Information Technology 0.60 0.45 0.46 0.45 0.47 0.51 0.47 0.50 0.47 0.47 0.42
Inspector General 0.20 0.16 0.17 0.17 0.16 0.19 0.18 0.18 0.16 0.17 0.05
IPR Administration 0.10 0.07 0.08 0.08 0.07 0.09 0.09 0.09 0.07 0.08 0.01
Off Ops Divisional Support 0.03 0.03 0.03 0.03 0.03 0.03 0.03 0.03 0.03 0.03 0.03
Religious Services 0.01 0.01 0.01 0.01 0.01 0.01 0.01 0.01 0.01 0.01 -
Training 0.10 0.06 0.07 0.07 0.07 0.09 0.09 0.09 0.07 0.08 0.00
Reentry Preparation 0.03 0.03 0.03 0.03 0.03 0.03 0.03 0.03 0.03 0.03 -
Subtotal 5.17 3.86 4.03 4.09 3.96 4.67 4.59 4.71 3.98 4.20 1.15
Grand Total 85.45$ 67.81$ 73.64$ 69.94$ 63.11$ 80.43$ 77.14$ 83.31$ 62.74$ 71.13$ 52.12$
ADC FY 2018 Operating Per Capita Cost Report 19

ARIZONA DEPARTMENT OF CORRECTIONS
ANNUAL COMPLEX EXPENDITURE DETAIL BY OBJECT
ASPC-
DOUGLAS
ASPC-
EYMAN
ASPC-
FLORENCE
ASPC-
LEWIS
ASPC-
PERRYVILLE
ASPC-
SAFFORD
ASPC-
TUCSON
ASPC-
WINSLOW
ASPC-
YUMA STATE TOTAL
PRIVATE
PRISONS
PERSONAL SERVICES
6010 - Regular Base Salary 20,428,803$ 38,507,137$ 30,979,171$ 42,477,222$ 31,077,658$ 13,953,089$ 47,576,816$ 14,415,842$ 36,064,103$ 275,479,842$ 3,983,019$
6020 - Personal Services - Other 20,617 283,503 195,358 276,750 278,360 9,466 206,645 36,138 52,143 1,358,981 4,407
6030 - Overtime 783,708 9,471,358 6,482,065 8,254,192 2,068,403 949,299 5,757,274 2,265,590 1,335,916 37,367,804 2,679
6040 - Stipend/Incentive Pay 624,803 4,044,061 2,969,567 3,656,745 921,570 830,869 1,423,043 1,498,570 1,109,626 17,078,854 153,560
6050 - Annual/Sick/Comp Leave 3,061,367 6,656,505 5,386,353 7,260,781 4,889,766 2,158,865 7,164,256 2,499,794 5,349,788 44,427,476 697,303
6060 - Comp/Holiday Payout 178,353 601,437 359,399 626,573 189,896 83,205 681,743 184,611 464,480 3,369,696 15,712
Subtotal 25,097,651 59,564,000 46,371,912 62,552,263 39,425,653 17,984,793 62,809,777 20,900,545 44,376,057 379,082,653 4,856,681
EMPLOYEE RELATED EXPENDITURES
6101 - Employee Related Expenditures - Other 470,234 1,107,717 864,500 1,163,223 730,496 334,784 1,172,767 387,281 827,944 7,058,946 87,247
6111 - FICA Taxes 1,851,064 4,388,503 3,412,916 4,609,286 2,889,250 1,317,340 4,639,615 1,537,532 3,260,924 27,906,431 358,120
6113 - Medical/Dental Insurance 6,829,772 13,996,198 10,997,165 14,964,962 9,686,436 4,781,906 15,679,179 4,986,892 12,431,252 94,353,761 1,050,783
6119 - Workers Compensation 631,596 1,429,784 1,125,782 1,522,386 986,654 451,480 1,554,087 510,324 1,107,550 9,319,643 123,829
6152 - Correction Officers Retirement Plan 4,384,669 9,278,359 7,253,818 10,209,299 6,614,590 3,070,331 10,361,479 3,317,897 7,512,835 62,003,279 410,294
6155 - Arizona State Retirement System 273,242 581,567 518,644 525,124 474,015 241,088 695,870 251,870 478,307 4,039,728 293,339
Subtotal 14,440,577 30,782,128 24,172,825 32,994,280 21,381,441 10,196,929 34,102,997 10,991,797 25,618,813 204,681,787 2,323,611
PROFESSIONAL & OUTSIDE SERVICES
6220 - Legal Services 240,431 572,322 436,323 629,510 444,951 175,138 624,378 186,197 517,658 3,826,907 10,449
6250 - Hospital & Medical Services 7,587,696 22,999,164 16,571,187 23,570,785 17,343,663 5,729,905 21,658,638 6,089,236 19,855,928 141,406,202 139,773
6260 - Institutional Care - - - - - - - - - - 147,558,492
6299 - Professional And Outside Services - Other 250,419 412,992 647,028 471,644 638,231 378,769 966,287 200,488 524,303 4,490,162 153,126
Subtotal 8,078,546 23,984,477 17,654,537 24,671,939 18,426,845 6,283,812 23,249,303 6,475,921 20,897,890 149,723,270 147,861,839
IN-STATE TRAVEL 51,738 29,722 28,638 36,334 25,278 28,958 36,772 33,286 112,461 383,188 14,010
OUT-OF-STATE TRAVEL 4,793 13,674 9,984 14,149 10,356 3,706 13,056 3,960 13,270 86,948 13,773
FOOD 2,180,527 6,747,883 4,815,300 6,953,451 3,774,701 1,638,814 5,842,822 1,751,873 5,617,679 39,323,050 -
AID TO INDIVIDUALS 6,478 8,825 7,053 9,715 33,213 10,157 22,094 3,819 14,288 115,641 28,198
OTHER OPERATING EXPENDITURES
7110 - Insurance & Related Charges 510,870 986,738 794,679 1,164,683 796,996 354,398 1,254,848 374,814 930,526 7,168,553 37,690
7150 - Information Technology 563,093 1,074,402 883,811 1,260,763 879,047 391,118 1,355,746 416,588 1,009,913 7,834,481 65,859
7181 - Electricity 863,116 2,107,381 1,765,455 2,839,566 1,543,058 657,571 2,007,304 498,066 2,093,599 14,375,116 401
7182 - Sanitation Waste Disposal 94,503 497,008 1,205,760 668,643 1,227,084 36,893 2,097,500 450,389 408,998 6,686,778 9
7185 - Water 383,623 8,543 88,733 302,720 508,227 329,844 69,564 217,261 233,851 2,142,368 -
7186 - Gas And Fuel Oil For Buildings 220,623 424,234 367,182 461,512 98,390 126,228 466,453 282,425 352,753 2,799,800 -
7199 - Other Utilities (51) 11,336 3,721 2,849 - 839 3,510 - - 22,205 -
7211 - Building Rent Charges To State Agencies 83,394 364,679 160,424 230,562 164,797 124,682 230,165 97,551 191,493 1,647,748 253,651
7221 - Rental Of Land And Buildings 48,102 92,857 75,447 109,447 74,887 33,351 118,078 35,270 87,437 674,875 3,565
7226 - Rent - Non-Building 71,374 202,540 459,198 251,968 155,567 60,215 265,612 82,190 103,575 1,652,240 25,001
7250 - Repair And Maintenance - Other 329,638 903,688 433,864 794,941 436,439 166,751 612,161 211,547 505,104 4,394,134 241,326
7251 - Repair And Maintenance - Buildings 24,455 69,405 160,164 26,096 20,742 47,647 32,705 46,441 27,873 455,526 474
7300 - Operating Supplies - Other 1,243,577 2,449,397 2,380,987 2,363,908 1,677,703 1,171,519 2,444,713 1,092,866 1,956,135 16,780,808 26,704
7311 - Uniforms 355,214 645,692 519,782 723,224 512,141 208,863 799,703 231,681 616,607 4,612,907 18,230
7500 - Operating Expenditures - Other 156,128 319,679 262,828 346,207 245,504 137,093 479,339 138,107 277,616 2,362,500 43,740
7579 - Payments To State Inmates 399,155 1,351,718 1,192,002 1,230,479 850,286 443,320 1,036,048 483,859 1,188,884 8,175,751 1,835,434
Subtotal 5,346,815 11,509,298 10,754,036 12,777,568 9,190,867 4,290,335 13,273,450 4,659,055 9,984,367 81,785,791 2,552,085
CAPITAL OUTLAY 2,413 7,295 5,262 7,490 86,041 1,877 6,752 2,009 6,341 125,480 -
CAPITAL EQUIPMENT
8401 - Capital Equipment - Other 63,684 194,519 128,687 439,481 119,317 36,037 227,231 91,540 117,722 1,418,217 193,393
8411 - Vehicles Capital Purchase 27,048 37,380 84,451 121,823 149,660 1,923 179,256 2,058 55,649 659,249 -
Subtotal 90,732 231,899 213,138 561,303 268,977 37,960 406,487 93,598 173,371 2,077,466 193,393
NON-CAPITAL EQUIPMENT 125,900 147,811 176,800 282,379 189,722 138,293 307,860 111,640 142,452 1,622,857 60,769
TRANSFERS OUT 100,927 228,233 164,630 234,312 171,117 58,736 211,221 62,861 198,380 1,430,417 24,835
GRAND TOTAL 55,527,097$ 133,255,247$ 104,374,116$ 141,095,185$ 92,984,209$ 40,674,370$ 140,282,589$ 45,090,366$ 107,155,369$ 860,438,548$ 157,929,193$
ADC FY 2018 Operating Per Capita Cost Report 20

ARIZONA DEPARTMENT OF CORRECTIONS
DAILY COMPLEX EXPENDITURE DETAIL BY OBJECT
ASPC-
DOUGLAS
ASPC-
EYMAN
ASPC-
FLORENCE
ASPC-
LEWIS
ASPC-
PERRYVILLE
ASPC-
SAFFORD
ASPC-
TUCSON
ASPC-
WINSLOW
ASPC-
YUMA
STATE
TOTAL
PRIVATE
PRISONS
ADP 1,780 5,384 3,883 5,527 4,036 1,386 4,982 1,483 4,680 33,141 8,301
PERSONAL SERVICES
6010 - Regular Base Salary 31.44$ 19.60$ 21.86$ 21.06$ 21.09$ 27.59$ 26.16$ 26.64$ 21.11$ 22.77$ 1.31$
6020 - Personal Services - Other 0.03 0.14 0.14 0.14 0.19 0.02 0.11 0.07 0.03 0.11 0.00
6030 - Overtime 1.21 4.82 4.57 4.09 1.40 1.88 3.17 4.19 0.78 3.09 0.00
6040 - Stipend/Incentive Pay 0.96 2.06 2.10 1.81 0.63 1.64 0.78 2.77 0.65 1.41 0.05
6050 - Annual/Sick/Comp Leave 4.71 3.39 3.80 3.60 3.32 4.27 3.94 4.62 3.13 3.67 0.23
6060 - Comp/Holiday Payout 0.27 0.31 0.25 0.31 0.13 0.16 0.37 0.34 0.27 0.28 0.01
Subtotal 38.62 30.31 32.72 31.01 26.76 35.56 34.54 38.62 25.98 31.34 1.60
EMPLOYEE RELATED EXPENDITURES
6101 - Employee Related Expenditures - Other 0.72 0.56 0.61 0.58 0.50 0.66 0.64 0.72 0.48 0.58 0.03
6111 - FICA Taxes 2.85 2.23 2.41 2.28 1.96 2.60 2.55 2.84 1.91 2.31 0.12
6113 - Medical/Dental Insurance 10.51 7.12 7.76 7.42 6.57 9.46 8.62 9.21 7.28 7.80 0.35
6119 - Workers Compensation 0.97 0.73 0.79 0.75 0.67 0.89 0.85 0.94 0.65 0.77 0.04
6152 - Correction Officers Retirement Plan 6.75 4.72 5.12 5.06 4.49 6.07 5.70 6.13 4.40 5.13 0.14
6155 - Arizona State Retirement System 0.42 0.30 0.37 0.26 0.32 0.48 0.38 0.47 0.28 0.33 0.10
Subtotal 22.22 15.66 17.05 16.35 14.51 20.16 18.75 20.31 15.00 16.92 0.77
PROFESSIONAL & OUTSIDE SERVICES
6220 - Legal Services 0.37 0.29 0.31 0.31 0.30 0.35 0.34 0.34 0.30 0.32 0.00
6250 - Hospital & Medical Services 11.68 11.70 11.69 11.68 11.77 11.33 11.91 11.25 11.63 11.69 0.05
6260 - Institutional Care - - - - - - - - - - 48.70
6299 - Professional And Outside Services - Other 0.39 0.21 0.46 0.23 0.43 0.75 0.53 0.37 0.31 0.37 0.05
Subtotal 12.43 12.21 12.46 12.23 12.51 12.43 12.78 11.97 12.24 12.38 48.80
IN-STATE TRAVEL 0.08 0.02 0.02 0.02 0.02 0.06 0.02 0.06 0.07 0.03 0.00
OUT-OF-STATE TRAVEL 0.01 0.01 0.01 0.01 0.01 0.01 0.01 0.01 0.01 0.01 0.00
FOOD 3.36 3.43 3.40 3.45 2.56 3.24 3.21 3.24 3.29 3.25 -
AID TO INDIVIDUALS 0.01 0.00 0.00 0.00 0.02 0.02 0.01 0.01 0.01 0.01 0.01
OTHER OPERATING EXPENDITURES
7110 - Insurance & Related Charges 0.79 0.50 0.56 0.58 0.54 0.70 0.69 0.69 0.54 0.59 0.01
7150 - Information Technology 0.87 0.55 0.62 0.62 0.60 0.77 0.75 0.77 0.59 0.65 0.02
7181 - Electricity 1.33 1.07 1.25 1.41 1.05 1.30 1.10 0.92 1.23 1.19 0.00
7182 - Sanitation Waste Disposal 0.15 0.25 0.85 0.33 0.83 0.07 1.15 0.83 0.24 0.55 0.00
7185 - Water 0.59 0.00 0.06 0.15 0.34 0.65 0.04 0.40 0.14 0.18 -
7186 - Gas And Fuel Oil For Buildings 0.34 0.22 0.26 0.23 0.07 0.25 0.26 0.52 0.21 0.23 -
7199 - Other Utilities (0.00) 0.01 0.00 0.00 - 0.00 0.00 - - 0.00 -
7211 - Building Rent Charges To State Agencies 0.13 0.19 0.11 0.11 0.11 0.25 0.13 0.18 0.11 0.14 0.08
7221 - Rental Of Land And Buildings 0.07 0.05 0.05 0.05 0.05 0.07 0.06 0.07 0.05 0.06 0.00
7226 - Rent - Non-Building 0.11 0.10 0.32 0.12 0.11 0.12 0.15 0.15 0.06 0.14 0.01
7250 - Repair And Maintenance - Other 0.51 0.46 0.31 0.39 0.30 0.33 0.34 0.39 0.30 0.36 0.08
7251 - Repair And Maintenance - Buildings 0.04 0.04 0.11 0.01 0.01 0.09 0.02 0.09 0.02 0.04 0.00
7300 - Operating Supplies - Other 1.91 1.25 1.68 1.17 1.14 2.32 1.34 2.02 1.15 1.39 0.01
7311 - Uniforms 0.55 0.33 0.37 0.36 0.35 0.41 0.44 0.43 0.36 0.38 0.01
7500 - Operating Expenditures - Other 0.24 0.16 0.19 0.17 0.17 0.27 0.26 0.26 0.16 0.20 0.01
7579 - Payments To State Inmates 0.61 0.69 0.84 0.61 0.58 0.88 0.57 0.89 0.70 0.68 0.61
Subtotal 8.23 5.86 7.59 6.33 6.24 8.48 7.30 8.61 5.85 6.76 0.84
CAPITAL OUTLAY 0.00 0.00 0.00 0.00 0.06 0.00 0.00 0.00 0.00 0.01 -
CAPITAL EQUIPMENT
8401 - Capital Equipment - Other 0.10 0.10 0.09 0.22 0.08 0.07 0.12 0.17 0.07 0.12 0.06
8411 - Vehicles Capital Purchase 0.04 0.02 0.06 0.06 0.10 0.00 0.10 0.00 0.03 0.05 -
Subtotal 0.14 0.12 0.15 0.28 0.18 0.08 0.22 0.17 0.10 0.17 0.06
NON-CAPITAL EQUIPMENT 0.19 0.08 0.12 0.14 0.13 0.27 0.17 0.21 0.08 0.13 0.02
TRANSFERS OUT 0.16 0.12 0.12 0.12 0.12 0.12 0.12 0.12 0.12 0.12 0.01
GRAND TOTAL 85.45$ 67.81$ 73.64$ 69.94$ 63.11$ 80.43$ 77.14$ 83.31$ 62.74$ 71.13$ 52.12$
ADC FY 2018 Operating Per Capita Cost Report 21

ARIZONA DEPARTMENT OF CORRECTIONS
ANNUAL CUSTODY LEVEL EXPENDITURE DETAIL BY FUNCTION
STATE PRIVATE
MINIMUM MEDIUM CLOSE MAXIMUM TOTAL MINIMUM MEDIUM TOTAL
COMPLEX DIRECT
Central Private Prison Contract Monitoring -$ -$ -$ -$ -$ 435,982$ 587,598$ 1,023,580$
Complex Admin/Central Costs 5,439,195 10,368,626 5,176,292 2,655,508 23,639,620 - - -
Complex Business Office/Warehouse 2,327,861 2,684,215 1,180,084 345,833 6,537,993 - - -
Complex Records 1,050,599 1,217,777 532,750 114,517 2,915,643 - - -
Complex Security 25,938,448 29,657,405 13,302,315 1,878,845 70,777,013 - - -
Counseling/Treatment 182,042 257,239 123,500 38,633 601,414 - - -
Discharge 46,991 45,996 19,083 3,571 115,641 18,821 9,376 28,198
Fleet/Motor Pool 2,140,824 2,584,116 1,262,428 371,608 6,358,976 23,989 26,507 50,496
Health Monitoring/Administration 1,018,894 1,347,470 664,084 196,710 3,227,159 138,814 - 138,814
Inspector General 1,470,765 1,986,390 949,336 285,726 4,692,216 20,660 27,844 48,504
Intake 6,467 18,547 82,685 - 107,699 - - -
Maintenance 2,889,619 3,076,758 1,384,749 311,674 7,662,800 - - -
Off Ops Divisional Support 1,982,094 2,798,369 1,353,477 423,410 6,557,351 649,146 874,817 1,523,963
Service Dog 1,686,615 1,896,711 870,916 212,532 4,666,774 - - -
Training 2,405,806 3,830,071 2,554,066 838,269 9,628,212 - - -
Utilities/Fixed Costs 8,748,134 11,003,162 5,180,067 1,323,662 26,255,025 - - -
Warden's Office 1,018,317 1,190,063 539,610 130,068 2,878,058 - - -
Subtotal 58,352,672 73,962,915 35,175,441 9,130,567 176,621,595 1,287,413 1,526,143 2,813,556
UNIT DIRECT
Counseling/Treatment 242,138 290,489 97,968 22,897 653,492 - - -
Education 4,990,883 6,131,390 2,812,486 803,599 14,738,358 - - -
Food Service 11,335,634 16,804,885 8,172,370 2,646,061 38,958,950 - - -
Health Contract Pmts 42,954,380 60,916,769 29,224,308 9,146,640 142,242,097 - - -
Maintenance 919,260 973,699 955,522 435,105 3,283,585 - - -
Private Prison Per Diem - - - - - 53,978,818 93,579,674 147,558,492
Religious Services 703,314 907,341 421,727 128,269 2,160,651 - - -
Unit Contract Monitoring - - - - - 1,278,908 961,330 2,240,237
Unit Management & Support 4,731,744 5,272,992 3,717,669 1,096,675 14,819,079 - - -
Unit Security 93,140,568 163,519,798 112,762,995 38,563,733 407,987,094 - - -
WIPP 2,767,037 4,027,869 1,270,043 110,454 8,175,404 784,641 1,050,793 1,835,434
Subtotal 161,784,958 258,845,233 159,435,088 52,953,432 633,018,710 56,042,367 95,591,796 151,634,163
INDIRECT
Administrative Services 98,322 138,937 66,703 20,866 324,828 34,656 46,707 81,363
Agency Support 4,233,624 6,904,855 4,708,976 1,583,105 17,430,560 43,241 47,781 91,022
Business & Finance 1,030,346 1,502,113 795,011 252,978 3,580,447 287,158 386,463 673,621
Director's Office 1,258,904 1,778,930 854,057 267,166 4,159,057 443,725 598,034 1,041,760
Education 273,397 386,332 185,476 58,021 903,226 - - -
Engineering & Facilities 639,773 904,049 434,030 135,774 2,113,626 - - -
Health Monitoring/Administration 895,167 1,264,941 607,293 189,974 2,957,374 - - -
Human Services 2,151,592 3,487,401 2,389,621 788,999 8,817,613 16,154 17,850 34,004
Information Technology 1,764,802 2,433,265 1,137,531 347,494 5,683,092 548,214 738,859 1,287,073
Inspector General 564,680 848,777 488,849 157,639 2,059,944 59,417 79,468 138,886
IPR Administration 243,846 389,566 259,027 85,203 977,642 11,849 15,428 27,278
Off Ops Divisional Support 122,852 173,600 83,345 26,072 405,869 43,302 58,360 101,662
Religious Services 27,997 39,561 18,993 5,941 92,493 - - -
Training 221,712 359,362 246,240 81,303 908,617 2,283 2,523 4,807
Reentry Preparation 116,189 164,185 78,824 24,658 383,856 - - -
Subtotal 13,643,202 20,775,873 12,353,976 4,025,192 50,798,243 1,490,000 1,991,475 3,481,474
Grand Total 233,780,833$ 353,584,021$ 206,964,504$ 66,109,191$ 860,438,548$ 58,819,780$ 99,109,414$ 157,929,193$
ADC FY 2018 Operating Per Capita Cost Report 22
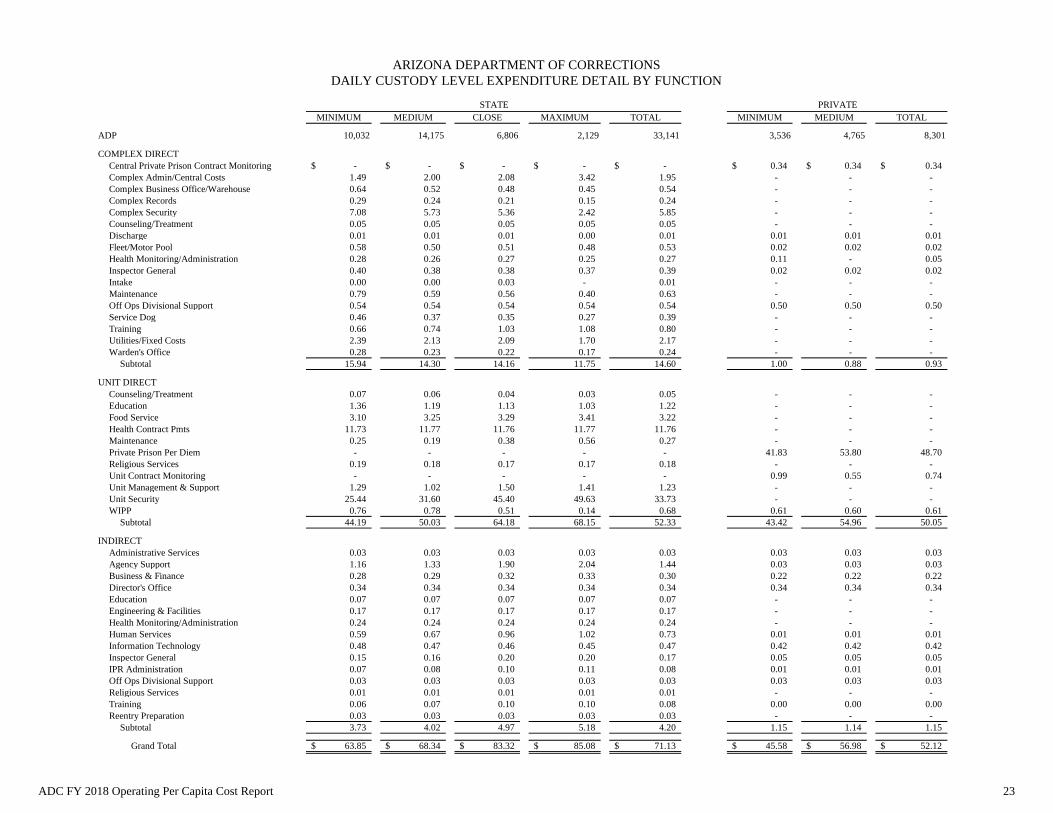
ARIZONA DEPARTMENT OF CORRECTIONS
DAILY CUSTODY LEVEL EXPENDITURE DETAIL BY FUNCTION
STATE PRIVATE
MINIMUM MEDIUM CLOSE MAXIMUM TOTAL MINIMUM MEDIUM TOTAL
ADP 10,032 14,175 6,806 2,129 33,141 3,536 4,765 8,301
COMPLEX DIRECT
Central Private Prison Contract Monitoring -$ -$ -$ -$ -$ 0.34$ 0.34$ 0.34$
Complex Admin/Central Costs 1.49 2.00 2.08 3.42 1.95 - - -
Complex Business Office/Warehouse 0.64 0.52 0.48 0.45 0.54 - - -
Complex Records 0.29 0.24 0.21 0.15 0.24 - - -
Complex Security 7.08 5.73 5.36 2.42 5.85 - - -
Counseling/Treatment 0.05 0.05 0.05 0.05 0.05 - - -
Discharge 0.01 0.01 0.01 0.00 0.01 0.01 0.01 0.01
Fleet/Motor Pool 0.58 0.50 0.51 0.48 0.53 0.02 0.02 0.02
Health Monitoring/Administration 0.28 0.26 0.27 0.25 0.27 0.11 - 0.05
Inspector General 0.40 0.38 0.38 0.37 0.39 0.02 0.02 0.02
Intake 0.00 0.00 0.03 - 0.01 - - -
Maintenance 0.79 0.59 0.56 0.40 0.63 - - -
Off Ops Divisional Support 0.54 0.54 0.54 0.54 0.54 0.50 0.50 0.50
Service Dog 0.46 0.37 0.35 0.27 0.39 - - -
Training 0.66 0.74 1.03 1.08 0.80 - - -
Utilities/Fixed Costs 2.39 2.13 2.09 1.70 2.17 - - -
Warden's Office 0.28 0.23 0.22 0.17 0.24 - - -
Subtotal 15.94 14.30 14.16 11.75 14.60 1.00 0.88 0.93
UNIT DIRECT
Counseling/Treatment 0.07 0.06 0.04 0.03 0.05 - - -
Education 1.36 1.19 1.13 1.03 1.22 - - -
Food Service 3.10 3.25 3.29 3.41 3.22 - - -
Health Contract Pmts 11.73 11.77 11.76 11.77 11.76 - - -
Maintenance 0.25 0.19 0.38 0.56 0.27 - - -
Private Prison Per Diem - - - - - 41.83 53.80 48.70
Religious Services 0.19 0.18 0.17 0.17 0.18 - - -
Unit Contract Monitoring - - - - - 0.99 0.55 0.74
Unit Management & Support 1.29 1.02 1.50 1.41 1.23 - - -
Unit Security 25.44 31.60 45.40 49.63 33.73 - - -
WIPP 0.76 0.78 0.51 0.14 0.68 0.61 0.60 0.61
Subtotal 44.19 50.03 64.18 68.15 52.33 43.42 54.96 50.05
INDIRECT
Administrative Services 0.03 0.03 0.03 0.03 0.03 0.03 0.03 0.03
Agency Support 1.16 1.33 1.90 2.04 1.44 0.03 0.03 0.03
Business & Finance 0.28 0.29 0.32 0.33 0.30 0.22 0.22 0.22
Director's Office 0.34 0.34 0.34 0.34 0.34 0.34 0.34 0.34
Education 0.07 0.07 0.07 0.07 0.07 - - -
Engineering & Facilities 0.17 0.17 0.17 0.17 0.17 - - -
Health Monitoring/Administration 0.24 0.24 0.24 0.24 0.24 - - -
Human Services 0.59 0.67 0.96 1.02 0.73 0.01 0.01 0.01
Information Technology 0.48 0.47 0.46 0.45 0.47 0.42 0.42 0.42
Inspector General 0.15 0.16 0.20 0.20 0.17 0.05 0.05 0.05
IPR Administration 0.07 0.08 0.10 0.11 0.08 0.01 0.01 0.01
Off Ops Divisional Support 0.03 0.03 0.03 0.03 0.03 0.03 0.03 0.03
Religious Services 0.01 0.01 0.01 0.01 0.01 - - -
Training 0.06 0.07 0.10 0.10 0.08 0.00 0.00 0.00
Reentry Preparation 0.03 0.03 0.03 0.03 0.03 - - -
Subtotal 3.73 4.02 4.97 5.18 4.20 1.15 1.14 1.15
Grand Total 63.85$ 68.34$ 83.32$ 85.08$ 71.13$ 45.58$ 56.98$ 52.12$
ADC FY 2018 Operating Per Capita Cost Report 23

ARIZONA DEPARTMENT OF CORRECTIONS
ANNUAL CUSTODY LEVEL EXPENDITURE DETAIL BY OBJECT
STATE PRIVATE
MINIMUM MEDIUM CLOSE MAXIMUM TOTAL MINIMUM MEDIUM TOTAL
PERSONAL SERVICES
6010 - Regular Base Salary 73,882,434$ 111,195,538$ 69,175,211$ 21,226,659$ 275,479,842$ 1,870,803$ 2,112,217$ 3,983,019$
6020 - Personal Services - Other 216,747 649,150 342,396 150,689 1,358,981 964 3,443 4,407
6030 - Overtime 6,772,161 16,212,021 10,123,462 4,260,161 37,367,804 1,570 1,110 2,679
6040 - Stipend/Incentive Pay 3,841,940 6,290,293 4,743,184 2,203,437 17,078,854 72,794 80,766 153,560
6050 - Annual/Sick/Comp Leave 11,837,474 17,595,456 11,362,148 3,632,398 44,427,476 320,762 376,541 697,303
6060 - Comp/Holiday Payout 716,148 1,330,704 1,008,661 314,182 3,369,696 10,634 5,078 15,712
Subtotal 97,266,904 153,273,162 96,755,061 31,787,526 379,082,653 2,277,527 2,579,154 4,856,681
EMPLOYEE RELATED EXPENDITURES
6101 - Employee Related Expenditures - Other 1,810,256 2,855,306 1,801,623 591,762 7,058,946 40,969 46,278 87,247
6111 - FICA Taxes 7,142,307 11,287,347 7,132,867 2,343,910 27,906,431 167,878 190,242 358,120
6113 - Medical/Dental Insurance 24,537,667 38,457,779 23,901,497 7,456,818 94,353,761 506,776 544,006 1,050,783
6119 - Workers Compensation 2,415,110 3,769,138 2,368,505 766,889 9,319,643 58,033 65,796 123,829
6152 - Correction Officers Retirement Plan 15,918,218 24,963,120 16,006,498 5,115,442 62,003,279 205,078 205,215 410,294
6155 - Arizona State Retirement System 1,278,020 1,675,860 831,032 254,816 4,039,728 130,570 162,769 293,339
Subtotal 53,101,578 83,008,550 52,042,022 16,529,636 204,681,787 1,109,305 1,214,306 2,323,611
PROFESSIONAL & OUTSIDE SERVICES
6220 - Legal Services 1,042,316 1,573,512 915,425 295,654 3,826,907 4,964 5,485 10,449
6250 - Hospital & Medical Services 42,690,101 60,552,381 29,066,648 9,097,071 141,406,202 139,270 503 139,773
6260 - Institutional Care - - - - - 53,978,818 93,579,674 147,558,492
6299 - Professional And Outside Services - Other 1,606,780 1,859,598 830,205 193,579 4,490,162 65,242 87,884 153,126
Subtotal 45,339,197 63,985,491 30,812,278 9,586,304 149,723,270 54,188,293 93,673,546 147,861,839
IN-STATE TRAVEL 118,436 194,262 57,256 13,235 383,188 6,524 7,486 14,010
OUT-OF-STATE TRAVEL 25,913 37,006 18,333 5,696 86,948 5,871 7,901 13,773
FOOD 11,424,473 16,948,889 8,271,049 2,678,639 39,323,050 - - -
AID TO INDIVIDUALS 46,991 45,996 19,083 3,571 115,641 18,821 9,376 28,198
OTHER OPERATING EXPENDITURES
7110 - Insurance & Related Charges 1,751,725 2,836,606 1,939,893 640,329 7,168,553 17,905 19,785 37,690
7150 - Information Technology 1,981,453 3,122,414 2,058,465 672,150 7,834,481 29,876 35,983 65,859
7181 - Electricity 4,395,834 6,176,581 2,924,256 878,445 14,375,116 191 211 401
7182 - Sanitation Waste Disposal 2,318,665 2,768,819 1,340,648 258,647 6,686,778 4 5 9
7185 - Water 1,032,350 789,850 297,156 23,012 2,142,368 - - -
7186 - Gas And Fuel Oil For Buildings 905,198 1,108,345 598,231 188,026 2,799,800 - - -
7199 - Other Utilities 3,530 9,813 5,175 3,687 22,205 - - -
7211 - Building Rent Charges To State Agencies 472,342 662,713 367,527 145,166 1,647,748 108,164 145,487 253,651
7221 - Rental Of Land And Buildings 164,445 267,390 182,682 60,358 674,875 1,694 1,871 3,565
7226 - Rent - Non-Building 378,642 548,840 553,302 171,456 1,652,240 10,695 14,305 25,001
7250 - Repair And Maintenance - Other 1,209,859 1,881,904 958,917 343,454 4,394,134 103,098 138,228 241,326
7251 - Repair And Maintenance - Buildings 222,072 134,425 71,368 27,661 455,526 204 270 474
7300 - Operating Supplies - Other 5,448,231 6,689,600 3,511,926 1,131,051 16,780,808 10,355 16,349 26,704
7311 - Uniforms 1,155,521 1,873,730 1,214,104 369,552 4,612,907 9,045 9,186 18,230
7500 - Operating Expenditures - Other 651,329 963,348 570,523 177,300 2,362,500 18,712 25,028 43,740
7579 - Payments To State Inmates 2,767,250 4,027,975 1,270,073 110,454 8,175,751 784,641 1,050,793 1,835,434
Subtotal 24,858,447 33,862,353 17,864,245 5,200,747 81,785,791 1,094,585 1,457,501 2,552,085
CAPITAL OUTLAY 60,183 43,214 19,199 2,885 125,480 - - -
CAPITAL EQUIPMENT
8401 - Capital Equipment - Other 342,350 602,920 362,758 110,189 1,418,217 82,381 111,012 193,393
8411 - Vehicles Capital Purchase 220,216 280,233 135,504 23,296 659,249 - - -
Subtotal 562,566 883,154 498,262 133,484 2,077,466 82,381 111,012 193,393
NON-CAPITAL EQUIPMENT 539,458 686,974 319,209 77,217 1,622,857 25,893 34,875 60,769
TRANSFERS OUT 436,687 614,970 288,508 90,251 1,430,417 10,578 14,257 24,835
GRAND TOTAL 233,780,833$ 353,584,021$ 206,964,504$ 66,109,191$ 860,438,548$ 58,819,780$ 99,109,414$ 157,929,193$
ADC FY 2018 Operating Per Capita Cost Report 24
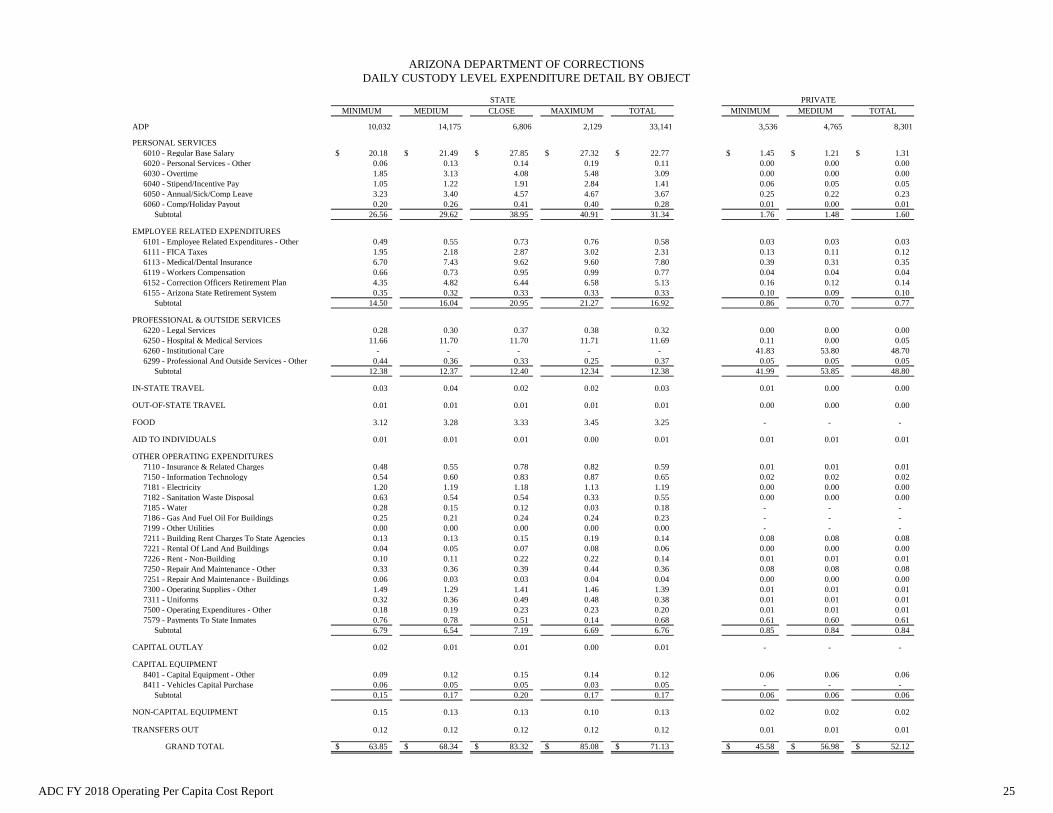
ARIZONA DEPARTMENT OF CORRECTIONS
DAILY CUSTODY LEVEL EXPENDITURE DETAIL BY OBJECT
STATE PRIVATE
MINIMUM MEDIUM CLOSE MAXIMUM TOTAL MINIMUM MEDIUM TOTAL
ADP 10,032 14,175 6,806 2,129 33,141 3,536 4,765 8,301
PERSONAL SERVICES
6010 - Regular Base Salary 20.18$ 21.49$ 27.85$ 27.32$ 22.77$ 1.45$ 1.21$ 1.31$
6020 - Personal Services - Other 0.06 0.13 0.14 0.19 0.11 0.00 0.00 0.00
6030 - Overtime 1.85 3.13 4.08 5.48 3.09 0.00 0.00 0.00
6040 - Stipend/Incentive Pay 1.05 1.22 1.91 2.84 1.41 0.06 0.05 0.05
6050 - Annual/Sick/Comp Leave 3.23 3.40 4.57 4.67 3.67 0.25 0.22 0.23
6060 - Comp/Holiday Payout 0.20 0.26 0.41 0.40 0.28 0.01 0.00 0.01
Subtotal 26.56 29.62 38.95 40.91 31.34 1.76 1.48 1.60
EMPLOYEE RELATED EXPENDITURES
6101 - Employee Related Expenditures - Other 0.49 0.55 0.73 0.76 0.58 0.03 0.03 0.03
6111 - FICA Taxes 1.95 2.18 2.87 3.02 2.31 0.13 0.11 0.12
6113 - Medical/Dental Insurance 6.70 7.43 9.62 9.60 7.80 0.39 0.31 0.35
6119 - Workers Compensation 0.66 0.73 0.95 0.99 0.77 0.04 0.04 0.04
6152 - Correction Officers Retirement Plan 4.35 4.82 6.44 6.58 5.13 0.16 0.12 0.14
6155 - Arizona State Retirement System 0.35 0.32 0.33 0.33 0.33 0.10 0.09 0.10
Subtotal 14.50 16.04 20.95 21.27 16.92 0.86 0.70 0.77
PROFESSIONAL & OUTSIDE SERVICES
6220 - Legal Services 0.28 0.30 0.37 0.38 0.32 0.00 0.00 0.00
6250 - Hospital & Medical Services 11.66 11.70 11.70 11.71 11.69 0.11 0.00 0.05
6260 - Institutional Care - - - - - 41.83 53.80 48.70
6299 - Professional And Outside Services - Other 0.44 0.36 0.33 0.25 0.37 0.05 0.05 0.05
Subtotal 12.38 12.37 12.40 12.34 12.38 41.99 53.85 48.80
IN-STATE TRAVEL 0.03 0.04 0.02 0.02 0.03 0.01 0.00 0.00
OUT-OF-STATE TRAVEL 0.01 0.01 0.01 0.01 0.01 0.00 0.00 0.00
FOOD 3.12 3.28 3.33 3.45 3.25 - - -
AID TO INDIVIDUALS 0.01 0.01 0.01 0.00 0.01 0.01 0.01 0.01
OTHER OPERATING EXPENDITURES
7110 - Insurance & Related Charges 0.48 0.55 0.78 0.82 0.59 0.01 0.01 0.01
7150 - Information Technology 0.54 0.60 0.83 0.87 0.65 0.02 0.02 0.02
7181 - Electricity 1.20 1.19 1.18 1.13 1.19 0.00 0.00 0.00
7182 - Sanitation Waste Disposal 0.63 0.54 0.54 0.33 0.55 0.00 0.00 0.00
7185 - Water 0.28 0.15 0.12 0.03 0.18 - - -
7186 - Gas And Fuel Oil For Buildings 0.25 0.21 0.24 0.24 0.23 - - -
7199 - Other Utilities 0.00 0.00 0.00 0.00 0.00 - - -
7211 - Building Rent Charges To State Agencies 0.13 0.13 0.15 0.19 0.14 0.08 0.08 0.08
7221 - Rental Of Land And Buildings 0.04 0.05 0.07 0.08 0.06 0.00 0.00 0.00
7226 - Rent - Non-Building 0.10 0.11 0.22 0.22 0.14 0.01 0.01 0.01
7250 - Repair And Maintenance - Other 0.33 0.36 0.39 0.44 0.36 0.08 0.08 0.08
7251 - Repair And Maintenance - Buildings 0.06 0.03 0.03 0.04 0.04 0.00 0.00 0.00
7300 - Operating Supplies - Other 1.49 1.29 1.41 1.46 1.39 0.01 0.01 0.01
7311 - Uniforms 0.32 0.36 0.49 0.48 0.38 0.01 0.01 0.01
7500 - Operating Expenditures - Other 0.18 0.19 0.23 0.23 0.20 0.01 0.01 0.01
7579 - Payments To State Inmates 0.76 0.78 0.51 0.14 0.68 0.61 0.60 0.61
Subtotal 6.79 6.54 7.19 6.69 6.76 0.85 0.84 0.84
CAPITAL OUTLAY 0.02 0.01 0.01 0.00 0.01 - - -
CAPITAL EQUIPMENT
8401 - Capital Equipment - Other 0.09 0.12 0.15 0.14 0.12 0.06 0.06 0.06
8411 - Vehicles Capital Purchase 0.06 0.05 0.05 0.03 0.05 - - -
Subtotal 0.15 0.17 0.20 0.17 0.17 0.06 0.06 0.06
NON-CAPITAL EQUIPMENT 0.15 0.13 0.13 0.10 0.13 0.02 0.02 0.02
TRANSFERS OUT 0.12 0.12 0.12 0.12 0.12 0.01 0.01 0.01
GRAND TOTAL 63.85$ 68.34$ 83.32$ 85.08$ 71.13$ 45.58$ 56.98$ 52.12$
ADC FY 2018 Operating Per Capita Cost Report 25

THIS PAGE INTENTIONALLY LEFT BLANK
ADC FY 2018 Operating Per Capita Cost Report 26

Section IV Operational Differences Between State & Private Prison Operations 27
- Inmate Management Functions……………………………………………………………………………………………………………………………………………………………………..28
- State Prison Capabilities for Medical, Mental Health and Dental Services………………………………………………………………………………………………………………………………………………………31
- Contract Medical, Mental Health and Dental Criteria……………………………………………………………………………………………………………………………………………………………………..32
- Other Placement Criteria Exclusions………………………………………………………………………………………………………………………………………………………33
- Complexity of Objective Cost Evaluations………………………………………………………………………………………………………………………………….36
Section IV
Identifies and compares inmate management functions that may be provided by state and/or contract bed providers, as well as medical, mental
health and dental contract exclusions and restrictions. The section also identifies other inmate placement limitations for contract prison bed
providers. The information is provided to clarify the differences in inmate placement for contract beds, as opposed to state prisons, which
cannot exclude inmates sentenced to the Department regardless of custody level, sentenced offense or health status.
ADC FY 2018 Operating Per Capita Cost Report 27
The following page contains a partial list of functions required to run a prison system. Each listed function has a "yes" or "no" to indicate
whether it is provided by the state and/or contract bed providers. The functions that indicate "no" are typically due to statutory or
contractual restrictions or limitations that are identified in this section.
INMATE MANAGEMENT FUNCTIONS
ADC FY 2018 Operating Per Capita Cost Report 28

STATE INMATE MANAGEMENT FUNCTIONS NOT PERFORMED BY
CONTRACTORS (Except as Noted) STATE PRISONS CONTRACT PRISONS
- ACJIS and NCIC Operators Yes No 1
- AIMS Staff, Support and Maintenance Yes No
- Central Intake Processing, Testing, Assessment Yes No
- Close and Maximum Custody Inmates Yes No
- Community Supervision and Home Release Programs Yes No
- Constituent Services Yes No
- Coordination with County Attorneys under Arizona's Sexually Violent Persons Statutes Yes No
- Criminal Aliens Processing with ICE Yes No
- Criminal Investigations / Fugitive Services / Security Threat Group (STG) Processing Yes No 1
- Death Row / Executions Yes No 1
- Detention Determinations Yes ADC Reviews 1
- Discharge Payments for Inmates Yes See Note 2
- Discharge Processing - Final Review Yes No 1
- Discipline Determinations and Appeals Yes No 1
- Emergency Escorted Visits Yes ADC Must Approve
- Final Hiring Approval for Religious Services Staff and Final Approval of Volunteers Yes No
- Fugitive Apprehension Yes No
- Inmate Classification, Reclassification, Sentenced Time Computation, Credits Calculation, Release Date and Movement Determinations Yes No 1
- Inmate Inter-Prison Transportation Yes No
- Inmate Work and Programming Requirements Compliance Yes ADC Must Approve
- Interstate Compact Processing Yes No
- Issuance of Warrants or Detainers Yes No 1
- Medical, Mental Health and Dental Care Yes Contractual Restrictions 3
- Minors (Felons under 18 years of age sentenced as adults) Yes No
- Parole Revocation Hearings Yes No 1
- Protective Segregation Determinations Yes No
- Return of Eligible Foreign Born Inmates to Home Country Yes No
- Service Dogs and Handlers Yes No
- Sex Offender Notification and DNA Testing Yes No
- Victim's Services Yes No
- WIPP Yes See Note 4
1
2
3
4
All ADC's private contractors have contractual restrictions for M and MH services based either on an inmates M/MH score, or a medical cost cap, which result in lower costs for the contractors. ADC
must provide services to all inmates regardless of their condition(s).
Contractors manage work programs as approved by ADC, however WIPP payments are paid by ADC and are not included in contractors per diem rates.
IS THE FUNCTION PROVIDED BY:
In-state private contractors may release inmates eligible for discharge with final approval by ADC; however, discharge payments are made by ADC and are not included in contractors per diem rates.
Per Arizona statutes, certain functions cannot be delegated. Other functions may be performed by Contractors, but only with ADC approval. (A.R.S. 41-1604, 41-1609.01, 41-1750, 36-3701 and 36-
3702).
ADC FY 2018 Operating Per Capita Cost Report 29
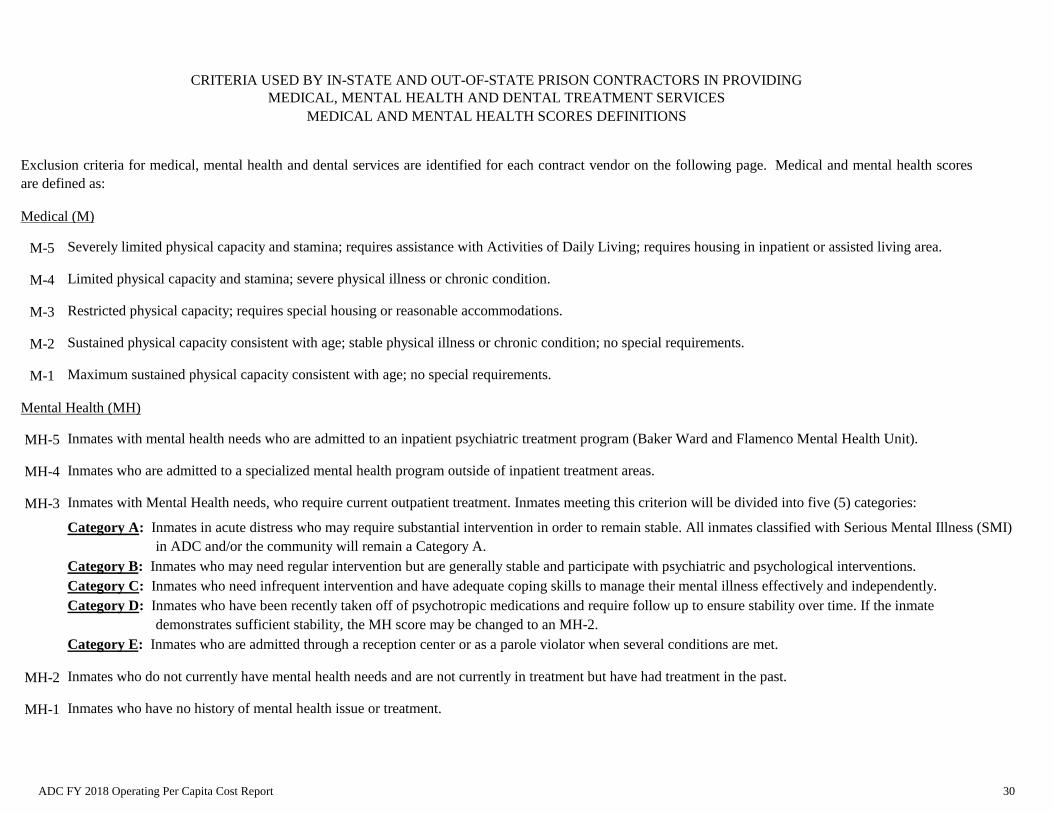
Medical (M)
M-5 Severely limited physical capacity and stamina; requires assistance with Activities of Daily Living; requires housing in inpatient or assisted living area.
M-4 Limited physical capacity and stamina; severe physical illness or chronic condition.
M-3 Restricted physical capacity; requires special housing or reasonable accommodations.
M-2 Sustained physical capacity consistent with age; stable physical illness or chronic condition; no special requirements.
M-1 Maximum sustained physical capacity consistent with age; no special requirements.
Mental Health (MH)
MH-5 Inmates with mental health needs who are admitted to an inpatient psychiatric treatment program (Baker Ward and Flamenco Mental Health Unit).
MH-4 Inmates who are admitted to a specialized mental health program outside of inpatient treatment areas.
MH-3 Inmates with Mental Health needs, who require current outpatient treatment. Inmates meeting this criterion will be divided into five (5) categories:
Category A: Inmates in acute distress who may require substantial intervention in order to remain stable. All inmates classified with Serious Mental Illness (SMI)
in ADC and/or the community will remain a Category A.
Category B: Inmates who may need regular intervention but are generally stable and participate with psychiatric and psychological interventions.
Category C: Inmates who need infrequent intervention and have adequate coping skills to manage their mental illness effectively and independently.
Category D: Inmates who have been recently taken off of psychotropic medications and require follow up to ensure stability over time. If the inmate
demonstrates sufficient stability, the MH score may be changed to an MH-2.
Category E: Inmates who are admitted through a reception center or as a parole violator when several conditions are met.
MH-2 Inmates who do not currently have mental health needs and are not currently in treatment but have had treatment in the past.
MH-1 Inmates who have no history of mental health issue or treatment.
CRITERIA USED BY IN-STATE AND OUT-OF-STATE PRISON CONTRACTORS IN PROVIDING
MEDICAL, MENTAL HEALTH AND DENTAL TREATMENT SERVICES
MEDICAL AND MENTAL HEALTH SCORES DEFINITIONS
Exclusion criteria for medical, mental health and dental services are identified for each contract vendor on the following page. Medical and mental health scores
are defined as:
ADC FY 2018 Operating Per Capita Cost Report 30

STATE PRISON CAPABILITIES FOR
MEDICAL, MENTAL HEALTH AND DENTAL TREATMENT SERVICES
AS OF JUNE 30, 2018
ASPC - ASPC - ASPC - ASPC - ASPC - ASPC - ASPC - ASPC - ASPC - ASPC -
Douglas Eyman Florence Lewis Perryville Phoenix Safford Tucson Winslow Yuma
Custody Level(s) Min/Med Med/Close/Max All All Min/Med/Close All Min/Med Min/Med/Close Min/Med/Close Min/Med/Close
Operating Capacity 1,778 5,586 4,085 5,974 4,250 720 1,613 5,098 1,626 4,770 (1)
Health Services Provider Location On-site On-site On-site On-site On-site On-site On-site On-site On-site On-site
Medical (M) Score (MAX) M - 3 M - 4 M - 5 M - 5 M - 5 M - 4 M - 3 M - 5 M - 3 M - 4
Mental Health (MH) Score (MAX) MH - 2 MH - 4 MH - 4 MH - 3 MH - 4 MH - 5 MH - 2 MH - 4 MH - 2 MH - 3
Nursing Hours 24/7 24/7 24/7 24/7 24/7 24/7 24/7 24/7 24/7 24/7
Medical StaffingPhysician & Mid-
Level Provider
Physician & Mid-
Level Provider
Physician & Mid-
Level Provider
Physician & Mid-
Level Provider
Physician & Mid-
Level Provider
Physician & Mid-
Level Provider
Physician & Mid-
Level Provider
Physician & Mid-
Level Provider
Physician & Mid-
Level Provider
Physician & Mid-
Level Provider
On-site Dental Full Full Full Full Full Full Full Full Full Full
Mental Health StaffingPsychology
Associate
Psychologist &
Psychology
Associate
Psychologist &
Psychology
Associate
Psychologist &
Psychology
Associate
Psychologist &
Psychology
Associate
Psychologist &
Psychology
Associate
Psychology
Associate
Psychologist &
Psychology
Associate
Psychology
Associate
Psychology
Associate
Seriously Mentally Ill (SMI) No Yes Yes Yes Yes Yes No Yes No Yes
Psychiatry No Yes Yes Yes Yes Yes No Yes No Yes
Infirmary Beds (IPC) No No 57 13 10 No No 66 No No
Special Needs Beds No No No No 10 No No 119 No No (2)
Drug Formulary ADC ADC ADC ADC ADC ADC ADC ADC ADC ADC
Hospital Primary Copper Queen /
Bisbee
Banner / Florence
Anthem
Banner / Florence
Anthem
Abrazo / West
Valley
Abrazo / West
ValleyMaricopa MC Mt. Graham RMC
Banner / UMC /
Tucson
Little Colorado
Medical Center /
Winslow
Yuma RMC
Hospital Secondary Sierra Vista MC Chandler RMC Chandler RMCMountain Vista
MC
Mountain Vista
MC
Mountain Vista
MC
Mountain Vista
MC
Banner / UMC /
South Tucson
Mountain Vista
MC
Mountain Vista
MC
Dialysis Chairs / Treatment No Florence Yes No No No No Yes No No (3)
Lab Yes Yes Yes Yes Yes Yes Yes Yes Yes Yes
X-ray On-site 1 day / week On-site On-site On-site On-site On-site On-site On-site On-site On-site
Pharmacy Services Contracted Contracted Contracted Contracted Contracted Contracted Contracted Contracted Contracted Contracted
Insulin Dependent Diabetics Yes Yes Yes Yes Yes Yes Yes Yes Yes Yes
ADA Limited Limited Limited Limited Limited Limited Limited Limited Limited Limited (4)
Medical Cost Cap Not Applicable Not Applicable Not Applicable Not Applicable Not Applicable Not Applicable Not Applicable Not Applicable Not Applicable Not Applicable
Accreditation NCCHC NCCHC NCCHC NCCHC NCCHC NCCHC NCCHC NCCHC NCCHC NCCHC
Unit Dose Medications Yes Yes Yes Yes Yes Yes Yes Yes Yes Yes
Chronic Conditions All All All All All All All All All All
Corridor Facility Status No Yes Yes Yes Yes Yes No Yes No Yes (5)
Notes:
(1) Operating capacity as of June 30, 2018.
(2) The Special Needs Beds are currently comprised of 68 Residential Medical Housing beds and 61 Assisted Living beds.
(3) Dialysis chairs: Florence 4 and Tucson 5.
(4) Not EVERY Unit at each Prison Complex can accommodate ADA inmates.
(5) Corridor Facility Status indicates close proximity to major hospital and medical professional services.
ADC FY 2018 Operating Per Capita Cost Report 31

CONTRACT CRITERIA USED BY IN-STATE PRIVATE PRISON CONTRACTORS IN PROVIDING
MEDICAL, MENTAL HEALTH AND DENTAL TREATMENT SERVICES
AS OF JUNE 30, 2018
CACF Florence West
DUI Florence West
Kingman
Cerbat
Kingman
Huachuca Marana Phoenix West Red Rock
Custody Level(s) Med Min Min Min Med Min Min Med
Operating Capacity 1,280 500 250 2,000 1,508 500 500 2000 (1)
Health Services Provider CCS CCS CCS CCS CCS MTC CCS CoreCivic
Location Florence, AZ Florence, AZ Florence, AZ Kingman, AZ Kingman, AZ Marana, AZ Phoenix, AZ Eloy, AZ
Medical (M) Score (2)
Maximum for the facility
Mental Health (MH) Score MH - 2 (2)
Maximum for the facility (MH-3 w/approval)
Nursing Hours 24/7 24/7 24/7 24/7 24/7 24/7 24/7 24/7
Medical StaffingPhysician & Mid-
Level Provider
Physician & Mid-
Level Provider
Physician & Mid-
Level Provider
Physician & Mid-
Level Provider
Physician & Mid-
Level ProviderPhysician
Physician & Mid-
Level Provider
Physician & Mid-
Level Provider
On-site Dental Full Full Full Full Full Full Full Full
Mental Health Staffing Psychologist Psychologist Psychologist Psychologist Psychologist PsychologistPsychiatrist &
Psychologist
Psychiatrist &
Psychologist
Seriously Mentally Ill (SMI) Stable only Stable only None Stable only Stable only Stable only Stable only Yes
Psychiatry Yes Yes Yes Yes Yes Yes Yes Yes
Medical Observation Beds 3 0 0 6 7 0 0 6
Formulary ADC ADC ADC ADC ADC ADC ADC ADC
Hospital PrimaryMountain Vista
MC
Mountain Vista
MC
Mountain Vista
MC
Kingman Regional
MC
Kingman Regional
MC
Northwest MC /
Casa GrandeGilbert Hospital Banner MC
Hospital SecondaryBanner / Florence
Anthem
Banner / Florence
Anthem
Banner / Florence
Anthem
Western AZ RMC
/ Bullhead City
Western AZ RMC /
Bullhead CityBanner MC
Banner / Florence
Anthem
Banner / Florence
Anthem
Dialysis Chairs / Treatment No No No No No No No No
Lab Contract Contract Contract Contract Contract Contract Contract Contract
X-ray On-site On-site On-site On-site On-site On-site On-site On-site
Pharmacy Services Contract Contract Contract Contract Contract Contract Contract Contract
Insulin Dependent Diabetics Yes Yes No Yes Yes Yes Yes Yes
ADA Limited Limited No Limited No Limited No Limited
Medical Cost Cap No No No No No $10,000 cap $10,000 cap No
Accreditation NCCHC/ACA ACA ACA NCCHC/ACA NCCHC/ACA NCCHC/ACA ACA NCCHC/ACA
Unit Dose Medications Yes Yes Yes Yes Yes Yes Yes Yes
Chronic Conditions All All None All All NO HIV All All
Corridor Facility Status Yes Yes Yes Yes Yes Yes Yes Yes (3)
Notes:
(1) Operating capacity as of June 30, 2018.
(2) When M and MH scores are exceeded, as approved by ADC's Medical or Mental Health Program Manager, inmates are returned to ADC. Inmates with scheduled outside appointments, or with ongoing treatment (e.g. chemotherapy,
radiation, dialysis, etc.) will not be placed in private prisons while treatment is ongoing. Inmates who are positive for HIV or Hepatitis C, to include those in treatment, may be transferred to private prisons except for Florence West RTC.
(3) Corridor Facility Status indicates close proximity to major hospital and medical professional services.
MH - 3 MH - 3 MH - 3
M-4M - 3 M - 4M - 4 M - 4 M - 3 M - 4
MH - 3 MH-3MH - 3 MH - 3
M - 4
ADC FY 2018 Operating Per Capita Cost Report 32

OTHER PLACEMENT CRITERIA EXCLUSIONS
BEYOND MEDICAL, MENTAL HEALTH AND DENTAL CONTRACT EXCLUSIONS
The following two pages identify private contract criteria that affects placement of ADC inmates.
ADC FY 2018 Operating Per Capita Cost Report 33

Central Arizona Correctional Facility (CACF)
- Originally accepted medium custody sex offender inmates who were convicted or arrested for a felony sex offense or other felony where a sex act
occurred - current or prior offense.
- As of May 2009, criteria changed to medium custody sex offenders convicted of a felony sex offense or other felony offense where a sex act
occurred - current offense only.
- No Do Not House With (DNHW)
Florence West DWI and GP
- No inmates with a higher than minimum custody level.
- No DNHW
- Non DWI inmates must have three years or less remaining to serve
Florence West
- No inmates with a higher than minimum custody level.
- Criminal aliens only with two years or less remaining to serve.
- No inmates who have specified chronic medical conditions.
- No DNHW
Kingman
- No offender with a higher than minimum or medium custody level inclusive of overrides.
- No DNHW offenders.
- No offenders in need of SPED.
- and -
Minimum Custody:
- No current or prior convictions for murder or attempted murder (homicide & manslaughter allowed).
- No inmates with a history of escape or attempted escape from a secure perimeter.
- No inmates with more than five years to serve.
Medium Custody - Sex Offenders Only:
- No inmates with life sentences (including sentences of 25 years to life).
- No current or prior convictions for murder or attempted murder including 1st and 2nd degree murder (homicide & manslaughter allowed).
- No inmates with an escape history from a secure perimeter within the last ten years.
- No inmates with more than 20 years to serve.
OTHER PLACEMENT CRITERIA EXCLUSIONS
BEYOND MEDICAL, MENTAL HEALTH AND DENTAL CONTRACT EXCLUSIONS
ADC FY 2018 Operating Per Capita Cost Report 34

Marana
- No inmates higher than minimum custody level.
- No inmates who have a history of, or current convictions for, Felony Class 2 or 3 property offenses with specific exclusions.
- No inmates with a history of Felony convictions for violent offenses involving threat of violence or actual violence.
- No inmates with a history of sex offense arrests or convictions, or child related offenses (other than child abuse convictions for neglect
when such neglect was the direct result of the inmate's substance abuse problem).
- No inmates with more than five years remaining prior to the earliest possible release date.
- No inmates with pending disciplinary actions or history of validated STG involvement.
- No DNHW
Phoenix West DWI and GP
- No inmates higher than minimum custody level.
- No DNHW
Red Rock
- No inmates higher than medium custody.
- No inmates requiring special education services.
- No DNHW
OTHER PLACEMENT CRITERIA EXCLUSIONS
BEYOND MEDICAL, MENTAL HEALTH AND DENTAL CONTRACT EXCLUSIONS
ADC FY 2018 Operating Per Capita Cost Report 35

- Capital Construction & Financing CostThe differing treatment of the capital construction cost by private and state facilities complicates cost comparisons. Per A.R.S. 41-1609.01(I)(J),
private bed contracts are for ten (10) years with two five (5) year renewal options after which the state owns the facility. Use of these contractual
arrangements allows the state to fund the capital construction cost of new facilities over time and avoids the burden of direct financing or up-
front construction costs. As a result, per diem rates for private prisons (except for ASP-Kingman and ASP-Marana) include the cost of the
physical plant and financing while state constructed and operated buildings do not.
- OvercrowdingThe relative level of overcrowding within a particular unit is one factor that can significantly impact an individual unit’s per diem cost or a prison
unit comparison. Temporary beds are beds added to augment permanent beds such as Quonset huts, tents, or double bunking. Temporary beds are
not part of the physical design of a unit and result in overcrowding; impact staff and inmate safety; and create a strain on the physical plant such
as water, sewage, and electric capabilities. However, a prison unit with a higher level of overcrowding results in a lower per diem cost than a
comparison unit as fixed costs are spread over a higher number of inmates.
- Complex Model
The statewide centralized service operation (Central Office) provides services to all ten (10) state prison complexes. In addition, each prison
complex has a centralized complex service operation that provides services to all prison units within the complex such as inmate health services,
inmate programming, business office, procurement, complex maintenance, etc. This structure eliminates duplication of effort, creates economies
of scale, maximizes resources, utilizes best practices, and ensures standardization among all state-run prisons. Similar to the impact of
overcrowding, complexes that accommodate a larger inmate population and utilize a complex model of operations are able to gain efficiencies by
spreading fixed overhead costs over a larger inmate population.
To further illustrate the impact of these factors in the overall per capita cost of a particular unit, consider the following:
COMPLEXITY OF OBJECTIVE COST EVALUATIONS
The state and private per diem costs included in the report should not be used for state and private cost comparisons. Due to the repeal of the
legislative requirement to perform a cost comparison once every five years and the complexity in determining an objective report methodology the cost
comparison section of the report has been omitted. Cost evaluations are inherently complex due to differences in inmate custody level and population
requirements; capital construction & financing cost; overcrowding; service operation model; inmate management functions and programming; inmate
health, medical, mental health, and dental care limitations and/or contract exclusions; and differences in the physical plants.
ADC FY 2018 Operating Per Capita Cost Report 36

- Inmate Management Functions and Programming
A.R.S. §41-1609.01(P) prohibits private prisons from carrying out certain essential functions that must remain with the Department, including calculating
inmate release dates; calculating and awarding sentence credits; approving the type of work inmates may perform and the wages or sentence credits which
may be given to inmates engaging in the work; granting, denying or revoking sentence credits; placing an inmate under less restrictive custody or more
restrictive custody; and taking any disciplinary actions. Since these functions cannot be delegated to private prisons, the Department must provide these
services. Private prisons also operate under the constraints of unique and individualized contracts that delineate the specific responsibilities and requirements
for the private prison including size, bed capacity, custody level, inmate population type, inmate treatment and programming, and inmate health needs.
- Inmate Health Care Limitations and/or Contract Exclusions
Both state and private-run prison units have differences in the types of inmates that can be housed based on inmate medical, mental health and dental needs.
State-run prisons house a higher percentage of inmates with higher medical and mental health needs than private prison units. To achieve cost containment,
ADC places higher need inmates in "corridor" facilities that have locally available off-site treatment and resources as opposed to facilities that do not have
such services locally. All private-run prison units are considered "corridor" facilities although inmate placement is generally restricted to lower medical and
mental health needs than state-run facilities. Two private contracts have a $10,000 cap per inmate on health care services. When the health care cost of a
single inmate exceeds this cap, the inmate is returned to a state-run prison unit and the state assumes all further medical treatment costs associated with the
inmate. Both state and private "corridor" facilities are identified in this section as well as other detailed information in regard to inmate placement criteria.
- Physical Plant Differences
A more efficient facility design and newer infrastructure also directly impacts the required staffing, maintenance needs, utility cost, and other factors.
Therefore, newer, more efficiently designed facilities typically result in lower operating costs.
COMPLEXITY OF OBJECTIVE COST EVALUATIONS (Continued)
These factors introduce complexity and, potentially, subjectivity into the methodology for completing cost comparisons. For this reason and due to the repeal of
A.R.S. 41-1609.01 (L) and (M) the per diem calculations within the report should not be used to make cost comparisons between state and private prisons.
ADC FY 2018 Operating Per Capita Cost Report 37

THIS PAGE INTENTIONALLY LEFT BLANK
ADC FY 2018 Operating Per Capita Cost Report 38

Section V Historical Information 39
- Historical ADP…………………………………………………………………………………………………………………………………………………….41- State Prisons Costs…………………………………………………………………………………………………………………………………………………….42
- Contracted Prison Beds Costs…………………………………………………………………………………………………………………………………………………….43- Adult Parole and Home Arrest…………………………………………………………………………………………………………………………………………………….44
- Community Supervision…………………………………………………………………………………………………………………………………………………….45
- Other Costs (Lease Purchase, One-time Costs, County Jails Pending Intake and Building Renewal)…………………………………………………………………………………………………………………………………………………….46
- Other Historical Information…………………………………………………………………………………………………………………………………….48
- List of Acronyms…………………………………………………………………………………………………………………………………….52
Section V
Historical reports including average daily population (ADP), state, contracted and other per diem rates.
ADC FY 2018 Operating Per Capita Cost Report 39

THIS PAGE INTENTIONALLY LEFT BLANK
ADC FY 2018 Operating Per Capita Cost Report 40

FISCAL YEAR
STATE
PRISONS
IN-STATE
PRIVATE
PRISONS /
RENTED
PUBLIC BEDS
OUT-OF-
STATE
PRIVATE
PRISONS
PARTIAL
YEAR / OR
EXCLUDED
FROM PER
CAPITA COST TOTAL ADP
SENTENCED
TO ADC -
PENDING
TRANSPORT
TO ADC
(COUNTY
JAILS)
COMMUNITY
CORRECTIONS
COMMUNITY
RELEASE
CENTERS/
REENTRY
CENTERS TOTAL 2
1986 8,373 - - - 8,373 not reported 3,623 219 12,215 3
1987 9,459 - - - 9,459 not reported 2,841 220 12,520 3
1988 10,705 - - - 10,705 not reported 2,757 222 13,684 3
1989 11,801 - - - 11,801 not reported 2,850 240 14,891 3
1990 12,887 - - - 12,887 179 3,220 253 16,539
1991 13,912 - - - 13,912 76 3,942 258 18,188
1992 14,970 - - - 14,970 84 4,525 306 19,885
1993 16,293 - - - 16,293 125 5,250 130 21,798
1994 17,737 - - - 17,737 158 5,299 137 23,331
1995 19,542 273 - - 19,815 126 5,307 136 25,384
1996 20,728 511 - - 21,239 235 5,222 141 26,837
1997 21,588 864 - - 22,452 156 4,239 142 26,989
1998 22,593 1,264 - - 23,857 202 3,986 - 28,045
1999 24,029 1,532 - - 25,561 172 3,785 - 29,518
2000 24,614 1,405 - - 26,019 106 3,776 - 29,901
2001 25,261 1,413 - - 26,674 155 3,633 - 30,462
2002 26,624 1,442 - - 28,066 209 3,535 - 31,810
2003 27,699 2,003 - - 29,702 235 4,295 - 34,232
2004 28,329 1,790 1,085 - 31,204 158 5,671 - 37,033
2005 27,913 1,798 2,115 - 31,826 73 6,127 - 38,026
2006 28,379 2,870 2,456 - 33,705 63 6,573 - 40,341
2007 30,265 3,692 1,856 38 35,851 68 6,675 - 42,594
2008 29,310 4,301 2,052 2,247 37,910 72 6,234 - 44,216
2009 30,366 4,339 3,814 1,107 39,626 76 6,761 - 46,463
2010 31,043 4,627 1,771 3,017 40,458 47 6,644 - 47,149
2011 33,568 5,608 - 1,050 40,226 42 6,032 - 46,300
2012 32,957 6,373 - 681 40,011 43 5,843 - 45,897
2013 32,918 6,450 - 680 40,048 62 5,767 18 45,895
2014 33,748 6,666 - 670 41,084 67 5,759 61 46,970
2015 34,341 7,139 - 651 42,131 - 5,689 61 47,881
2016 35,098 6,433 - 1,212 1 42,743 - 5,467 61 48,271
2017 33,871 7,991 - 567 42,428 - 5,402 125 47,955
2018 33,141 8,301 - 596 42,038 - 5,296 122 47,456
1 As a result of building damage from the July 2015 riots at ASP-Kingman, ADC issued emergency bed contracts, pursuant to A.R.S section 41-1609(E)(2). Includes ADP of 610 for these beds.
2 ADP reported on this page is per original and revised Per Capita Costs Reports on file since 1985.
3 Excludes adjudicated juveniles, but includes minors sentenced as adults. Adjudicated juveniles were counted as part of the Arizona Department of Juvenile Corrections (when it became an agency separate from ADC).
ARIZONA DEPARTMENT OF CORRECTIONS
HISTORICAL ADP
ADC FY 2018 Operating Per Capita Cost Report 41

ADP
DIRECT
EXPENSE
INDIRECT
EXPENSE
TOTAL
EXPENSE DIRECT INDIRECT TOTAL
DAILY PER
CAPITA COST
STATE PRISONS
1986 8,373 122,091,519$ 6,066,451$ 128,157,970$ 14,581.57$ 724.53$ 15,306.10$ 41.93$ 1 2
1987 9,508 135,972,811 19,204,104 155,176,915 14,300.88 2,019.78 16,320.67 44.72 1
1988 10,705 145,294,570 22,954,162 168,248,732 13,572.59 2,144.25 15,716.84 42.94 1 3
1989 11,801 166,801,463 24,067,517 190,868,980 14,134.52 2,039.45 16,173.97 44.31 1
1990 12,887 188,142,068 19,893,848 208,035,916 14,599.37 1,543.71 16,143.08 44.23
1991 13,912 209,289,800 19,664,345 228,954,145 15,043.83 1,413.48 16,457.31 45.09
1992 14,970 221,487,100 17,720,739 239,207,839 14,795.40 1,183.75 15,979.15 43.66
1993 16,293 235,494,990 21,489,929 256,984,919 14,453.75 1,318.97 15,772.72 43.21
1994 17,737 258,324,735 25,794,276 284,119,011 14,564.17 1,454.26 16,018.44 43.89
1995 19,542 291,444,157 28,016,281 319,460,438 14,913.73 1,433.64 16,347.38 44.79
1996 20,742 316,905,667 29,422,680 346,328,347 15,278.45 1,418.51 16,696.96 45.62 2
1997 21,588 347,394,714 33,133,327 380,528,041 16,092.03 1,534.80 17,626.83 48.29 2
1998 22,593 381,168,456 33,216,759 414,385,215 16,871.09 1,470.22 18,341.31 50.25
1999 24,029 421,711,766 41,466,368 463,178,134 17,550.12 1,725.68 19,275.80 52.81
2000 24,614 462,635,062 46,850,301 509,485,363 18,795.61 1,903.40 20,699.01 56.55 2
2001 25,261 490,308,321 49,183,003 539,491,324 19,409.70 1,946.99 21,356.69 58.51
2002 26,624 472,484,418 46,824,897 519,309,315 17,746.56 1,758.75 19,505.31 53.44
2003 27,699 501,893,542 40,279,487 542,173,029 18,119.55 1,454.19 19,573.74 53.63
2004 28,329 540,525,120 42,039,039 582,564,159 19,080.28 1,483.96 20,564.23 56.19
2005 27,913 548,301,413 44,711,535 593,012,948 19,643.36 1,601.83 21,245.19 58.21
2006 28,379 592,102,941 47,410,593 639,513,534 20,864.10 1,670.62 22,534.72 61.74
2007 30,265 640,698,320 49,172,654 689,870,974 21,169.58 1,624.73 22,794.31 62.45 2
2008 29,310 672,980,275 29,125,846 702,106,120 22,960.77 993.72 23,954.49 65.45 3
2009 30,366 686,480,762 33,694,069 720,174,831 22,606.89 1,109.60 23,716.49 64.98 3
2010 31,043 655,670,720 32,433,717 688,104,437 21,121.37 1,044.80 22,166.17 60.73 3
2011 33,568 699,422,623 30,415,642 729,838,265 20,835.99 906.09 21,742.08 59.57 3
2012 32,957 778,566,902 14,399,904 792,966,806 23,623.72 436.93 24,060.65 65.74 3
2013 32,918 741,682,103 43,910,583 785,592,685 22,531.41 1,333.95 23,865.36 65.38 3
2014 33,748 755,989,468 49,932,426 805,921,894 22,401.15 1,479.58 23,880.72 65.43 3
2015 34,341 764,701,294 53,485,829 818,187,124 22,268.21 1,557.51 23,825.72 65.28 3
2016 35,098 803,251,025 49,468,142 852,719,167 22,886.08 1,409.44 24,295.52 66.38 3
2017 33,871 796,926,884 50,576,249 847,503,133 23,528.50 1,493.22 25,021.72 68.55 3
2018 33,141 809,640,305 50,798,243 860,438,548 24,430.02 1,532.78 25,962.81 71.13 3
1 Excludes adjudicated juveniles, but includes minors sentenced as adults. Adjudicated juveniles were counted as part of the Department of Juvenile Corrections (when it became an agency separate from ADC).
2 Revised
3 Does not include excluded units as identified in the body of the reports.
FISCAL YEAR
ARIZONA DEPARTMENT OF CORRECTIONS
HISTORICAL PER CAPITA COSTS
STATE PRISONS
ANNUAL PER CAPITA COST
ADC FY 2018 Operating Per Capita Cost Report 42

ADP
DIRECT
EXPENSE
INDIRECT
EXPENSE
TOTAL
EXPENSE DIRECT INDIRECT TOTAL
DAILY PER
CAPITA COST
IN-STATE CONTRACTS
1995 273 4,243,400$ 479,584$ 4,722,984$ 15,543.59$ 1,756.72$ 17,300.31$ 47.40$
1996 511 7,747,700 665,330 8,413,030 15,161.84 1,302.02 16,463.86 44.98
1997 864 12,567,727 596,744 13,164,471 14,545.98 690.68 15,236.66 41.74
1998 1,264 17,959,417 1,329,789 19,289,206 14,208.40 1,052.05 15,260.45 41.81
1999 1,532 22,105,465 1,692,560 23,798,025 14,429.15 1,104.80 15,533.96 42.56
2000 1,405 20,630,196 1,666,670 22,296,866 14,683.41 1,186.24 15,869.66 43.36
2001 1,413 20,965,078 1,758,737 22,723,815 14,837.28 1,244.68 16,081.96 44.06
2002 1,442 20,589,893 1,348,407 21,938,300 14,278.71 935.10 15,213.80 41.68
2003 1,947 28,838,146 1,422,504 30,260,650 14,811.58 730.61 15,542.19 42.58
2004 1,688 27,039,809 1,120,851 28,160,660 16,018.84 664.01 16,682.86 45.58
2005 1,798 31,195,324 2,756,432 33,951,756 17,350.01 1,533.05 18,883.07 51.73 1
2006 2,870 53,510,697 2,298,580 55,809,277 18,646.86 800.99 19,447.84 53.28 1
2007 3,692 67,541,074 4,843,628 72,384,702 18,293.90 1,311.93 19,605.82 53.71 2
2008 4,301 86,668,600 5,038,644 91,707,245 20,150.80 1,171.51 21,322.31 58.26 2
2009 4,339 87,674,439 3,105,054 90,779,493 20,206.14 715.62 20,921.75 57.32 2
2010 4,627 92,905,936 2,516,202 95,422,138 20,079.09 543.81 20,622.90 56.50 2
2011 5,608 115,993,936 1,468,722 117,462,658 20,683.65 261.90 20,945.55 57.39 3
2012 6,373 132,413,045 1,911,493 134,324,538 20,777.19 299.94 21,077.13 57.59 3
2013 6,450 131,795,844 2,010,736 133,806,580 20,434.41 311.76 20,746.17 56.84 3
2014 6,666 136,557,113 2,208,012 138,765,125 20,485.92 331.24 20,817.16 57.03 3
2015 7,139 148,124,197 2,291,944 150,416,140 20,747.43 321.03 21,068.46 57.72 3
2016 6,433 135,375,031 2,166,247 137,541,279 21,044.50 336.75 21,381.25 58.42 3 4
2017 7,991 152,233,998 3,464,381 155,698,379 19,051.16 433.55 19,484.70 53.38 3
2018 8,301 154,447,719 3,481,474 157,929,193 18,605.47 419.39 19,024.86 52.12 3
OUT-OF-STATE CONTRACTS
2004 1,085 14,592,450 720,452 15,312,902 13,449.26 664.01 14,113.27 38.56
2005 2,115 31,428,668 2,161,876 33,590,544 14,859.89 1,022.16 15,882.05 43.51
2006 2,456 41,947,853 1,350,535 43,298,388 17,079.74 549.89 17,629.64 48.30
2007 1,856 32,733,439 1,969,316 34,702,755 17,636.55 1,061.05 18,697.61 51.23
2008 2,052 44,947,107 2,459,503 47,406,610 21,904.05 1,198.59 23,102.64 63.12 2
2009 3,814 82,814,312 2,726,400 85,540,712 21,713.24 714.84 22,428.08 61.45 2
2010 1,771 35,785,988 958,630 36,744,617 20,206.66 541.29 20,747.95 56.84 2
2011 During FY 2011 ADC inmates housed in out-of-state contracted prison beds were returned to Arizona state and/or private prison beds.
2012 N/A
2013 N/A
2014 N/A
2015 N/A
2016 N/A
2017 N/A
2018 N/A
1 Revised
2 Includes Navajo County Jail beds, does not include excluded units as identified in the body of the reports
3 Does not include excluded units as identified in the body of the reports
4 As a result of building damage from the July 2015 riots at ASP-Kingman, ADC issued emergency bed contracts, pursuant to A.R.S section 41-1609(E)(2).
FISCAL YEAR
ARIZONA DEPARTMENT OF CORRECTIONS
HISTORICAL PER CAPITA COSTS
ANNUAL PER CAPITA COST
CONTRACTED PRISON BEDS
ADC FY 2018 Operating Per Capita Cost Report 43

ADP
DIRECT
EXPENSE
INDIRECT
EXPENSE
TOTAL
EXPENSE DIRECT INDIRECT TOTAL
DAILY PER
CAPITA COST
ADULT PAROLE
1986 3,623 3,528,373$ 138,170$ 3,666,543$ 973.88$ 38.14$ 1,012.02$ 2.77$
1987 2,841 3,215,463 810,554 4,026,017 1,131.81 285.31 1,417.11 3.89
1988 2,757 3,536,443 683,977 4,220,420 1,282.71 248.09 1,530.80 4.18
1989 2,826 3,631,000 1,008,307 4,639,307 1,284.85 356.80 1,641.65 4.50
1990 3,162 4,909,284 955,621 5,864,905 1,552.59 302.22 1,854.81 5.08
1991 3,845 3,772,500 888,660 4,661,160 981.14 231.12 1,212.27 3.32
1992 4,230 3,394,800 735,743 4,130,543 802.55 173.93 976.49 2.67
1993 4,975 3,677,740 828,941 4,506,681 739.24 166.62 905.87 2.48
1994 5,009 3,968,400 1,031,833 5,000,233 792.25 206.00 998.25 2.73
1995 5,009 3,954,200 970,240 4,924,440 789.42 193.70 983.12 2.69
1996 4,982 4,484,152 991,255 5,475,407 900.07 198.97 1,099.04 3.00
1997 4,056 5,629,181 1,018,127 6,647,308 1,387.87 251.02 1,638.88 4.49
1998 3,873 6,551,209 1,335,760 7,886,969 1,691.51 344.89 2,036.40 5.58
1999 3,699 6,262,674 1,552,956 7,815,630 1,693.07 419.83 2,112.90 5.79
2000 3,727 6,861,015 2,584,032 9,445,047 1,840.89 693.33 2,534.22 6.92
HOME ARREST
1989 24 517,100 98,092 615,192 21,545.83 4,087.17 25,633.00 70.23
1990 58 198,900 48,867 247,767 3,429.31 842.53 4,271.84 11.70
1991 97 750,900 174,193 925,093 7,741.24 1,795.80 9,537.04 26.13
1992 295 902,200 104,655 1,006,855 3,058.31 354.76 3,413.07 9.33
1993 275 1,289,976 196,686 1,486,662 4,690.82 715.22 5,406.04 14.81
1994 290 1,186,600 188,882 1,375,482 4,091.72 651.32 4,743.04 12.99
1995 298 1,340,900 186,828 1,527,728 4,499.66 626.94 5,126.60 14.05
1996 240 1,330,984 168,897 1,499,881 5,545.77 703.74 6,249.50 17.08
1997 183 1,159,189 142,695 1,301,884 6,334.37 779.75 7,114.12 19.49
1998 113 999,244 89,917 1,089,161 8,842.87 795.73 9,638.59 26.41
1999 86 938,864 163,324 1,102,188 10,917.02 1,899.12 12,816.14 35.11
2000 49 792,842 253,844 1,046,686 16,180.45 5,180.49 21,360.94 58.36
Note: Effective FY 2001, the Adult Parole and Home Arrest ADP and expenses were reported as "Community Supervision" as reported on the following page.
FISCAL YEAR
ARIZONA DEPARTMENT OF CORRECTIONS
HISTORICAL PER CAPITA COSTS
ADULT PAROLE AND HOME ARREST
ANNUAL PER CAPITA COST
ADC FY 2018 Operating Per Capita Cost Report 44

ADP
DIRECT
EXPENSE
INDIRECT
EXPENSE
TOTAL
EXPENSE DIRECT INDIRECT TOTAL
DAILY PER
CAPITA COST
COMMUNITY SUPERVISION
2001 3,633 7,012,172$ 3,127,278$ 10,139,450$ 1,930.13$ 860.80$ 2,790.93$ 7.65$
2002 3,535 6,628,725 2,705,396 9,334,121 1,875.17 765.32 2,640.49 7.23
2003 4,295 8,643,883 2,896,720 11,540,603 2,012.55 674.44 2,686.99 7.36
2004 5,671 8,648,484 3,358,366 12,006,850 1,525.04 592.20 2,117.24 5.78 1
2005 6,127 8,612,829 4,171,417 12,784,246 1,405.72 680.83 2,086.54 5.72
2006 6,573 11,212,043 3,978,628 15,190,671 1,705.77 605.30 2,311.07 6.33
2007 6,675 16,602,721 5,801,297 22,404,018 2,487.30 869.11 3,356.41 9.20 1
2008 6,234 14,029,838 3,295,041 17,324,879 2,250.54 528.56 2,779.10 7.59
2009 6,761 15,559,470 4,158,014 19,717,484 2,301.36 615.00 2,916.36 7.98 1
2010 6,644 14,225,723 3,590,325 17,816,049 2,141.14 540.39 2,681.52 7.35
2011 6,032 15,067,935 1,564,601 16,632,536 2,498.00 259.38 2,757.38 7.55
2012 5,843 14,458,182 1,897,715 16,355,897 2,474.44 324.78 2,799.23 7.65
2013 5,785 14,397,916 2,094,617 16,492,533 2,488.92 362.09 2,851.01 7.81
2014 5,820 15,992,979 2,350,297 18,343,276 2,747.89 403.82 3,151.71 8.63 2
2015 5,750 16,459,028 2,300,719 18,759,746 2,862.69 400.16 3,262.85 8.94 2
2016 5,528 16,616,680 2,338,886 18,955,566 3,005.86 423.09 3,428.95 9.37 2
2017 5,527 18,721,208 2,878,876 21,600,084 3,387.30 520.89 3,908.18 10.71 3
2018 5,418 20,348,866 2,842,868 23,191,734 3,755.58 524.68 4,280.26 11.73 3
1 Revised
2 Pima Reentry Center (PRC), formerly known as Southern Regional Community Corrections Center (SRCCC), costs are included in Community Supervision.
3 PRC and Maricopa Reentry Center (MRC) costs are included in Community Supervision.
FISCAL YEAR
ARIZONA DEPARTMENT OF CORRECTIONS
HISTORICAL PER CAPITA COSTS
COMMUNITY SUPERVISION
ANNUAL PER CAPITA COST
ADC FY 2018 Operating Per Capita Cost Report 45
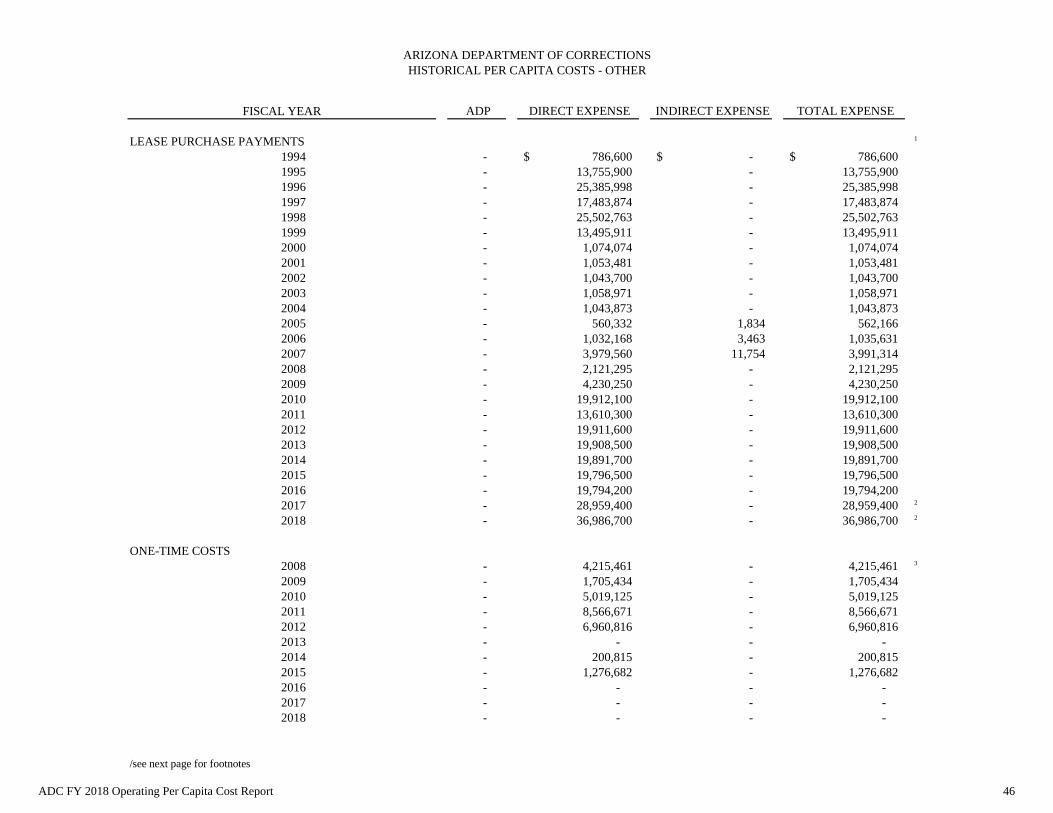
ADP DIRECT EXPENSE INDIRECT EXPENSE TOTAL EXPENSE
LEASE PURCHASE PAYMENTS 1
1994 - 786,600$ -$ 786,600$
1995 - 13,755,900 - 13,755,900
1996 - 25,385,998 - 25,385,998
1997 - 17,483,874 - 17,483,874
1998 - 25,502,763 - 25,502,763
1999 - 13,495,911 - 13,495,911
2000 - 1,074,074 - 1,074,074
2001 - 1,053,481 - 1,053,481
2002 - 1,043,700 - 1,043,700
2003 - 1,058,971 - 1,058,971
2004 - 1,043,873 - 1,043,873
2005 - 560,332 1,834 562,166
2006 - 1,032,168 3,463 1,035,631
2007 - 3,979,560 11,754 3,991,314
2008 - 2,121,295 - 2,121,295
2009 - 4,230,250 - 4,230,250
2010 - 19,912,100 - 19,912,100
2011 - 13,610,300 - 13,610,300
2012 - 19,911,600 - 19,911,600
2013 - 19,908,500 - 19,908,500
2014 - 19,891,700 - 19,891,700
2015 - 19,796,500 - 19,796,500
2016 - 19,794,200 - 19,794,200
2017 - 28,959,400 - 28,959,400 2
2018 - 36,986,700 - 36,986,700 2
ONE-TIME COSTS
2008 - 4,215,461 - 4,215,461 3
2009 - 1,705,434 - 1,705,434
2010 - 5,019,125 - 5,019,125
2011 - 8,566,671 - 8,566,671
2012 - 6,960,816 - 6,960,816
2013 - - - -
2014 - 200,815 - 200,815
2015 - 1,276,682 - 1,276,682
2016 - - - -
2017 - - - -
2018 - - - -
/see next page for footnotes
FISCAL YEAR
ARIZONA DEPARTMENT OF CORRECTIONS
HISTORICAL PER CAPITA COSTS - OTHER
ADC FY 2018 Operating Per Capita Cost Report 46

HISTORICAL PER CAPITA COSTS - OTHER (continued)
ADP DIRECT EXPENSE INDIRECT EXPENSE TOTAL EXPENSE
COUNTY JAILS (PENDING INTAKE TO STATE CUSTODY) 4
2010 47 398,451 - 398,451
2011 42 340,283 - 340,283
2012 43 341,077 - 341,077
2013 62 360,909 - 360,909
2014 67 380,855 - 380,855
2015 67 375,882 - 375,882
2016 - 372,307 - 372,307
2017 - 370,390 - 370,390
2018 - 386,164 - 386,164
BUILDING RENEWAL
2012 - 1,506,772 - 1,506,772
2013 - 2,632,416 - 2,632,416
2014 - 3,545,694 - 3,545,694
2015 - 3,127,754 - 3,127,754
2016 - 3,394,067 - 3,394,067
2017 - 1,878,138 - 1,878,138
2018 - 5,106,881 - 5,106,881
1
2
3 One-Time costs were not appropriately identified prior to FY 2008.4
The Operating Per Capita Report continues to exclude capital construction costs for state constructed and operated buildings.
The ADP for County Jails pending intake is not included in the total ADP for the Department, but is provided for informational purposes only. Prior to the FY 2010 Operating
Per Capita Cost report the expenses for inmates pending intake to the ADC for reception and processing were allocated to the costs of housing all ADC state and contracted
prison vendors based on ADP. Beginning with the FY 2010 Operating Per Capita Cost report these expenses have been excluded to improve the cost comparison analysis
between state housed inmates and contracted prison bed providers.
The increase in FY 2017 is due to the addition of certificate of participation costs for ASP-Kingman in the amount of $9,429,200. In FY 2018, the ASP-Kingman COP
represented $17,463,300 of the total COP.
FISCAL YEAR
ADC FY 2018 Operating Per Capita Cost Report 47

- State Prison Costs by Custody Level
- Contracted Prison Bed Costs by Custody Level
- County Jails (Inmates Pending Transfer to State Custody)
OTHER HISTORICAL INFORMATION
ADC FY 2018 Operating Per Capita Cost Report 48

ADP
TOTAL
DIRECT
TOTAL
INDIRECT
TOTAL
EXPENSE DIRECT INDIRECT TOTAL
UNADJUSTED
DAILY PER
CAPITA COST
ADJUSTED
DAILY PER
CAPITA
COST 2
MINIMUM CUSTODY
2008 9,457 188,577,211$ 9,071,440$ 197,648,652$ 19,940.49$ 959.23$ 20,899.72$ 57.10$ 46.65$
2009 8,896 181,281,346 9,680,398 190,961,744 20,377.85 1,088.17 21,466.02 58.81 46.97
2010 10,002 193,057,614 9,872,571 202,930,185 19,301.90 987.06 20,288.96 55.59 46.59
2011 12,014 225,127,879 10,493,958 235,621,837 18,738.79 873.48 19,612.27 53.73 N/A
2012 11,480 243,791,411 4,958,031 248,749,442 21,236.19 431.88 21,668.07 59.20 N/A
2013 10,915 221,854,062 12,938,768 234,792,830 20,325.99 1,185.43 21,511.42 58.94 N/A
2014 11,227 221,477,051 14,344,731 235,821,782 19,727.88 1,277.74 21,005.63 57.55 N/A
2015 11,435 221,553,852 15,343,914 236,897,766 19,375.06 1,341.84 20,716.90 56.76 N/A
2016 11,545 228,510,068 13,761,846 242,271,914 19,793.33 1,192.04 20,985.37 57.34 N/A
2017 10,696 222,117,848 14,029,691 236,147,539 20,766.25 1,311.66 22,077.91 60.49 N/A
2018 10,032 220,137,630 13,643,202 233,780,833 21,944.64 1,360.04 23,304.67 63.85 N/A
MEDIUM CUSTODY
2008 10,342 226,703,763 10,035,763 236,739,526 21,920.69 970.39 22,891.08 62.54 51.28
2009 11,297 237,582,034 12,300,930 249,882,964 21,030.54 1,088.87 22,119.41 60.60 48.16
2010 12,873 259,310,169 13,085,515 272,395,684 20,143.72 1,016.51 21,160.23 57.97 48.42
2011 14,084 286,243,202 12,510,556 298,753,758 20,324.00 888.28 21,212.28 58.12 N/A
2012 13,593 314,068,193 5,935,502 320,003,695 23,105.14 436.66 23,541.80 64.32 N/A
2013 13,836 307,576,040 18,254,460 325,830,500 22,230.93 1,319.39 23,550.32 64.52 N/A
2014 14,389 319,193,522 21,145,149 340,338,672 22,183.16 1,469.54 23,652.70 64.80 N/A
2015 14,505 318,139,250 22,281,636 340,420,886 21,932.92 1,536.12 23,469.05 64.30 N/A
2016 14,792 330,000,527 20,369,893 350,370,420 22,309.54 1,377.10 23,686.64 64.72 N/A
2017 14,243 321,626,919 20,604,687 342,231,606 22,582.04 1,446.69 24,028.73 65.83 N/A
2018 14,175 332,808,148 20,775,873 353,584,021 23,478.03 1,465.64 24,943.67 68.34 N/A
CLOSE CUSTODY
2008 6,082 164,495,483 6,352,293 170,847,776 27,046.28 1,044.44 28,090.72 76.75 65.02
2009 6,452 169,095,664 7,440,248 176,535,912 26,208.26 1,153.17 27,361.42 74.96 62.14
2010 4,871 119,520,459 5,598,434 125,118,893 24,537.15 1,149.34 25,686.49 70.37 60.59
2011 4,170 105,245,865 4,173,610 109,419,475 25,238.82 1,000.87 26,239.68 71.89 N/A
2012 4,562 125,636,723 2,037,097 127,673,820 27,539.83 446.54 27,986.37 76.47 N/A
2013 4,900 123,148,553 7,509,708 130,658,261 25,131.84 1,532.56 26,664.41 73.05 N/A
2014 4,893 123,393,489 8,476,737 131,870,227 25,218.37 1,732.42 26,950.79 73.84 N/A
2015 5,463 138,473,429 10,052,101 148,525,530 25,347.04 1,840.00 27,187.04 74.49 N/A
2016 5,579 149,416,201 9,669,826 159,086,028 26,782.38 1,733.29 28,515.66 77.91 N/A
2017 5,903 162,844,002 10,619,731 173,463,733 27,588.05 1,799.13 29,387.18 80.51 N/A
2018 6,806 194,610,528 12,353,976 206,964,504 28,596.07 1,815.29 30,411.36 83.32 N/A
MAXIMUM CUSTODY
2008 3,429 93,203,817 3,666,350 96,870,167 27,181.05 1,069.22 28,250.27 77.19 65.87
2009 3,721 98,521,718 4,272,492 102,794,211 26,477.22 1,148.21 27,625.43 75.69 63.22
2010 3,297 83,782,476 3,877,197 87,659,673 25,411.73 1,175.98 26,587.71 72.84 63.93
2011 3,300 82,805,677 3,237,518 86,043,195 25,092.63 981.07 26,073.70 71.43 N/A
2012 3,322 95,070,575 1,469,273 96,539,848 28,618.48 442.29 29,060.76 79.40 N/A
2013 3,267 89,103,447 5,207,647 94,311,094 27,271.28 1,593.87 28,865.15 79.08 N/A
2014 3,239 91,925,405 5,965,808 97,891,213 28,379.05 1,841.75 30,220.80 82.80 N/A
2015 2,937 86,534,763 5,808,178 92,342,942 29,460.65 1,977.39 31,438.04 86.13 N/A
2016 3,182 95,324,229 5,666,576 100,990,805 29,955.45 1,780.71 31,736.16 86.71 N/A
2017 3,029 90,338,115 5,322,140 95,660,255 29,821.45 1,756.89 31,578.34 86.52 N/A
2018 2,129 62,083,999 4,025,192 66,109,191 29,162.48 1,890.74 31,053.22 85.08 N/A
1 Does not include costs for units excluded for cost comparison purposes.
2 For cost comparison purposes an Adjusted Per Capita Cost was provided and depreciation of state prison buildings was added as an expense to the daily prison bed costs for FY's 2008, 2009 and
The depreciation factor is not an actual expense incurred by ADC but was included for a more accurate comparison. The FY 2008 and FY 2009 Per Capita Cost reports have not been republished to
adjust for this in the history section; however, they have been adjusted on this page.
2010. The Fiftieth Legislature, Second Regular Session repealed the cost comparison report. See Section One for further information.
ARIZONA DEPARTMENT OF CORRECTIONS
HISTORICAL PER CAPITA COSTS 1
STATE PRISONS BY CUSTODY LEVEL
ANNUAL PER CAPITA
LEVEL / FISCAL YEAR
ADC FY 2018 Operating Per Capita Cost Report 49

ADP
TOTAL
DIRECT
TOTAL
INDIRECT
TOTAL
EXPENSE DIRECT INDIRECT TOTAL
UNADJUSTED
DAILY PER
CAPITA COST
ADJUSTED
DAILY PER
CAPITA COST 2
IN-STATE CONTRACTS: 1
MINIMUM CUSTODY
2008 2,888 54,139,622$ 3,599,346$ 57,738,968$ 18,746.41$ 1,246.31$ 19,992.72$ 54.62$ 46.98$
2009 2,962 57,173,589 2,120,125 59,293,714 19,302.36 715.77 20,018.13 54.84 47.20
2010 2,979 57,314,258 1,622,351 58,936,609 19,239.43 544.60 19,784.02 54.20 46.56
2011 3,309 66,028,526 868,324 66,896,850 19,954.22 262.41 20,216.64 55.39 N/A
2012 3,633 73,494,612 1,089,932 74,584,544 20,229.73 300.01 20,529.74 56.09 N/A
2013 3,670 72,969,123 1,158,093 74,127,216 19,882.05 315.55 20,197.60 55.34 N/A
2014 3,672 72,401,687 1,220,653 73,622,340 19,715.62 332.39 20,048.02 54.93 N/A
2015 3,658 72,024,013 1,189,763 73,213,776 19,689.99 325.26 20,015.25 54.84 N/A
2016 3,434 69,046,095 1,164,897 70,210,992 20,108.95 339.26 20,448.22 55.87 N/A
2017 3,622 61,590,997 1,574,140 63,165,137 17,004.22 434.59 17,438.82 47.78 N/A
2018 3,536 57,329,780 1,490,000 58,819,780 16,214.09 421.40 16,635.49 45.58 N/A
MEDIUM CUSTODY
2008 1,368 31,691,444 1,394,686 33,086,130 23,166.26 1,019.51 24,185.77 66.08 58.44
2009 1,334 29,692,149 954,227 30,646,376 22,257.98 715.31 22,973.30 62.94 55.30
2010 1,648 35,591,678 893,851 36,485,529 21,596.89 542.39 22,139.28 60.66 53.02
2011 2,299 49,965,411 600,398 50,565,809 21,733.54 261.16 21,994.70 60.26 N/A
2012 2,740 58,918,433 821,561 59,739,994 21,503.08 299.84 21,802.92 59.57 N/A
2013 2,780 58,826,721 852,643 59,679,364 21,163.74 306.75 21,470.49 58.82 N/A
2014 2,994 64,155,426 987,359 65,142,785 21,430.86 329.82 21,760.68 59.62 N/A
2015 3,482 76,100,184 1,102,180 77,202,365 21,858.45 316.58 22,175.03 60.75 N/A
2016 2,999 66,328,936 1,001,350 67,330,286 22,115.54 333.87 22,449.42 61.34 N/A
2017 4,369 90,643,001 1,890,242 92,533,242 20,748.28 432.68 21,180.96 58.03 N/A
2018 4,765 97,117,939 1,991,475 99,109,414 20,379.81 417.90 20,797.71 56.98 N/A
OUT-OF-STATE CONTRACTS: 3
MINIMUM CUSTODY
2008 N/A
2009 N/A
2010 1,284 25,945,346 695,020 26,640,366 20,206.66 541.29 20,747.95 56.84 N/A
2011 During FY 2011 ADC inmates housed in out-of-state contracted prison beds were returned to Arizona state and/or private prison beds.
2012 N/A
2013 N/A
2014 N/A
2015 N/A
2016 N/A
2017 N/A
2018 N/A
MEDIUM CUSTODY
2008 2,052 44,947,107 2,459,503 47,406,610 21,904.05 1,198.59 23,102.64 63.12 N/A
2009 3,814 82,814,312 2,726,400 85,540,712 21,713.24 714.84 22,428.08 61.45 N/A
2010 487 9,840,641$ 263,610$ 10,104,251$ 20,206.66$ 541.29$ 20,747.95$ 56.84$ N/A
2011 During FY 2011 ADC inmates housed in out-of-state contracted prison beds were returned to Arizona state and/or private prison beds.
2012 N/A
2013 N/A
2014 N/A
2015 N/A
2016 N/A
2017 N/A
2018 N/A
1 Does not include costs for units excluded for cost comparison purposes.
3 Provided for informational purposes only, out-of-state contract prison beds were not used for cost comparison analyses.
The Fiftieth Legislature, Second Regular Session repealed the cost comparison report. See Section One for further information.
2 FY's 2008, 2009 and 2010 provided an Adjusted Daily Cost for cost comparison purposes.
LEVEL / FISCAL YEAR
ARIZONA DEPARTMENT OF CORRECTIONS
HISTORICAL PER CAPITA COSTS
CONTRACT PRISON BEDS BY CUSTODY LEVEL
ANNUAL PER CAPITA
ADC FY 2018 Operating Per Capita Cost Report 50

ADP
DIRECT
EXPENSE
INDIRECT
EXPENSE
TOTAL
EXPENSE DIRECT INDIRECT TOTAL
DAILY PER
CAPITA COST
COUNTY JAILS (PENDING INTAKE TO STATE CUSTODY)
1990 179 2,604,200$ -$ 2,604,200$ 14,548.60$ -$ 14,548.60$ 39.86$
1991 76 1,228,600 - 1,228,600 16,165.79 - 16,165.79 44.29
1992 84 1,417,800 - 1,417,800 16,878.57 - 16,878.57 46.12
1993 125 2,028,400 - 2,028,400 16,227.20 - 16,227.20 44.46
1994 158 1,717,600 - 1,717,600 10,870.89 - 10,870.89 29.78
1995 126 1,312,100 - 1,312,100 10,413.49 - 10,413.49 28.53
1996 235 2,238,384 - 2,238,384 9,525.04 - 9,525.04 26.02
1997 156 1,714,553 - 1,714,553 10,990.72 - 10,990.72 30.11
1998 202 2,313,408 - 2,313,408 11,452.51 - 11,452.51 31.38
1999 172 1,636,034 - 1,636,034 9,511.83 - 9,511.83 26.06
2000 106 1,201,017 - 1,201,017 11,330.35 - 11,330.35 30.96
2001 155 1,555,959 - 1,555,959 10,038.45 - 10,038.45 27.50
2002 209 2,066,903 - 2,066,903 9,889.49 - 9,889.49 27.09
2003 235 3,315,554 - 3,315,554 14,108.74 - 14,108.74 38.65
2004 158 2,016,725 - 2,016,725 12,764.08 - 12,764.08 34.87
2005 73 1,331,646 4,355 1,336,001 18,241.73 59.66 18,301.38 50.14
2006 63 756,985 2,539 759,524 12,015.63 40.30 12,055.94 33.03
2007 68 878,303 2,594 880,897 12,889.68 38.07 12,927.75 35.42
2008 72 429,161 - 429,161 5,960.57 - 5,960.57 16.29
2009 76 450,486 - 450,486 5,935.25 - 5,935.25 16.26
Prior to the FY 2010 Operating Per Capita Cost report the expenses for inmates pending intake to the ADC for reception and processing were allocated to the costs of housing all ADC state and
contracted prison vendors based on ADP. Beginning with the FY 2010 Operating Per Capita Cost report these expenses have been excluded to improve the cost comparison analysis between state
housed inmates and contracted prison bed providers.
FISCAL YEAR
ARIZONA DEPARTMENT OF CORRECTIONS
HISTORICAL PER CAPITA COSTS
ANNUAL PER CAPITA COST
ADC FY 2018 Operating Per Capita Cost Report 51
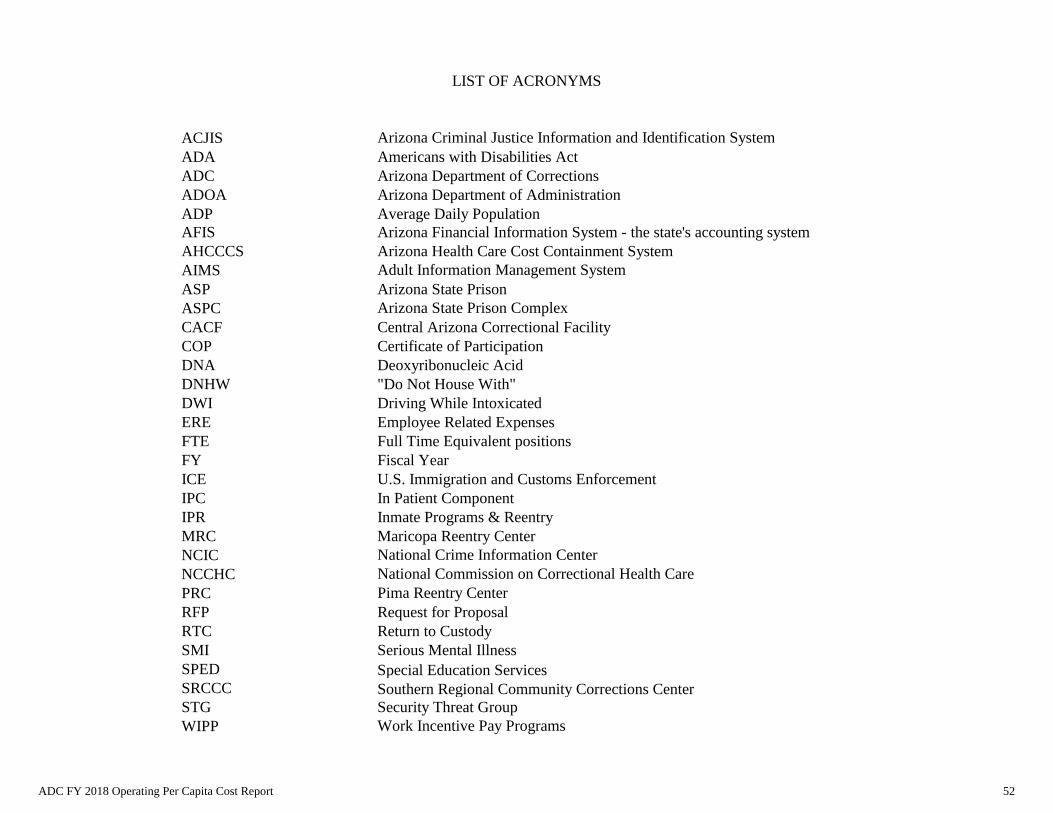
ACJIS Arizona Criminal Justice Information and Identification System
ADA Americans with Disabilities Act
ADC Arizona Department of Corrections
ADOA Arizona Department of Administration
ADP Average Daily Population
AFIS Arizona Financial Information System - the state's accounting system
AHCCCS Arizona Health Care Cost Containment System
AIMS Adult Information Management System
ASP Arizona State Prison
ASPC Arizona State Prison Complex
CACF Central Arizona Correctional Facility
COP Certificate of Participation
DNA Deoxyribonucleic Acid
DNHW "Do Not House With"
DWI Driving While Intoxicated
ERE Employee Related Expenses
FTE Full Time Equivalent positions
FY Fiscal Year
ICE U.S. Immigration and Customs Enforcement
IPC In Patient Component
IPR Inmate Programs & Reentry
MRC Maricopa Reentry Center
NCIC National Crime Information Center
NCCHC National Commission on Correctional Health Care
PRC Pima Reentry Center
RFP Request for Proposal
RTC Return to Custody
SMI Serious Mental Illness
SPED Special Education Services
SRCCC Southern Regional Community Corrections Center
STG Security Threat Group
WIPP Work Incentive Pay Programs
LIST OF ACRONYMS
ADC FY 2018 Operating Per Capita Cost Report 52