fy17 q2 investor deck - s21.q4cdn.comfy17-q2)-final-v2.pdf · fy17 q2 investor deck . ... cyber...
TRANSCRIPT
FY17 Q2 Investor Deck

Safe Harbor Except for historical information, matters discussed in this presentation, including statements about the success of the Company’s
future volume, sales, costs, cost savings, earnings, foreign currencies, and foreign currency exchange rates, cash flows, plans,
objectives, expectations, growth or profitability, are forward-looking statements based on management’s estimates, assumptions
and projections. Important factors that could affect performance and cause results to differ materially from management’s
expectations are described in the Company’s most recent Form 10-K filed with the SEC, as updated from time to time in the
Company's SEC filings. Those factors include, but are not limited to, risks related to competition in the Company’s markets;
economic conditions and financial market volatility; the Company’s ability to drive sales growth and increase market share; volatility
and increases in commodity, energy and other costs; dependence on key customers; information technology security breaches or
cyber attacks; government regulations; political, legal and tax risks; international operations, including price controls, foreign
currency fluctuations, labor claims and labor unrest, potential harm and liabilities from use, storage and transportation of chlorine in
certain markets and discontinuation of operations in Venezuela; risks relating to acquisitions, new ventures and divestitures; the
success of the Company’s business strategies and products; supply disruptions; product liability claims, labor claims and other
legal proceedings; the Company’s business reputation; environmental matters; the Company’s ability to assert and defend its
intellectual property rights; and the impacts of potential stockholder activism.
The Company may also use non-GAAP financial measures, which could differ from reported results using Generally Accepted
Accounting Principles (GAAP). The most directly comparable GAAP financial measures and reconciliation to non-GAAP financial
measures are set forth in the Appendix hereto, the Supplemental Schedules of the Company’s quarterly financial results and in the
Company’s SEC filings, including its Form 10-K and its exhibits furnished to the SEC, which are posted at
www.TheCloroxCompany.com in the Investors/Financial Information/Financial Results and SEC Filings sections, respectively.
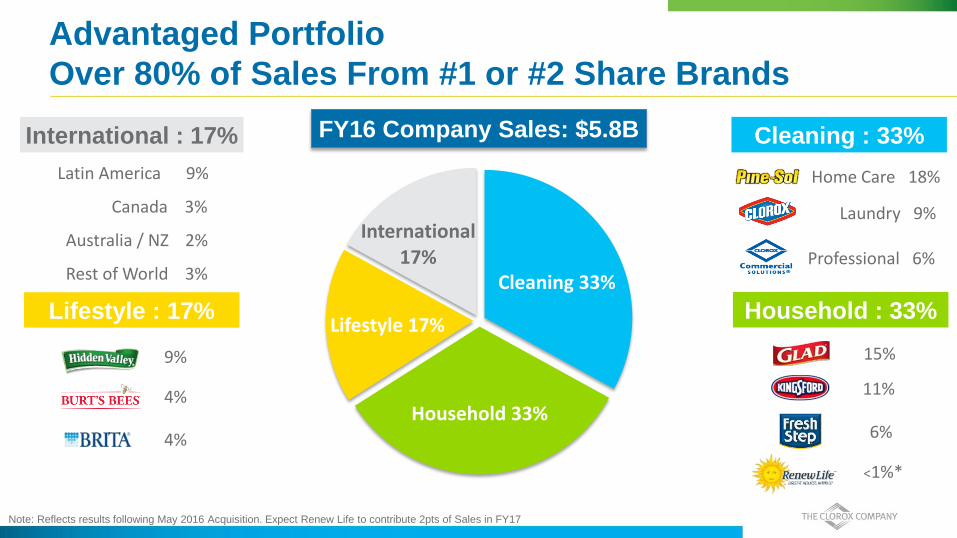
International : 17% Cleaning : 33%
Household : 33% Lifestyle : 17%
Cleaning 33%
Household 33%
Lifestyle 17%
International 17%
Advantaged Portfolio
Over 80% of Sales From #1 or #2 Share Brands
Latin America 9%
Canada 3%
Australia / NZ 2%
Rest of World 3%
9%
4%
4%
15%
11%
6%
Home Care 18%
Laundry 9%
Professional 6%
FY16 Company Sales: $5.8B
<1%*
Note: Reflects results following May 2016 Acquisition. Expect Renew Life to contribute 2pts of Sales in FY17

Advantaged Portfolio
Big Share Brands in Mid-Sized Categories
Clorox 23%
Private Label 20%
Competitor A 8%
Competitor B 5%
Competitor C 5%
Competitor D 4%
Competitor E 4%
Smaller Players
32% Clorox is
~3X
the size of next
branded competitor
Source: IRI MULOP for 52 weeks ending 12/18/2016
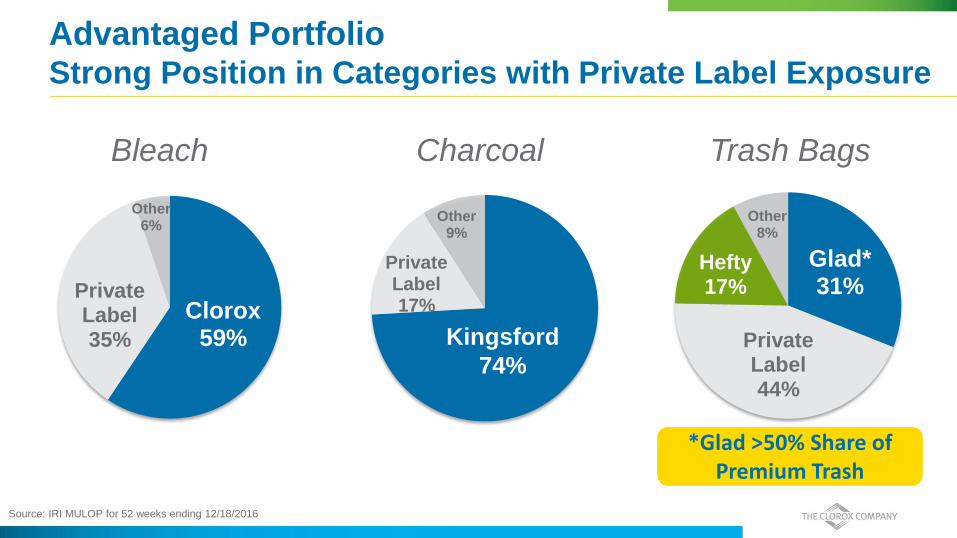
Private Label 17%
Other 9%
Glad* 31%
Private Label 44%
Hefty 17%
Other 8%
Advantaged Portfolio Strong Position in Categories with Private Label Exposure
Clorox 59%
Private Label 35%
Other 6%
Bleach Trash Bags Charcoal
Kingsford
74%
*Glad >50% Share of Premium Trash
Source: IRI MULOP for 52 weeks ending 12/18/2016

Advantaged Portfolio
Supported by Consumer Megatrends
Affordability
Health & Wellness Sustainability
Fragmentation
MEGA
TRENDS

Advantaged Portfolio
Driving Significant Synergies
Over 80% of sales from #1 or #2 share brands
Lower SG&A as a % of Sales vs. Peers(1)
Top tertile ROIC
Strong cash flow
Customer
Scaled teams,
capabilities, and
broker network
Supply Chain
Scale across Buy,
Make, Ship
Brand Building
Common consumer
trends, insights, 3D
demand creation
Health & Wellness Sustainability Fragmentation Affordability
(1) As of June 30th, 2016, Clorox’s S&A/Sales was ~14% vs. peer average of 20% . This number does not include R&D or marketing expenses and excludes peers that do
not disclose S&A separately from SG&A in their reported financial statements (Kimberly-Clark, Reckitt-Benckiser). Peer group consists of CHD, CL, PG, NWL, CPB, GIS,
HSY, K, KHC, DPS, KO, PEP, COTY, EL, KMB, RB-GB.
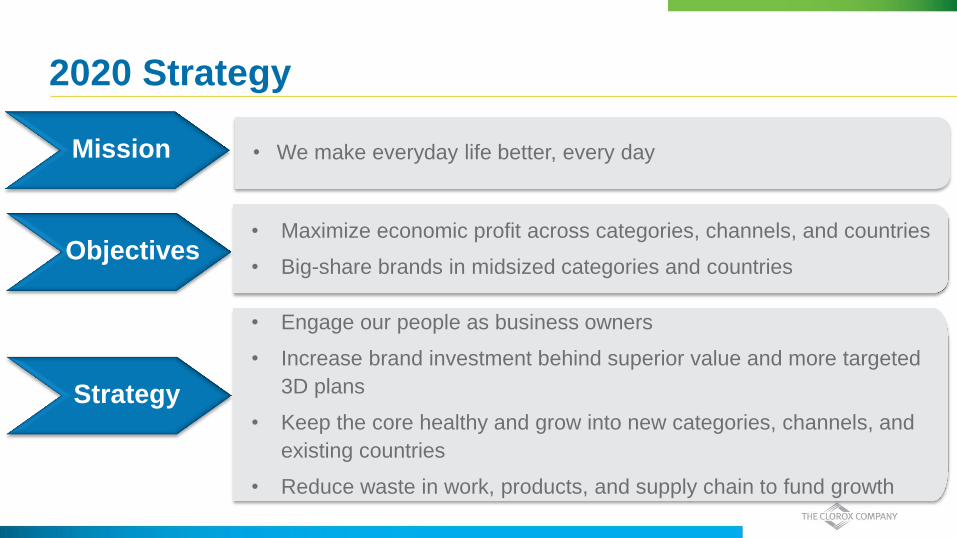
2020 Strategy
Mission
Strategy Strategy
Objectives
• We make everyday life better, every day
• Maximize economic profit across categories, channels, and countries
• Big-share brands in midsized categories and countries
• Engage our people as business owners
• Increase brand investment behind superior value and more targeted
3D plans
• Keep the core healthy and grow into new categories, channels, and
existing countries
• Reduce waste in work, products, and supply chain to fund growth
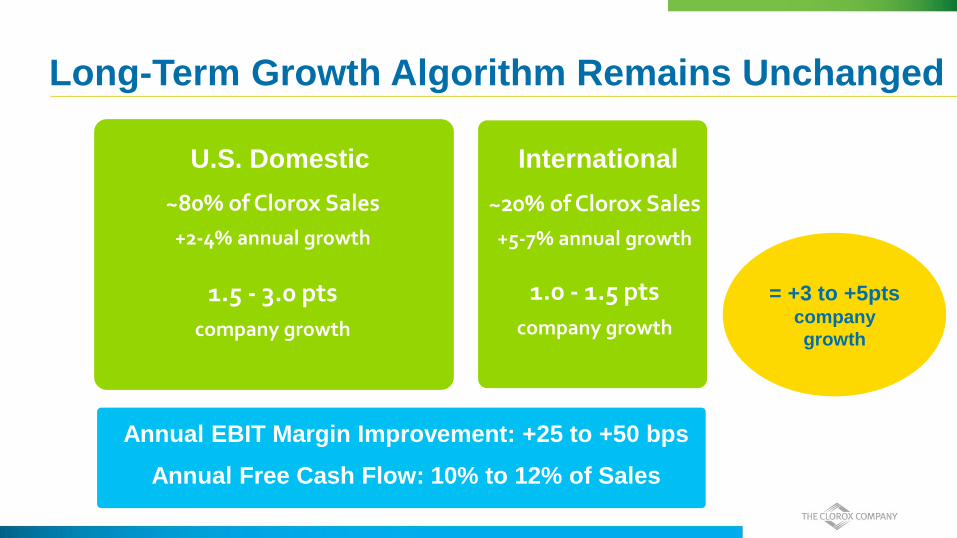
Long-Term Growth Algorithm Remains Unchanged
~80% of Clorox Sales
+2-4% annual growth
1.5 - 3.0 pts
company growth
U.S. Domestic
~20% of Clorox Sales
+5-7% annual growth
1.0 - 1.5 pts
company growth
International
Annual EBIT Margin Improvement: +25 to +50 bps
Annual Free Cash Flow: 10% to 12% of Sales
= +3 to +5pts company
growth

Strong Progress Across Strategy Accelerators
New, Digital-Led Creative Agency Partners
Cutting Speed to Market by 50%
Investing Behind Growth Brands to Accelerate Top-line
FY16 Record-High Engagement
Increased Investments in Profitable Growth
Focus on Core
Increased Demand
Investment
Investments in
Innovation
Sales Promotion
Trade Promotion
Advertising
+2pts

Leading Through Strategic Change in CPG
Digital
Revolution
Consumer
Focus on Value
Challenging
Retail Environment
International
Macro Headwinds
Focus on Portfolio Momentum

Portfolio Segmentation
Sales Growth Potential
High
Low High
Fuel Growth

1 point of Household Penetration = $50M+ Sales
$22M $20M $10M
Cleaning Household Lifestyle
Opportunity by Segment
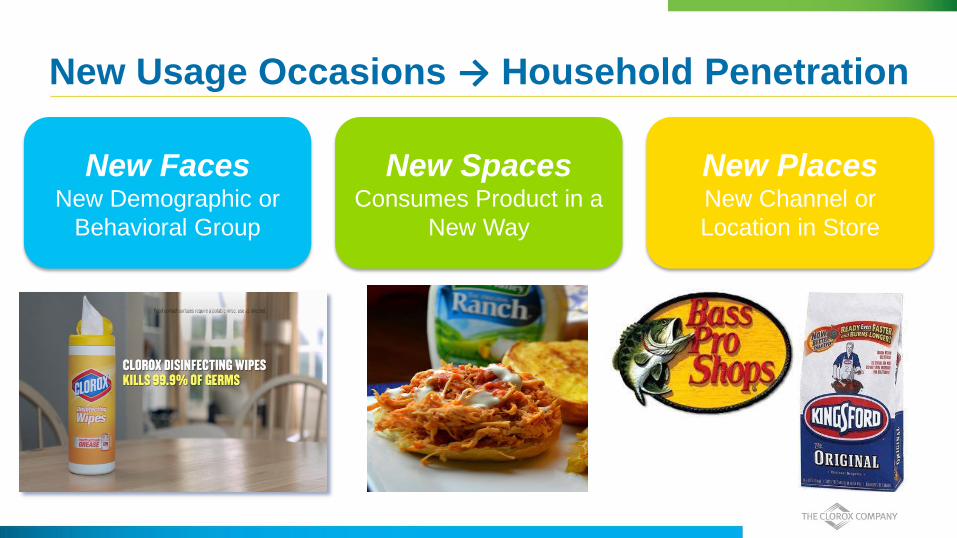
New Usage Occasions → Household Penetration
New Faces New Demographic or
Behavioral Group
New Spaces Consumes Product in a
New Way
New Places New Channel or
Location in Store

Growth With New Faces, Spaces & Places
Drive
Trial & Awareness on Core
Expand into Adjacencies
International Expansion

Growth With New Faces, Spaces & Places
Targeted Demand
Spend
Drive New
Usage Occasions
Expand Retail Distribution
Margin Enhancement through Operational Excellence

Renew Life Acquisition
• Closed May 2, 2016
• Purchase Price – $290M (2.5x Sales)
• Calendar 2015 Sales – About $115M
• Leading brand in the natural channel
Source: SPINS with Vitamin Shoppe, IR MULO 52 weeks ending 7/10/16, and Whole Foods 52 weeks ending 7/10/16

Probiotics: An Attractive Category
Two-thirds of US consumers
experience digestive health issues
50% of purchases are based
on a Doctor recommendation
+15% expected category growth
Source: Mintel Group, Ltd. (2015), Estimates based on Mintel (2015), Nutrition Business Journal (2014), and Euromonitor (2015) total market estimates in
food, drug, mass, natural, eCommerce, specialty and other channels

Renew Life: Strong Strategic Fit
Health & Wellness
US Centric
Clear Plan for Value Creation
Focus on 3D Innovation
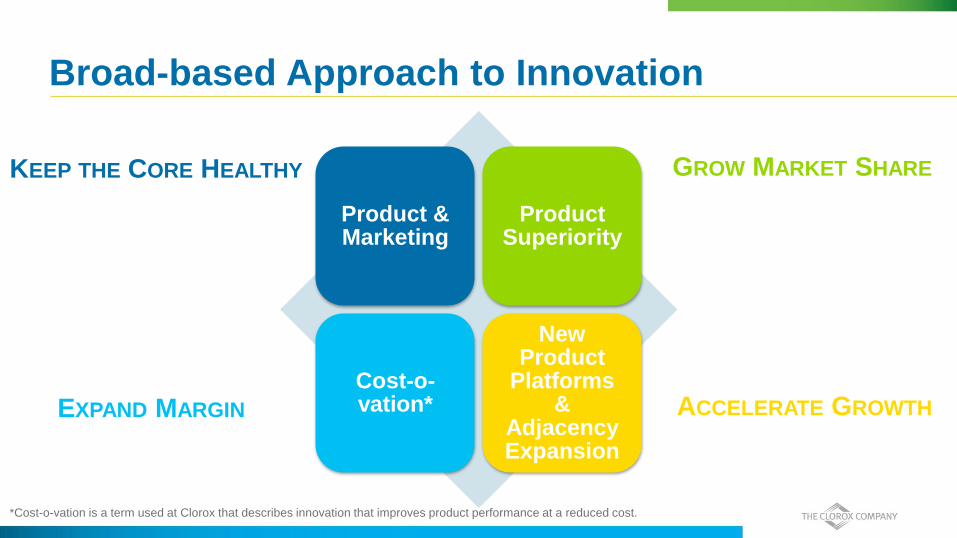
Broad-based Approach to Innovation
Product & Marketing
Product Superiority
Cost-o-vation*
New Product
Platforms &
Adjacency Expansion
GROW MARKET SHARE
ACCELERATE GROWTH EXPAND MARGIN
KEEP THE CORE HEALTHY
*Cost-o-vation is a term used at Clorox that describes innovation that improves product performance at a reduced cost.
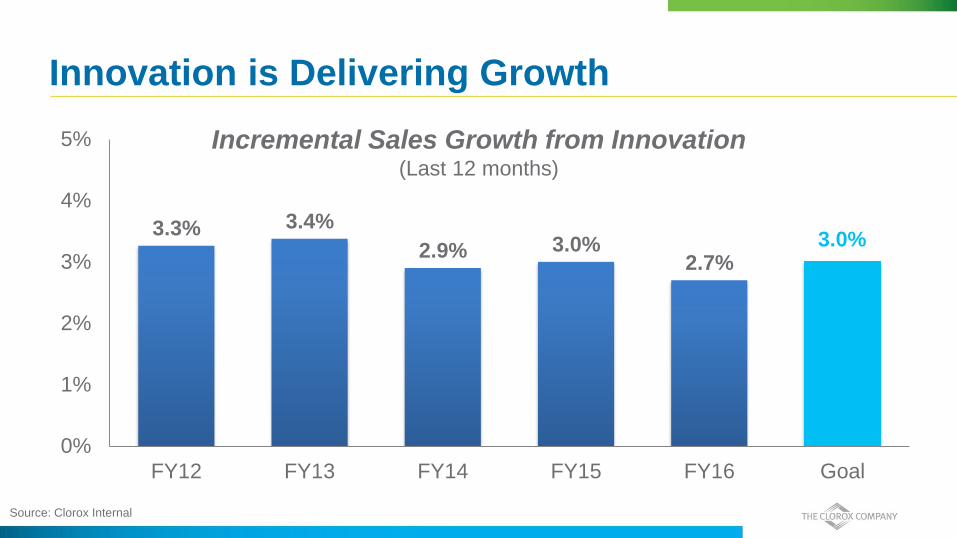
Innovation is Delivering Growth
3.3% 3.4%
2.9% 3.0% 2.7%
0%
1%
2%
3%
4%
5%
FY12 FY13 FY14 FY15 FY16 Goal
3.0%
Incremental Sales Growth from Innovation (Last 12 months)
Source: Clorox Internal
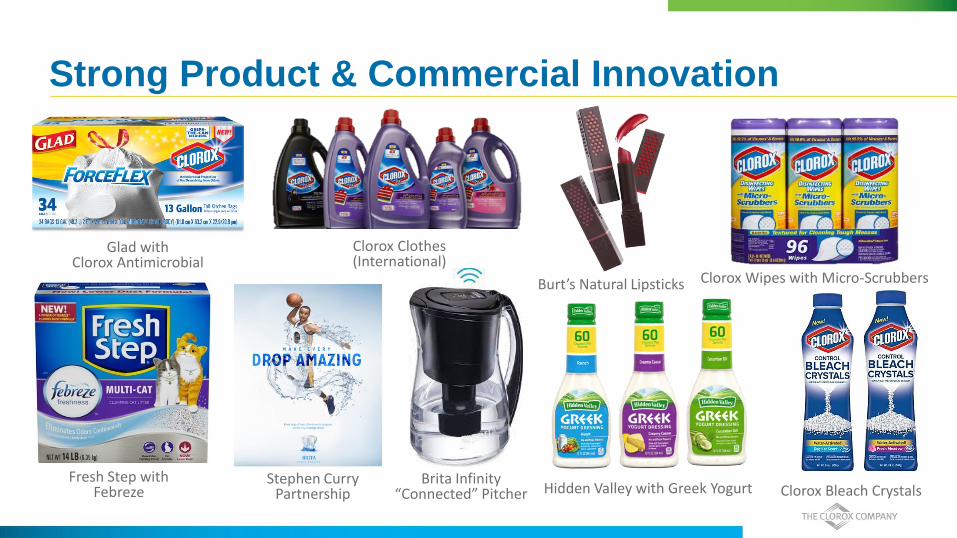
Strong Product & Commercial Innovation
Burt’s Natural Lipsticks
Fresh Step with Febreze Hidden Valley with Greek Yogurt
Clorox Wipes with Micro-Scrubbers
Glad with Clorox Antimicrobial
Clorox Bleach Crystals Stephen Curry
Partnership Brita Infinity
“Connected” Pitcher
Clorox Clothes (International)
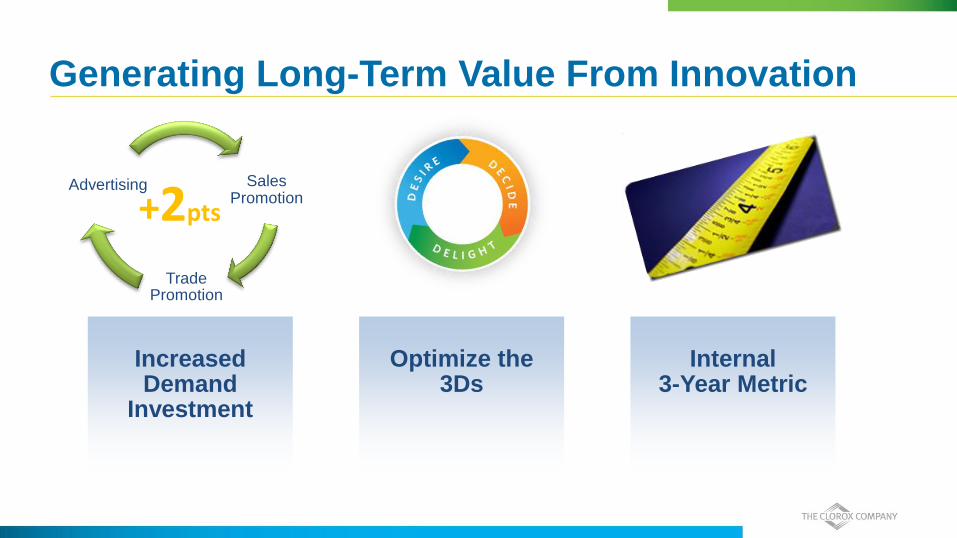
Generating Long-Term Value From Innovation
Increased Demand
Investment
Optimize the
3Ds
Internal
3-Year Metric
Sales Promotion
Trade Promotion
Advertising
+2pts
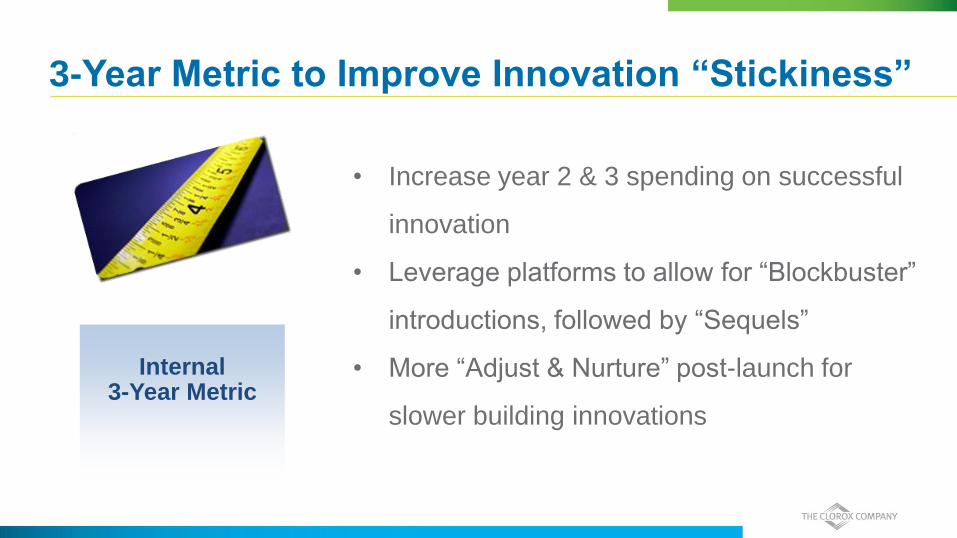
3-Year Metric to Improve Innovation “Stickiness”
Internal
3-Year Metric
• Increase year 2 & 3 spending on successful
innovation
• Leverage platforms to allow for “Blockbuster”
introductions, followed by “Sequels”
• More “Adjust & Nurture” post-launch for
slower building innovations

Blockbuster & Sequels
Differentiated Technology Provides Staying Power
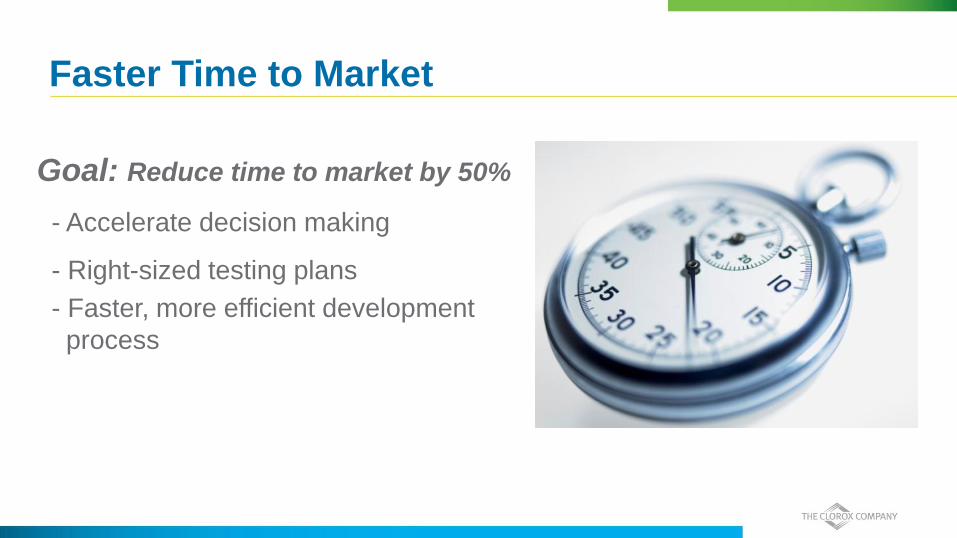
Faster Time to Market
Goal: Reduce time to market by 50%
- Accelerate decision making
- Right-sized testing plans
- Faster, more efficient development
process
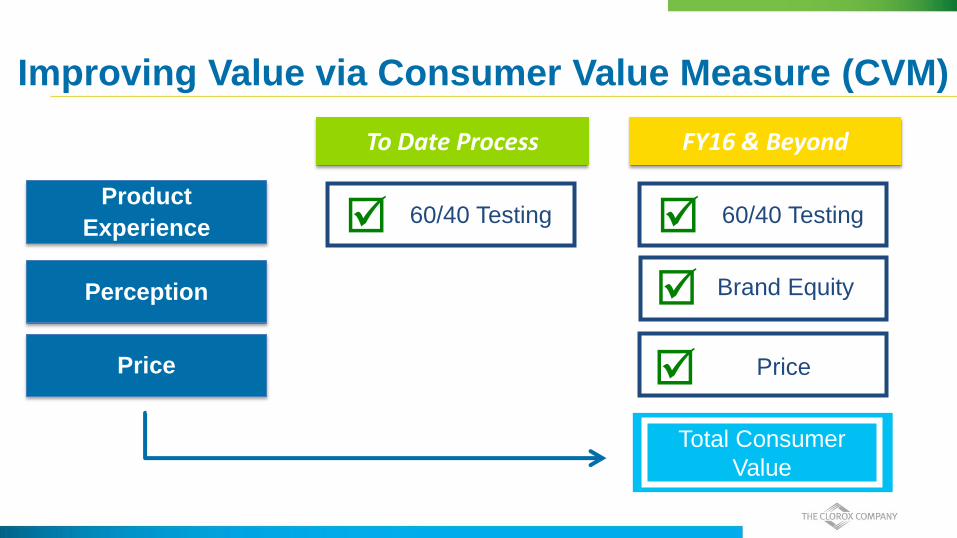
Improving Value via Consumer Value Measure (CVM)
Product
Experience
Perception
Price
To Date Process
60/40 Testing
FY16 & Beyond
Total Consumer
Value
60/40 Testing
Price
Brand Equity
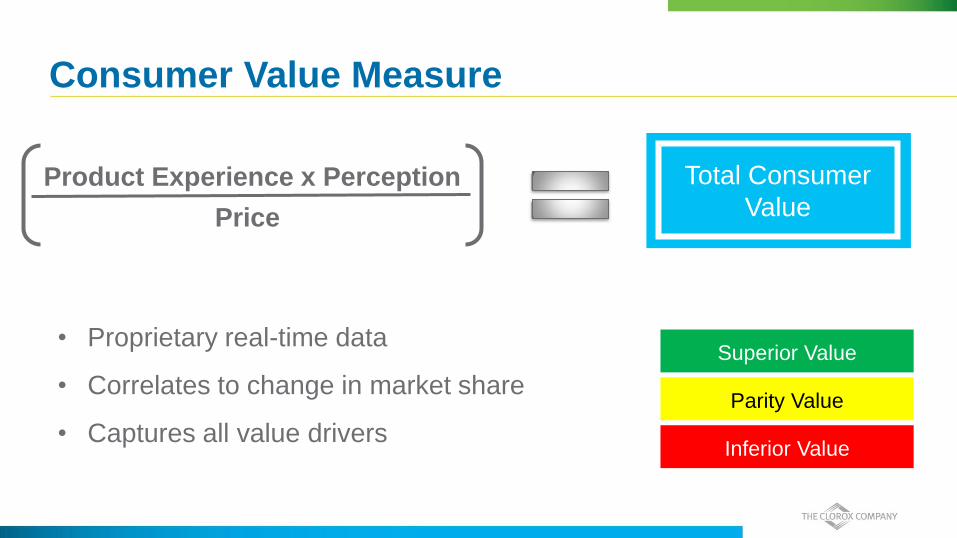
Consumer Value Measure
Product Experience x Perception
Price
Superior Value
Parity Value
Inferior Value
• Proprietary real-time data
• Correlates to change in market share
• Captures all value drivers
Total Consumer
Value

CVM: How Do We Use It?
Price Index
Pro
duct
& P
erc
eption Index
Product x Perception
Price
Category Average
Based on Marn, Roegner, Zawada (McKinsey) pricing work published in “The Pricing Advantage” (April 2004)
Above 450 line,
Benefit > Price
Superior
Value
Below 450 line
Price > Benefit
Inferior
Value

Focus on 3D Technology Transformation

Technology Reshapes Consumer Journeys

Leading the Industry in Digital Consumer Engagement
More Targeted
More Personal
More Real-Time
Driving Consumer Engagement
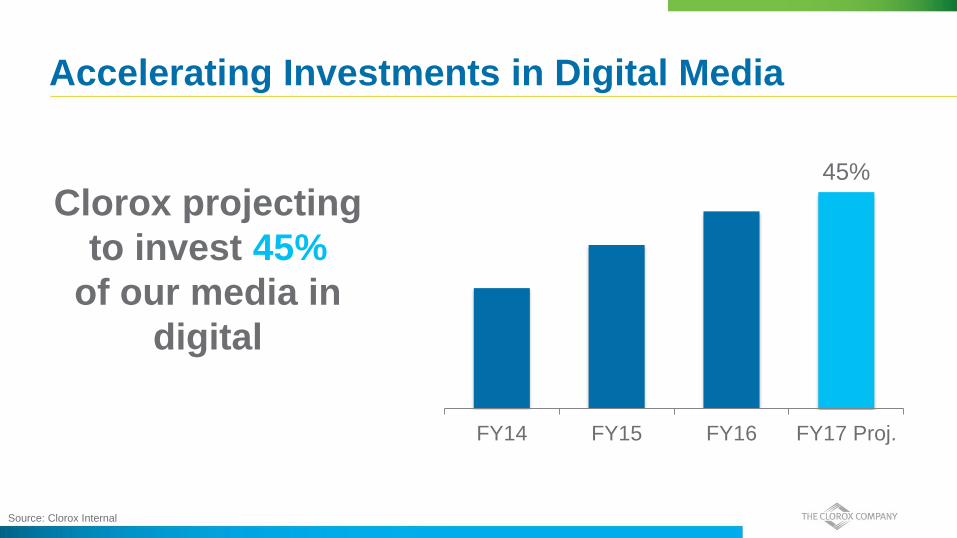
Accelerating Investments in Digital Media
Clorox projecting
to invest 45%
of our media in
digital
45%
FY14 FY15 FY16 FY17 Proj.
Source: Clorox Internal

Technology Enables One-to-One Communication
R E C I P E S
Right Message,
Right Context,
Right Medium

Digital Improves ROI
Enhanced
Targeting
More
Personalized
More
Real Time Across
Channels
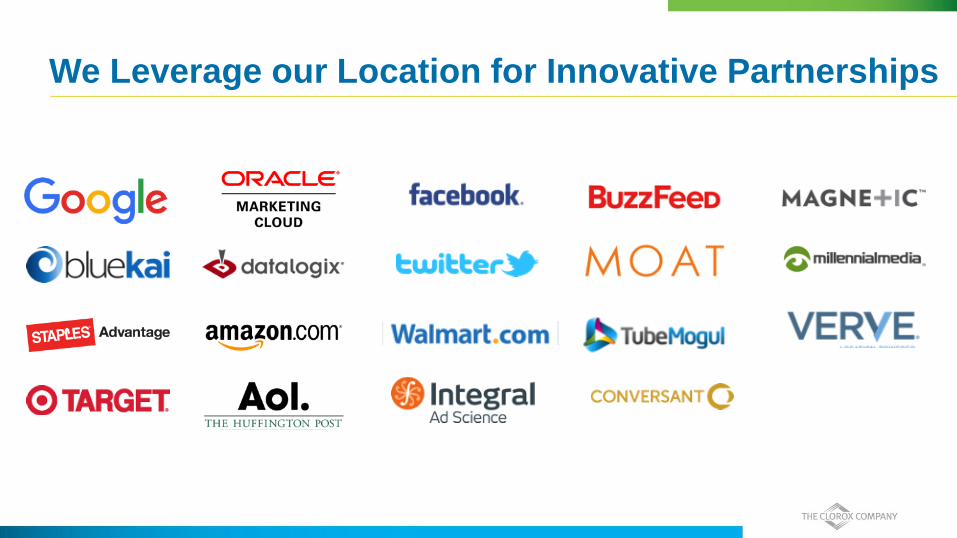
We Leverage our Location for Innovative Partnerships
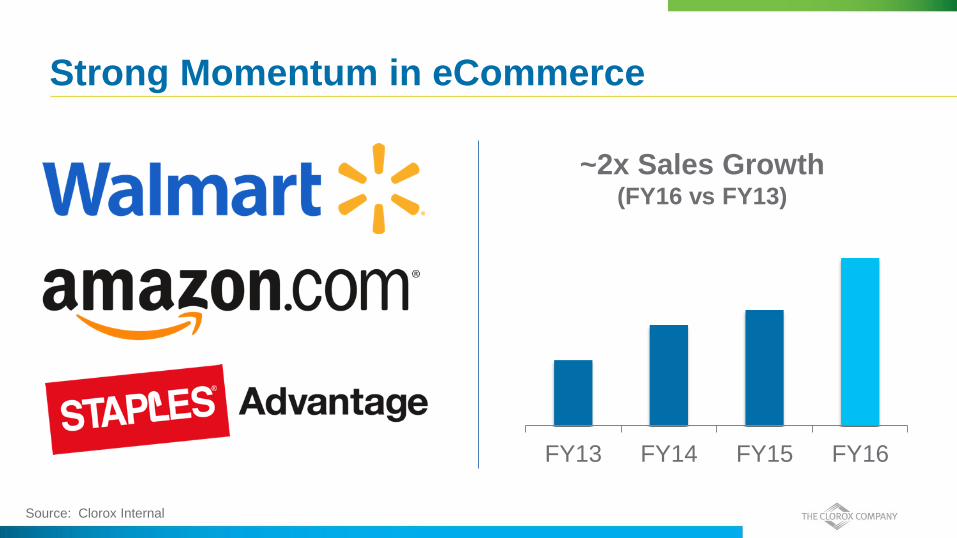
Strong Momentum in eCommerce
FY13 FY14 FY15 FY16
~2x Sales Growth (FY16 vs FY13)
Source: Clorox Internal

eCommerce-Enabled Innovation

eCommerce-Enabled Innovation
Infinity Pitcher

Focus on Growth Culture

Strong Organizational Culture is a Solid Foundation
Strong Values
People Centric
Operational Excellence

Winning the Right Way

Corporate Responsibility at Clorox
<A> Reviewed by Ernst & Young LLP Footnotes: http://annualreport.thecloroxcompany.com/_pdf/CLX-012_2016_Integrated_Report.pdf page 27
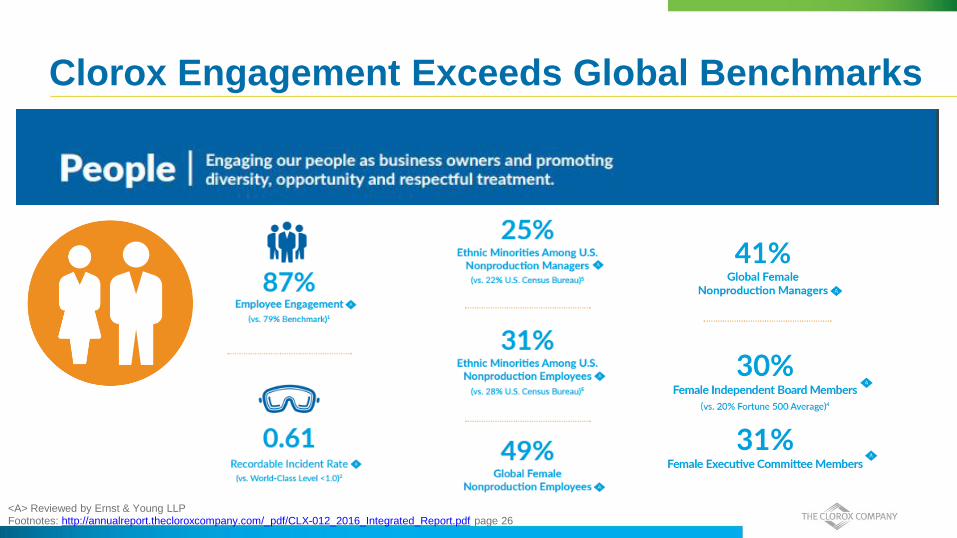
Clorox Engagement Exceeds Global Benchmarks
<A> Reviewed by Ernst & Young LLP Footnotes: http://annualreport.thecloroxcompany.com/_pdf/CLX-012_2016_Integrated_Report.pdf page 26

International : 17% Cleaning : 33%
Household : 33% Lifestyle : 17%
Cleaning 33%
Household 33%
Lifestyle 17%
International 17%
Latin America 9%
Canada 3%
Australia / NZ 2%
Rest of World 3%
9%
4%
4%
15%
11%
6%
Home Care 18%
Laundry 9%
Professional 6%
FY16 Company Sales: $5.8B
<1%*
International is a Key Component of our Portfolio
Note: Reflects results following May 2016 Acquisition. Expect Renew Life to contribute 2pts of Sales in FY17

Why We Like International
Leading Brands
Midsized Countries
Faster
Category Growth Rates
Strong
Operational Performance
Peru
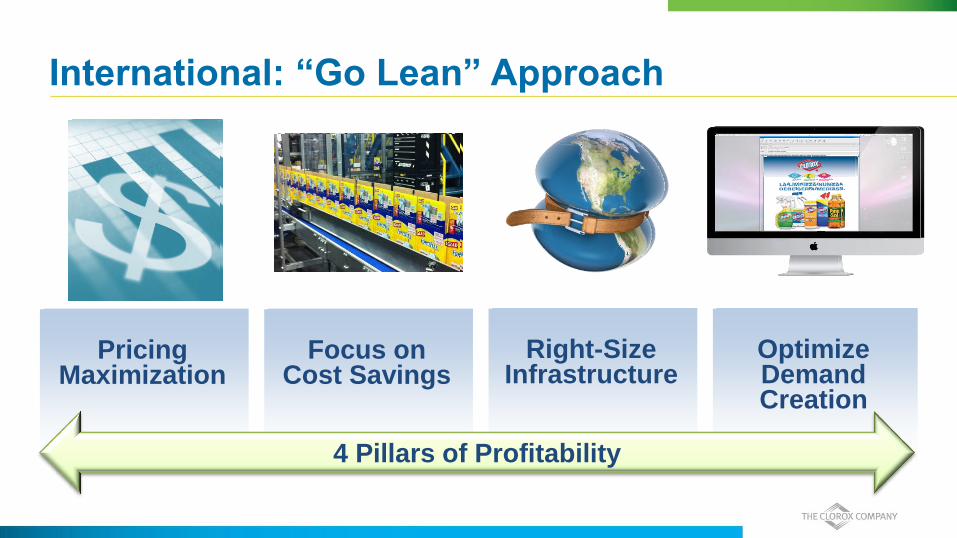
International: “Go Lean” Approach
Pricing
Maximization
Focus on
Cost Savings
Right-Size
Infrastructure
Optimize Demand Creation
Pricing
Maximization
Focus on
Cost Savings
Right-Size
Infrastructure
Optimize Demand Creation
4 Pillars of Profitability

We Have Strong Leading Brands Across International
45 Brands Hold
#1 or #2 Market Share
Source: Nielsen Retail Measurement for International geographies except; IRI for Australia, Horwath for Dominican Republic and
IDRetail for Uruguay ending FY16
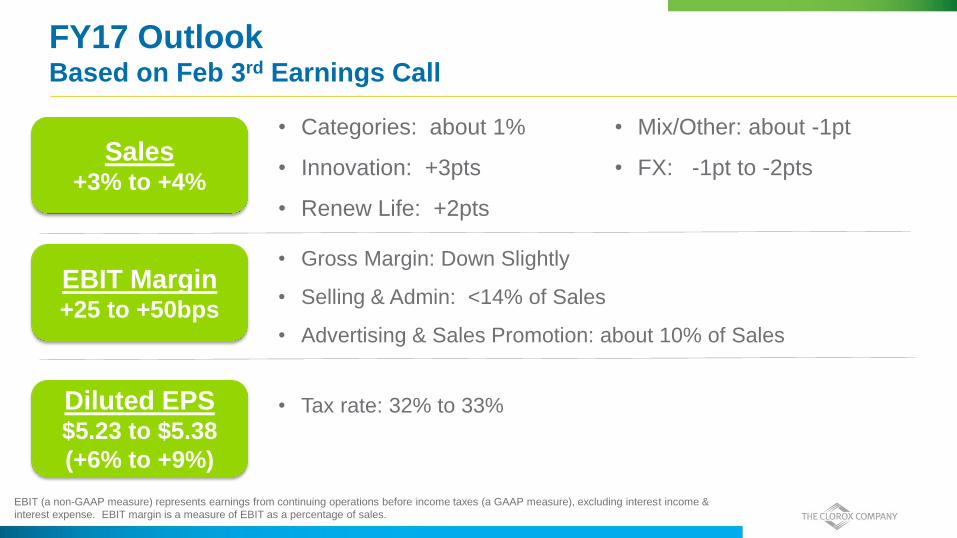
FY17 Outlook Based on Feb 3rd Earnings Call
• Categories: about 1%
• Innovation: +3pts
• Renew Life: +2pts
• Mix/Other: about -1pt
• FX: -1pt to -2pts Sales
+3% to +4%
EBIT Margin +25 to +50bps
Diluted EPS $5.23 to $5.38
(+6% to +9%)
• Gross Margin: Down Slightly
• Selling & Admin: <14% of Sales
• Advertising & Sales Promotion: about 10% of Sales
• Tax rate: 32% to 33%
EBIT (a non-GAAP measure) represents earnings from continuing operations before income taxes (a GAAP measure), excluding interest income &
interest expense. EBIT margin is a measure of EBIT as a percentage of sales.

FY17 YTD Performance
Sales
EBIT Margin
Diluted EPS (cont. ops)
FY17 YTD Vs. Year Ago
$2.8B +4%
(+6% FX Neutral)
18.7% -90 bps
$2.50 +2%
EBIT (a non-GAAP measure) represents earnings from continuing operations before income taxes (a GAAP measure), excluding interest income & interest expense. EBIT margin is a
measure of EBIT as a percentage of sales. See reconcilation on our website (https://investors.thecloroxcompany.com/investors/financial-information/quarterly-results/default.aspx) and on
slide 70. Currency Neutral Sales growth (a non-GAAP measure) represents GAAP net sales growth excluding the impact of the change in foreign currency exchange rates. See reconciliation
on slide 67.
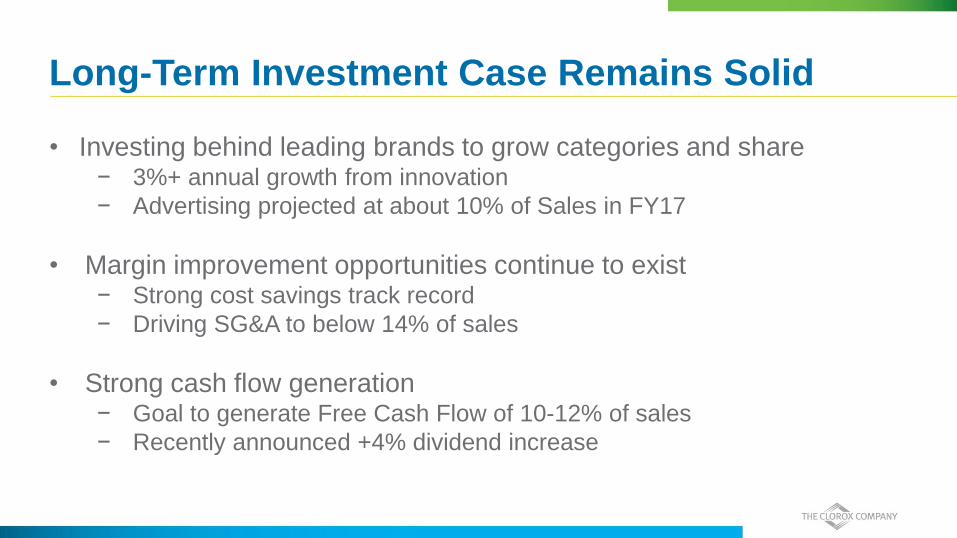
Long-Term Investment Case Remains Solid
• Investing behind leading brands to grow categories and share − 3%+ annual growth from innovation
− Advertising projected at about 10% of Sales in FY17
• Margin improvement opportunities continue to exist − Strong cost savings track record
− Driving SG&A to below 14% of sales
• Strong cash flow generation − Goal to generate Free Cash Flow of 10-12% of sales
− Recently announced +4% dividend increase

Cost Savings Continue to Deliver
0 bps
50 bps
100 bps
150 bps
200 bps
250 bps
FY13 FY14 FY15 FY16 FY17+
EBIT Margin Benefit from Cost Savings
+150bps
Annual
Goal
EBIT (a non-GAAP measure) represents earnings from continuing operations before income taxes (a GAAP measure), excluding interest income &
interest expense. EBIT margin is a measure of EBIT as a percentage of sales. See reconcilation on our website
(https://investors.thecloroxcompany.com/investors/financial-information/quarterly-results/default.aspx) and on slide 70 and 71.
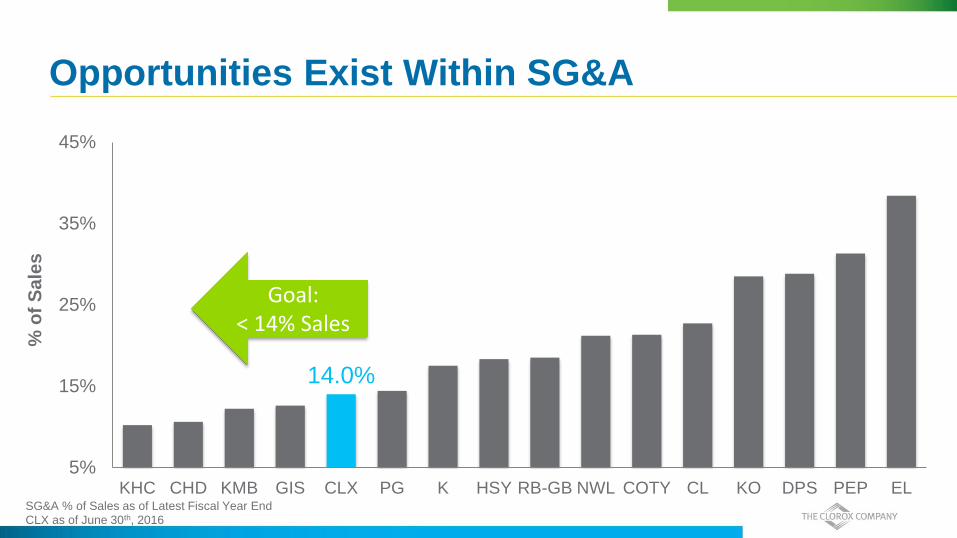
Opportunities Exist Within SG&A
14.0%
5%
15%
25%
35%
45%
KHC CHD KMB GIS CLX PG K HSY RB-GB NWL COTY CL KO DPS PEP EL
% o
f S
ale
s
Goal: < 14% Sales
SG&A % of Sales as of Latest Fiscal Year End
CLX as of June 30th, 2016

Top-Tier ROIC
Peer Average: 15%
Return on invested capital (ROIC), a non-GAAP measure, is calculated as earnings from continuing operations before income taxes and interest expense,
computed on an after-tax basis as a percentage of average invested capital. Average invested capital represents a five quarter average of total assets less
non-interest bearing liabilities. ROIC is a measure of how effectively the company allocates capital. Information on the Peer ROIC is based on publicly
available Fiscal-end data (FactSet) as of 6/30/2016. See Slide 75 and 76 for reconciliation.
29%
0%
10%
20%
30%
CLX KMB CL HSY EL RB-GB DPS CHD CPB GIS PEP PG KO K COTY KHC NWL

$780 $786
$858
$768
$590 $649
$733
$596
FY13 FY14 FY15 FY16 Goal
$M
Operating Cash Flow Free Cash Flow
Strong Free Cash Flow
10% - 12%
of Sales
Free Cash Flow (a non-GAAP measure) represents Operating Cash Flow from Continuing Operations less Capital Expenditures. See reconcilation on our
website (https://investors.thecloroxcompany.com/investors/financial-information/quarterly-results/default.aspx) and on slide 73.
% of Sales
11% 12% 13% 10%
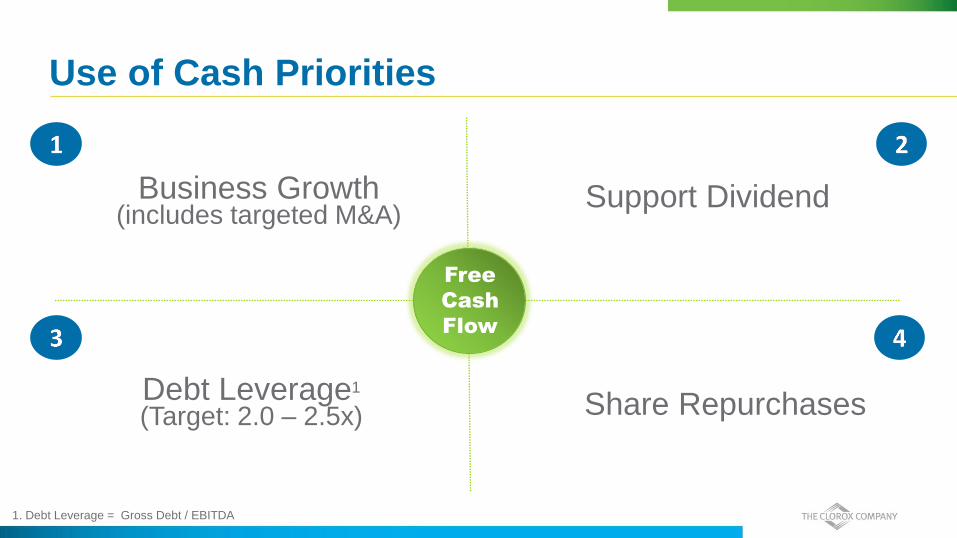
Use of Cash Priorities
Business Growth (includes targeted M&A)
Support Dividend
Share Repurchases Debt Leverage1
(Target: 2.0 – 2.5x)
Free
Cash
Flow
1. Debt Leverage = Gross Debt / EBITDA

M&A Focus
• Target areas with tailwinds in categories, countries, and channels Categories: Health & Wellness, Food Enhancers, and Natural Personal Care
Countries: US-Centric, with possible International expansion
Channels: Current retail and professional markets
• Strong fit with Clorox strategy and capabilities
• #1 (or strong #2) position in a defensible niche of a growing, sustainable category
• Accretive margin to the company average
• Balance Sheet Flexibility
Gross Debt/EBITA is 2.1x (low end of targeted range of 2.0x to 2.5x)
Please note that this slide refers to general goals for Clorox’s M&A focus – each element of focus may not be relevant or applicable to each M&A
potential transaction.

Nearly $2B Returned to Shareholders
in the Last 4 Years FY16
Dividend
Payout Ratio
= 61%
$590 $649
$733
$596
$330
$532 $568
$442
FY13 FY14 FY15 FY16
$ M
Free Cash Flow Cash Returned to Shareholders
Free Cash Flow (a non-GAAP measure) represents Operating Cash Flow from Continuing Operations less Capital Expenditures. See reconcilation on our
website (https://investors.thecloroxcompany.com/investors/financial-information/quarterly-results/default.aspx) and on slide 73.

Healthy Dividend Growth…
Dividends Have Increased Each Year Since 1977
0%
1%
2%
3%
4%
COTY KO KMB PG GIS K PEP KHC CLX CL HSY DPS CPB RB-GB NWL CHD EL
2.6% Peer Average: 2.5%
Dividend Yield as of Dec 31st, 2016

Long-Term Growth Algorithm Remains Unchanged
~80% of Clorox Sales
+2-4% annual growth
1.5 - 3.0 pts
company growth
U.S. Domestic
~20% of Clorox Sales
+5-7% annual growth
1.0 - 1.5 pts
company growth
International
Annual EBIT Margin Improvement: +25 to +50 bps
Annual Free Cash Flow: 10% to 12% of Sales
= +3 to +5pts company
growth

688 CLOROX
339 S&P 500
695 Peers
0
100
200
300
400
500
600
700
800
Dec96
Dec98
Dec00
Dec02
Dec04
Dec06
Dec08
Dec10
Dec12
Dec14
Dec16
CLX S&P 500 Peer Companies Average
TSR %
Strong Shareholder Return
Peer includes 13 companies: CPB, KMB, K, RB-GB, KO, GIS, NWL, EL, PEP, CHD, CL, PG and HSY
Total Shareholder Return
20 Year Ending 12/31/2016

Appendix
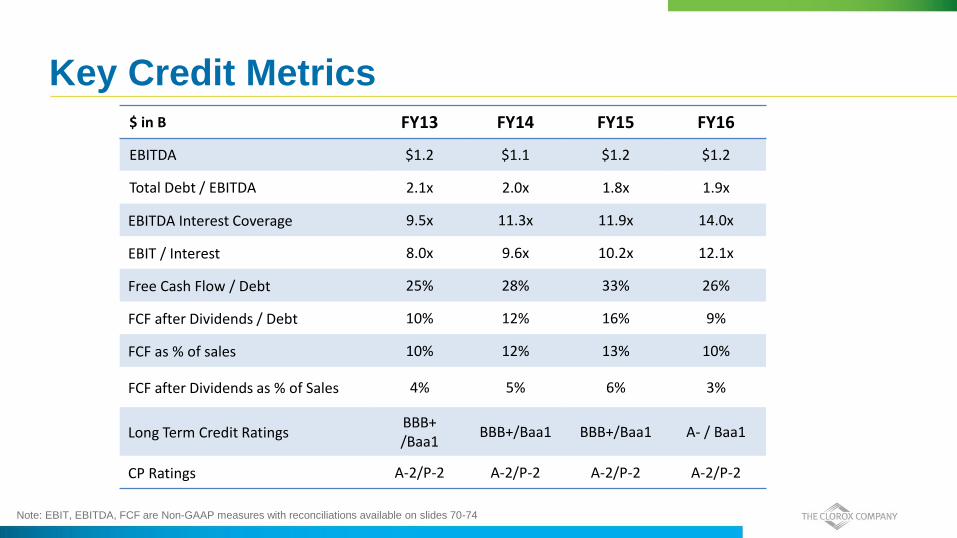
$ in B FY13 FY14 FY15 FY16
EBITDA $1.2 $1.1 $1.2 $1.2
Total Debt / EBITDA 2.1x 2.0x 1.8x 1.9x
EBITDA Interest Coverage 9.5x 11.3x 11.9x 14.0x
EBIT / Interest 8.0x 9.6x 10.2x 12.1x
Free Cash Flow / Debt 25% 28% 33% 26%
FCF after Dividends / Debt 10% 12% 16% 9%
FCF as % of sales 10% 12% 13% 10%
FCF after Dividends as % of Sales 4% 5% 6% 3%
Long Term Credit Ratings BBB+ /Baa1
BBB+/Baa1 BBB+/Baa1 A- / Baa1
CP Ratings A-2/P-2 A-2/P-2 A-2/P-2 A-2/P-2
Key Credit Metrics
Note: EBIT, EBITDA, FCF are Non-GAAP measures with reconciliations available on slides 70-74
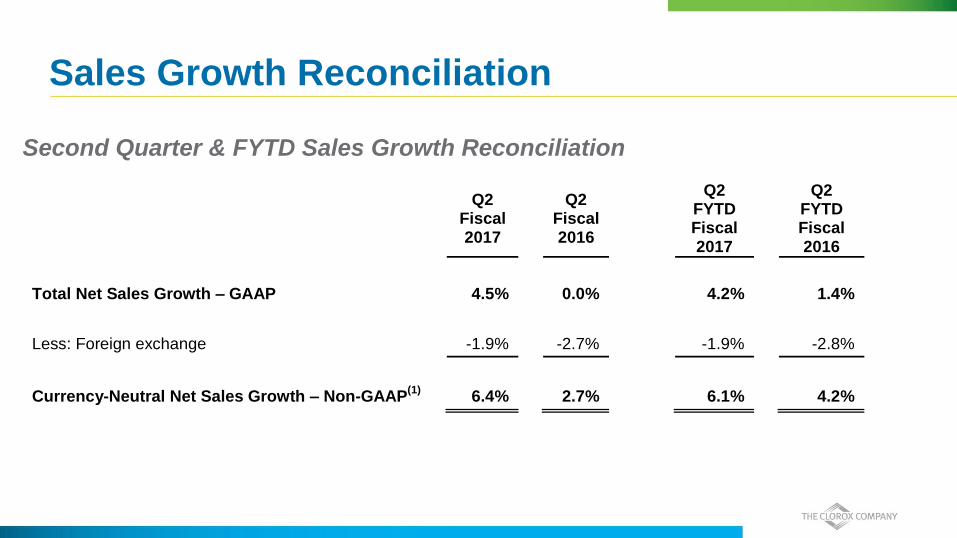
Sales Growth Reconciliation
Second Quarter & FYTD Sales Growth Reconciliation
Q2 Fiscal 2017
Q2
Fiscal 2016
Q2 FYTD Fiscal 2017
Q2 FYTD Fiscal 2016
Total Net Sales Growth – GAAP 4.5% 0.0% 4.2% 1.4%
Less: Foreign exchange -1.9% -2.7% -1.9% -2.8%
Currency-Neutral Net Sales Growth – Non-GAAP(1)
6.4% 2.7% 6.1% 4.2%
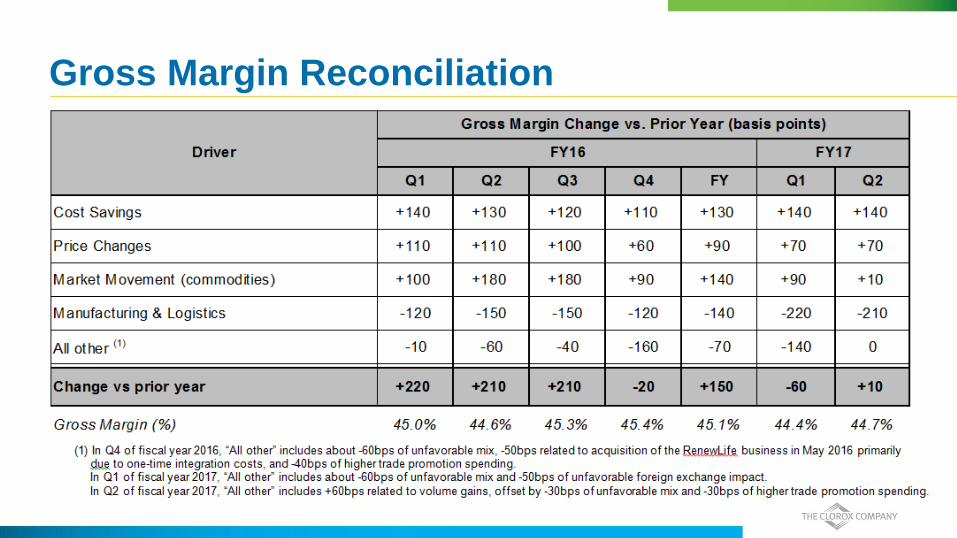
Gross Margin Reconciliation
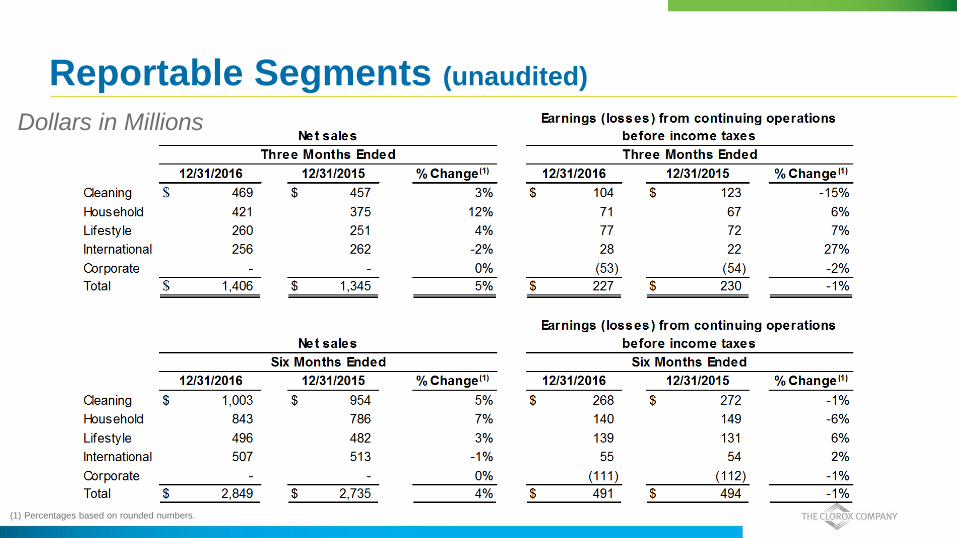
Reportable Segments (unaudited)
Dollars in Millions
(1) Percentages based on rounded numbers.

EBIT and EBITDA (unaudited)
Dollars in Millions
Footnotes on Slide 72

EBIT and EBITDA (unaudited)
Dollars in Millions
Footnotes on Slide 72

EBIT and EBITDA (unaudited)

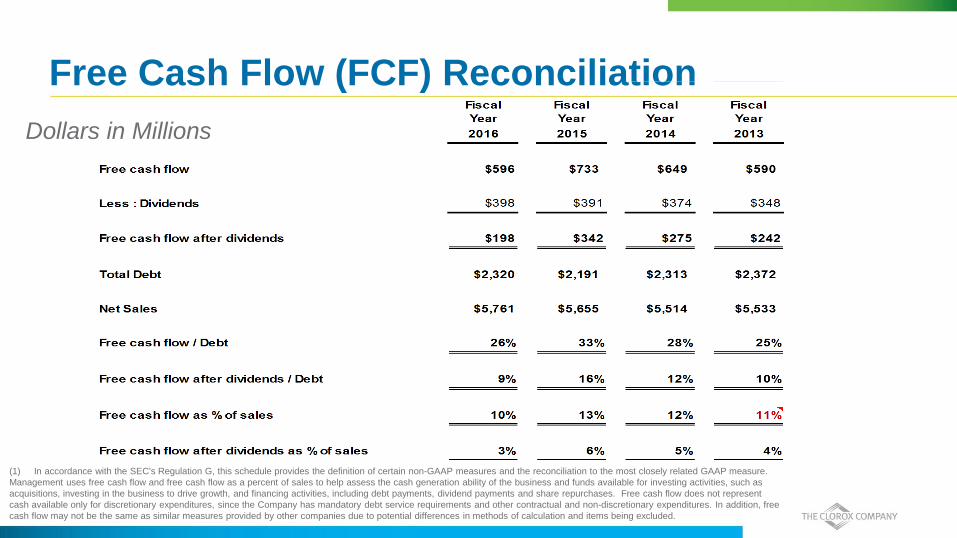
Free Cash Flow (FCF) Reconciliation
Dollars in Millions
(1) In accordance with the SEC's Regulation G, this schedule provides the definition of certain non-GAAP measures and the reconciliation to the most
closely related GAAP measure. Management uses free cash flow and free cash flow as a percent of sales to help assess the cash generation ability of the
business and funds available for investing activities, such as acquisitions, investing in the business to drive growth, and financing activities, including debt
payments, dividend payments and share repurchases. Free cash flow does not represent cash available only for discretionary expenditures, since the
Company has mandatory debt service requirements and other contractual and non-discretionary expenditures. In addition, free cash flow may not be the same
as similar measures provided by other companies due to potential differences in methods of calculation and items being excluded.
Free Cash Flow (FCF) Reconciliation
Dollars in Millions
(1) In accordance with the SEC's Regulation G, this schedule provides the definition of certain non-GAAP measures and the reconciliation to the most closely related GAAP measure.
Management uses free cash flow and free cash flow as a percent of sales to help assess the cash generation ability of the business and funds available for investing activities, such as
acquisitions, investing in the business to drive growth, and financing activities, including debt payments, dividend payments and share repurchases. Free cash flow does not represent
cash available only for discretionary expenditures, since the Company has mandatory debt service requirements and other contractual and non-discretionary expenditures. In addition, free
cash flow may not be the same as similar measures provided by other companies due to potential differences in methods of calculation and items being excluded.
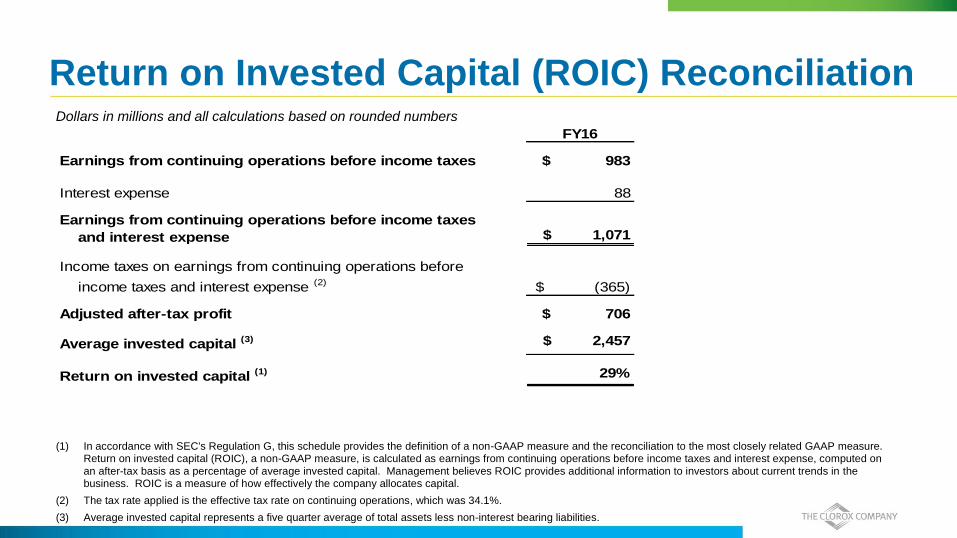
Return on Invested Capital (ROIC) Reconciliation Dollars in millions and all calculations based on rounded numbers
FY16
$ 983
88
$ 1,071
$ (365)
$ 706
$ 2,457
29%Return on invested capital (1)
Earnings from continuing operations before income taxes
Earnings from continuing operations before income taxes
and interest expense
Average invested capital (3)
Income taxes on earnings from continuing operations before
income taxes and interest expense (2)
Interest expense
Adjusted after-tax profit
(1) In accordance with SEC's Regulation G, this schedule provides the definition of a non-GAAP measure and the reconciliation to the most closely related GAAP measure. Return on invested capital (ROIC), a non-GAAP measure, is calculated as earnings from continuing operations before income taxes and interest expense, computed on an after-tax basis as a percentage of average invested capital. Management believes ROIC provides additional information to investors about current trends in the business. ROIC is a measure of how effectively the company allocates capital.
(2) The tax rate applied is the effective tax rate on continuing operations, which was 34.1%.
(3) Average invested capital represents a five quarter average of total assets less non-interest bearing liabilities.
(Amounts shown below are five quarter averages) FY16
Total assets 4,247$
Less: non-interest bearing liabilities (1,790)
Average invested capital 2,457$

Return on Invested Capital (ROIC) Reconciliation
Dollars in millions and all calculations based on rounded numbers
FY16
$ 983
88
$ 1,071
$ (365)
$ 706
$ 2,457
29%Return on invested capital (1)
Earnings from continuing operations before income taxes
Earnings from continuing operations before income taxes
and interest expense
Average invested capital (3)
Income taxes on earnings from continuing operations before
income taxes and interest expense (2)
Interest expense
Adjusted after-tax profit
(1) In accordance with SEC's Regulation G, this schedule provides the definition of a non-GAAP measure and the reconciliation to the most closely related GAAP measure. Return on invested capital (ROIC), a non-GAAP measure, is calculated as earnings from continuing operations before income taxes and interest expense, computed on an after-tax basis as a percentage of average invested capital. Management believes ROIC provides additional information to investors about current trends in the business. ROIC is a measure of how effectively the company allocates capital.
(2) The tax rate applied is the effective tax rate on continuing operations, which was 34.1%.
(3) Average invested capital represents a five quarter average of total assets less non-interest bearing liabilities.
(Amounts shown below are five quarter averages) FY16
Total assets 4,247$
Less: non-interest bearing liabilities (1,790)
Average invested capital 2,457$
Dollars in millions and all calculations based on rounded numbers