fy20 q3 financial results - mizuho financial group
TRANSCRIPT

FY20 Q3 Financial Results
February 2021

2
FY19 Q3
FYTD
FY20 Q3
FYTDYoY FY20 Q3 vs. FY20 Q2
1 1,517.8 1,621.8 +103.9 528.4 -6.7
2 Consolidated Gross Profits 1,512.5 1,619.5 +106.9 507.2 -35.5
3 Net Interest Income 554.9 649.6 +94.7 209.4 -15.5
4 478.2 512.0 +33.7 165.2 -11.3
5 479.4 457.9 -21.5 132.4 -8.6
6 90.0 39.5 -50.5 -5.7 -10.0
7 General and Administrative Expenses -1,023.5 -1,022.6 +0.9 -341.3 -0.5
8 475.5 610.7 +135.2 191.2 -7.9
9 470.2 608.4 +138.1 170.0 -36.7
10Consolidated Net Business Profits
from core business operations (9-6)380.1 568.9 +188.7 175.7 -26.6
11 Credit-related Costs -24.4 -98.1 -73.7 -16.9 +25.2
12 92.1 -33.0 -125.2 17.4 +66.3
13 97.3 -30.8 -128.2 38.6 +95.1
14 Equity in Income from Investments in Affiliates 24.1 17.1 -7.0 5.5 -0.1
15 Other -24.5 -36.2 -11.6 -11.9 +4.7
16 Ordinary Profits 561.5 448.8 -112.6 181.2 +89.0
17 Net Extraordinary Gains (Losses) -7.7 69.5 +77.3 3.7 -61.3
18 Income before Income Taxes 553.7 518.4 -35.3 185.0 +27.7
19 Income Taxes -140.8 -159.5 -18.7 -43.5 +18.9
20 Profit Attributable to Non-controlling Interests -8.9 -4.4 +4.4 -2.6 -0.9
21 Profit Attributable to Owners of Parent 403.9 354.4 -49.5 138.8 +45.7
Net Gains (Losses) related to Stocks
Consolidated Net Business Profits
+ Net Gains (Losses) related to ETFs and others
Consolidated Net Business Profits
Net Gains (Losses) related to Stocks
- Net Gains (Losses) related to ETFs and others
Consolidated Gross Profits
+ Net Gains (Losses) related to ETFs and others
Net Fee and Commission Income + Fiduciary Income
Net Trading Income + Net Other Operating Income
Net Gains (Losses) related to Bonds
* FY19 Q3 FYTD: JPY 5.2B, FY20 Q3 FYTD: JPY 2.2B, FY20 Q3: JPY 21.2B (vs. FY20 Q2: +JPY 28.7B)
Overview of Income Statement
(JPY B)
*
*
710.0
460.0
-200.0
0
350.0
Target
86%
97%
49%
-%
101%
Progress
*

3
1. GMC includes Net Gains (Losses) related to ETFs (2 Banks). FG Consolidated includes Net Gains (Losses) related to ETFs.
2. G&A Expenses (excl. Non-recurring Losses and others) – Amortization of Goodwill and others items.
3. New management accounting rules were applied in FY20. Figures for YoY are recalculated based on the new rules.
FG Consolidated
Gross Profits
G&A Expenses(excl. Non-recurring Losses
and others) Net Business Profits Net Income ROE
FY20 Q3
FYTDYoY
FY20 Q3
FYTDYoY
FY20 Q3
FYTDYoY
FY20 Q3
FYTDYoY
FY20 Q3
FYTD
473.8 -9.7 -474.0 +27.3 3.4 +15.4 5.2 +12.8 0.5%
342.1 +17.8 -155.4 +4.6 190.0 +24.4 77.5 -92.6 4.7%
332.4 +22.6 -182.0 -2.1 158.7 +20.4 91.9 -21.1 8.7%
422.5 +95.4 -157.5 -3.5 264.3 +92.1 175.8 +56.4 14.6%
36.2 -2.7 -23.8 +0.9 7.3 -1.8 3.3 -1.1 3.8%
Retail & Business Banking
Corporate & Institutional
(JPY B) Group aggregate, management accounting
1,621.8 +103.9 -1,019.0 +31.5 610.7 +135.2 354.4 -49.5 6.0%
Financial Results by In-house Company
1
3 3 3
11
3
2
Global Corporate
Global Markets
Asset Management

4
Leverage Ratio: 4.95% (+0.12%)
Liquidity Coverage Ratio
: 138.9% (+3.3%)
JGBs
Foreign Bonds
Japanese Stocks
JPY 20.4T
JPY 3.4T
JPY 12.2T
Cash and Due from Banks
USD 220.2B
JPY 123TJPY1
USD 278.0B
JPY 55TJPY
Non-JPY
1
1
1. Management basis, rounded figures. 2. Negotiable Certificates of Deposit. 3. Customer Deposits. 4. Due to the amendment of the notification of Japan FSA, deposits to BoJ has been excluded from Total
Exposure since Jun. 2020. (Before exclusion: Dec-20: 4.18%) 5. FY20 Q3 result, ( ) represents QoQ compared to FY20 Q2.
Floating-rate linked
JPY 53T(BK, Japan)
TimeDeposits
NCDs 2
JPY 109T(BK, Japan)
o/w individual deposits:
Approx. JPY 44T
Consolidated, ( ) represent changes from Mar-20
Risk Weighted Assets: JPY 66T (+JPY 3.9T)
Total Assets: JPY 217T (+JPY 3.2T)
JPY Loans JPY Deposits
Overview of Balance Sheet (Dec-20)
Loans
Securities
Deposits/NCDs
Other Liabilities
Net AssetsOther Assets
JPY 42.9T
JPY 83T(+JPY 0.1T)
JPY 42T(+JPY 7.4T)
JPY145T(+JPY 1.0T)
JPY 9T(+JPY 0.3T)
JPY 91T(-JPY 4.3T)
JPY 63T(+JPY 1.8T)
1 1
Liquid Deposits
BOJ current account balance
2 Banks: JPY 35T (+JPY 3.7T)
Prime-rate linked
Fixed
Loans to individuals,and other
1, 3Non-JPY
2
4
5

5
10.4 10.1 9.8 9.6 9.4 9.2 8.9 8.8
21.8 22.5 22.6 23.5 23.9 24.6 25.8 26.0
18.8 18.9 20.1 21.0 21.6 22.0 24.7 24.7
2.4 2.1 1.8 1.6 1.4 1.4
1.9 1.2
53.6 53.8 54.6 55.8 56.5 57.4
61.5 60.8
Sep-17 Mar-18 Sep-18 Mar-19 Sep-19 Mar-20 Sep-20 Dec-20
FY17
H1 H2
53.6 53.5
FY18
H1 H2
53.8 55.0
FY19
H1 H2
56.0 56.4
FY20
H1 Q3
61.0 61.1
0.64% 0.62% 0.60% 0.58%0.55% 0.54% 0.52% 0.54%
0.48% 0.48% 0.48% 0.47% 0.49% 0.49% 0.48% 0.48%
H1 H2 H1 H2 H1 H2 H1 Q3
Loans to Middle Market Firms & SMEs
Loans to Large Corporate Banking Clients
Loan Spread
0.86% 0.85% 0.83% 0.80% 0.78% 0.77% 0.73% 0.74%
0.86% 0.84% 0.82% 0.80% 0.78%0.76% 0.72% 0.74%
0.00% 0.00% 0.00% 0.00% 0.00% 0.00% 0.00% 0.00%
H1 H2 H1 H2 H1 H2 H1 Q3
Return on Loans and Bills Discounted ・・・ aLoan and Deposit Rate Margin ・・・ a - bCost of Deposits ・・・ b
1. Excluding loans to FG. Banking account. 2. Calculated by deducting “Housing and Consumer Loans” from “Loans to SMEs and Individual Customers”.
3. Housing and Consumer Loans. 4. Domestic Operations, excluding loans to financial institutions (including FG) and the Japanese Government & other public sector.
Individuals
Japanese
Gov. & other
public sector
Large
corporations
and other
entities
SMEsBK, management accounting
2 Banks2 BanksLoan Balance (Period-end Balance) Loan and Deposit Rate Margin
Avg.
Balance
1 4
Loans in Japan
2
3
(JPY T)
Q1 0.73%
Q2 0.72%
Q3 0.76%
Q4 0.76%
FY17 FY18 FY19 FY20
FY17 FY18 FY19 FY20

6
96.4 100.1119.3 112.6 117.5 117.1 122.6 115.1
67.569.4
70.0 75.879.9
99.5 90.286.9
35.039.4
46.1 52.756.0
62.2 62.3
59.6
198.9208.9
235.4241.1
253.5
278.8 275.1
261.6
Sep-17 Mar-18 Sep-18 Mar-19 Sep-19 Mar-20 Sep-20 Dec-20
FY17
H1 H2
202.5 207.4
FY18
H1 H2
227.6 244.0
FY19
H1 H2
248.5 260.0
FY20
H1 Q3
286.8 268.2
Loan Spread1, 2
0.89% 0.90%
0.84%
0.80% 0.81%0.82%
0.89%
0.97%
H1 H2 H1 H2 H1 H2 H1 Q3
2.03%2.24%
2.67%2.91% 2.87%
2.46%
1.56%
1.33%
0.95% 1.03% 0.98% 0.89% 0.90% 0.91%1.04% 1.09%
1.08%1.21%
1.68%2.01% 1.97%
1.55%
0.52%0.24%
H1 H2 H1 H2 H1 H2 H1 Q3
Return on Loans and Bills Discounted ・・・ aLoan and Deposit Rate Margin ・・・ a - bCost of Deposits ・・・ b
Avg.
Balance
(USD B)
EMEA
Americas
Asia
Loan and Deposit Rate Margin
BK, management accounting
BK, OverseasBK, management accounting Loan Balance (Period-end Balance)
1. BK (including the subsidiaries in China, the US, the Netherlands, Indonesia, Malaysia, Russia, Brazil and Mexico) 2. Figures including past figures are recalculated based on the FY20 planned rate in USD.
1, 2
Loans outside Japan
Q1 1.04%
Q2 1.01%
Q3 0.89%
Q4 0.92%
FY17 FY18 FY19 FY20
FY17 FY18 FY19 FY20

7
Non-JPY Customer Deposits
Non-JPY Loans
243.2271.8
307.5 297.0 278.0
178.3 200.8230.5 247.5
211.8
73%74% 75%
83%76%
Mar-18 Mar-19 Mar-20 Sep-20 Dec-20
Non-JPY Assets and Funding (Dec-20)
62.541.2
84.7119.6
79.7
278.0
211.8
Assets Funding 0
20
40
60
80
18/03末 19/03末 20/03末
BK , management accounting
1. Including the banking subsidiaries in China, the US, the Netherlands, Indonesia and other.
2. Changed management accounting rules in FY20. Figures including past figures are recalculated based on the FY20 planned rate in USD.
3. Including Non-JPY loans/deposits in Japan.
Mar-18 Mar-19 Mar-20 Dec-20
2, 3
2, 3
(USD B)
• Repos
• Interbank
• Central Banks and
other
• Corporate Bonds
• Currency Swaps and
otherSecurities
Market
Operations
Medium and LT Funding
Customer
Deposits
Loans
(USD B) 1
Reference: 5 Year Currency Swap Rates (USD/JPY)
Trends in Non-JPY Loans and Deposits
(bps)
438.8
Non-JPY Funding
438.8
Other
CD/CP
BK , management accounting1
Source: Bloomberg
Proportion of Deposits to Loans

8
48 33 29
3940 37
160 169 187
191 194209
283 263271
FY18 Q3 FY19 Q3 FY20 Q3
Non Interest Income (Customer Groups)
o/w Loan upfront fee: 25 (+0)
o/w DCM : 22 (+7)
o/w ECM : 7 (+4)
RBC
CIC
GCC
AMC
Other
(JPY B) Figures in ( ) represents YoY
Group aggregate, management accounting (rounded figures)
Settlement & FX: 64 (-4)
Solutions Business : 58 (-6)
EMEA: 32 (+4)
Solutions Business : 122 (+14)
Derivatives and other: 40 (-8)
Non-interest Income
Individual Asset Formation : 109 (+26)
Settlement & FX: 48 (-2)
Derivatives and other: 39 (+3)
Americas: 89 (+18)
1
Asia: 66 (-4)
1. New management accounting rules were applied in FY20. Recalculated past figures based on FY20 planned rate and other factors such as expansion and refinement of range of consolidated
subsidiaries under management accounting. The original figures before the recalculation were FY18 Q3 FYTD: JPY 720B and FY19 Q3 FYTD: JPY 703B.
2. BK investment trusts, annuities + SC individual segment, PB segment. 3. Including fee related to investment banking business and real estate brokerage.
3
721699
733
3
2
271 (+8)
209 (+15)
37 (-3)
187 (+18)
29 (-4)
o/w Loan upfront fee: 15 (+4)
+ 34
FYTD FYTD FYTD

9
System maintenance cost controland other:
(JPY B)
-27.31,048.7
RBC CIC GCC GMC AMC
1,013.2
RBC : Decrease in headcount, structural
reform of IT systems and other
CIC : Non-Personnel expenses and other
GMC : Personnel expenses outside Japan
and other
53.0 49.9 46.6
518.9 503.6 489.0
515.5506.9
492.5
FY18 Q3 FY19 Q3 FY20 Q3
1. G&A Expenses (excl. Non-recurring Losses and others) – Amortization of Goodwill and other items.
2. Difference between financial and management accounting is due to the range of consolidated subsidiaries calculated and adjustments of intercompany transactions and other.
Reference:
Personnel
Non-Personnel
Miscellaneous
Taxes
(JPY B)
General and Administrative Expenses (Excl. Non-recurring losses)
General and Administrative Expenses
(-7.8)
-32.2
1,087.4
1,028.21,060.5
General and
Administrative Expenses1,069.8 1,023.5 1,022.6
o/w Non-recurringLosses
-17.6 -36.9 -5.5
Amortization of Goodwill
and other items10.1 9.9 9.1
2
Breakdown by In-house Company 1
2
Non-Personnel cost control and other:
FY19 Q3
FYTD
FY20 Q3
FYTDYoY
RBC 501.4 474.0 -27.3
CIC 159.9 155.4 -4.6
GCC 179.9 182.0 2.1
GMC 154.0 157.5 3.5
AMC 24.7 23.8 -0.9
Group aggregate, management accounting Figures in ( ) represent YoY
Consolidated
(-11.2)
FYTD FYTD FYTD
-4.6+2.1
+3.5 -0.9 -8.2
FY19 Q3
FYTD
FY20 Q3
FYTD
Other
Amortization of the
New Core Banking System and
other: (+5.8)
10
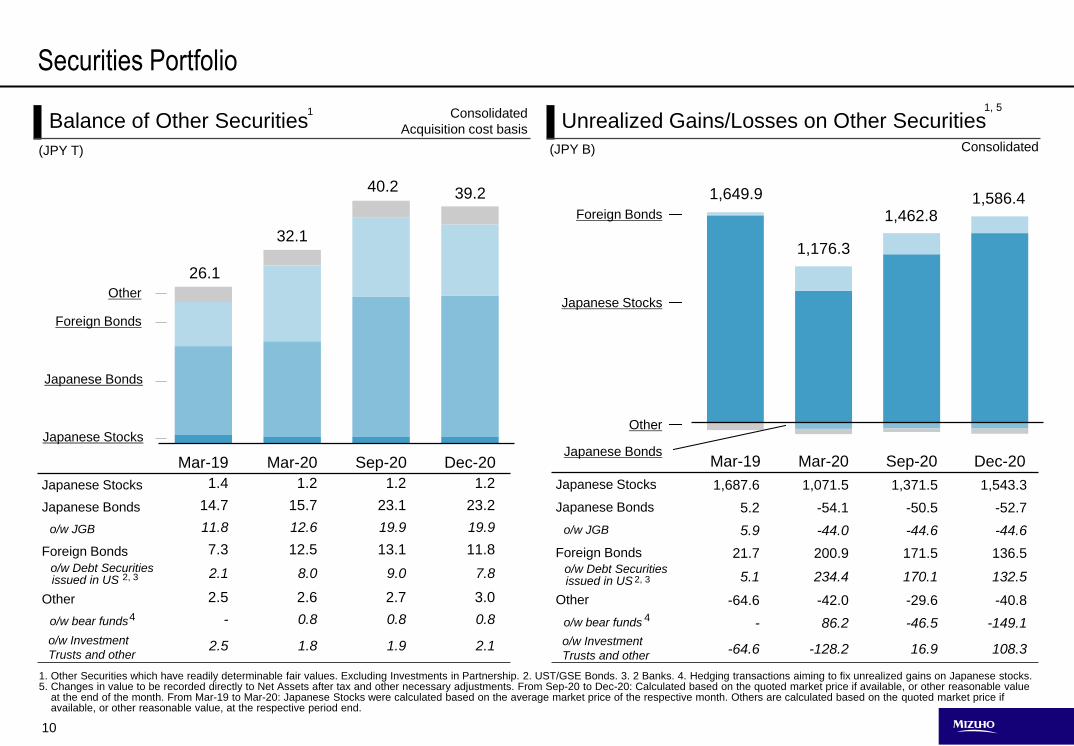
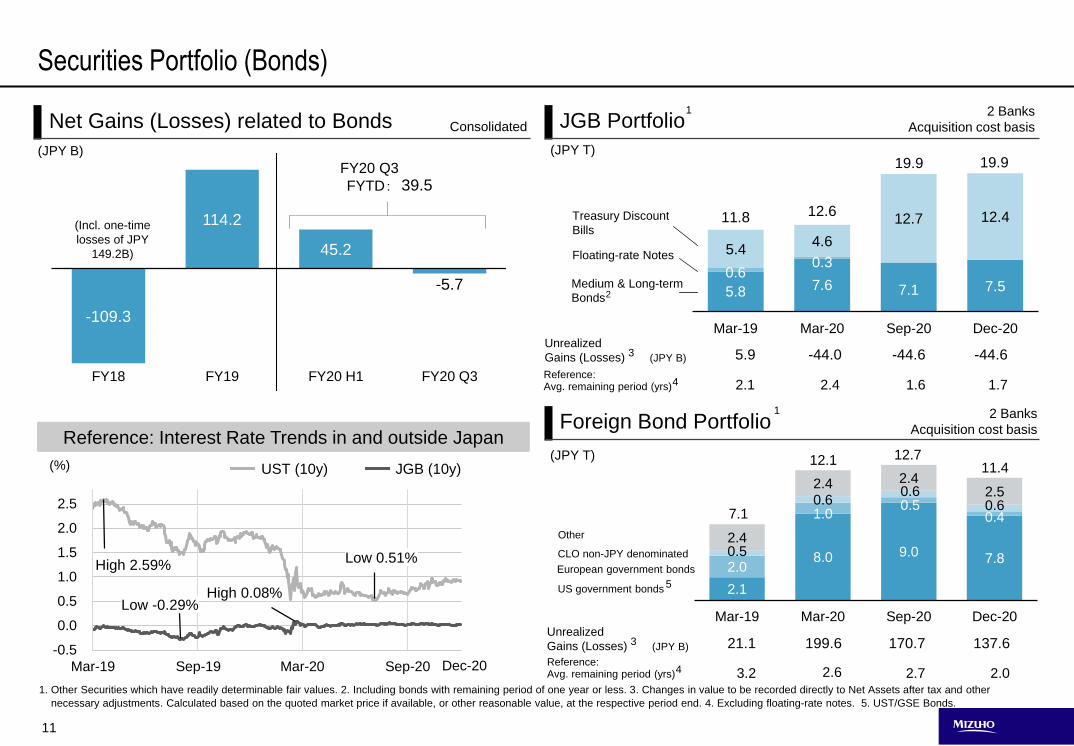
(JPY T)
Mar-19 Mar-20 Sep-20 Dec-20 Mar-19 Mar-20 Sep-20 Dec-20
1. Other Securities which have readily determinable fair values. Excluding Investments in Partnership. 2. UST/GSE Bonds. 3. 2 Banks. 4. Hedging transactions aiming to fix unrealized gains on Japanese stocks. 5. Changes in value to be recorded directly to Net Assets after tax and other necessary adjustments. From Sep-20 to Dec-20: Calculated based on the quoted market price if available, or other reasonable value
at the end of the month. From Mar-19 to Mar-20: Japanese Stocks were calculated based on the average market price of the respective month. Others are calculated based on the quoted market price ifavailable, or other reasonable value, at the respective period end.
Japanese Bonds
(JPY B)
Consolidated
Acquisition cost basis
Securities Portfolio
Balance of Other Securities Unrealized Gains/Losses on Other Securities1 1, 5
Consolidated
Japanese Stocks 1.4 1.2 1.2 1.2
Japanese Bonds 14.7 15.7 23.1 23.2
o/w JGB 11.8 12.6 19.9 19.9
Foreign Bonds 7.3 12.5 13.1 11.8
o/w Debt Securitiesissued in US
2.1 8.0 9.0 7.8
Other 2.5 2.6 2.7 3.0
o/w bear funds - 0.8 0.8 0.8
o/w Investment
Trusts and other2.5 1.8 1.9 2.1
Japanese Stocks 1,687.6 1,071.5 1,371.5 1,543.3
Japanese Bonds 5.2 -54.1 -50.5 -52.7
o/w JGB 5.9 -44.0 -44.6 -44.6
Foreign Bonds 21.7 200.9 171.5 136.5 o/w Debt Securitiesissued in US 5.1 234.4 170.1 132.5
Other -64.6 -42.0 -29.6 -40.8
o/w bear funds - 86.2 -46.5 -149.1
o/w Investment
Trusts and other-64.6 -128.2 16.9 108.3
2, 3
4
Japanese Bonds
Foreign Bonds
Other
Japanese StocksOther
2, 3
4
26.1
32.1
39.240.21,649.9
1,176.3
1,462.81,586.4
Foreign Bonds
Japanese Stocks
11
5.8 7.6 7.1 7.50.6
0.35.4
4.6
12.7 12.411.8 12.6
19.9 19.9
Mar-19 Mar-20 Sep-20 Dec-20
2.1
8.0 9.0 7.8 2.0
1.0 0.5
0.4
0.5
0.6 0.6
0.6
2.4
2.4 2.4 2.5
7.1
12.1 12.7 11.4
Mar-19 Mar-20 Sep-20 Dec-20
-0.5
0.0
0.5
1.0
1.5
2.0
2.5
Mar-19 Sep-19 Mar-20 Sep-20
-109.3
114.2
45.2
-5.7
FY18 FY19 FY20 H1 FY20 Q3
JGB PortfolioNet Gains (Losses) related to Bonds
US government bonds
European government bonds
CLO non-JPY denominated
Other
Unrealized
Gains (Losses) (JPY B)
Reference: Avg. remaining period (yrs)
3
4
Medium & Long-term
Bonds2
2 Banks
Acquisition cost basis
2 Banks
Acquisition cost basis
Consolidated
Unrealized
Gains (Losses) (JPY B)
Reference: Avg. remaining period (yrs)
3
(Incl. one-time
losses of JPY
149.2B)
Treasury Discount
Bills
Floating-rate Notes
(JPY T)
(JPY T)
Foreign Bond PortfolioReference: Interest Rate Trends in and outside Japan
Securities Portfolio (Bonds)
5.9 -44.0 -44.6
(%)
1
4
1. Other Securities which have readily determinable fair values. 2. Including bonds with remaining period of one year or less. 3. Changes in value to be recorded directly to Net Assets after tax and other
necessary adjustments. Calculated based on the quoted market price if available, or other reasonable value, at the respective period end. 4. Excluding floating-rate notes. 5. UST/GSE Bonds.
High 2.59%Low 0.51%
High 0.08%Low -0.29%
21.1 170.7199.6
(JPY B)
-44.6
137.6
2.1 2.4 1.6 1.7
3.2 2.6 2.7 2.0
5
UST (10y) JGB (10y)
1
FY20 Q3
FYTD:
Dec-20
39.5

12
Japanese Stock Portfolio
14,000
16,000
18,000
20,000
22,000
24,000
26,000
28,000
Mar-19 Sep-19 Mar-20 Sep-20
12.2 15.6
14.9
10.6
-19.0
21.2
-5.7 -41.6
-62.6
FY18 FY19 FY20 H1 FY20 Q3
1,419.8
1,272.01,211.5 1,201.0
Mar-19 Mar-20 Sep-20 Dec-20
(JPY B)
1,071.5
1,174.4
-102.9
1,687.6
1,748.9
-61.3
1,371.5
1,436.8
-65.3
1,543.3
1,617.2
-73.8
Unrealized
Gains (Losses)
Net Gains (Losses) related to Stocks
Net Gains
related to ETFs
and others
Target -JPY 300B
Basic
Policy
Reduction
Plan
Consolidated
Acquisition cost basisConsolidated
Securities Portfolio (Stocks)
3
1. Net Gains (Losses) on sale of stocks + Gains (Losses) on Derivatives. 2. Other Securities which have readily determinable fair values. 3. Changes in value to be recorded directly to Net Assets after tax and
other necessary adjustments. Based on the average market price of the respective month and other.
2
Policy for cross-shareholdings reduction
397億円
13%
Unless we consider these holdings to be meaningful, we will
not hold the shares, which reflects the potential impact on our
financial position associated with stock market volatility risk.
Even though we consider the holdings to be meaningful, we
will also reduce them through dialogue with the issuing
companies.
Reference: Nikkei 225
Impairment
(Devaluation)
Net Gains
(Losses) of
sales1
Progress of
reduction -JPY 218.8B
Progress rate 72 %(by Mar-22) (Compared to Mar-19)
o/w gains
o/w losses
168.1
274.8
137.1
FY20 Q3 FYTD: -30.8
38.6
-69.4
-218.8
-71.0o/w amount of sales -32.1
o/w impairment loss -52.3
Dec-20
JPY 16,553
JPY 27,568
(JPY B)
265.6
168.1
o/w amount of sales -144.3
o/w impairment loss -91.6
1.8

13
0.61
0.70
0.78 0.80
0.70%0.75% 0.82% 0.86%
Mar-19 Sep-19 Mar-20 Dec-20
NPL Ratio
与信関係費用比率
-19.5(-2bps)
-171.7(-18bps)
-98.1(-10bps)
FY18 FY19 FY20 Q3
(JPY T)(JPY B)
Asia
Figures in ( ) represent Credit-related Costs Ratio
1. Ratio of Credit-related Costs against Total Claims (based on the Financial Reconstruction Act (FRA)). Ratio of Credit-related Costs against Total Claims (including Trust Account). 2. Figures before FY13 was calculated by using Total Claims of aggregate for ex-BK, ex-CB and ex-TB on a non-consolidated basis. 3. Representative main branch basis.
Banking account + Trust account
Consolidated ConsolidatedNon Performing Loans based on FRACredit-related Costs
Asset Quality
1
Japan
AmericasEMEA
3
3
3
3
FY20 estimate
-200.0
Recorded reserves
from a forward-looking
perspective
-37.5
RBC
CIC
GCC
: -36.3
: -45.4
: -14.5
-80.4
o/w Q3
-16.6
-2.7
+2.9
0
0.5
1
1.5
不良債権比率NPL Ratio 1.5
1
0.5
0
1.5
1
0.5
0FY20
estimateFY08
20
0
-20
-40
-536.7
(-68bps)
(JPY T)(bps) (%)(JPY B)
Past figuresReferencePast figuresReference
Mar-09 Dec-20
2
2.0
1.0
0.0
200
0
-200
-400Credit-related Costs
1, 2
FY20 Q3
FYTD
Banking account + Trust account
FY19 Q3FY18 Q3
FYTD

14
77%77%
76%
75%
0.6% 0.5%0.7% 0.7%
Mar-19 Mar-20 Sep-20 Dec-20
Investment Grade and equivalentratio
NPL Ratio
0% 20% 40% 60% 80% 100%
Asia/Oceania44%
Americas33%
EMEA23%
Non-Japanese65%
Japanese 35%
Hong Kong25%
Singapore17%
Australia10%
Thailand9%
Taiwan9%
China9%
SouthKorea
6%India5% 3%
Other7%
General Corporate
Non-Japanese 92%
1. Including banking subsidiaries outside Japan. 2. Financial Institutions.
BKGCC management accounting basis
Quality of Loan PortfolioTotal: USD 261.6B
Asia/Oceania:
USD 115.1B
Hong Kong: USD 28.5B China: USD 10.5B
Loan Portfolio Outside Japan (Dec-20)
Loan Portfolio Outside Japan
Chinese Non-Chinese
General Corporate
Non-Japanese 63% Japanese 37%
Hong Kong Non-Hong Kong
Japanese 8%
0% 20% 40% 60% 80% 100%
1
FI2
FI2
Indonesia

15
(JPY B)
4.42%
4.08%
4.83%4.95%
Mar-19 Mar-20 Sep-20 Dec-20
144.3%
137.3%135.6%
138.9%
FY18 Q4 FY19 Q4 FY20 Q2 FY20 Q3
12.76%11.65% 11.57% 11.62%
18.85%
17.25% 17.28% 17.11%
Mar-19 Mar-20 Sep-20 Dec-20
Liquidity Coverage Ratio (LCR)
1. Common Equity Tier 1 Capital. 2. Additional Tier 1 Capital. 3. Excluding Net Unrealized Gains (Losses) on Other Securities.
4. Due to the amendment of the notification of Japan FSA, deposits to BoJ has been excluded from Total Exposure since Sep. 2020. (Before exclusion: Sep-20: 4.07%, Dec-20: 4.18%)
(JPY B)
[Excluding Net
Unrealized Gains
(Losses) on Other
Securities]
CET1
Tier 1
Total
Consolidated
Capital Ratio
(JPY B)
Consolidated Consolidated
CET1 Capital 7,390.0 7,244.7 7,452.6 7,684.1
AT1 Capital 1,842.1 1,779.6 2,014.8 1,859.6
Tier 1 Capital 9,232.1 9,024.4 9,467.5 9,543.7
Tier 2 Capital 1,685.3 1,697.8 1,665.2 1,772.4
Total Capital 10,917.5 10,722.2 11,132.7 11,316.1
Risk Weighted
Assets57,899.5 62,141.2 64,404.9 66,124.7
8.2% 8.8% 8.8% 8.9%CET1 Capital Ratio(Basel III Finalization basis)
Leverage Ratio
Tier 1 Capital 9,232.1 9,024.4 9,467.5 9,543.7
Total Exposures 208,557.4 220,977.5 195,811.7 192,563.4
Total HQLA 59,797.1 60,112.7 66,704.5 71,926.7
Net Cash Outflows 41,447.8 43,816.7 49,157.7 51,806.2
4
Basel Regulatory Disclosures (1)
1
2
[11.00%][10.54%]
[10.84%] [10.61%]
14.52% 14.69%15.94%
14.43%
3

16
Mar-19 Sep-20 Dec-20Jun-20Mar-20
• Decrease in low profitability loans
• Optimized market-related assets
• Refined risk measurement method
- Increase in RWA primarily from providing financing to support clients’ funding under the COVID-19 pandemic
- Some corporates outside Japan switched to direct funding from the capital market
- Funding support continued from March tempered off in this period
- RWA control
- CET1 has steadily improved due to accumulation of profits
- Continue RWA control
CET1 capital ratio (Basel III finalization basis, excluding Net Unrealized Gains (Losses) on Other Securities)
Basel Regulatory Disclosures (2)
8.8%
8.6%
8.8%
8.9%
8.2%

17
0.2 0.5 0.8 0.9 1.0 1.1 1.2 1.3 1.3
0.1
1.6
2.4
3.0 2.93.1 2.8
2.9 2.8 2.7
1.7
2.4
2.2
1.51.9 1.5
1.21.2 1.3 1.1
1.8
4.3
5.1 5.2
5.6 5.6
5.15.3 5.3
5.1
Mar-20 Jun-20 Sep-20 Dec-20
COVID-19-related loans (period-end balance)
1. BK, YoY (Q3 FYTD). 2. Total of address changes and reissuance of cards and bankbooks.
(JPY T)
management accounting
- Ensuring business continuity as a provider of financial
infrastructure, an essential part of society, while strengthening
infection prevention against COVID-19.
- Thoroughly utilizing remote work from home and satellite offices
(9 locations) which utilize branches, and split operation mainly for
the Head Office.
Reduction in staff -50%
Completion of transaction with
tabletsAll 348 branches
Reference: Initiatives responding to COVID-19
Ensuring business continuity in light of our role in financial
infrastructureLeveraging financial intermediary functions and other
Outside
Japan
CIC
RBC
In
Japan
BK
No.1
Preventing infections at branches
Increasing digital transactions
Bank account openings
(via mobile app)+73%
Investment trust contracts
(via online) +40%
Other requests (via online) +31%2
- Support clients’ business structure transformation with an eye
towards the post-COVID-19 world, by leveraging the strengths of
collaboration across BK, TB, and SC and industry insight.
- Steadily support clients whose business performance and funding
are expected to be negatively impacted by the re-expansion of
COVID-19.

18
RBC : Retail & Business Banking Company
CIC : Corporate & Institutional Company
GCC : Global Corporate Company
GMC : Global Markets Company
AMC : Asset Management Company
GPU : Global Products Unit
RCU : Research & Consulting Unit
FYTD : Fiscal year to date
FG : Mizuho Financial Group, Inc.
BK : Mizuho Bank, Ltd.
TB : Mizuho Trust & Banking Co., Ltd.
SC : Mizuho Securities Co., Ltd.
AM One : Asset Management One Co., Ltd.
IR : Mizuho Information & Research Institute, Inc.
RI : Mizuho Research Institute Ltd.
Definitions
Abbreviations
Definitions
- 2 Banks : BK + TB on a non-consolidated basis (financial accounting).
- Group aggregate : BK + TB + SC + AM One + other major subsidiaries on a non-consolidated basis (management accounting).
- Company management basis : Figure of the respective in-house company (management accounting).
- Consolidated Net Business Profits : Consolidated Gross Profits – G&A Expenses (excl. Non-Recurring Losses).
+ Equity in Income from Investments in Affiliates and certain other consolidation adjustments.
- Net Business Profits by In-house Company : Gross Profits - G&A Expenses (excluding Non-Recurring Losses)
+ Equity in Income from Investments in Affiliates - Amortization of Goodwill and other items.
- Net Gains (Losses) related to ETFs and others : Net Gains (Losses) related to ETFs (2 Banks) + Net Gains on Operating Investment Securities (SC Consolidated).
- Net Income Attributable to FG : Profit Attributable to Owners of Parent.
- Internal risk capital : Risk capital calculated taking account of factors such as regulatory risk-weighted assets (RWA) and interest rate
risk in the banking account (management accounting).
- Consolidated ROE : Calculated dividing Net Income by (Total Shareholders’ Equity + Total Accumulated Other Comprehensive Income
(excluding Net Unrealized Gains (Losses) on Other Securities)).
- ROE by In-house Company : Calculated dividing Net Income by each company’s internal risk capital.
- : Net Unrealized Gains (Losses) on Other Securities and its associated Deferred Gains or Losses on
Hedges are excluded from the numerator and RWA associated with Net Unrealized Gains (Losses)
on Other Securities (stocks) are excluded from the denominator. Includes the effect of partially fixing
unrealized gains on Japanese stocks through hedging transactions.
: Basel lll finalization fully-effective basis. In addition to the above adjustment, the capital floor is also calculated
after deducting the associated reserves from RWA using the standard approach.
CET1 Capital Ratio (current regulations basis,
excluding Net Unrealized Gains (Losses) on
Other Securities)
- CET1 Capital Ratio (Basel III finalization basis,
excluding Net Unrealized Gains (Losses) on
Other Securities)

19
Management accounting (Revised planned rate)Financial accounting (TTM at the respective period end)
This presentation contains statements that constitute forward-looking statements within the meaning of the United States Private Securities Litigation Reform Act of 1995,
including estimates, forecasts, targets and plans. Such forward-looking statements do not represent any guarantee by management of future performance.
In many cases, but not all, we use such words as “aim,” “anticipate,” “believe,” “endeavor,” “estimate,” “expect,” “intend,” “may,” “plan,” “probability,” “project,” “risk,” “seek,”
“should,” “strive,” “target” and similar expressions in relation to us or our management to identify forward-looking statements. You can also identify forward-looking statements
by discussions of strategy, plans or intentions. These statements reflect our current views with respect to future events and are subject to risks, uncertainties and
assumptions.
We may not be successful in implementing our business strategies, and management may fail to achieve its targets, for a wide range of possible reasons, including, without
limitation: impact of the corona virus pandemic; incurrence of significant credit-related costs; declines in the value of our securities portfolio; changes in interest rates; foreign
currency fluctuations; decrease in the market liquidity of our assets; revised assumptions or other changes related to our pension plans; a decline in our deferred tax assets;
impairment of the carrying value of our long-lived assets; problems related to our information technology systems, including as a result of cyber attacks; the effect of financial
transactions entered into for hedging and other similar purposes; failure to maintain required capital adequacy ratio levels and meet other financial regulatory requirements;
downgrades in our credit ratings; our ability to avoid reputational harm; our ability to implement our 5-Year Business Plan and implement other strategic initiatives and
measures effectively; the effectiveness of our operational, legal and other risk management policies; the effect of changes in general economic conditions in Japan and
elsewhere; and changes to applicable laws and regulations.
Further information regarding factors that could affect our financial condition and results of operations is included in “Item 3.D. Key Information—Risk Factors” and “Item 5.
Operating and Financial Review and Prospects” in our most recent Form 20-F filed with the U.S. Securities and Exchange Commission (“SEC”) and our report on Form 6-K
furnished to the SEC on December 28, 2020, both of which are available in the Financial Information section of our web page at www.mizuho-fg.com/index.html and also at
the SEC’s web site at www.sec.gov.
We do not intend to update our forward-looking statements. We are under no obligation, and disclaim any obligation, to update or alter our forward-looking statements,
whether as a result of new information, future events or otherwise, except as may be required by the rules of the Tokyo Stock Exchange.
Dec-19 Mar-20 Dec-20
USD/JPY 109.55 108.83 103.52
EUR/JPY 122.51 119.65 126.99
FY20
USD/JPY 107.00
EUR/JPY 126.36
Foreign exchange rate