fy2016 analysis of revenue and expenditure
TRANSCRIPT
ANALYSIS OF REVENUE
AND EXPENDITURE Financial Year 2016
Distributed on Budget Day: 24 March 2016 __________________

EXPLANATORY NOTES This document summarises and provides relevant highlights of the FY2016 Revenue and Expenditure Estimates presented to Parliament on 24 March 2016.
ANALYSIS OF REVENUE AND EXPENDITURE
1 UPDATE ON FINANCIAL YEAR 2015 1
1.1 Expected Budget Outturn for FY2015 1
1.2 Operating Revenue 1
1.3 Total Expenditure 1
1.4 Special Transfers 2
1.5 Net Investment Returns Contribution 2
1.6 Spending from Endowment and Trust Funds 2
2 OUTLOOK FOR FINANCIAL YEAR 2016 6
2.1 Budget for FY2016 6
2.2 Operating Revenue 6
2.3 Total Expenditure 8
2.4 Special Transfers 10
2.5 Fiscal Impulse 12
STATISTICAL ANNEX 13
Table 3.1a: Overall Fiscal Position for FY2010 to FY2016 ($ million) 14
Table 3.1b: Overall Fiscal Position for FY2010 to FY2016 (% of GDP) 14
Table 3.2a: Revenue Collections for FY2010 to FY2016 ($ million) 15
Table 3.2b: Revenue Collections for FY2010 to FY2016 (% of GDP) 15
Table 3.3: Breakdown of Total Expenditure by Sector for FY2015 and FY2016 ($ million) 16
Table 3.4: Operating Expenditure by Sector for FY2010 to FY2016 ($ million) 17
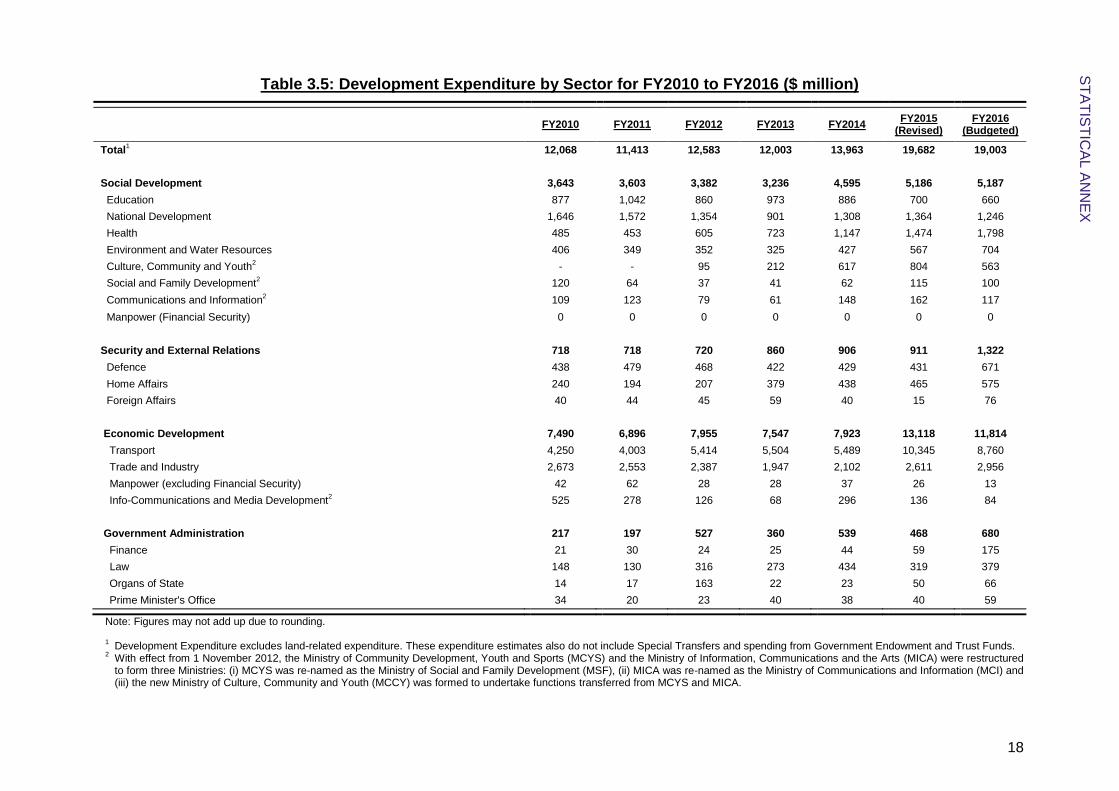
Table 3.5: Development Expenditure by Sector for FY2010 to FY2016 ($ million) 18
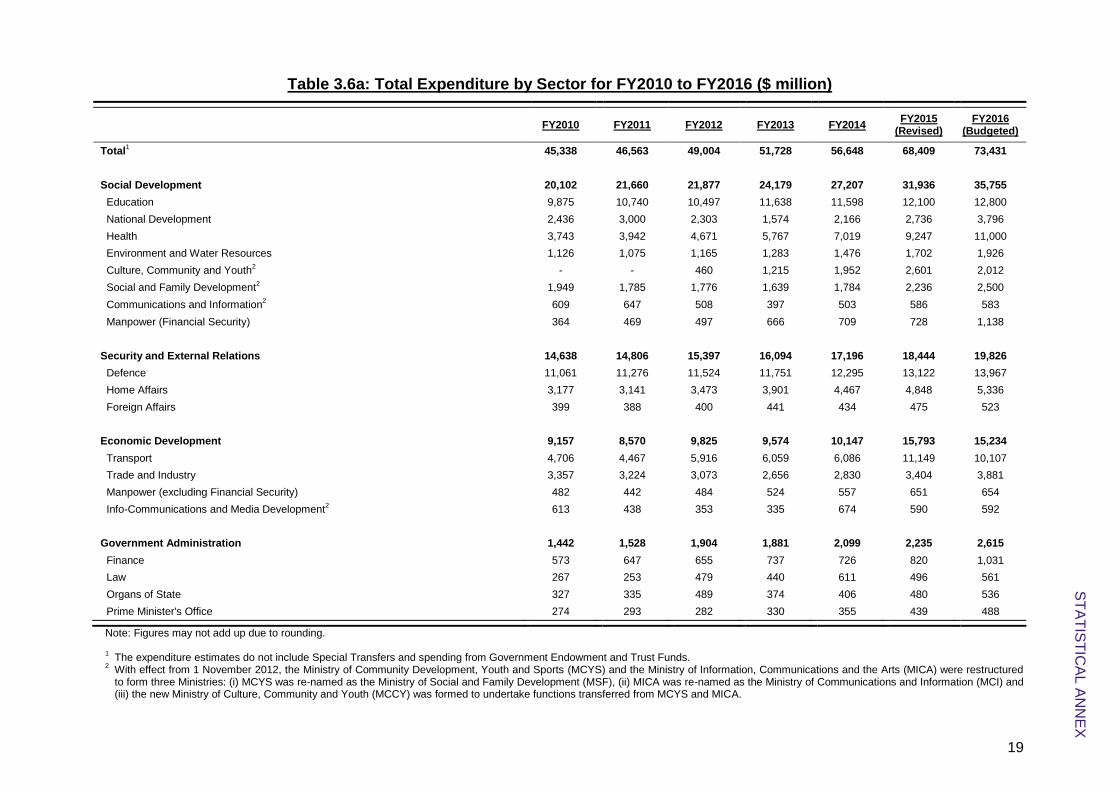
Table 3.6a: Total Expenditure by Sector for FY2010 to FY2016 ($ million) 19
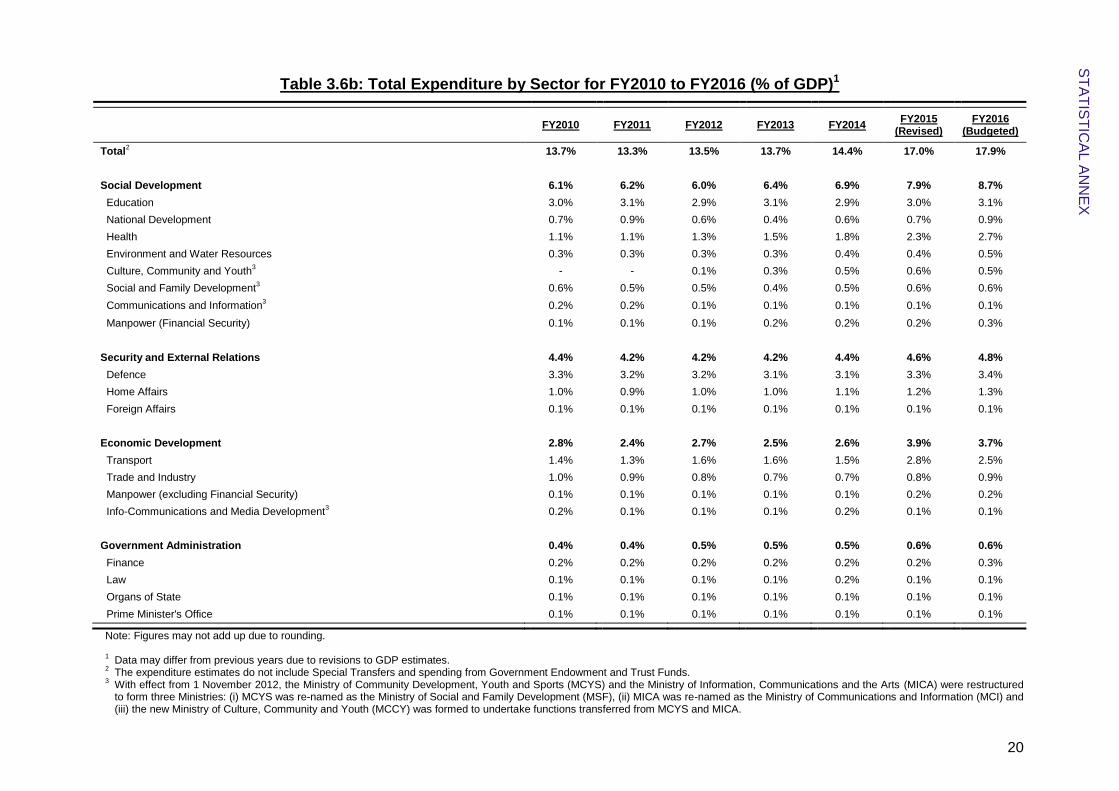
Table 3.6b: Total Expenditure by Sector for FY2010 to FY2016 (% of GDP) 20
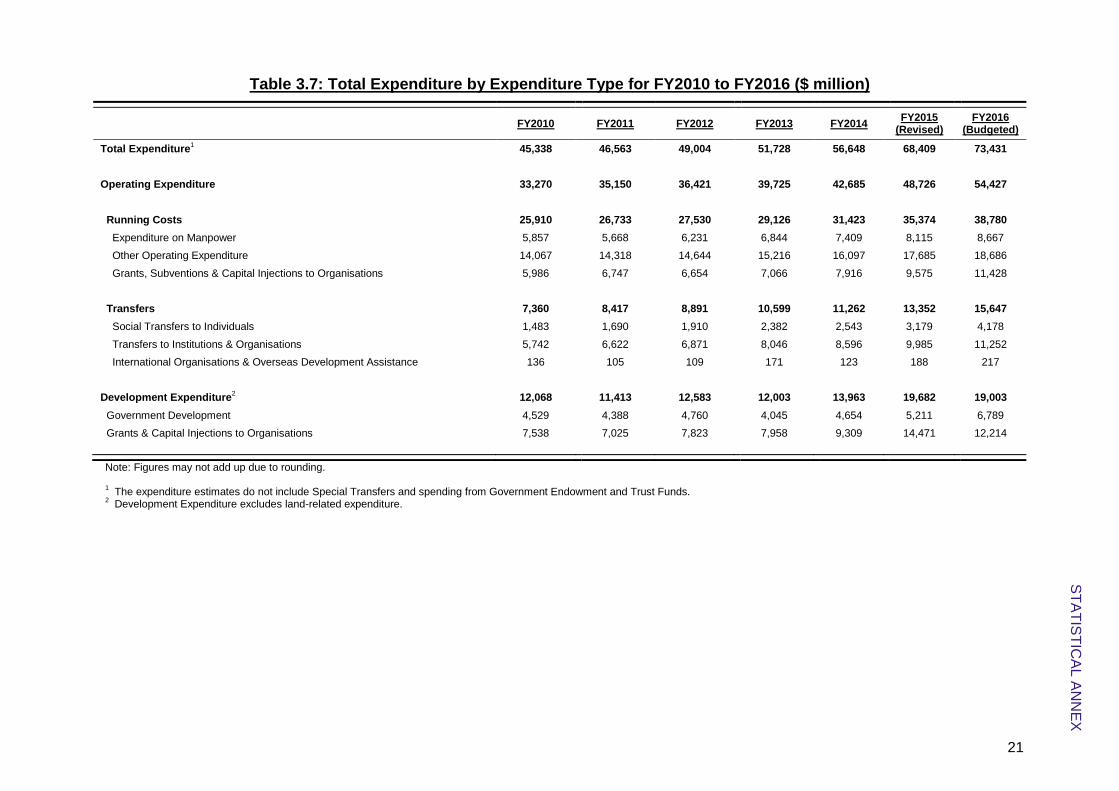
Table 3.7: Total Expenditure by Expenditure Type for FY2010 to FY2016 ($ million) 21
Table 3.8: Headcount by Ministry for FY2010 to FY2016 22
GLOSSARY OF TERMS 24
ANALYSIS OF REVENUE AND
EXPENDITURE
UPDATE ON FY2015
OUTLOOK FOR FY2016
1
1 Update on Financial Year 2015
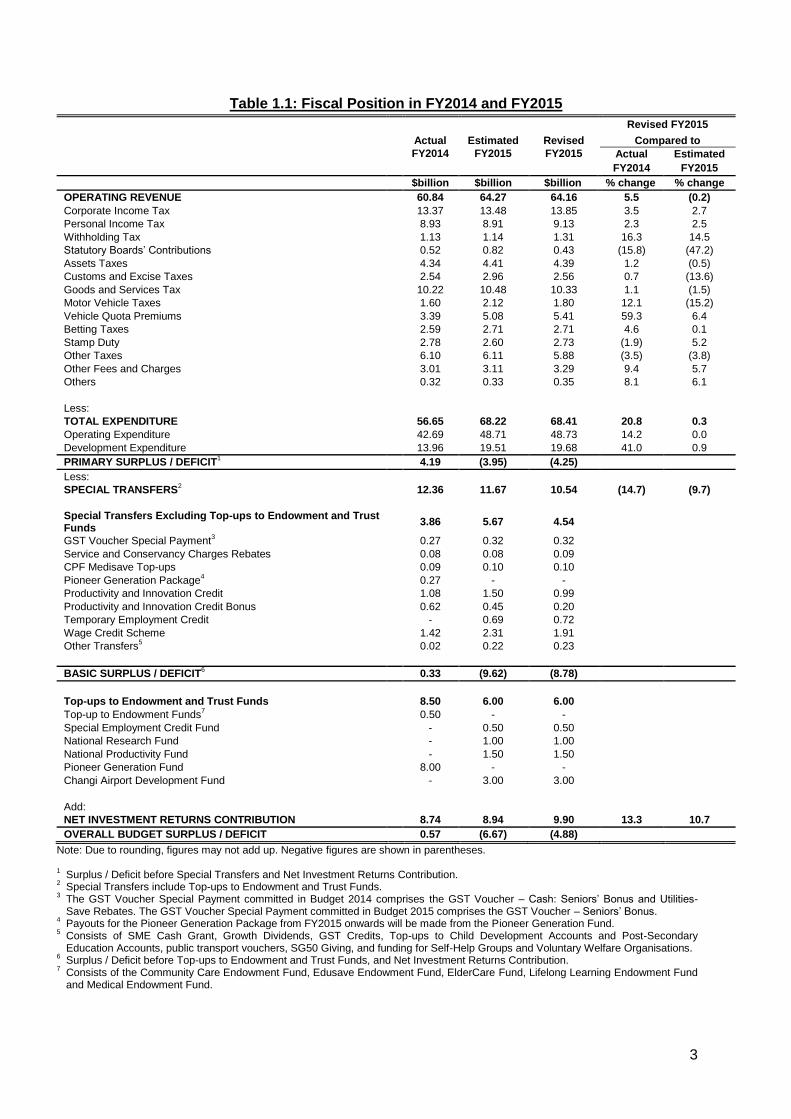
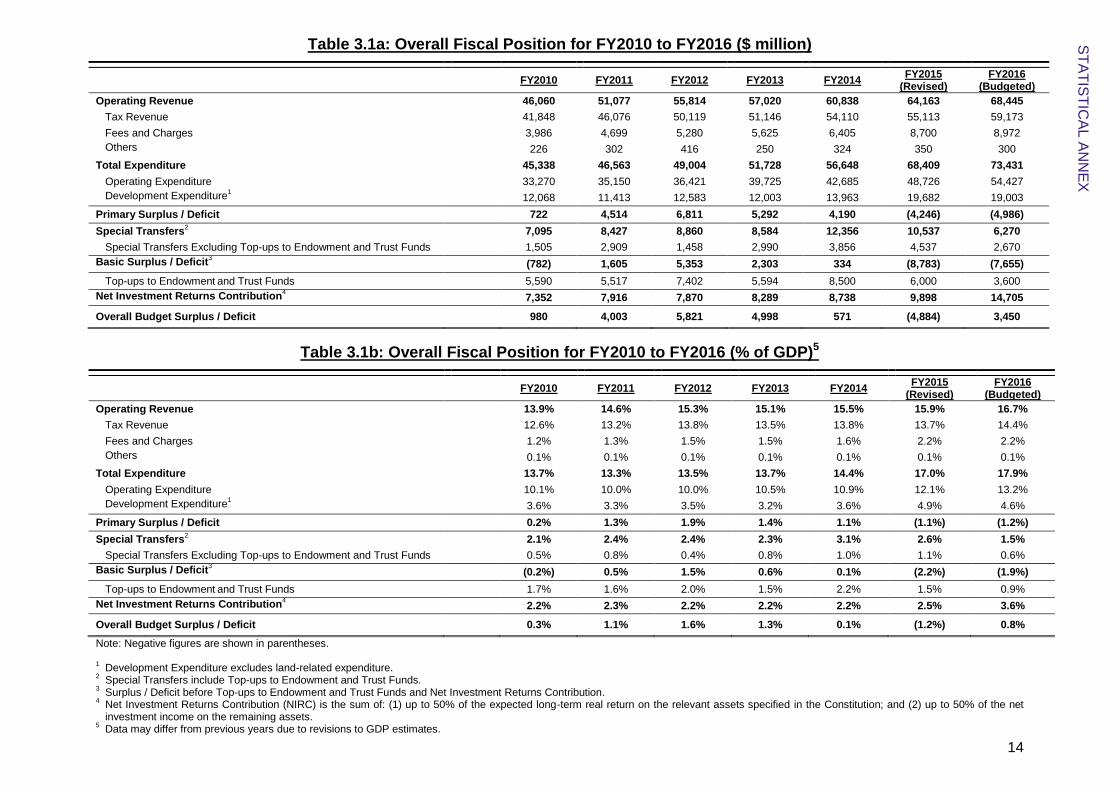
1.1 Expected Budget Outturn for FY2015 The revised basic deficit is estimated at $8.8 billion (or 2.2% of GDP), after taking into account Special Transfers Excluding Top-ups to Endowment and Trust Funds, and before the Net Investment Returns Contribution (NIRC). After factoring in the NIRC of $9.9 billion and Top-ups to Endowment and Trust Funds of $6.0 billion, the overall budget balance for FY2015 is estimated to be a deficit of $4.9 billion (or 1.2% of GDP). The revised FY2015 fiscal position is shown in Table 1.1.
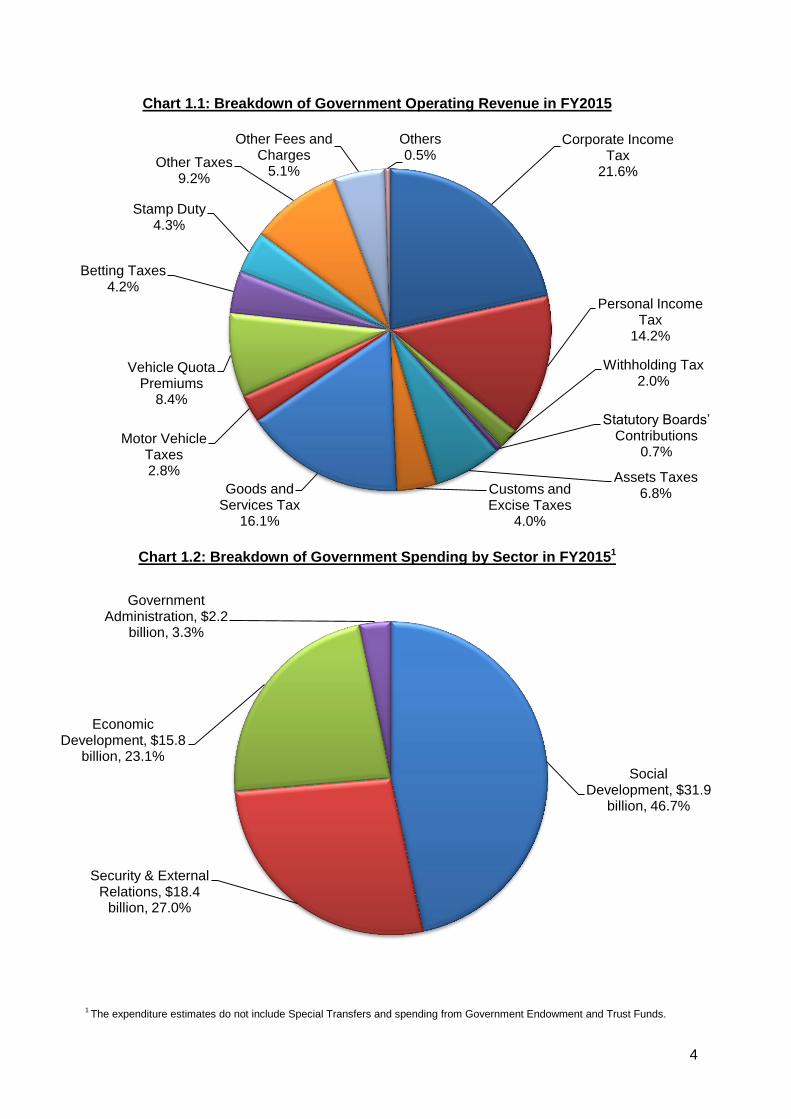
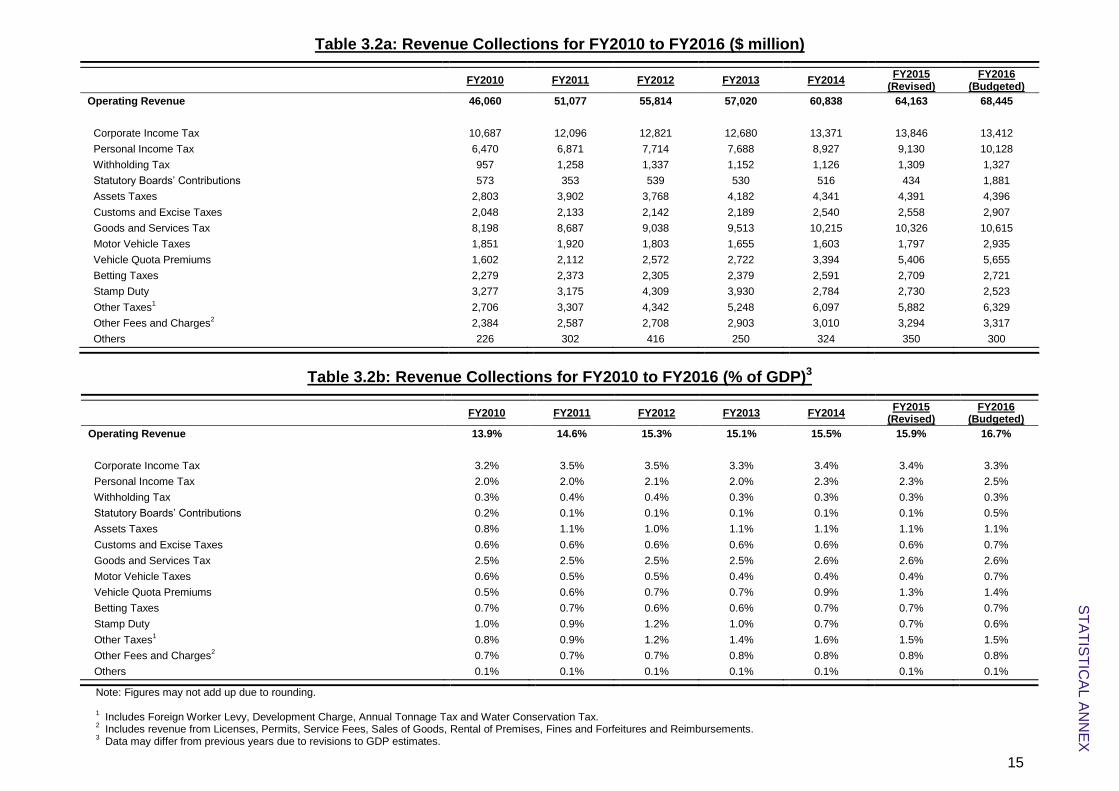
1.2 Operating Revenue FY2015 Operating Revenue has been revised down by $0.1 billion (or 0.2%) to $64.2 billion. This decrease is mainly due to lower-than-expected collections from Customs and Excise Taxes and Statutory Boards’ Contributions, compared to budgeted FY2015 estimates. Customs and Excise Taxes are estimated to be $2.6 billion, $0.4 billion (or 13.6%) lower than budgeted FY2015 estimate, mainly as a result of lower than expected tobacco excise duty collections. Statutory Boards’ Contributions are estimated to decrease by $0.4 billion (or 47.2%) to $0.4 billion due to lower-than-expected collections. These decreases are partly offset by higher-than-expected income-related taxes. Compared to budgeted FY2015 estimates, Corporate Income Tax collections are estimated to increase by $0.4 billion (or 2.7%) to $13.8 billion, and Personal Income Tax collections are also estimated to increase by $0.2 billion (or 2.5%) to $9.1 billion. The distribution of Operating Revenue in FY2015 by the various components is shown in Chart 1.1.
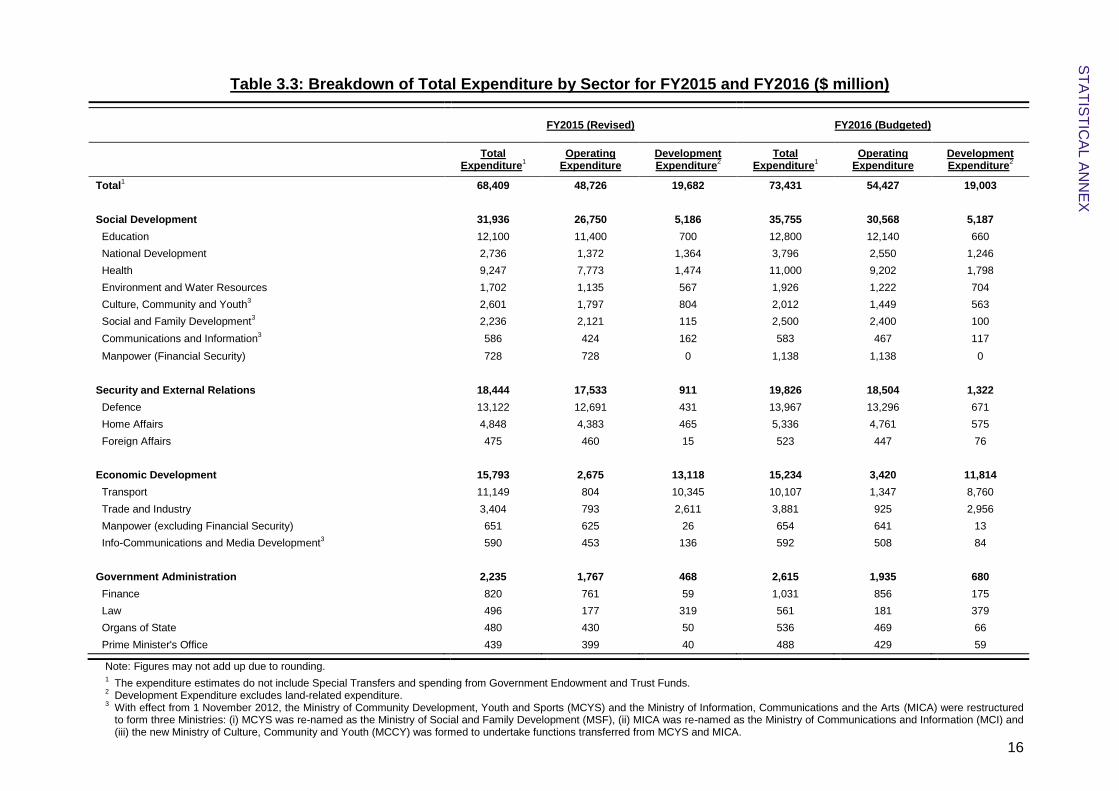
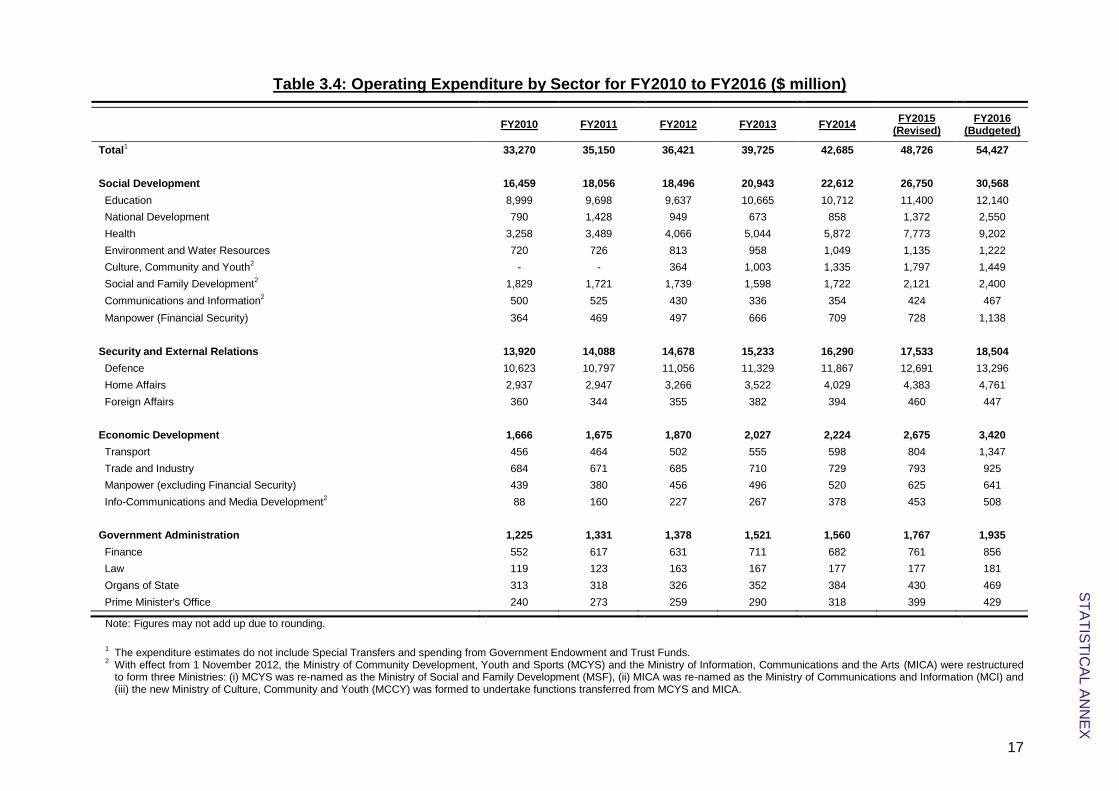
1.3 Total Expenditure FY2015 Total Expenditure has been revised upwards by $0.2 billion (or 0.3%) to $68.4 billion (or 17.0% of GDP). Operating Expenditure is expected to be $48.7 billion, similar to the budgeted FY2015 estimate. Development Expenditure is expected to be $19.7 billion, higher than the budgeted FY2015 estimate by $0.2 billion (or 0.9%). This is mainly due to higher expenditures for transport infrastructure and economic development. The Social Development sector continues to take up the largest share of Total Expenditure at 46.7%, followed by Security and External Relations (27.0%). The breakdown of government spending by the major sectors is provided in Chart 1.2.

2
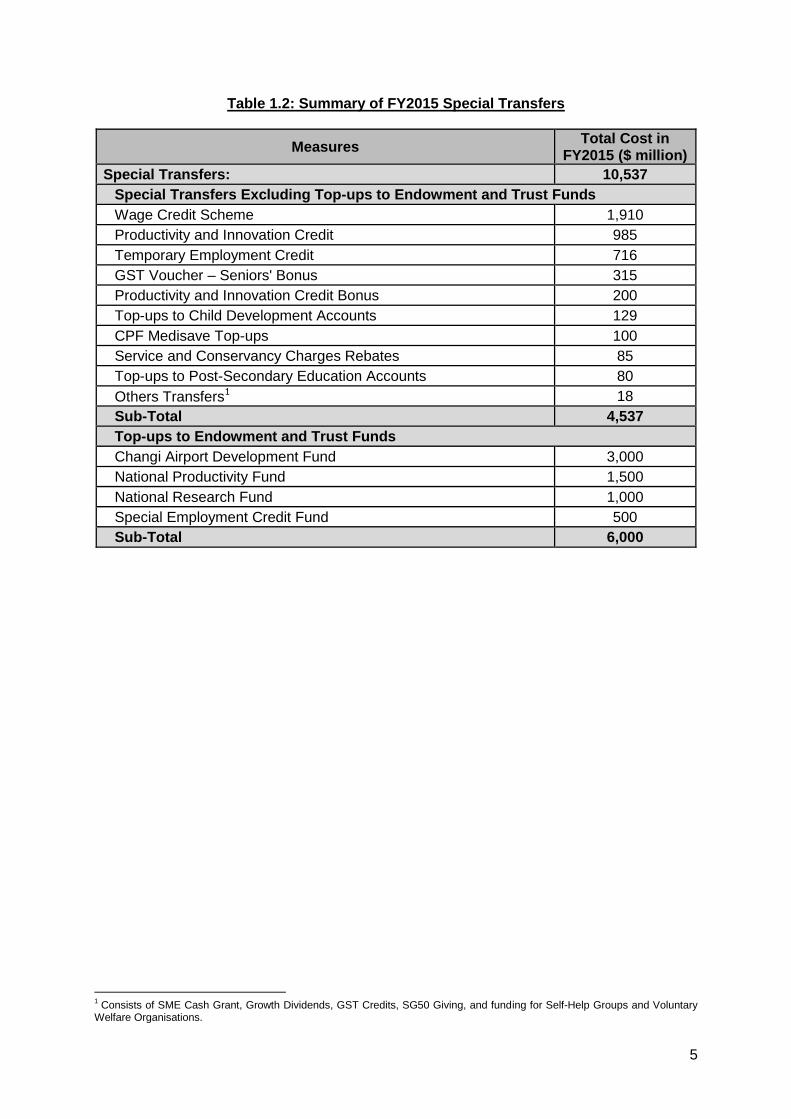
1.4 Special Transfers Special Transfers are expected to total $10.5 billion in FY2015, a $1.1 billion (or 9.7%) decrease from the budgeted figure. This is mainly due to lower-than-expected Productivity and Innovation Credit (PIC) cash payouts, PIC Bonus payouts and Wage Credit Scheme payouts in FY2015. Table 1.2 shows a summary of the Special Transfers in Budget 2015.
1.5 Net Investment Returns Contribution (NIRC) NIRC for FY2015 is projected to total $9.9 billion, $1.0 billion (or 10.7%) more than the budgeted estimate.
1.6 Spending from the Government Endowment Funds and Trust Funds In FY2015, spending from the five government endowment funds is expected to reach about $802 million, with the breakdown as follows:
$291 million from the Edusave Endowment Fund
$276 million from the Medical Endowment Fund and ElderCare Fund
$167 million from the Lifelong Learning Endowment Fund
$68 million from the Community Care Endowment Fund
In FY2015, spending from various trust funds is estimated to add up to about $3.5 billion. The key items include:
$828 million from the National Research Fund
$752 million from the GST Voucher Fund
$697 million from the Special Employment Credit Fund and the Workfare Special
Bonus Fund
$449 million from the Pioneer Generation Fund
$283 million from the National Productivity Fund
$218 million from the Bus Service Enhancement Fund
$140 million from the Singapore Universities Trust Fund
$123 million from the Community Silver Trust Fund
$57 million from the Cultural Matching Fund
3
Table 1.1: Fiscal Position in FY2014 and FY2015
Actual Estimated Revised
Revised FY2015
Compared to
FY2014 FY2015 FY2015 Actual Estimated
FY2014 FY2015
$billion $billion $billion % change % change
OPERATING REVENUE 60.84 64.27 64.16 5.5 (0.2)
Corporate Income Tax 13.37 13.48 13.85 3.5 2.7
Personal Income Tax 8.93 8.91 9.13 2.3 2.5
Withholding Tax 1.13 1.14 1.31 16.3 14.5
Statutory Boards’ Contributions 0.52 0.82 0.43 (15.8) (47.2)
Assets Taxes 4.34 4.41 4.39 1.2 (0.5)
Customs and Excise Taxes 2.54 2.96 2.56 0.7 (13.6)
Goods and Services Tax 10.22 10.48 10.33 1.1 (1.5)
Motor Vehicle Taxes 1.60 2.12 1.80 12.1 (15.2)
Vehicle Quota Premiums 3.39 5.08 5.41 59.3 6.4
Betting Taxes 2.59 2.71 2.71 4.6 0.1
Stamp Duty 2.78 2.60 2.73 (1.9) 5.2
Other Taxes 6.10 6.11 5.88 (3.5) (3.8)
Other Fees and Charges 3.01 3.11 3.29 9.4 5.7
Others 0.32 0.33 0.35 8.1 6.1
Less:
TOTAL EXPENDITURE 56.65 68.22 68.41 20.8 0.3
Operating Expenditure 42.69 48.71 48.73 14.2 0.0
Development Expenditure 13.96 19.51 19.68 41.0 0.9
PRIMARY SURPLUS / DEFICIT1 4.19 (3.95) (4.25)
Less:
SPECIAL TRANSFERS
2 12.36 11.67 10.54 (14.7) (9.7)
Special Transfers Excluding Top-ups to Endowment and Trust Funds
3.86 5.67 4.54
GST Voucher Special Payment3 0.27 0.32 0.32
Service and Conservancy Charges Rebates 0.08 0.08 0.09
CPF Medisave Top-ups 0.09 0.10 0.10
Pioneer Generation Package4
0.27 - -
Productivity and Innovation Credit 1.08 1.50 0.99
Productivity and Innovation Credit Bonus
0.62 0.45 0.20
Temporary Employment Credit - 0.69 0.72
Wage Credit Scheme
1.42 2.31 1.91
Other Transfers5
0.02 0.22 0.23
BASIC SURPLUS / DEFICIT6 0.33 (9.62) (8.78)
Top-ups to Endowment and Trust Funds 8.50 6.00 6.00
Top-up to Endowment Funds7 0.50 - -
Special Employment Credit Fund - 0.50 0.50
National Research Fund - 1.00 1.00
National Productivity Fund - 1.50 1.50
Pioneer Generation Fund 8.00 - -
Changi Airport Development Fund - 3.00 3.00
Add:
NET INVESTMENT RETURNS CONTRIBUTION 8.74 8.94 9.90 13.3 10.7
OVERALL BUDGET SURPLUS / DEFICIT 0.57 (6.67) (4.88)
Note: Due to rounding, figures may not add up. Negative figures are shown in parentheses. 1
Surplus / Deficit before Special Transfers and Net Investment Returns Contribution. 2
Special Transfers include Top-ups to Endowment and Trust Funds. 3
The GST Voucher Special Payment committed in Budget 2014 comprises the GST Voucher – Cash: Seniors’ Bonus and Utilities-Save Rebates. The GST Voucher Special Payment committed in Budget 2015 comprises the GST Voucher – Seniors’ Bonus.
4 Payouts for the Pioneer Generation Package from FY2015 onwards will be made from the Pioneer Generation Fund.
5 Consists of SME Cash Grant, Growth Dividends, GST Credits, Top-ups to Child Development Accounts and Post-Secondary Education Accounts, public transport vouchers, SG50 Giving, and funding for Self-Help Groups and Voluntary Welfare Organisations.
6 Surplus / Deficit before Top-ups to Endowment and Trust Funds, and Net Investment Returns Contribution.
7 Consists of the Community Care Endowment Fund, Edusave Endowment Fund, ElderCare Fund, Lifelong Learning Endowment Fund and Medical Endowment Fund.
4
Chart 1.1: Breakdown of Government Operating Revenue in FY2015
Chart 1.2: Breakdown of Government Spending by Sector in FY20151
1 The expenditure estimates do not include Special Transfers and spending from Government Endowment and Trust Funds.
Corporate Income Tax
21.6%
Personal Income Tax
14.2%
Withholding Tax 2.0%
Statutory Boards’ Contributions
0.7%
Assets Taxes 6.8% Customs and
Excise Taxes 4.0%
Goods and Services Tax
16.1%
Motor Vehicle Taxes 2.8%
Vehicle Quota Premiums
8.4%
Betting Taxes 4.2%
Stamp Duty 4.3%
Other Taxes 9.2%
Other Fees and Charges
5.1%
Others 0.5%
Social Development, $31.9
billion, 46.7%
Security & External Relations, $18.4
billion, 27.0%
Economic Development, $15.8
billion, 23.1%
Government Administration, $2.2
billion, 3.3%
5
Table 1.2: Summary of FY2015 Special Transfers
Measures Total Cost in
FY2015 ($ million)
Special Transfers: 10,537
Special Transfers Excluding Top-ups to Endowment and Trust Funds
Wage Credit Scheme 1,910
Productivity and Innovation Credit 985
Temporary Employment Credit 716
GST Voucher – Seniors' Bonus 315
Productivity and Innovation Credit Bonus 200
Top-ups to Child Development Accounts 129
CPF Medisave Top-ups 100
Service and Conservancy Charges Rebates 85
Top-ups to Post-Secondary Education Accounts 80
Others Transfers1 18
Sub-Total 4,537
Top-ups to Endowment and Trust Funds
Changi Airport Development Fund 3,000
National Productivity Fund 1,500
National Research Fund 1,000
Special Employment Credit Fund 500
Sub-Total 6,000
1 Consists of SME Cash Grant, Growth Dividends, GST Credits, SG50 Giving, and funding for Self-Help Groups and Voluntary
Welfare Organisations.
6
2 Outlook for Financial Year 2016
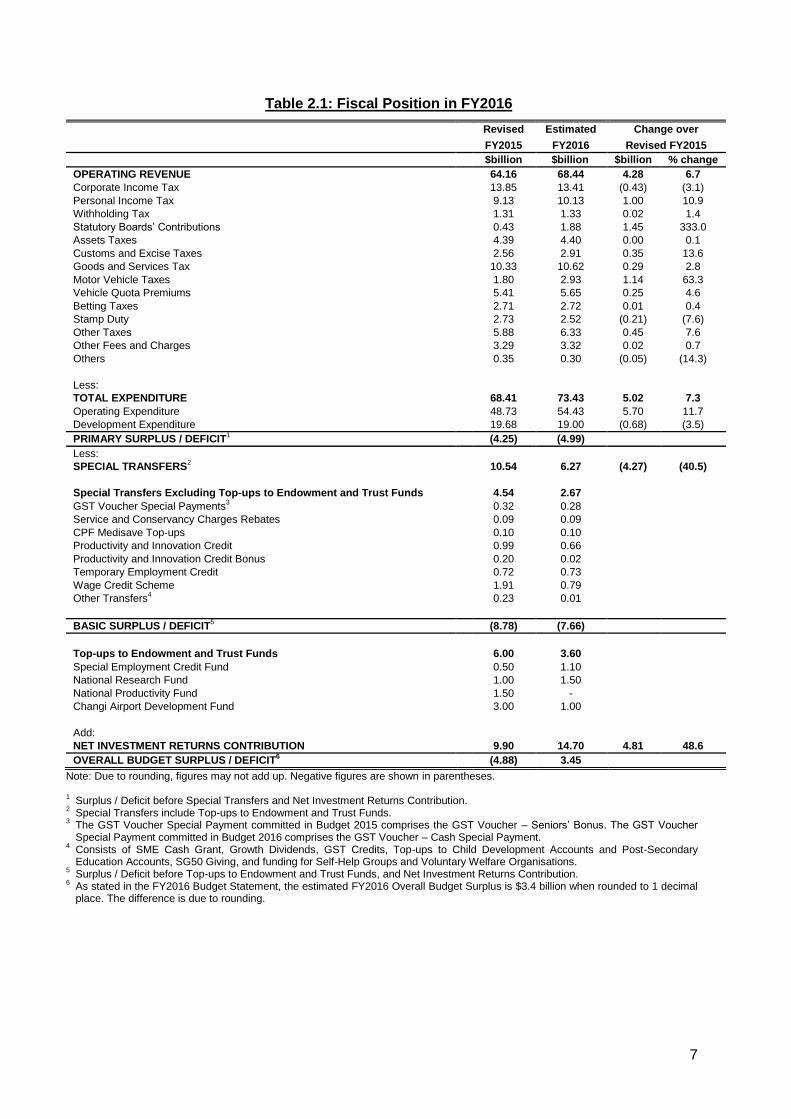
2.1 Budget for FY2016 A basic deficit of $7.7 billion (or 1.9% of GDP) is expected for FY2016. After factoring in Top-ups to Endowment and Trust Funds of $3.6 billion and NIRC of $14.7 billion, the overall budget surplus for FY2016 is $3.4 billion (or 0.8% of GDP). The FY2016 Budget is summarised in Table 2.1.
2.2 Operating Revenue Operating Revenue for FY2016 is projected at $68.4 billion (or 16.7% of GDP). This is an increase of $4.3 billion (or 6.7%) over the revised FY2015 estimate. This increase is mainly due to higher motor vehicle related revenues, Statutory Boards’ Contributions, Personal Income Tax (PIT), Other Taxes and Goods and Services Tax (GST), offset by decreases in Corporate Income Tax (CIT) and Stamp Duty. Motor Vehicle Taxes in FY2016 are estimated to increase by $1.1 billion (or 63.3%) over the Revised FY2015 estimate to $2.9 billion. Vehicle Quota Premiums are estimated to increase by $0.2 billion (or 4.6%) to $5.7 billion in FY2016. Customs and Excise Taxes are estimated to increase by $0.3 billion (or 13.6%) to $2.9 billion due to higher import duty collections from vehicles. These increases are due to an expected increase in the number of COE quotas arising from more vehicle de-registrations. Statutory Boards’ Contributions are expected to increase by $1.4 billion (or 333.0%) to $1.9 billion mainly due to contributions coming in from MAS, which had not made contributions over the past 5 years.1 PIT collections in FY2016 are expected to increase by $1.0 billion (or 10.9%) to $10.1 billion over Revised FY2015 estimate, due to the cessation of the one-off PIT rebate in Year of Assessment (YA) 2015. Other Taxes, which include the Foreign Worker Levy, Water Conservation Tax, Development Charge and Annual Tonnage Tax, are estimated to be $6.3 billion in FY2016. This is $0.4 billion (or 7.6%) higher than the revised FY2015 estimate. GST collections are projected at $10.6 billion, $0.3 billion (or 2.8%) higher than the revised FY2015 estimate, in line with the growth in private consumption expenditure. CIT collections are expected to decrease by $0.4 billion (or 3.1%) to $13.4 billion in FY2016, after accounting for the additional tax rebate for YA 2016. Stamp Duty collections are projected to decline by $0.2 billion (or 7.6%) to $2.5 billion in FY2016. Historical data for the various revenue items are provided in Tables 3.2a and 3.2b in the Statistical Annex.
1 Statutory Boards are required to make contributions on their net surplus to the Government Consolidated Fund in accordance
with the Statutory Corporations (Contributions to Consolidated Fund) Act (Chapter 319A) in lieu of income tax. The contribution rate is pegged to the corporate tax rate.
7
Table 2.1: Fiscal Position in FY2016
Revised Estimated Change over
FY2015 FY2016 Revised FY2015
$billion $billion $billion % change
OPERATING REVENUE 64.16 68.44 4.28 6.7
Corporate Income Tax 13.85 13.41 (0.43) (3.1)
Personal Income Tax 9.13 10.13 1.00 10.9
Withholding Tax 1.31 1.33 0.02 1.4
Statutory Boards’ Contributions 0.43 1.88 1.45 333.0
Assets Taxes 4.39 4.40 0.00 0.1
Customs and Excise Taxes 2.56 2.91 0.35 13.6
Goods and Services Tax 10.33 10.62 0.29 2.8
Motor Vehicle Taxes 1.80 2.93 1.14 63.3
Vehicle Quota Premiums 5.41 5.65 0.25 4.6
Betting Taxes 2.71 2.72 0.01 0.4
Stamp Duty 2.73 2.52 (0.21) (7.6)
Other Taxes 5.88 6.33 0.45 7.6
Other Fees and Charges 3.29 3.32 0.02 0.7
Others 0.35 0.30 (0.05) (14.3)
Less:
TOTAL EXPENDITURE 68.41 73.43 5.02 7.3
Operating Expenditure 48.73 54.43 5.70 11.7
Development Expenditure 19.68 19.00 (0.68) (3.5)
PRIMARY SURPLUS / DEFICIT1 (4.25) (4.99)
Less:
SPECIAL TRANSFERS2 10.54 6.27 (4.27) (40.5)
Special Transfers Excluding Top-ups to Endowment and Trust Funds 4.54 2.67
GST Voucher Special Payments3 0.32 0.28
Service and Conservancy Charges Rebates 0.09 0.09
CPF Medisave Top-ups 0.10 0.10
Productivity and Innovation Credit 0.99 0.66
Productivity and Innovation Credit Bonus 0.20 0.02
Temporary Employment Credit 0.72 0.73
Wage Credit Scheme 1.91 0.79
Other Transfers4 0.23 0.01
BASIC SURPLUS / DEFICIT5 (8.78) (7.66)
Top-ups to Endowment and Trust Funds 6.00 3.60
Special Employment Credit Fund 0.50 1.10
National Research Fund 1.00 1.50
National Productivity Fund 1.50 -
Changi Airport Development Fund 3.00 1.00
Add:
NET INVESTMENT RETURNS CONTRIBUTION 9.90 14.70 4.81 48.6
OVERALL BUDGET SURPLUS / DEFICIT6 (4.88) 3.45
Note: Due to rounding, figures may not add up. Negative figures are shown in parentheses. 1
Surplus / Deficit before Special Transfers and Net Investment Returns Contribution. 2
Special Transfers include Top-ups to Endowment and Trust Funds. 3
The GST Voucher Special Payment committed in Budget 2015 comprises the GST Voucher – Seniors’ Bonus. The GST Voucher Special Payment committed in Budget 2016 comprises the GST Voucher – Cash Special Payment.
4 Consists of SME Cash Grant, Growth Dividends, GST Credits, Top-ups to Child Development Accounts and Post-Secondary Education Accounts, SG50 Giving, and funding for Self-Help Groups and Voluntary Welfare Organisations.
5 Surplus / Deficit before Top-ups to Endowment and Trust Funds, and Net Investment Returns Contribution.
6 As stated in the FY2016 Budget Statement, the estimated FY2016 Overall Budget Surplus is $3.4 billion when rounded to 1 decimal place. The difference is due to rounding.
8
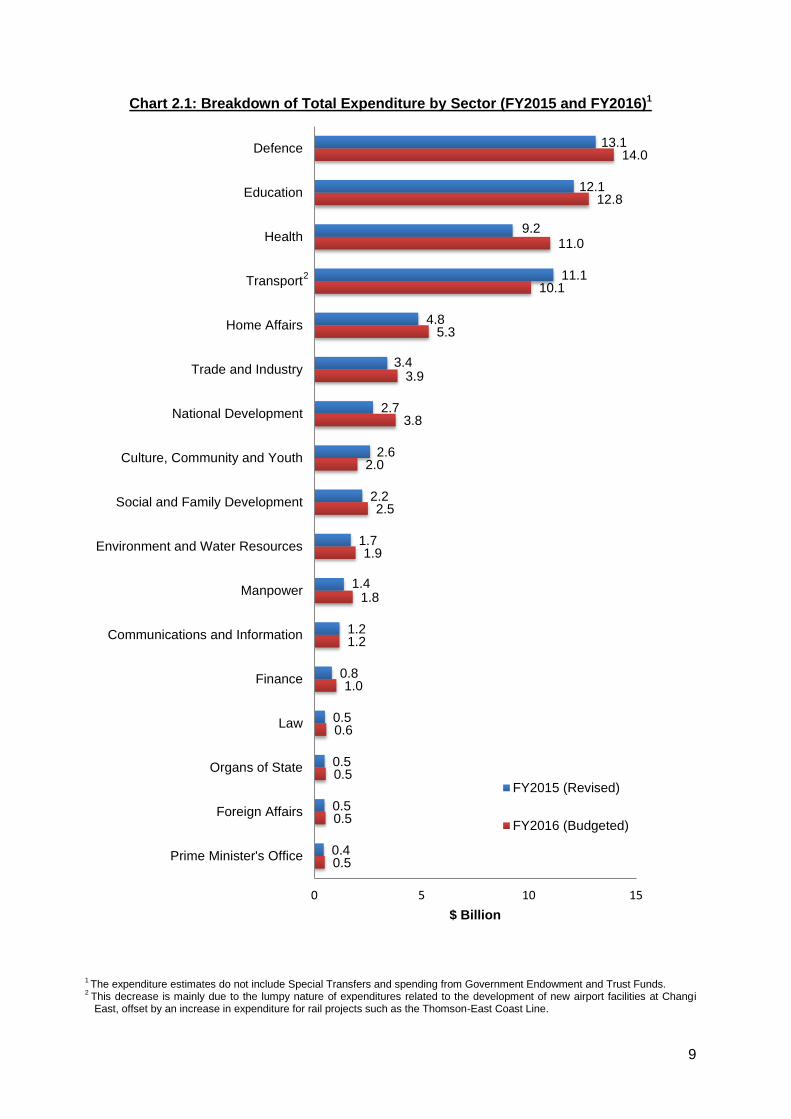
2.3 Total Expenditure FY2016 Total Expenditure is estimated to be $73.4 billion (or 17.9% of GDP). This is an increase of $5.0 billion (or 7.3%) from the revised FY2015 estimate of $68.4 billion. The main increases in expenditure over FY2015 are in Healthcare, National Development, Defence, Education, Home Affairs and Trade and Industry (see Chart 2.1). Healthcare expenditure is expected to increase by $1.8 billion (or 19.0%). This is mainly to cater for higher subventions to Public Healthcare Institutions and premium subsidies for MediShield Life. There is also higher development expenditure for the construction of healthcare infrastructure such as the Sengkang General Hospital, National Centre for Infectious Diseases, National Cancer Centre and Outram Community Hospital. National Development expenditure is expected to increase by $1.1 billion (or 38.7%), mainly due to higher expenditure on public housing and increase in housing grants to support home ownership. Defence expenditure is expected to increase by $0.8 billion (or 6.4%) due to an increase in military expenditure. Education expenditure is expected to increase by $0.7 billion (or 5.8%). This is mainly due to salary adjustment of education officers and allied educators, higher budget for the polytechnics and ITE for SkillsFuture initiatives, and higher budget for Autonomous Universities and UniSIM to cater for higher student enrolment numbers. Home Affairs expenditure is expected to increase by $0.5 billion (or 10.1%), mainly due to investments in frontline policing and public order capabilities, enhanced security measures at the Checkpoints, as well as spending on infrastructure projects such as the new Woodlands Police Divisional HQ and Redevelopment of Selarang Park Complex. Trade and Industry expenditure is expected to increase by $0.5 billion (or 14.0%), mainly due to requirements for tourism projects and higher operating grants to fund the activities of the Statutory Boards. A detailed breakdown of government expenditure by sector is provided in Tables 3.3 to 3.6b in the Statistical Annex.
9
Chart 2.1: Breakdown of Total Expenditure by Sector (FY2015 and FY2016)1
1 The expenditure estimates do not include Special Transfers and spending from Government Endowment and Trust Funds.
2 This decrease is mainly due to the lumpy nature of expenditures related to the development of new airport facilities at Changi East, offset by an increase in expenditure for rail projects such as the Thomson-East Coast Line.
0.5
0.5
0.5
0.6
1.0
1.2
1.8
1.9
2.5
2.0
3.8
3.9
5.3
10.1
11.0
12.8
14.0
0.4
0.5
0.5
0.5
0.8
1.2
1.4
1.7
2.2
2.6
2.7
3.4
4.8
11.1
9.2
12.1
13.1
0 5 10 15
Prime Minister's Office
Foreign Affairs
Organs of State
Law
Finance
Communications and Information
Manpower
Environment and Water Resources
Social and Family Development
Culture, Community and Youth
National Development
Trade and Industry
Home Affairs
Transport
Health
Education
Defence
$ Billion
FY2015 (Revised)
FY2016 (Budgeted)
2
10
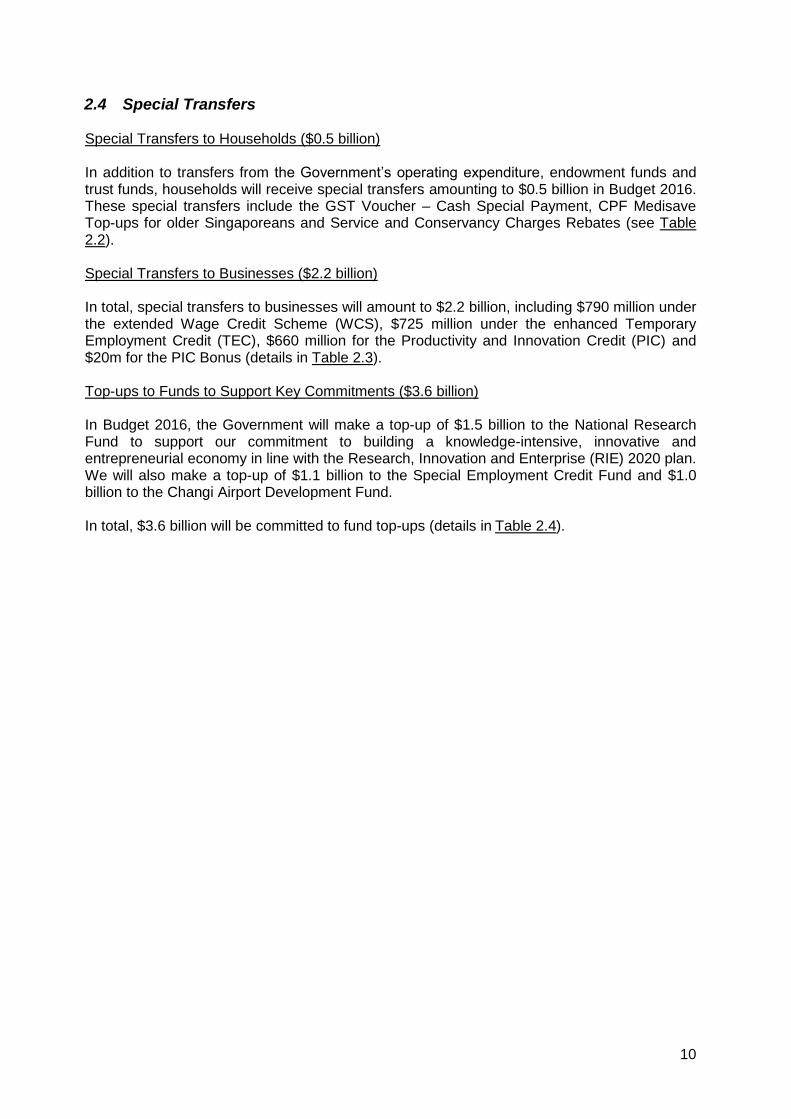
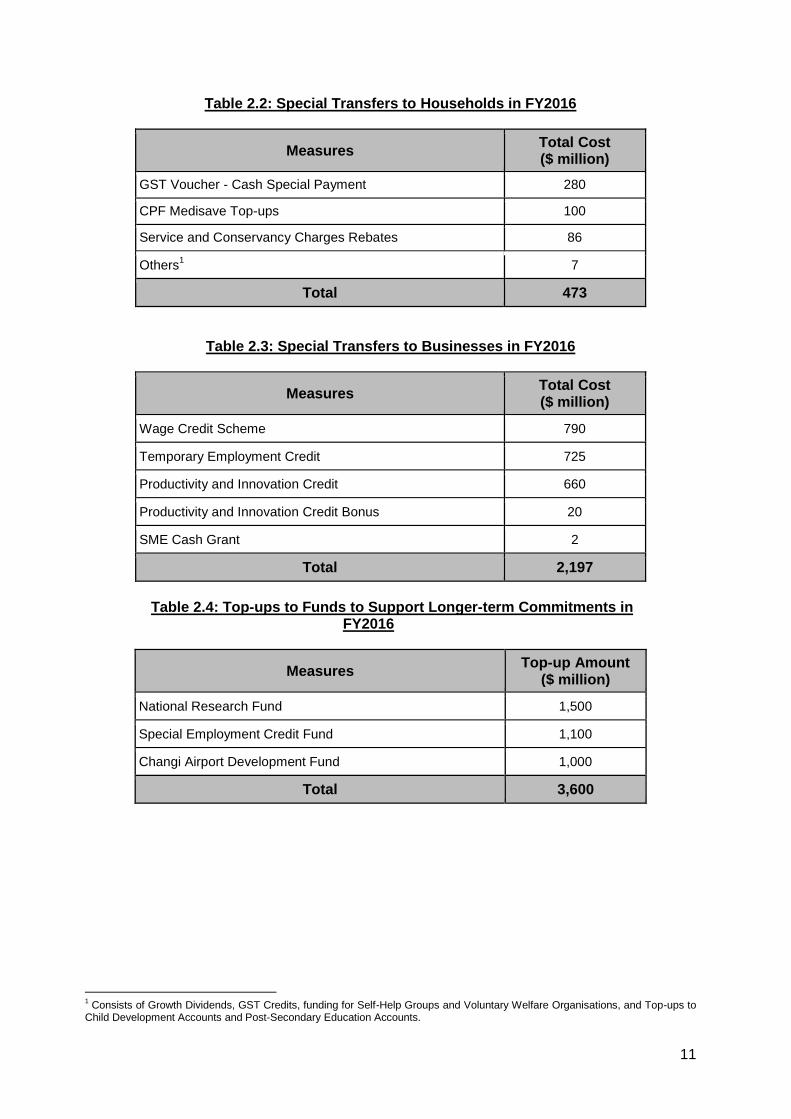
2.4 Special Transfers Special Transfers to Households ($0.5 billion) In addition to transfers from the Government’s operating expenditure, endowment funds and trust funds, households will receive special transfers amounting to $0.5 billion in Budget 2016. These special transfers include the GST Voucher – Cash Special Payment, CPF Medisave Top-ups for older Singaporeans and Service and Conservancy Charges Rebates (see Table 2.2). Special Transfers to Businesses ($2.2 billion) In total, special transfers to businesses will amount to $2.2 billion, including $790 million under the extended Wage Credit Scheme (WCS), $725 million under the enhanced Temporary Employment Credit (TEC), $660 million for the Productivity and Innovation Credit (PIC) and $20m for the PIC Bonus (details in Table 2.3). Top-ups to Funds to Support Key Commitments ($3.6 billion) In Budget 2016, the Government will make a top-up of $1.5 billion to the National Research Fund to support our commitment to building a knowledge-intensive, innovative and entrepreneurial economy in line with the Research, Innovation and Enterprise (RIE) 2020 plan. We will also make a top-up of $1.1 billion to the Special Employment Credit Fund and $1.0 billion to the Changi Airport Development Fund. In total, $3.6 billion will be committed to fund top-ups (details in Table 2.4).
11
Table 2.2: Special Transfers to Households in FY2016
Measures Total Cost ($ million)
GST Voucher - Cash Special Payment 280
CPF Medisave Top-ups 100
Service and Conservancy Charges Rebates 86
Others1 7
Total 473
Table 2.3: Special Transfers to Businesses in FY2016
Measures Total Cost ($ million)
Wage Credit Scheme 790
Temporary Employment Credit 725
Productivity and Innovation Credit 660
Productivity and Innovation Credit Bonus 20
SME Cash Grant 2
Total 2,197
Table 2.4: Top-ups to Funds to Support Longer-term Commitments in
FY2016
Measures Top-up Amount
($ million)
National Research Fund 1,500
Special Employment Credit Fund 1,100
Changi Airport Development Fund 1,000
Total 3,600
1 Consists of Growth Dividends, GST Credits, funding for Self-Help Groups and Voluntary Welfare Organisations, and Top-ups to
Child Development Accounts and Post-Secondary Education Accounts.
12
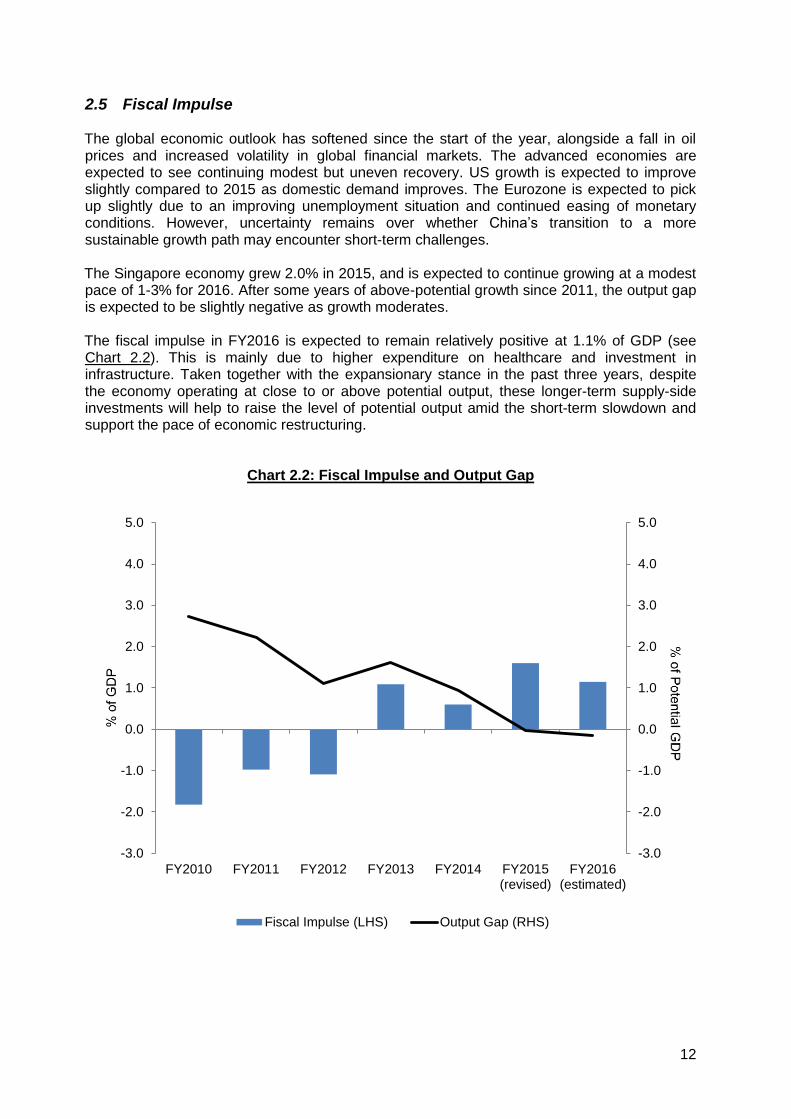
2.5 Fiscal Impulse The global economic outlook has softened since the start of the year, alongside a fall in oil prices and increased volatility in global financial markets. The advanced economies are expected to see continuing modest but uneven recovery. US growth is expected to improve slightly compared to 2015 as domestic demand improves. The Eurozone is expected to pick up slightly due to an improving unemployment situation and continued easing of monetary conditions. However, uncertainty remains over whether China’s transition to a more sustainable growth path may encounter short-term challenges. The Singapore economy grew 2.0% in 2015, and is expected to continue growing at a modest pace of 1-3% for 2016. After some years of above-potential growth since 2011, the output gap is expected to be slightly negative as growth moderates. The fiscal impulse in FY2016 is expected to remain relatively positive at 1.1% of GDP (see Chart 2.2). This is mainly due to higher expenditure on healthcare and investment in infrastructure. Taken together with the expansionary stance in the past three years, despite the economy operating at close to or above potential output, these longer-term supply-side investments will help to raise the level of potential output amid the short-term slowdown and support the pace of economic restructuring.
Chart 2.2: Fiscal Impulse and Output Gap
-3.0
-2.0
-1.0
0.0
1.0
2.0
3.0
4.0
5.0
-3.0
-2.0
-1.0
0.0
1.0
2.0
3.0
4.0
5.0
FY2010 FY2011 FY2012 FY2013 FY2014 FY2015(revised)
FY2016(estimated)
Fiscal Impulse (LHS) Output Gap (RHS)
13
STATISTICAL ANNEX
14
Table 3.1a: Overall Fiscal Position for FY2010 to FY2016 ($ million)
FY2010 FY2011 FY2012 FY2013 FY2014 FY2015
(Revised) FY2016
(Budgeted)
Operating Revenue 46,060 51,077 55,814 57,020 60,838 64,163 68,445
Tax Revenue 41,848 46,076 50,119 51,146 54,110 55,113 59,173
Fees and Charges 3,986 4,699 5,280 5,625 6,405 8,700 8,972
Others
226 302 416 250 324 350 300
Total Expenditure 45,338 46,563 49,004 51,728 56,648 68,409 73,431
Operating Expenditure 33,270 35,150 36,421 39,725 42,685 48,726 54,427
Development Expenditure1
12,068 11,413 12,583 12,003 13,963 19,682 19,003
Primary Surplus / Deficit 722 4,514 6,811 5,292 4,190 (4,246) (4,986)
Special Transfers2
7,095 8,427 8,860 8,584 12,356 10,537 6,270
Special Transfers Excluding Top-ups to Endowment and Trust Funds 1,505 2,909 1,458 2,990 3,856 4,537 2,670
Basic Surplus / Deficit3
(782) 1,605 5,353 2,303 334 (8,783) (7,655)
Top-ups to Endowment and Trust Funds 5,590 5,517 7,402 5,594 8,500 6,000 3,600
Net Investment Returns Contribution4
7,352 7,916 7,870 8,289 8,738 9,898 14,705
Overall Budget Surplus / Deficit 980 4,003 5,821 4,998 571 (4,884) 3,450
Table 3.1b: Overall Fiscal Position for FY2010 to FY2016 (% of GDP)5
FY2010 FY2011 FY2012 FY2013 FY2014 FY2015
(Revised) FY2016
(Budgeted)
Operating Revenue 13.9% 14.6% 15.3% 15.1% 15.5% 15.9% 16.7%
Tax Revenue 12.6% 13.2% 13.8% 13.5% 13.8% 13.7% 14.4%
Fees and Charges 1.2% 1.3% 1.5% 1.5% 1.6% 2.2% 2.2%
Others
0.1% 0.1% 0.1% 0.1% 0.1% 0.1% 0.1%
Total Expenditure 13.7% 13.3% 13.5% 13.7% 14.4% 17.0% 17.9%
Operating Expenditure 10.1% 10.0% 10.0% 10.5% 10.9% 12.1% 13.2%
Development Expenditure1
3.6% 3.3% 3.5% 3.2% 3.6% 4.9% 4.6%
Primary Surplus / Deficit 0.2% 1.3% 1.9% 1.4% 1.1% (1.1%) (1.2%)
Special Transfers2
2.1% 2.4% 2.4% 2.3% 3.1% 2.6% 1.5%
Special Transfers Excluding Top-ups to Endowment and Trust Funds 0.5% 0.8% 0.4% 0.8% 1.0% 1.1% 0.6%
Basic Surplus / Deficit3
(0.2%) 0.5% 1.5% 0.6% 0.1% (2.2%) (1.9%)
Top-ups to Endowment and Trust Funds 1.7% 1.6% 2.0% 1.5% 2.2% 1.5% 0.9%
Net Investment Returns Contribution4
2.2% 2.3% 2.2% 2.2% 2.2% 2.5% 3.6%
Overall Budget Surplus / Deficit 0.3% 1.1% 1.6% 1.3% 0.1% (1.2%) 0.8%
Note: Negative figures are shown in parentheses.
1 Development Expenditure excludes land-related expenditure.
2 Special Transfers include Top-ups to Endowment and Trust Funds.
3 Surplus / Deficit before Top-ups to Endowment and Trust Funds and Net Investment Returns Contribution.
4 Net Investment Returns Contribution (NIRC) is the sum of: (1) up to 50% of the expected long-term real return on the relevant assets specified in the Constitution; and (2) up to 50% of the net investment income on the remaining assets.
5 Data may differ from previous years due to revisions to GDP estimates.
ST
AT
IST
ICA
L A
NN
EX
15
Table 3.2a: Revenue Collections for FY2010 to FY2016 ($ million)
FY2010 FY2011 FY2012 FY2013 FY2014 FY2015
(Revised) FY2016
(Budgeted)
Operating Revenue 46,060 51,077 55,814 57,020 60,838 64,163 68,445
Corporate Income Tax 10,687 12,096 12,821 12,680 13,371 13,846 13,412
Personal Income Tax 6,470 6,871 7,714 7,688 8,927 9,130 10,128
Withholding Tax
957 1,258 1,337 1,152 1,126 1,309 1,327
Statutory Boards’ Contributions 573 353 539 530 516 434 1,881
Assets Taxes 2,803 3,902 3,768 4,182 4,341 4,391 4,396
Customs and Excise Taxes 2,048 2,133 2,142 2,189 2,540 2,558 2,907
Goods and Services Tax 8,198 8,687 9,038 9,513 10,215 10,326 10,615
Motor Vehicle Taxes 1,851 1,920 1,803 1,655 1,603 1,797 2,935
Vehicle Quota Premiums 1,602 2,112 2,572 2,722 3,394 5,406 5,655
Betting Taxes 2,279 2,373 2,305 2,379 2,591 2,709 2,721
Stamp Duty 3,277 3,175 4,309 3,930 2,784 2,730 2,523
Other Taxes1 2,706 3,307 4,342 5,248 6,097 5,882 6,329
Other Fees and Charges2 2,384 2,587 2,708 2,903 3,010 3,294 3,317
Others 226 302 416 250 324 350 300
Table 3.2b: Revenue Collections for FY2010 to FY2016 (% of GDP)3
FY2010 FY2011 FY2012 FY2013 FY2014 FY2015
(Revised) FY2016
(Budgeted)
Operating Revenue 13.9% 14.6% 15.3% 15.1% 15.5% 15.9% 16.7%
Corporate Income Tax 3.2% 3.5% 3.5% 3.3% 3.4% 3.4% 3.3%
Personal Income Tax 2.0% 2.0% 2.1% 2.0% 2.3% 2.3% 2.5%
Withholding Tax
0.3% 0.4% 0.4% 0.3% 0.3% 0.3% 0.3%
Statutory Boards’ Contributions 0.2% 0.1% 0.1% 0.1% 0.1% 0.1% 0.5%
Assets Taxes 0.8% 1.1% 1.0% 1.1% 1.1% 1.1% 1.1%
Customs and Excise Taxes 0.6% 0.6% 0.6% 0.6% 0.6% 0.6% 0.7%
Goods and Services Tax 2.5% 2.5% 2.5% 2.5% 2.6% 2.6% 2.6%
Motor Vehicle Taxes 0.6% 0.5% 0.5% 0.4% 0.4% 0.4% 0.7%
Vehicle Quota Premiums 0.5% 0.6% 0.7% 0.7% 0.9% 1.3% 1.4%
Betting Taxes 0.7% 0.7% 0.6% 0.6% 0.7% 0.7% 0.7%
Stamp Duty 1.0% 0.9% 1.2% 1.0% 0.7% 0.7% 0.6%
Other Taxes1 0.8% 0.9% 1.2% 1.4% 1.6% 1.5% 1.5%
Other Fees and Charges2 0.7% 0.7% 0.7% 0.8% 0.8% 0.8% 0.8%
Others 0.1% 0.1% 0.1% 0.1% 0.1% 0.1% 0.1%
Note: Figures may not add up due to rounding. 1 Includes Foreign Worker Levy, Development Charge, Annual Tonnage Tax and Water Conservation Tax.
2 Includes revenue from Licenses, Permits, Service Fees, Sales of Goods, Rental of Premises, Fines and Forfeitures and Reimbursements.
3 Data may differ from previous years due to revisions to GDP estimates.
ST
AT
IST
ICA
L A
NN
EX
16
Table 3.3: Breakdown of Total Expenditure by Sector for FY2015 and FY2016 ($ million)
Note: Figures may not add up due to rounding.
1 The expenditure estimates do not include Special Transfers and spending from Government Endowment and Trust Funds.
2 Development Expenditure excludes land-related expenditure.
3 With effect from 1 November 2012, the Ministry of Community Development, Youth and Sports (MCYS) and the Ministry of Information, Communications and the Arts (MICA) were restructured to form three Ministries: (i) MCYS was re-named as the Ministry of Social and Family Development (MSF), (ii) MICA was re-named as the Ministry of Communications and Information (MCI) and (iii) the new Ministry of Culture, Community and Youth (MCCY) was formed to undertake functions transferred from MCYS and MICA.
FY2015 (Revised) FY2016 (Budgeted)
Total
Expenditure1
Operating Expenditure
Development Expenditure
2 Total
Expenditure1
Operating Expenditure
Development Expenditure
2
Total1 68,409 48,726 19,682 73,431 54,427 19,003
Social Development 31,936 26,750 5,186 35,755 30,568 5,187
Education 12,100 11,400 700 12,800 12,140 660
National Development 2,736 1,372 1,364 3,796 2,550 1,246
Health 9,247 7,773 1,474 11,000 9,202 1,798
Environment and Water Resources 1,702 1,135 567 1,926 1,222 704
Culture, Community and Youth3
2,601 1,797 804 2,012 1,449 563
Social and Family Development3 2,236 2,121 115 2,500 2,400 100
Communications and Information3 586 424 162 583 467 117
Manpower (Financial Security)
728 728 0 1,138 1,138 0
Security and External Relations 18,444 17,533 911 19,826 18,504 1,322
Defence 13,122 12,691 431 13,967 13,296 671
Home Affairs 4,848 4,383 465 5,336 4,761 575
Foreign Affairs 475 460 15 523 447 76
Economic Development 15,793 2,675 13,118 15,234 3,420 11,814
Transport 11,149 804 10,345 10,107 1,347 8,760
Trade and Industry 3,404 793 2,611 3,881 925 2,956
Manpower (excluding Financial Security) 651 625 26 654 641 13
Info-Communications and Media Development3 590 453 136 592 508 84
Government Administration 2,235 1,767 468 2,615 1,935 680
Finance 820 761 59 1,031 856 175
Law 496 177 319 561 181 379
Organs of State 480 430 50 536 469 66
Prime Minister's Office 439 399 40 488 429 59
ST
AT
IST
ICA
L A
NN
EX
17
Table 3.4: Operating Expenditure by Sector for FY2010 to FY2016 ($ million)
FY2010 FY2011 FY2012 FY2013 FY2014 FY2015
(Revised) FY2016
(Budgeted)
Total1
33,270 35,150 36,421 39,725 42,685 48,726 54,427
Social Development 16,459 18,056 18,496 20,943 22,612 26,750 30,568
Education 8,999 9,698 9,637 10,665 10,712 11,400 12,140
National Development 790 1,428 949 673 858 1,372 2,550
Health 3,258 3,489 4,066 5,044 5,872 7,773 9,202
Environment and Water Resources 720 726 813 958 1,049 1,135 1,222
Culture, Community and Youth2 - - 364 1,003 1,335 1,797 1,449
Social and Family Development2 1,829 1,721 1,739 1,598 1,722 2,121 2,400
Communications and Information2 500 525 430 336 354 424 467
Manpower (Financial Security)
364 469 497 666 709 728 1,138
Security and External Relations 13,920 14,088 14,678 15,233 16,290 17,533 18,504
Defence 10,623 10,797 11,056 11,329 11,867 12,691 13,296
Home Affairs 2,937 2,947 3,266 3,522 4,029 4,383 4,761
Foreign Affairs 360 344 355 382 394 460 447
Economic Development 1,666 1,675 1,870 2,027 2,224 2,675 3,420
Transport 456 464 502 555 598 804 1,347
Trade and Industry 684 671 685 710 729 793 925
Manpower (excluding Financial Security) 439 380 456 496 520 625 641
Info-Communications and Media Development2 88 160 227 267 378 453 508
Government Administration 1,225 1,331 1,378 1,521 1,560 1,767 1,935
Finance 552 617 631 711 682 761 856
Law 119 123 163 167 177 177 181
Organs of State 313 318 326 352 384 430 469
Prime Minister's Office 240 273 259 290 318 399 429
Note: Figures may not add up due to rounding.
1 The expenditure estimates do not include Special Transfers and spending from Government Endowment and Trust Funds.
2 With effect from 1 November 2012, the Ministry of Community Development, Youth and Sports (MCYS) and the Ministry of Information, Communications and the Arts (MICA) were restructured to form three Ministries: (i) MCYS was re-named as the Ministry of Social and Family Development (MSF), (ii) MICA was re-named as the Ministry of Communications and Information (MCI) and (iii) the new Ministry of Culture, Community and Youth (MCCY) was formed to undertake functions transferred from MCYS and MICA.
ST
AT
IST
ICA
L A
NN
EX
18
Table 3.5: Development Expenditure by Sector for FY2010 to FY2016 ($ million)
FY2010 FY2011 FY2012 FY2013 FY2014 FY2015
(Revised) FY2016
(Budgeted)
Total1 12,068 11,413 12,583 12,003 13,963 19,682 19,003
Social Development 3,643 3,603 3,382 3,236 4,595 5,186 5,187
Education 877 1,042 860 973 886 700 660
National Development 1,646 1,572 1,354 901 1,308 1,364 1,246
Health 485 453 605 723 1,147 1,474 1,798
Environment and Water Resources 406 349 352 325 427 567 704
Culture, Community and Youth2
- - 95 212 617 804 563
Social and Family Development2 120 64 37 41 62 115 100
Communications and Information2 109 123 79 61 148 162 117
Manpower (Financial Security)
0 0 0 0 0 0 0
Security and External Relations 718 718 720 860 906 911 1,322
Defence 438 479 468 422 429 431 671
Home Affairs 240 194 207 379 438 465 575
Foreign Affairs 40 44 45 59 40 15 76
Economic Development 7,490 6,896 7,955 7,547 7,923 13,118 11,814
Transport 4,250 4,003 5,414 5,504 5,489 10,345 8,760
Trade and Industry 2,673 2,553 2,387 1,947 2,102 2,611 2,956
Manpower (excluding Financial Security) 42 62 28 28 37 26 13
Info-Communications and Media Development2 525 278 126 68 296 136 84
Government Administration 217 197 527 360 539 468 680
Finance 21 30 24 25 44 59 175
Law 148 130 316 273 434 319 379
Organs of State 14 17 163 22 23 50 66
Prime Minister's Office 34 20 23 40 38 40 59
Note: Figures may not add up due to rounding.
1 Development Expenditure excludes land-related expenditure. These expenditure estimates also do not include Special Transfers and spending from Government Endowment and Trust Funds.
2 With effect from 1 November 2012, the Ministry of Community Development, Youth and Sports (MCYS) and the Ministry of Information, Communications and the Arts (MICA) were restructured to form three Ministries: (i) MCYS was re-named as the Ministry of Social and Family Development (MSF), (ii) MICA was re-named as the Ministry of Communications and Information (MCI) and (iii) the new Ministry of Culture, Community and Youth (MCCY) was formed to undertake functions transferred from MCYS and MICA.
ST
AT
IST
ICA
L A
NN
EX
19
Table 3.6a: Total Expenditure by Sector for FY2010 to FY2016 ($ million)
FY2010 FY2011 FY2012 FY2013 FY2014 FY2015
(Revised) FY2016
(Budgeted)
Total1 45,338 46,563 49,004 51,728 56,648 68,409 73,431
Social Development 20,102 21,660 21,877 24,179 27,207 31,936 35,755
Education 9,875 10,740 10,497 11,638 11,598 12,100 12,800
National Development 2,436 3,000 2,303 1,574 2,166 2,736 3,796
Health 3,743 3,942 4,671 5,767 7,019 9,247 11,000
Environment and Water Resources 1,126 1,075 1,165 1,283 1,476 1,702 1,926
Culture, Community and Youth2
- - 460 1,215 1,952 2,601 2,012
Social and Family Development2 1,949 1,785 1,776 1,639 1,784 2,236 2,500
Communications and Information2 609 647 508 397 503 586 583
Manpower (Financial Security)
364 469 497 666 709 728 1,138
Security and External Relations 14,638 14,806 15,397 16,094 17,196 18,444 19,826
Defence 11,061 11,276 11,524 11,751 12,295 13,122 13,967
Home Affairs 3,177 3,141 3,473 3,901 4,467 4,848 5,336
Foreign Affairs 399 388 400 441 434 475 523
Economic Development 9,157 8,570 9,825 9,574 10,147 15,793 15,234
Transport 4,706 4,467 5,916 6,059 6,086 11,149 10,107
Trade and Industry 3,357 3,224 3,073 2,656 2,830 3,404 3,881
Manpower (excluding Financial Security) 482 442 484 524 557 651 654
Info-Communications and Media Development2 613 438 353 335 674 590 592
Government Administration 1,442 1,528 1,904 1,881 2,099 2,235 2,615
Finance 573 647 655 737 726 820 1,031
Law 267 253 479 440 611 496 561
Organs of State 327 335 489 374 406 480 536
Prime Minister's Office 274 293 282 330 355 439 488
Note: Figures may not add up due to rounding.
1 The expenditure estimates do not include Special Transfers and spending from Government Endowment and Trust Funds.
2 With effect from 1 November 2012, the Ministry of Community Development, Youth and Sports (MCYS) and the Ministry of Information, Communications and the Arts (MICA) were restructured to form three Ministries: (i) MCYS was re-named as the Ministry of Social and Family Development (MSF), (ii) MICA was re-named as the Ministry of Communications and Information (MCI) and (iii) the new Ministry of Culture, Community and Youth (MCCY) was formed to undertake functions transferred from MCYS and MICA.
ST
AT
IST
ICA
L A
NN
EX
20
Table 3.6b: Total Expenditure by Sector for FY2010 to FY2016 (% of GDP)1
FY2010 FY2011 FY2012 FY2013 FY2014 FY2015
(Revised) FY2016
(Budgeted)
Total2 13.7% 13.3% 13.5% 13.7% 14.4% 17.0% 17.9%
Social Development 6.1% 6.2% 6.0% 6.4% 6.9% 7.9% 8.7%
Education 3.0% 3.1% 2.9% 3.1% 2.9% 3.0% 3.1%
National Development 0.7% 0.9% 0.6% 0.4% 0.6% 0.7% 0.9%
Health 1.1% 1.1% 1.3% 1.5% 1.8% 2.3% 2.7%
Environment and Water Resources 0.3% 0.3% 0.3% 0.3% 0.4% 0.4% 0.5%
Culture, Community and Youth3
- - 0.1% 0.3% 0.5% 0.6% 0.5%
Social and Family Development3 0.6% 0.5% 0.5% 0.4% 0.5% 0.6% 0.6%
Communications and Information3 0.2% 0.2% 0.1% 0.1% 0.1% 0.1% 0.1%
Manpower (Financial Security)
0.1% 0.1% 0.1% 0.2% 0.2% 0.2% 0.3%
Security and External Relations 4.4% 4.2% 4.2% 4.2% 4.4% 4.6% 4.8%
Defence 3.3% 3.2% 3.2% 3.1% 3.1% 3.3% 3.4%
Home Affairs 1.0% 0.9% 1.0% 1.0% 1.1% 1.2% 1.3%
Foreign Affairs 0.1% 0.1% 0.1% 0.1% 0.1% 0.1% 0.1%
Economic Development 2.8% 2.4% 2.7% 2.5% 2.6% 3.9% 3.7%
Transport 1.4% 1.3% 1.6% 1.6% 1.5% 2.8% 2.5%
Trade and Industry 1.0% 0.9% 0.8% 0.7% 0.7% 0.8% 0.9%
Manpower (excluding Financial Security) 0.1% 0.1% 0.1% 0.1% 0.1% 0.2% 0.2%
Info-Communications and Media Development3 0.2% 0.1% 0.1% 0.1% 0.2% 0.1% 0.1%
Government Administration 0.4% 0.4% 0.5% 0.5% 0.5% 0.6% 0.6%
Finance 0.2% 0.2% 0.2% 0.2% 0.2% 0.2% 0.3%
Law 0.1% 0.1% 0.1% 0.1% 0.2% 0.1% 0.1%
Organs of State 0.1% 0.1% 0.1% 0.1% 0.1% 0.1% 0.1%
Prime Minister's Office 0.1% 0.1% 0.1% 0.1% 0.1% 0.1% 0.1%
Note: Figures may not add up due to rounding.
1 Data may differ from previous years due to revisions to GDP estimates.
2 The expenditure estimates do not include Special Transfers and spending from Government Endowment and Trust Funds.
3 With effect from 1 November 2012, the Ministry of Community Development, Youth and Sports (MCYS) and the Ministry of Information, Communications and the Arts (MICA) were restructured to form three Ministries: (i) MCYS was re-named as the Ministry of Social and Family Development (MSF), (ii) MICA was re-named as the Ministry of Communications and Information (MCI) and (iii) the new Ministry of Culture, Community and Youth (MCCY) was formed to undertake functions transferred from MCYS and MICA.
ST
AT
IST
ICA
L A
NN
EX
21
Table 3.7: Total Expenditure by Expenditure Type for FY2010 to FY2016 ($ million)
FY2010 FY2011 FY2012 FY2013 FY2014 FY2015
(Revised) FY2016
(Budgeted)
Total Expenditure1 45,338 46,563 49,004 51,728 56,648 68,409 73,431
Operating Expenditure 33,270 35,150 36,421 39,725 42,685 48,726 54,427
Running Costs 25,910 26,733 27,530 29,126 31,423 35,374 38,780
Expenditure on Manpower 5,857 5,668 6,231 6,844 7,409 8,115 8,667
Other Operating Expenditure 14,067 14,318 14,644 15,216 16,097 17,685 18,686
Grants, Subventions & Capital Injections to Organisations 5,986 6,747 6,654 7,066 7,916 9,575 11,428
Transfers 7,360 8,417 8,891 10,599 11,262 13,352 15,647
Social Transfers to Individuals 1,483 1,690 1,910 2,382 2,543 3,179 4,178
Transfers to Institutions & Organisations 5,742 6,622 6,871 8,046 8,596 9,985 11,252
International Organisations & Overseas Development Assistance 136 105 109 171 123 188 217
Development Expenditure2 12,068 11,413 12,583 12,003 13,963 19,682 19,003
Government Development 4,529 4,388 4,760 4,045 4,654 5,211 6,789
Grants & Capital Injections to Organisations 7,538 7,025 7,823 7,958 9,309 14,471 12,214
Note: Figures may not add up due to rounding.
1 The expenditure estimates do not include Special Transfers and spending from Government Endowment and Trust Funds.
2 Development Expenditure excludes land-related expenditure.
ST
AT
IST
ICA
L A
NN
EX
22
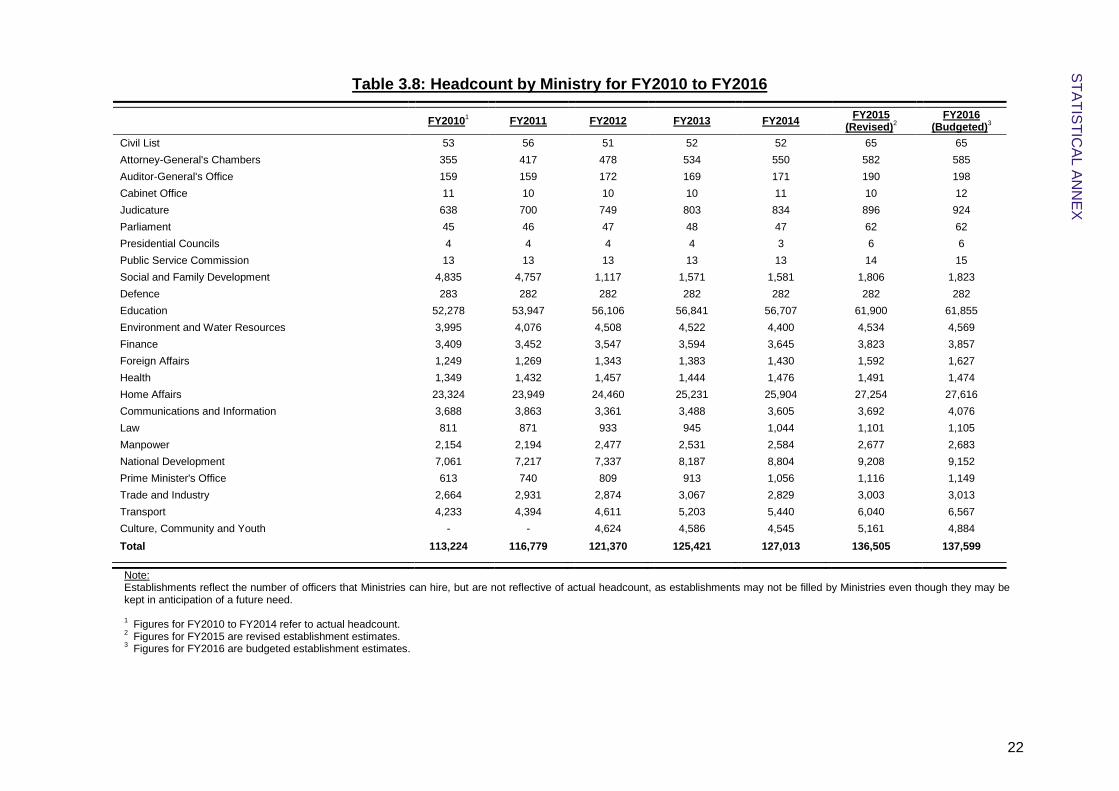
Table 3.8: Headcount by Ministry for FY2010 to FY2016
FY20101 FY2011 FY2012 FY2013 FY2014
FY2015 (Revised)
2
FY2016 (Budgeted)
3
Civil List 53 56 51 52 52 65 65
Attorney-General's Chambers 355 417 478 534 550 582 585
Auditor-General's Office 159 159 172 169 171 190 198
Cabinet Office 11 10 10 10 11 10 12
Judicature 638 700 749 803 834 896 924
Parliament 45 46 47 48 47 62 62
Presidential Councils 4 4 4 4 3 6 6
Public Service Commission 13 13 13 13 13 14 15
Social and Family Development 4,835 4,757 1,117 1,571 1,581 1,806 1,823
Defence 283 282 282 282 282 282 282
Education 52,278 53,947 56,106 56,841 56,707 61,900 61,855
Environment and Water Resources 3,995 4,076 4,508 4,522 4,400 4,534 4,569
Finance 3,409 3,452 3,547 3,594 3,645 3,823 3,857
Foreign Affairs 1,249 1,269 1,343 1,383 1,430 1,592 1,627
Health 1,349 1,432 1,457 1,444 1,476 1,491 1,474
Home Affairs 23,324 23,949 24,460 25,231 25,904 27,254 27,616
Communications and Information 3,688 3,863 3,361 3,488 3,605 3,692 4,076
Law 811 871 933 945 1,044 1,101 1,105
Manpower 2,154 2,194 2,477 2,531 2,584 2,677 2,683
National Development 7,061 7,217 7,337 8,187 8,804 9,208 9,152
Prime Minister's Office 613 740 809 913 1,056 1,116 1,149
Trade and Industry 2,664 2,931 2,874 3,067 2,829 3,003 3,013
Transport 4,233 4,394 4,611 5,203 5,440 6,040 6,567
Culture, Community and Youth - - 4,624 4,586 4,545 5,161 4,884
Total 113,224 116,779 121,370 125,421 127,013 136,505 137,599
Note: Establishments reflect the number of officers that Ministries can hire, but are not reflective of actual headcount, as establishments may not be filled by Ministries even though they may be kept in anticipation of a future need.
1 Figures for FY2010 to FY2014 refer to actual headcount.
2 Figures for FY2015 are revised establishment estimates.
3 Figures for FY2016 are budgeted establishment estimates.
ST
AT
IST
ICA
L A
NN
EX
23
GLOSSARY
24
Glossary of Terms Assets Taxes Assets Taxes refer to Property Tax and Estate Duty. Property Tax is a tax on the ownership of property and is payable by all property owners on the properties owned by them. Estate Duty is a tax on the total market value of a person's assets (cash and non-cash) at the date of his or her death. Estate Duty will not apply to a person who dies after 15 February 2008. Customs Duties Taxes on goods imported into Singapore. In Singapore, Customs Duties are principally imposed on alcoholic beverages. Development Expenditure Expenses that represent a longer-term investment or result in the formation of a capitalisable asset of the Government. Examples of spending areas are the acquisition of heavy equipment, as well as capitalisable assets, e.g. buildings and roads. Excise Duties Taxes on goods, whether manufactured in Singapore or elsewhere. In Singapore, Excise Duties are imposed principally on tobacco, petroleum products, motor vehicles and liquor to achieve social and transport policy objectives. Fiscal Impulse The fiscal impulse provides a measure of the macroeconomic impact of the Budget; a positive impulse indicates a more expansionary fiscal stance than the previous year while a negative impulse indicates a less expansionary (or more contractionary) stance. Financial Year (FY) The Singapore Government’s Financial Year 2016 is from 1 April 2016 to 31 March 2017. Government Endowment Fund A fund established with an injection of government monies as principal on which the income generated will be used to
finance specific programmes on an ongoing basis. Examples of government endowment funds include the Community Care Endowment Fund, Edusave Endowment Fund, ElderCare Fund, Lifelong Learning Endowment Fund and Medical Endowment Fund. Government Trust Fund A fund established with an injection of government monies as principal, which is drawn down to finance specific programmes on an ongoing basis. Examples of government trust funds include the National Research Fund and the GST Voucher Fund. Motor Vehicle Taxes Motor Vehicle Taxes comprise additional registration fees, road tax, special tax on heavy-oil engines, passenger vehicle seating fees and non-motor vehicle licences, but exclude excise duties on motor vehicles which are classified under Customs and Excise Taxes. Net Investment Returns Contribution Contributions from the investment returns on our reserves, where Net Investment Returns Contributions (NIRC) is the sum of: (1) up to 50% of the expected long-term real return on the relevant assets specified in the Constitution; and (2) up to 50% of the net investment income on the remaining assets. Operating Revenue Government receipts credited to the Consolidated Revenue Account and Development Fund Account, excluding investment and interest income, and capital receipts (lumpy and less regular in timing). The main components are Corporate Income Tax, Personal Income Tax and Goods and Services Tax. Operating Expenditure Expenses incurred to maintain the operations and other regular activities of the Government. Components include expenditure on manpower, other operating expenditure and operating grants to Statutory Boards and other institutions.
25
Other Taxes Other taxes comprise the Foreign Worker Levy, Development Charge, Annual Tonnage Tax and Water Conservation Tax. Output Gap The difference between the actual level of activity in an economy (as measured by GDP) versus the sustainable amount of activity given the capacity of the economy (i.e. the level of GDP that the economy could potentially achieve without creating unhealthy inflationary pressures). It measures the degree of resource utilisation of the economy. The output gap is typically reported as a percentage of GDP to give a sense of the proportion to which the economy is over or under capacity. Where the output gap is negative, the economy is not operating at full capacity, with higher levels of unemployment. Where the output gap is positive, it indicates that the economy is operating at over-capacity, resources are stretched and inflation pressures are strong. To promote macroeconomic stability, the Government’s fiscal policies aim to be countercyclical - contractionary to prevent overheating when the economy has a positive output gap, and expansionary to stimulate growth when the economy has a negative output gap. Past Reserves The reserves not accumulated by the Government during its current term of office, with reserves being the excess of assets over liabilities. Primary Budget Position The Primary Budget Position, defined as Operating Revenue less Total Expenditure, measures the ability of the Government to meet its annual expenditures through its regular collection of revenue (taxes, fees and charges). Stamp Duty A tax imposed on commercial and legal documents relating to unlisted stocks and shares and immovable property.
Statutory Boards’ Contributions Statutory Boards are required under the Statutory Corporations (Contributions to Consolidated Fund) Act to provide revenues not allocated to specific purposes by any written law into the Government Consolidated Fund. Total Expenditure Sum of Operating and Development Expenditure. It excludes Special Transfers unless otherwise mentioned. Withholding Tax A non-resident is liable to pay income tax on Singapore-sourced income. Under the law, when a person makes payment of a specified nature to a non-resident, he has to withhold a percentage of that payment and pay the amount withheld to IRAS. The amount withheld is called the Withholding Tax. Year of Assessment (YA) Year in which tax on the income earned in the preceding year is assessed.