fy2016 annual report - st. louis lambert international … · fy2016 annual report. ... the new...
TRANSCRIPT
Strategic Plan 2015 - 2020FY2016 Annual Report

St. Louis Lambert International Airport’s strategic plan through 2020 offers tremendous guidance on measured, tactical changes to create
the biggest impact for our passengers, our customers and the St. Louis region. FY16 marks the second year in the plan, which touches all
four core areas and the overarching mission of operational excellence.
The new 5-year Use and Lease Agreement with our airline partners was finalized in FY16 and will serve the core strategy of strengthening
our financial stability through the remainder of the strategic plan. It sets the framework for leases, revenues and more financial flexibility
for this airport. It allows for new investment in safety and operations, while also making the Airport more attractive for new or expanded
service by airlines. Even under the terms of the previous use and lease agreement, the Airport has made great strides in reducing costs
per enplaned passenger, and improving our revenue position for concessions, parking and other operations.
FY16 marked a great year of expansion for airline service with eight new destinations, and a focus on connecting many Midwest markets,
which is boosting our connecting traffic. It brought modest passenger growth this fiscal year, but it will show tremendous gains in FY18,
when there’s a full year of activity with these new markets.
The growth in markets, topping 70 nonstop destinations in the summer of FY16/17, facilitated leasing of two previously closed gates in
Terminal 2. Those are now being operated by Southwest Airlines. In connection with that expansion, the Airport made additional restroom,
signage and flooring improvements through all of Terminal 2. These upgrades are critical to provide passengers with updated amenities
and wayfinding.
Lastly, our commitment to efficient and safe operations is never ending. The Airport was recognized this year for its energy savings projects
that has netted $490,000 through three years as part of a rebate program with Ameren Missouri. The campaign is directly tied to the
Airport’s environmental and sustainability efforts that aligns with the City of St. Louis goals for better environmental stewardship. The
incentives are reward enough, but so are the energy savings we earn to make St. Louis Lambert International Airport even more competitive.
Sincerely,
Rhonda Hamm-Niebruegge / Director – St. Louis Lambert International Airport
Messsage from the Director
1
2
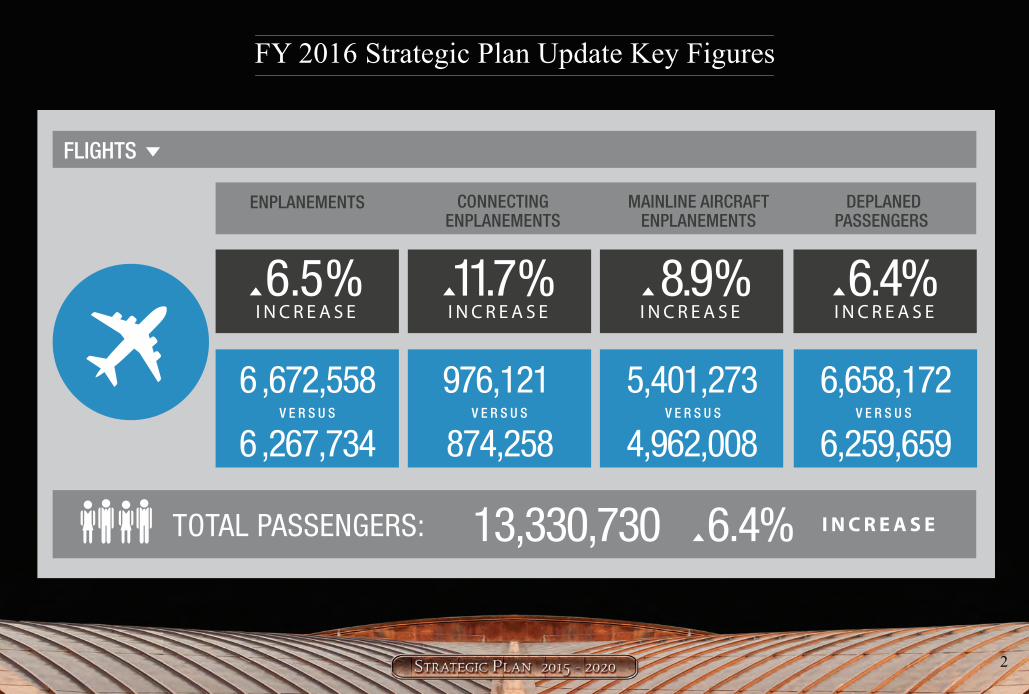
FY 2016 Strategic Plan Update Key Figures
I N C R EA S E11.7%
I N C R EA S E
ENPLANEMENTS
V E R S U S V E R S U S V E R S U S
CONNECTINGENPLANEMENTS
MAINLINE AIRCRAFTENPLANEMENTS
6.5%
6,672,558
6,267,734
976,121
874,258
5,401,273
4,962,008
I N C R EA S E8.9%
DEPLANEDPASSENGERS
6,658,172
6,259,659
I N C R EA S E6.4%
V E R S U S
TOTAL PASSENGERS: I N C R E A S E13,330,730 6.4%
FLIGHTS
3
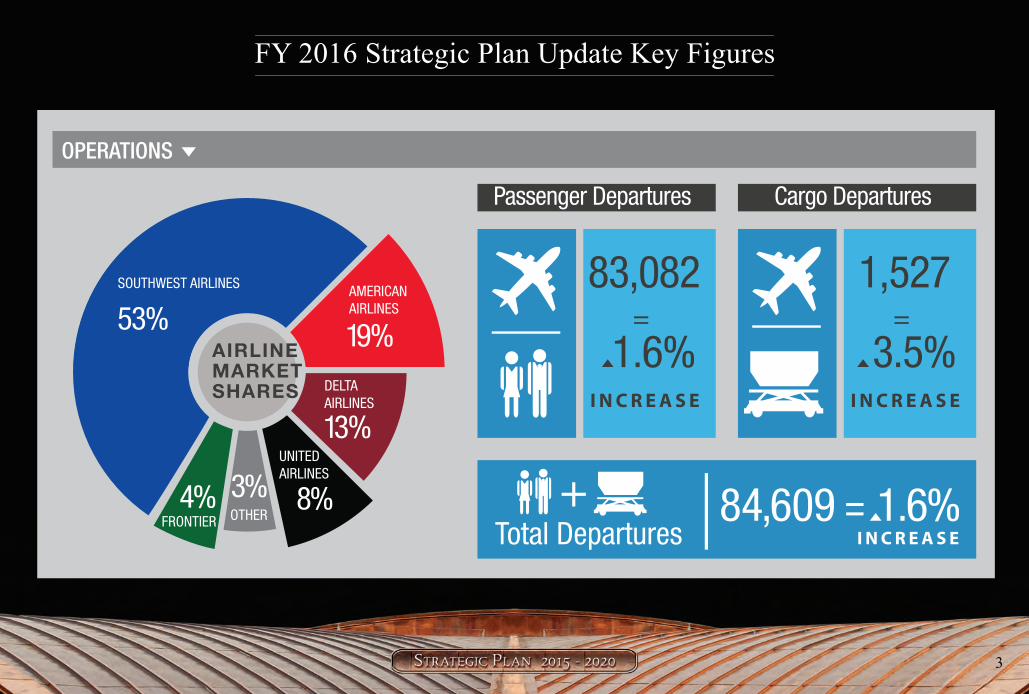
FY 2016 Strategic Plan Update Key Figures
OPERATIONS
Total Departures I N C R E A S E
I N C R E A S E
83,082=
1.6%
Passenger Departures
I N C R E A S E
1,527=
3.5%
Cargo Departures
+
53% 19%
13%
8%3%4%
AIRLINEMARKETSHARES
SOUTHWEST AIRLINES AMERICANAIRLINES
DELTAAIRLINES
UNITEDAIRLINES
OTHERFRONTIER 84,609 = 1.6%
4
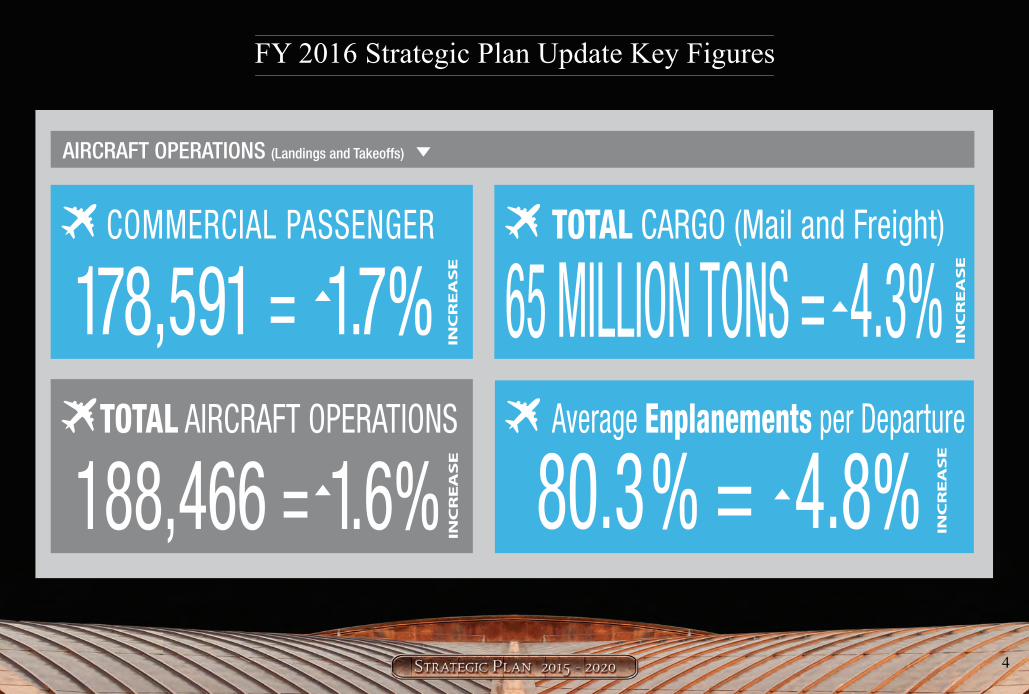
Average Enplanements per Departure
COMMERCIAL PASSENGER
178,591 = 1.7% IN
CR
EA
SE
65 MILLION TONS = 4.3%
80.3% = 4.8%TOTAL AIRCRAFT OPERATIONS
TOTAL CARGO (Mail and Freight)
188,466 = 1.6%
AIRCRAFT OPERATIONS (Landings and Takeoffs)
FY 2016 Strategic Plan Update Key Figures
INC
RE
AS
E
INC
RE
AS
E
INC
RE
AS
E
5
FY16 Highlights
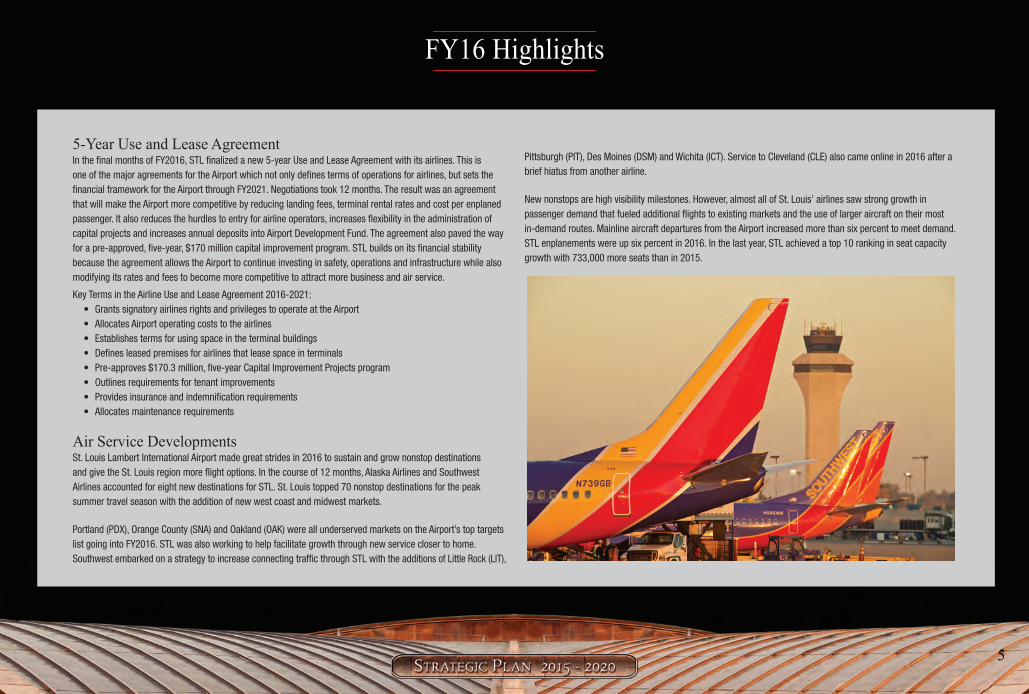
5-Year Use and Lease AgreementIn the final months of FY2016, STL finalized a new 5-year Use and Lease Agreement with its airlines. This isone of the major agreements for the Airport which not only defines terms of operations for airlines, but sets thefinancial framework for the Airport through FY2021. Negotiations took 12 months. The result was an agreementthat will make the Airport more competitive by reducing landing fees, terminal rental rates and cost per enplaned passenger. It also reduces the hurdles to entry for airline operators, increases flexibility in the administration of capital projects and increases annual deposits into Airport Development Fund. The agreement also paved the way for a pre-approved, five-year, $170 million capital improvement program. STL builds on its financial stability because the agreement allows the Airport to continue investing in safety, operations and infrastructure while also modifying its rates and fees to become more competitive to attract more business and air service.
Key Terms in the Airline Use and Lease Agreement 2016-2021: • Grants signatory airlines rights and privileges to operate at the Airport • Allocates Airport operating costs to the airlines • Establishes terms for using space in the terminal buildings • Defines leased premises for airlines that lease space in terminals • Pre-approves $170.3 million, five-year Capital Improvement Projects program • Outlines requirements for tenant improvements • Provides insurance and indemnification requirements • Allocates maintenance requirements
Air Service DevelopmentsSt. Louis Lambert International Airport made great strides in 2016 to sustain and grow nonstop destinationsand give the St. Louis region more flight options. In the course of 12 months, Alaska Airlines and SouthwestAirlines accounted for eight new destinations for STL. St. Louis topped 70 nonstop destinations for the peak summer travel season with the addition of new west coast and midwest markets.
Portland (PDX), Orange County (SNA) and Oakland (OAK) were all underserved markets on the Airport’s top targets list going into FY2016. STL was also working to help facilitate growth through new service closer to home. Southwest embarked on a strategy to increase connecting traffic through STL with the additions of Little Rock (LIT),
Pittsburgh (PIT), Des Moines (DSM) and Wichita (ICT). Service to Cleveland (CLE) also came online in 2016 after a brief hiatus from another airline.
New nonstops are high visibility milestones. However, almost all of St. Louis’ airlines saw strong growth in passenger demand that fueled additional flights to existing markets and the use of larger aircraft on their mostin-demand routes. Mainline aircraft departures from the Airport increased more than six percent to meet demand. STL enplanements were up six percent in 2016. In the last year, STL achieved a top 10 ranking in seat capacity growth with 733,000 more seats than in 2015.

6
New Destinations/Routes 1. Portland, OR (PDX) – Alaska- July 1, 2015 2. Orange County, CA (SNA) – Southwest – November 28, 2015 3. Little Rock, AR (LIT) – Southwest – January 6, 2016 4. Pittsburgh, PA (PIT) – Southwest – March 10, 2016 5. Des Moines, IA (DSM) – Southwest – April 12, 2016 6. Wichita, KS (ICT) – Southwest –April 12, 2016 7. Oakland, CA (OAK) – Southwest – June 5, 2016 8. Cleveland, OH (CLE) – Southwest – June 5, 2016
Revenue PerformanceThe Airport’s revenue performance and improved airfield activity paved the way for a substantial decrease in Cost per Enplaned Passenger to $11.89, or a drop of $1.76 per passenger. There are two ways to look at airport revenues.On the airfield side, revenues can fall when there is increased aircraft activity or increased activity and landed weight. That’s what happened this past year and it’s a healthy trend. The Airport has increased activity and landed weight,thus reducing our operating airfield costs. The other side of airport revenues are those that give the airport spending power and financial stability beyond a single year. Revenues from parking, concessions and facility leases fit thatcategory. A portion of those revenues go back into the Airport’s development fund for future projects. Parking revenues were 16 percent higher this year, netting three million dollars more in revenue vs. FY15. Food/Beverage increased1.5 percent and specialty retail increased nearly 14 percent.
FY16 Highlights

7
FY16 Highlights
Improvements and AmenitiesSt. Louis Lambert International Airport began FY2016 focused on addressing needed facility improvements inTerminal 2. There, the much newer facility needed more modest improvements. Much like in Terminal 1, the focus was on the most critical areas which included renovating all restrooms for a more welcoming experience. With the high volume of passenger traffic in Terminal 2, the main corridor carpet needed an overhaul. The Airport chose to replace it with ceramic tile which instantly brightened the terminal’s gate-side appearance. The new flooring will also be easier to clean and maintain in the years to come. The third terminal-wide improvement was the upgrade to blue wayfinding signs – refurbished from their original brown color. The signs were updated for more concise wayfinding directions. An updated font also makes the signs easier to read for all travelers.
The transformation continued in the spring of 2016 with expansion in Terminal 2. The airport re-opened Gates E31 and E33, which had been closed for several years. Improvements also included new corridor tile and restroom improvements to the expanded area serving gates E29, E31, E33. Southwest Airlines began full timeoperations in the expanded gate areas with additional renovations including new carpeting, customer service counters and signage.
The airport also worked with HMSHost and Hudson to open a new Stella Artois bar and a Hudson News & Gift wall kiosk to serve the growing passenger traffic to that end of the terminal.
We also gave a toast to the first Vino Volo Wine Bar in Terminal 2. The cozy wine lounge concept, located near Gate E18, was an instant hit for Southwest passengers who can select wine from around the world with a food menu to match. Access to expedited screening options expanded in 2016 with the addition of a Global Entry Enrollment Center at STL. The program operated by the U.S. Customs and Border Protection (CBP) processes applications for its trusted traveler programs, which allows members to use automated kiosks instead of traditional CBP inspection lines. TSA’s Pre-Check program, a trusted traveler program for domestic travel, opened an enrollment center at STL in 2014.
Finally, the passenger experience in 2016 was greatly enhanced by the expansion of the Lambert Art & Culture Program. It’s a program with a mission to bring a local cultural identity to the Airport through permanent artworks and temporary art exhibitions. The Airport’s temporary exhibition program expanded to Terminal 2 and other locations in Terminal 1 in partnership with some very prominent art institutions in St. Louis, including the Missouri History Museum, St. Louis Contemporary Art Museum and the Saint Louis Art Museum.

8
Environmental St. Louis Lambert International Airport’s drive to improve energy efficiency across all networks, buildings and power systems is paying off. In late 2015, Ameren Missouri presented a ceremonial check to Lambert for $490,642 at the December meeting of the St. Louis Airport Commission. The check represents nearly 30 projects that earned cash incentives over the last three years through Ameren Missouri’s BizSavers® Program.
The cash incentives are just one payback. The ongoing energy savings for the Airport are another. Ameren Missouri estimates the most recent projects have saved 8.1 million kilowatt-hours of electricity, equal to powering 575 homes for a year. STL is now saving more than $40,000 per month in avoided energy costs. Energy efficiency and conservation efforts at the Airport are guided by key strategies and goals in the City of St. Louis Sustainability Plan (2013) that targets lower greenhouse emissions for the region.
Airfield ImprovementsEvery year, the Airport focuses on operational excellence and safety. That means a driving commitment tomaintain and improve the Airport’s four-runway airfield. In FY16, STL invested more than $11.5 million inpavement rehabilitation projects that corresponded to our Airfield Pavement Management Plan, which isrequired by the FAA. The priority projects this year were the reconstruction of Taxiway (TW) Echo between TW Sand TW P. The Airport also reconstructed the North Apron, also known as Lima Pad.
FY16 Highlights
9
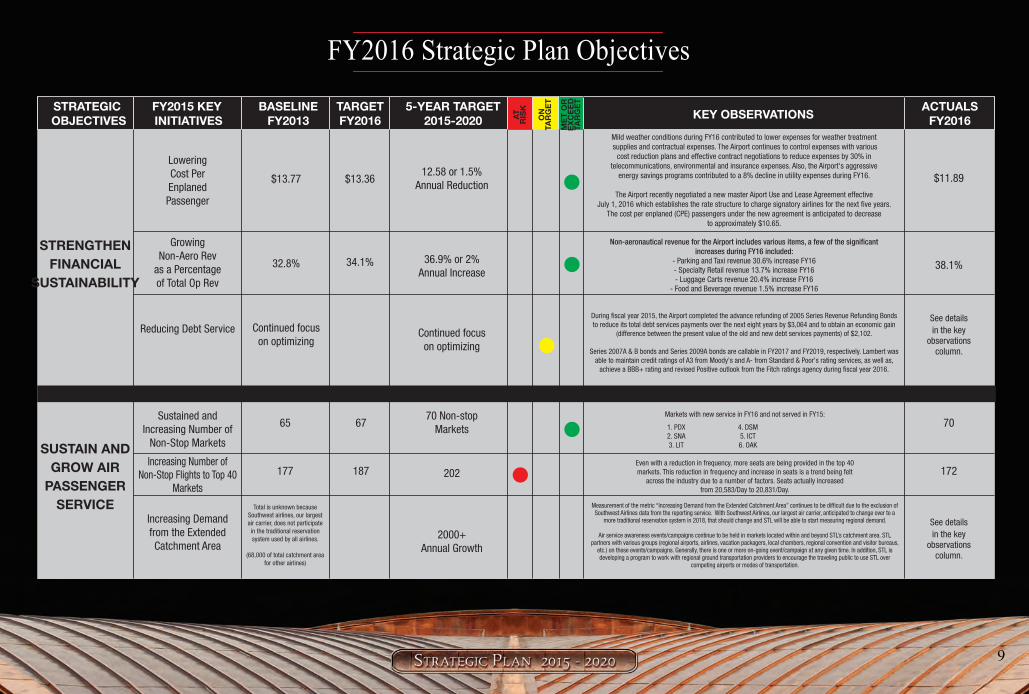
FY2016 Strategic Plan Objectives
STRENGTHENFINANCIAL
SUSTAINABILITY
SUSTAIN ANDGROW AIR
PASSENGERSERVICE
Lowering Cost PerEnplaned Passenger
Growing Non-Aero Rev
as a Percentage of Total Op Rev
Reducing Debt Service
$13.77
32.8%
Continued focus on optimizing
$11.89
38.1%
See details in the key
observations column.
$13.36
34.1%
12.58 or 1.5% Annual Reduction
36.9% or 2% Annual Increase
Continued focus on optimizing
Sustained and Increasing Number of
Non-Stop Markets
Increasing Number of Non-Stop Flights to Top 40
Markets
Increasing Demand from the Extended Catchment Area
65
177
Total is unknown because Southwest airlines, our largest air carrier, does not participate in the traditional reservation system used by all airlines.
(68,000 of total catchment area for other airlines)
70
172
See details in the key
observations column.
67
187
70 Non-stopMarkets
202
2000+Annual Growth
Markets with new service in FY16 and not served in FY15:
1. PDX 4. DSM 2. SNA 5. ICT 3. LIT 6. OAK Even with a reduction in frequency, more seats are being provided in the top 40
markets. This reduction in frequency and increase in seats is a trend being felt across the industry due to a number of factors. Seats actually increased
from 20,583/Day to 20,831/Day.
Measurement of the metric “Increasing Demand from the Extended Catchment Area” continues to be difficult due to the exclusion of Southwest Airlines data from the reporting service. With Southwest Airlines, our largest air carrier, anticipated to change over to a
more traditional reservation system in 2018, that should change and STL will be able to start measuring regional demand.
Air service awareness events/campaigns continue to be held in markets located within and beyond STL’s catchment area. STL partners with various groups (regional airports, airlines, vacation packagers, local chambers, regional convention and visitor bureaus,
etc.) on these events/campaigns. Generally, there is one or more on-going event/campaign at any given time. In addition, STL is developing a program to work with regional ground transportation providers to encourage the traveling public to use STL over
competing airports or modes of transportation.
Mild weather conditions during FY16 contributed to lower expenses for weather treatment supplies and contractual expenses. The Airport continues to control expenses with various
cost reduction plans and effective contract negotiations to reduce expenses by 30% in telecommunications, environmental and insurance expenses. Also, the Airport's aggressive
energy savings programs contributed to a 8% decline in utility expenses during FY16.
The Airport recently negotiated a new master Aiport Use and Lease Agreement effective July 1, 2016 which establishes the rate structure to charge signatory airlines for the next five years.
The cost per enplaned (CPE) passengers under the new agreement is anticipated to decrease to approximately $10.65.
Non-aeronautical revenue for the Airport includes various items, a few of the significant
increases during FY16 included:
- Parking and Taxi revenue 30.6% increase FY16- Specialty Retail revenue 13.7% increase FY16- Luggage Carts revenue 20.4% increase FY16
- Food and Beverage revenue 1.5% increase FY16
During fiscal year 2015, the Airport completed the advance refunding of 2005 Series Revenue Refunding Bonds to reduce its total debt services payments over the next eight years by $3,064 and to obtain an economic gain
(difference between the present value of the old and new debt services payments) of $2,102.
Series 2007A & B bonds and Series 2009A bonds are callable in FY2017 and FY2019, respectively. Lambert was able to maintain credit ratings of A3 from Moody's and A- from Standard & Poor's rating services, as well as,
achieve a BBB+ rating and revised Positive outlook from the Fitch ratings agency during fiscal year 2016.
STRATEGIC
FY2015 KEY BASELINE TARGET 5-YEAR TARGET
KEY OBSERVATIONS ACTUALS
OBJECTIVES INITIATIVES FY2013 FY2016 2015-2020 FY2016 AT
RIS
K
ON
TAR
GE
T
ME
T O
RE
XC
EE
DTA
RG
ET

10
FY2016 Strategic Plan Objectives
STRATEGIC
FY2015 KEY BASELINE TARGET 5-YEAR TARGET
KEY OBSERVATIONS ACTUALS
OBJECTIVES INITIATIVES FY2013 FY2016 2015-2020 FY2016 AT
RIS
K
ON
TAR
GE
T
ME
T O
RE
XC
EE
DTA
RG
ET
Improving Overall Airport Service
Quality (ASQ) Survey Satisfaction
Industry Recognition
Increasing Revenue Per Enplaned
Passenger(Revenue based on concessions only)
3.96 on5.0 scale
Nominations/Awards
$6.02
4.08 AVGfor FY16
See details in the key observations
column to the left.
$6.66
4.30 on 5.0 scaleor 1.4% Annual
Increase
Nominations/Awards
$7.18 or 3%Annual Increase
4.07 on5.0 scale
$6.38
The results for FY16 appear to be on target, however, the Airport has not improved at the pace of the other airports participating in the Airport Service Quality Survey. We will continue to work on improving
our service quality for the traveling public.
1) AIA Chicago Interiors Award: Terminal 1 Renovation
2) ENR Midwest: Best Project of the Year Award: Airports/Transit, Kwame Building Group, St. Louis Lambert International Airport, Airport Experience Renovation Program
3) ACI-NA Marketing Communications Awards: Winner- Customer Service Technology Innovation, Digital Directories
4) Airport Revenue News’ Director of the Year/ Medium Airports Division: Rhonda Hamm-Niebruegge
5) FAA Airport Certification Program Medal of Excellence: Discrepancy Free Annual Certification Inspection
Increasing Cargo Revenue as a Percentage of
Total Aero Revenue
Generating Annual Revenue from
Underutilized Land Assets
Increasing Number of Jobs from New Development
3.7%
$262K(FY2014)
Construction Jobs=88; Permanent Jobs=22
(FY2014)
4.0%
$478K
62 Construction Jobs
and 48 Permanent
Jobs
3.7%
2.6 acres of underutilized land sold: $152,000Concourse B events: $20,481
Vino Volo: $48,180Spire: $26,890
JetLinx: $90,000MHS: $196,020
MorphoTrust: $49,051MO Army Guard: $22,026
Total: $604,648
Construction - 266Permanent - 188
5.4% orescalating annual
increase
$1MM
460 new construction jobs by FY2020 and 100 new permanent
jobs by FY2020.
Strategic goals for this initiative are established to escalate per year as determined by the following schedule: FY15 - 3.8% FY18 - 4.5% FY16 - 4.0% FY19 - 4.9% FY17 - 4.2% FY20 - 5.4%
Strategic goals for this initiative are established per year as determined by the following schedule: FY15 - $368K FY18 - $728K FY16 - $478K FY19 - $868K FY17 - $593K FY20 - $1MM
Southwest Airlines opened Gates E31 and E33 during the fiscal year creating 59 permanent jobs and 15 construction jobs. Trans States Airlines added 129 permanent jobs to their operations with the expansion of their training facilities and additional air fleet. Boeing ramp reconstruction projects generated a total of 154 construction jobs during the fiscal year. Various tenant construction
jobs throughout the entire Airport generated 97 construction jobs.
CREATE APOSITIVE AND
LASTING IMAGE / FIRST IMPRESSION
GENERATEECONOMIC
DEVELOPMENT

11
Summary of Revenues, Expenses and Changes in Fund Net Position
FY2016 FY2015 $ Change % Change Operating revenues $136,694 140,248 (3,554) (2.5%) Operating expenses 131,237 124,207 7,030 5.7% Operating income 5,457 16,041 (10,584) (66.0%) Nonoperating expenses, net (4,788) (7,711) 2,923 (37.9%) Income (loss) before capital contributions, transfers, and extraordinary items, net 669 8,330 (7,661) (92.0%) Capital contributions 9,378 23,284 (13,906) (59.7%) Transfers out (6,415) (6,407) (8) 0.1% Extraordinary item – Natural disaster 678 1,737 (1,059) (61.0%) Increase in net position 4,310 26,944 (22,634) (84.0%) Cumulative effect of change in accounting principle - (13,372) 13,372 (100.0%) Net position, end of year $1,099,770 1,095,460 4,310 0.4%
(Dollars in thousands, unless otherwise indicated)
The Airport’s revenues, expenses and changes in fund net position for the fiscal years ended June 30, 2016 are summarized as follows:
12
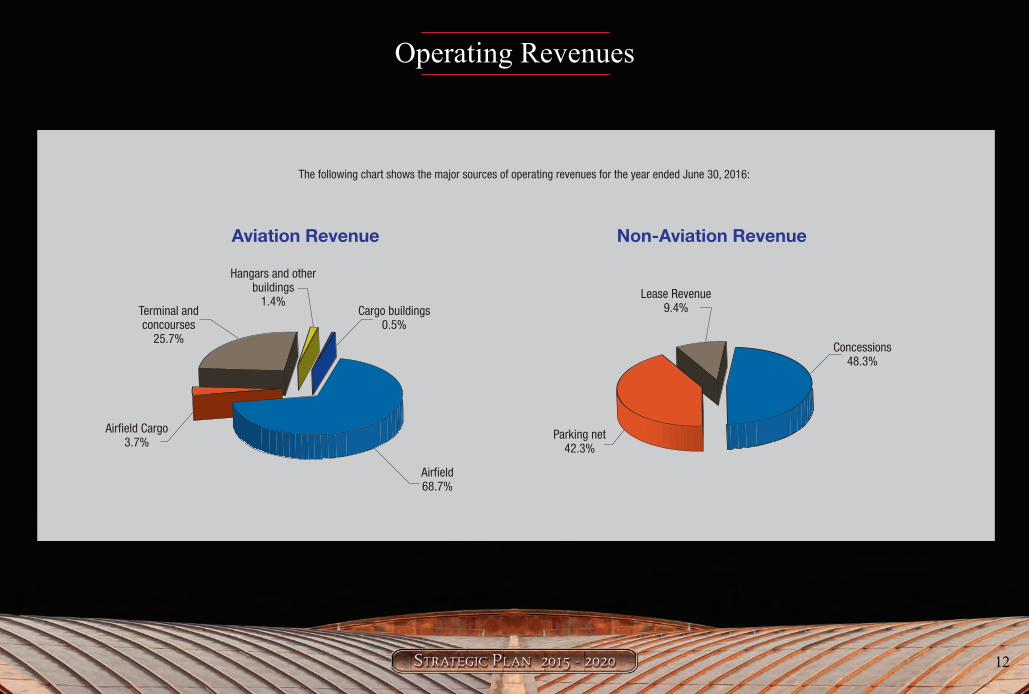
Operating Revenues
The following chart shows the major sources of operating revenues for the year ended June 30, 2016:
Airfield68.7%
Cargo buildings0.5%
Hangars and otherbuildings
1.4%Terminal andconcourses
25.7%
Airfield Cargo3.7%
Aviation Revenue Non-Aviation Revenue
Lease Revenue9.4%
Parking net42.3%
Concessions48.3%
13
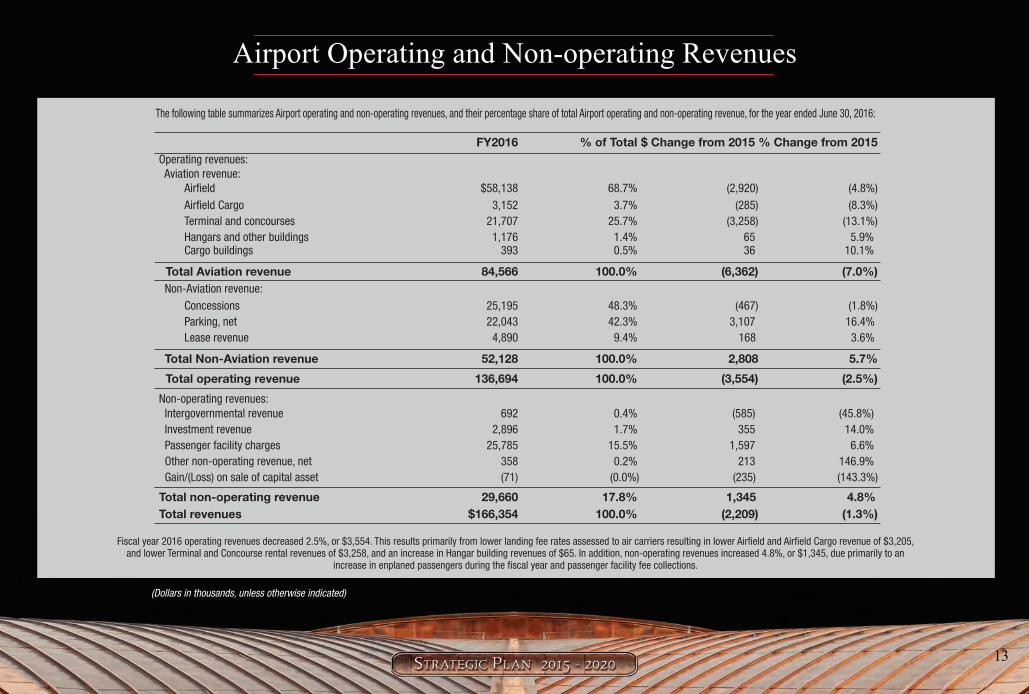
Airport Operating and Non-operating Revenues
The following table summarizes Airport operating and non-operating revenues, and their percentage share of total Airport operating and non-operating revenue, for the year ended June 30, 2016:
FY2016 % of Total $ Change from 2015 % Change from 2015 Operating revenues: Aviation revenue: Airfield $58,138 68.7% (2,920) (4.8%) Airfield Cargo 3,152 3.7% (285) (8.3%) Terminal and concourses 21,707 25.7% (3,258) (13.1%) Hangars and other buildings 1,176 1.4% 65 5.9% Cargo buildings 393 0.5% 36 10.1%
Total Aviation revenue 84,566 100.0% (6,362) (7.0%) Non-Aviation revenue: Concessions 25,195 48.3% (467) (1.8%) Parking, net 22,043 42.3% 3,107 16.4% Lease revenue 4,890 9.4% 168 3.6%
Total Non-Aviation revenue 52,128 100.0% 2,808 5.7%
Total operating revenue 136,694 100.0% (3,554) (2.5%)
Non-operating revenues: Intergovernmental revenue 692 0.4% (585) (45.8%) Investment revenue 2,896 1.7% 355 14.0% Passenger facility charges 25,785 15.5% 1,597 6.6% Other non-operating revenue, net 358 0.2% 213 146.9% Gain/(Loss) on sale of capital asset (71) (0.0%) (235) (143.3%)
Total non-operating revenue 29,660 17.8% 1,345 4.8% Total revenues $166,354 100.0% (2,209) (1.3%)
Fiscal year 2016 operating revenues decreased 2.5%, or $3,554. This results primarily from lower landing fee rates assessed to air carriers resulting in lower Airfield and Airfield Cargo revenue of $3,205, and lower Terminal and Concourse rental revenues of $3,258, and an increase in Hangar building revenues of $65. In addition, non-operating revenues increased 4.8%, or $1,345, due primarily to an
increase in enplaned passengers during the fiscal year and passenger facility fee collections.
(Dollars in thousands, unless otherwise indicated)
14
St. Louis Airport Commission*
Rhonda Hamm-NiebrueggeDirector of Airports, Chairperson
Jeffrey AboussiePresident
Regional Strategies
John BalesDirector of Aviation
Spirit of St. Louis Airport
Sean R. FitzgeraldVice President of Airport Property, Construction and
Environmental Enterprise Holdings
June FowlerSenior Vice President, Corporate and Public Communications
BJC HealthCare
Darlene GreenComptroller
St. Louis City
Dick HrabkoRetired, former Director of
St. Louis Lambert International Airport
Samuel JenkinsOwner
SPJ Consulting, LLC.
Lyda KrewsonAlderman, 28th Ward
St. Louis Board of Aldermen
Benjamin A. LipmanAttorney
Lewis, Rice & Fingersh, LC
Richard Nemanick, Ph.D.Co-founder, principal consultant
The Leadership Effect
Kathleen OsbornExecutive Director
The Regional Business Council
Lewis ReedPresident
St. Louis Board of Aldermen
Richard A. SaugetFounder, President
East County Enterprises
John “Jack” StelzerRetired
St. Louis City Democratic Committeeman-8th Ward
Marilyn TeitelbaumAttorney
Schuchat, Cook & Werner
*St. Louis Airport Commissioners as of February 2017

St. Louis Lambert International Airport and other trademarks identified herein are trademarks exclusively owned by the City of St. Louis, Missouri, owner and operator of St. Louis Lambert International Airport. ©2017 City of St. Louis, Missouri. All rights reserved.
FLYSTL.COM