fy2017 earnings presentation · in 2018, landis+gyr signed new agreements with uk energy retailers...
TRANSCRIPT

© Landis+Gyr | June 5, 2018
FY2017 Earnings presentation

© Landis+Gyr | June 5, 2018
Important notices
2
This presentation includes forward-looking information and statements including statements concerning the outlook for our businesses. These statements are based on current expectations, estimates and projections about the factors that may affect our future performance, including global economic conditions, and the economic conditions of the regions and industries that are major markets for Landis+Gyr Group AG. These expectations, estimates and projections are generally identifiable by statements containing words such as “expects,” “believes,” “estimates,” “targets,” “plans,” “outlook” or similar expressions.
There are numerous risks and uncertainties, many of which are beyond our control, that could cause our actual results to differ materially from the forward-looking information and statements made in this presentation and which could affect our ability to achieve any or all of our stated targets. The important factors that could cause such differences include, among others: business risks associated with the volatile global economic environment and political conditions costs associated with compliance activities market acceptance of new products and services changes in governmental regulations and currency exchange rates, estimates of future warranty claims and expenses and sufficiency of accruals and such other factors as may be discussed from time to time in Landis+Gyr Group AG filings with the SIX Swiss Exchange.
Although Landis+Gyr Group AG believes that its expectations reflected in any such forward-looking statement are based upon reasonable assumptions, it can give no assurance that those expectations will be achieved.
This presentation contains non-GAAP measures of performance. Definitions of these measures and reconciliations between these measures and their US GAAP counterparts can be found in the ‘Supplemental reconciliations and definitions’ section in our Annual Report 2017 on our website at www.landisgyr.ch/investors

© Landis+Gyr | June 5, 2018
Electricity & gas comm. Meters (USD bn)
0.3
0.9
Dec-17 Dec-21
Leadership in a growing market
3
Forecasted growth rates
Americas1 EMEA1 Asia Pacific2
Electricity comm. Meters (USD bn) Electricity & gas comm. Meters (USD bn)
1.21.7
Dec-17 Dec-21
1.7
2.7
Dec-17 Dec-21
Sources: 1 IHS Markit 20172 Frost & Sullivan 2017, Excl. China and Japan

© Landis+Gyr | June 5, 2018
Recent corporate developments
Wisconsin Public Service Company selected Landis+Gyr to provide a multi-purpose Advanced Metering Infrastructure network platform for advanced metering and grid modernization. The project includes deployment of Landis+Gyr’s RF mesh network technology, 450,000 smart electric meters and about 326,000 two-way gas modules under a long-term managed services agreement.
JEA, the eighth-largest community-owned electric utility in the US, signed a purchase agreement to accelerate its advanced metering deployment over the next 30 months by deploying the remaining 250,000 electric meters on its distribution system. Landis+Gyr currently manages JEA’s advanced metering and network infrastructure under a long-term managed services contract.
Landis+Gyr and Pacific Equity Partners (PEP) form a joint venture for the acquisition of Acumen from Origin Energy Limited. The Acumen business includes the existing management and servicing of an already deployed 170,000 meters and a material long-term contract for the deployment and management of additional smart meters across Australia.
In 2018, Landis+Gyr signed new agreements with UK energy retailers for more than half a million SMETS2 meters. Landis+Gyr now has a total of over 18 million smart meters under contract in the UK, of which approx. 5 million have been deployed to date. Landis+Gyr and its UK customers achieved a major milestone becoming the first to deploy a second generation (SMETS2) smart meter. The UK deployment is gathering pace with Landis+Gyr smart meters deploying at more than 160,000 per month.
4

© Landis+Gyr | June 5, 2018
Business highlights – Fiscal Year 2017
Overall Group performance for FY2017: Sales growth year over year of 4.7% (2.6% in constant currency) Adjusted EBITDA stable at USD 212.0 million Free cash flow reached USD 87.5 million, up USD 34.4 million
compared to FY2016 Key Group guidance parameters met or exceeded
Order intake growth of 18.8% (16.0% in constant currency) Reported net income improved from a loss of USD 62.6 million to a
profit of USD 46.4 million The Board of Directors proposes a dividend of CHF 2.30 per share
(USD 71 million at year end FX rate), 81% of free cash flow
5
Group:

© Landis+Gyr | June 5, 2018
Key regional developments – Fiscal Year 2017
6
Good order intake and overall financial performance driven by US AMI business
Continued market penetration in US Public Power market and extension of key customer contracts
Launched Gridstream Connect, Landis+Gyr’s flexible utility IoT platform
Major AMI deployments in the UK, the Netherlands and France continue with strong momentum
Industry wide supply chain constraints dampened second half
Good results from restructuring program (Project Phoenix) and increased savings expected from Project Lightfoot (USD 25 million)
Gross profit recovery delayed with further work to be done on product costs to ensure sustainable margins
Major AMI deployments with CLP, Hong Kong on track
Deployment commenced at Tata Power, India
Power of Choice regulatory change came into effect in Australia but market take-up is slow
EMEA Asia PacificAmericas
© Landis+Gyr | June 5, 2018
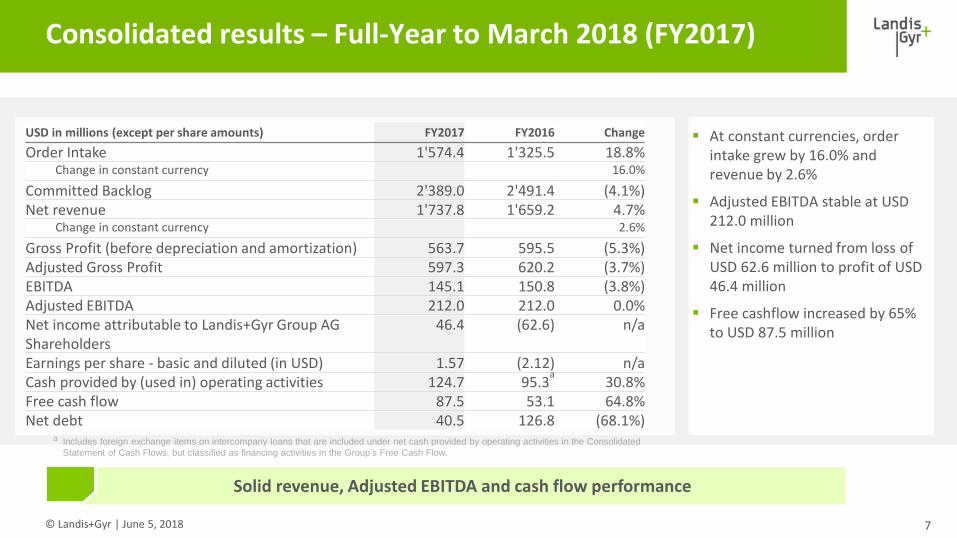
Solid revenue, Adjusted EBITDA and cash flow performance
Consolidated results – Full-Year to March 2018 (FY2017)
At constant currencies, order intake grew by 16.0% and revenue by 2.6%
Adjusted EBITDA stable at USD 212.0 million
Net income turned from loss of USD 62.6 million to profit of USD 46.4 million
Free cashflow increased by 65% to USD 87.5 million
7
USD in millions (except per share amounts) FY2017 FY2016 ChangeOrder Intake 1'574.4 1'325.5 18.8%
Change in constant currency 16.0%
Committed Backlog 2'389.0 2'491.4 (4.1%)Net revenue 1'737.8 1'659.2 4.7%
Change in constant currency 2.6%
Gross Profit (before depreciation and amortization) 563.7 595.5 (5.3%)Adjusted Gross Profit 597.3 620.2 (3.7%)EBITDA 145.1 150.8 (3.8%)Adjusted EBITDA 212.0 212.0 0.0%Net income attributable to Landis+Gyr Group AG Shareholders
46.4 (62.6) n/a
Earnings per share - basic and diluted (in USD) 1.57 (2.12) n/aCash provided by (used in) operating activities 124.7 95.3a 30.8%Free cash flow 87.5 53.1 64.8%Net debt 40.5 126.8 (68.1%)
a Includes foreign exchange items on intercompany loans that are included under net cash provided by operating activities in the Consolidated Statement of Cash Flows, but classified as financing activities in the Group’s Free Cash Flow.
© Landis+Gyr | June 5, 2018
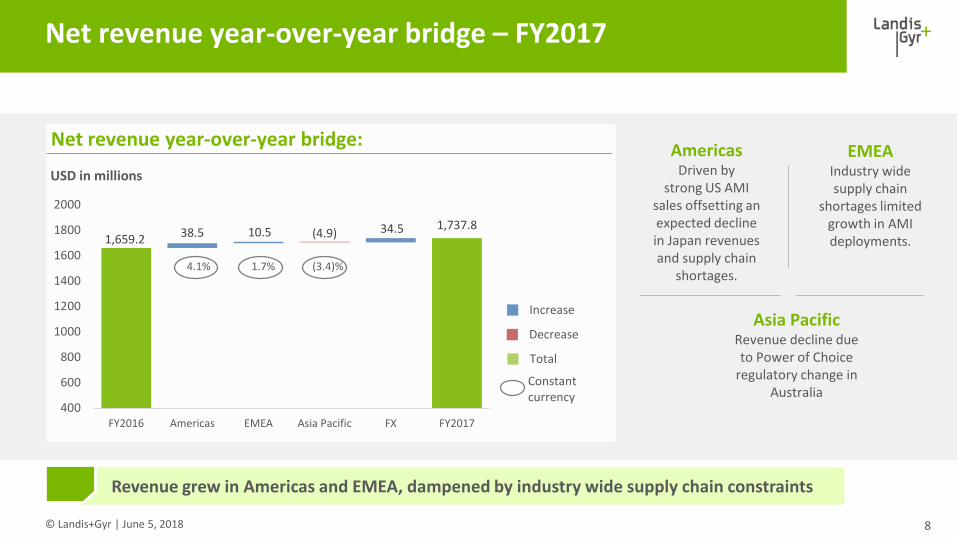
Net revenue year-over-year bridge – FY2017
AmericasDriven by
strong US AMI sales offsetting an expected decline in Japan revenues and supply chain
shortages.
8
EMEAIndustry wide supply chain
shortages limited growth in AMI deployments.
Asia PacificRevenue decline due to Power of Choice
regulatory change in Australia
Revenue grew in Americas and EMEA, dampened by industry wide supply chain constraints
Net revenue year-over-year bridge:
USD in millions
1,659.21,737.838.5 10.5 (4.9) 34.5
400
600
800
1000
1200
1400
1600
1800
2000
FY2016 Americas EMEA Asia Pacific FX FY2017
Increase
Decrease
Constant currency
4.1% 1.7% (3.4)%
Total

© Landis+Gyr | June 5, 2018
Adjusted EBITDA year-over-year bridge – FY2017
Adjusted Gross Profit
decline resulted from mix changes in
Americas & delays in cost optimized product
launches in EMEA.
9
Adjusted Operating Expenses
decrease mainly resulted from restructuring program in EMEA (Project Phoenix).
Adjusted EBITDA y-o-y bridge:USD in millions
The decline in Adjusted Gross Profit was offset by lower Adjusted Operating Expenses
212.0 212.0
(31.6)
30.4 1.2
0
50
100
150
200
FY2016 Adj. Gross Profit Adj. OperatingExpenses
FX FY2017
Improvement to EBITDA
Deterioration to EBITDA
Total

© Landis+Gyr | June 5, 2018
Adjustments to EBITDA – FY2017
10
Adjustments FY2017 Adjustments in H2 FY2017 reduced to USD 1.3
million, net Restructuring – Costs mainly associated with the
implementation of restructuring programs in EMEA. Exceptional Warranty Expenses – All attributed to
the X2 capacitor warranty case. Normalized Warranty Expenses – The difference
between the rolling 3 year average of actual warranty costs incurred and the net P+L warranty expense. In the Americas, in H1 FY2017 we booked a provision of USD 40.9 million in connection with legacy component issues. Special Items – Primarily IPO related expenses of
USD 24.2 million. Of this amount, USD 9.8 million was funded by the selling shareholders. In FY2016 Special Items mainly related to patent
litigation and costs associated with a planned acquisition that did not proceed.
USD in millions H1 FY2017 H2 FY2017 FY2017 FY2016 ChangeEBITDA 43.1 102.0 145.1 150.8 (3.8%)Adjustments
Restructuring Charges 8.1 6.5 14.7 3.8 286.8%
Exceptional Warranty Expenses
2.4 (0.1) 2.4 6.4 (62.5%)
Normalized WarrantyExpenses
30.3 (6.1) 24.2 25.2 (3.6%)
Special Items 24.8 0.9 25.6 25.8 (0.8%)
Adjusted EBITDA 108.8 103.3 212.0 212.0 0.0%
65.7 1.3
© Landis+Gyr | June 5, 2018
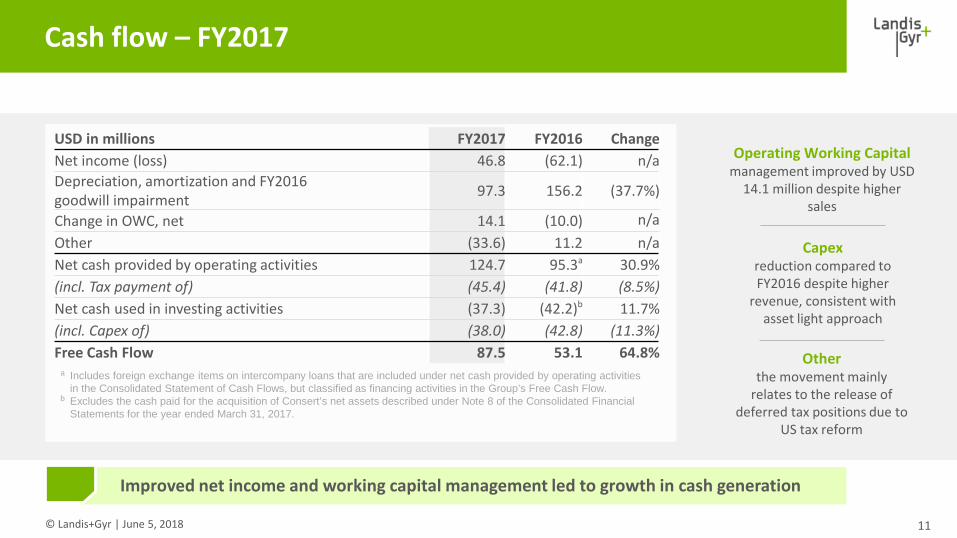
Cash flow – FY2017
11
Improved net income and working capital management led to growth in cash generation
Operating Working Capital management improved by USD
14.1 million despite higher sales
Capex reduction compared to FY2016 despite higher
revenue, consistent with asset light approach
USD in millions FY2017 FY2016 Change Net income (loss) 46.8 (62.1) n/aDepreciation, amortization and FY2016 goodwill impairment 97.3 156.2 (37.7%)
Change in OWC, net 14.1 (10.0) n/aOther (33.6) 11.2 n/aNet cash provided by operating activities 124.7 95.3a 30.9%(incl. Tax payment of) (45.4) (41.8) (8.5%)Net cash used in investing activities (37.3) (42.2)b 11.7%(incl. Capex of) (38.0) (42.8) (11.3%)Free Cash Flow 87.5 53.1 64.8%
a Includes foreign exchange items on intercompany loans that are included under net cash provided by operating activities in the Consolidated Statement of Cash Flows, but classified as financing activities in the Group’s Free Cash Flow.
b Excludes the cash paid for the acquisition of Consert’s net assets described under Note 8 of the Consolidated Financial Statements for the year ended March 31, 2017.
Otherthe movement mainly
relates to the release of deferred tax positions due to
US tax reform
© Landis+Gyr | June 5, 2018
127
40
0.6
0.2
0.0
0.1
0.2
0.3
0.4
0.5
0.6
0.7
-
20
40
60
80
100
120
140
Net Debt Net Debt to Adjusted EBITDA ratio
USD in millions ratio
12
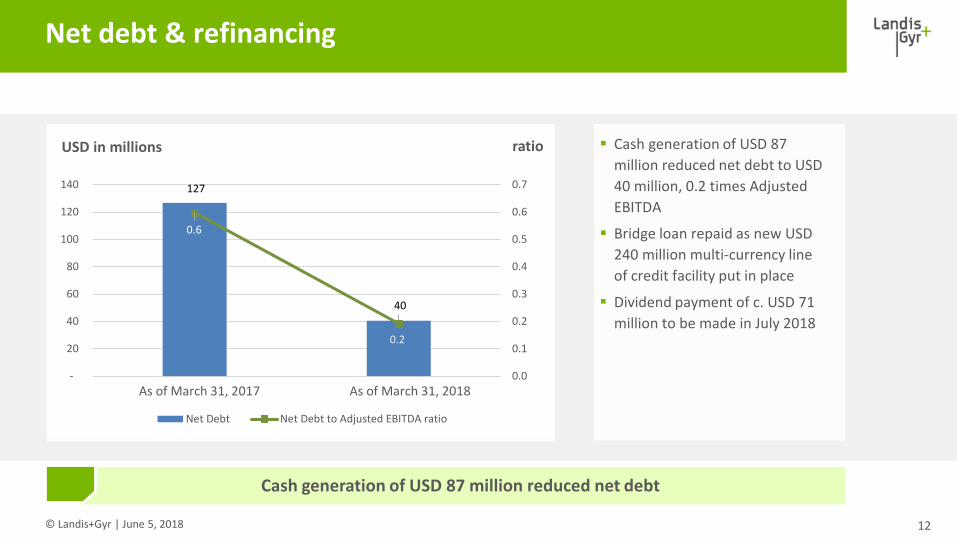
Net debt & refinancing
Cash generation of USD 87 million reduced net debt
Cash generation of USD 87 million reduced net debt to USD 40 million, 0.2 times Adjusted EBITDA
Bridge loan repaid as new USD 240 million multi-currency line of credit facility put in place
Dividend payment of c. USD 71 million to be made in July 2018
As of March 31, 2017 As of March 31, 2018

© Landis+Gyr | June 5, 2018
Continued strong revenue in core US AMI market offset some expected declines in Japan
Important agreement signed to help TEPCO leverage their IoT smart metering network in future
Adjusted Gross Profit lower than FY2016 due to changes in customer & product mix
Adjusted EBITDA increased 2.3% driven by lower Adjusted Operating Expenses
13
Americas segment – FY2017
Americas performance driven by US AMI market
USD in millions FY2017 FY2016 Change
Net revenue to external customers 972.2 931.2 4.4%
Change in constant currency 4.1%
Adjusted Gross Profit 409.2 414.0 (1.2%)
Adjusted Gross Profit % 42.1% 44.5%
Adjusted Operating Expenses (209.8) (218.9) (4.2%)
incl. Group recharges (35.3) (32.7)
Adjusted EBITDA 199.4 195.0 2.3%
Adjusted EBITDA % 20.5% 20.9%

© Landis+Gyr | June 5, 2018
EMEA segment – FY2017
14
Savings in Adjusted Operating Expenses were not sufficient to compensate lower Adjusted Gross Profit
Revenue growth impacted by supply chain shortages in Q4
Adjusted Gross Profit impacted by delay to product cost reductions
These product cost improvements will now materialize in FY2018
Project Phoenix restructuring delivers lower Adjusted Operating Expenses
USD in millions FY2017 FY2016 Change
Net revenue to external customers 627.2 587.8 6.7%
Change in constant currency 1.7%
Adjusted Gross Profit 155.9 174.0 (10.4%)
Adjusted Gross Profit % 24.9% 29.6%
Adjusted Operating Expenses (164.7) (173.1) (4.8%)
incl. Group recharges (25.8) (21.7) 19.1%
Adjusted EBITDA (8.8) 1.0 n/a
Adjusted EBITDA % (1.4%) 0.2%

© Landis+Gyr | June 5, 2018
EMEA segment – Comments on FY2017 results
15
EMEA results impacted by supply chain constraints and delayed cost down product introduction – H2 FY2018 will see main benefits of resolving these issues
EMEA results
EMEAs revenue impacted by industry wide supply chain constraints which reduced H2 sales by about 7.5%. Resolving supply issues expected in Q2 and Q3 of FY2018
EMEA’s FY2017 Adjusted Gross Profit impacted by c. 3.6 percentage points due to delayed introductions of cost reduced products
For the key markets UK, NL, France, we expect to meet planned product cost targets but we have slipped c. 12 months in getting the products into the market. Main benefits will materialize in H2 FY2018.
Key market developments
UK: In total over 18 million smart meters under contract, of which approximately 5 million have been deployed
Smart meter rollout continues at pace - Landis+Gyr meters deploying at >160,000 per month
Two new agreements signed with UK energy retailers in 2018 for 600,000 smart meters
Start of second generation (SMETS2) ramp delayed – anticipate volume deployment from Q2 FY 2018
France: Roll-out in full swing at a rate of about 30,000 Linky meters per day (all suppliers combined), 10 million meters deployed by May 2018. Landis+Gyr continues to be a key partner with c.25% market share.
Tender for 3rd procurement cycle for 14 million meters launched, results expected in Q2 FY2018
© Landis+Gyr | June 5, 2018
EMEA segment restructuring – update on Project Phoenix
16
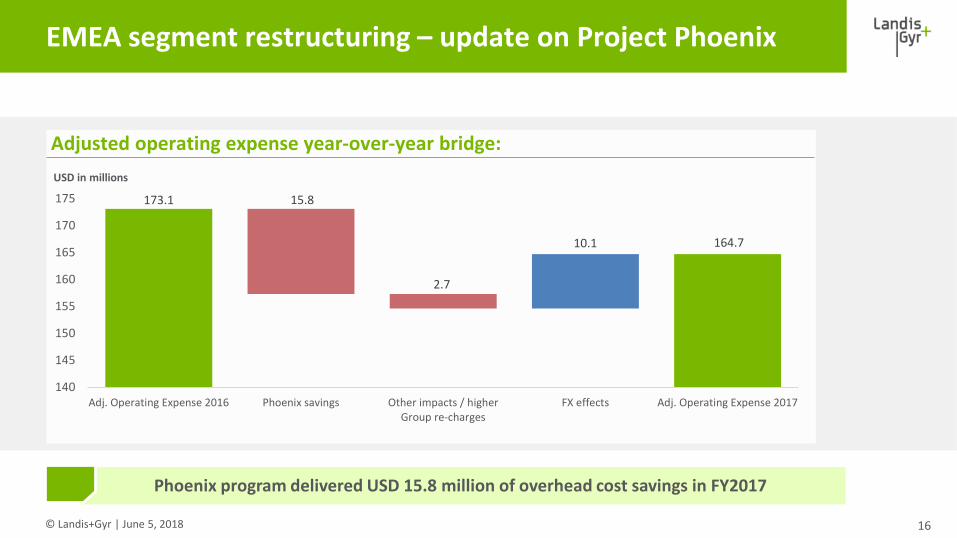
Phoenix program delivered USD 15.8 million of overhead cost savings in FY2017
173.1
164.7
15.8
2.7
10.1
140
145
150
155
160
165
170
175
Adj. Operating Expense 2016 Phoenix savings Other impacts / higherGroup re-charges
FX effects Adj. Operating Expense 2017
Adjusted operating expense year-over-year bridge:USD in millions
© Landis+Gyr | June 5, 2018
EMEA segment restructuring – update on Project Lightfoot
17
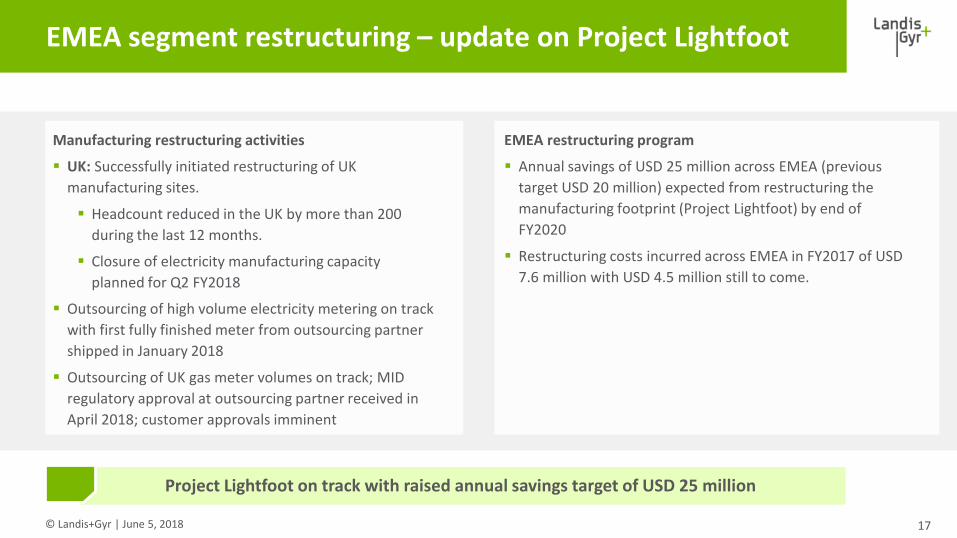
Project Lightfoot on track with raised annual savings target of USD 25 million
EMEA restructuring program
Annual savings of USD 25 million across EMEA (previous target USD 20 million) expected from restructuring the manufacturing footprint (Project Lightfoot) by end of FY2020
Restructuring costs incurred across EMEA in FY2017 of USD 7.6 million with USD 4.5 million still to come.
Manufacturing restructuring activities
UK: Successfully initiated restructuring of UK manufacturing sites.
Headcount reduced in the UK by more than 200 during the last 12 months.
Closure of electricity manufacturing capacity planned for Q2 FY2018
Outsourcing of high volume electricity metering on track with first fully finished meter from outsourcing partner shipped in January 2018
Outsourcing of UK gas meter volumes on track; MID regulatory approval at outsourcing partner received in April 2018; customer approvals imminent

© Landis+Gyr | June 5, 2018 18
Asia Pacific segment – FY2017
Revenue declined as expected market growth did not materialize with slow take-up of “Power of Choice” regulatory change in Australia
Adjusted Gross Profit % below last year due to mix effects
Adjusted Operating Expenses increased due to higher costs at our service solutions business intelliHUB
Lower revenue as Australia did not grow as expected leading to losses at Adjusted EBITDA level
USD in millions FY2017 FY2016 Change
Net revenue to external customers 138.4 140.2 (1.3%)
Change in constant currency (3.4%)
Adjusted Gross Profit 28.3 31.9 (11.2%)
Adjusted Gross Profit % 20.5% 22.8%
Adjusted Operating Expenses (37.9) (34.6) (9.7%)
incl. Group recharges (3.8) (3.8) (1.6%)
Adjusted EBITDA (9.6) (2.7) (260.9%)
Adjusted EBITDA % (6.9%) (1.9%)

© Landis+Gyr | June 5, 2018
Asia Pacific – Joint venture to acquire Acumen from Origin
19
Important milestone for future development of Asia Pacific business
Impact / Outlook
Important milestone in turnaround of Asia Pacific business
Expected Landis+Gyr meter sales to the JV of over USD 90 million over the next five years
JV well positioned to roll-out a significant portion of upcoming deployment of estimated 8 million smart meters across NSW, Queensland, South Australia and the Australian Capital Territory
Transaction
Joint Venture (PEP: 80% / Landis+Gyr: 20%) buys Origin’s Acumen business for AUD 267 million
Origin is Australia’s largest energy retailer and Acumen is their in-house metering business
Landis+Gyr will be contributing cash (AUD 25 million) and its intelliHub business with combined equity value of up to AUD 75 million
JV undertakes asset financing
JV has entered into a five-year meter supply contract with Landis+Gyr. Expected volumes of approx. 800,000 smart meters to be deployed to multiple utilities in AUS/NZ

© Landis+Gyr | June 5, 2018
Outlook
20
Landis+Gyr expects FY2018 sales growth of approximately 3 - 6%.
Group Adjusted EBITDA expected to be in the range of USD 222 million and USD 232 million.
Free cash flow1 between USD 95 million and USD 105 million.
Given some of the supply chain challenges currently being experienced in the industry and the timing of product cost reductions in EMEA, Landis+Gyr expects the first half of FY2018 to be weaker than the second half.
Dividend of at least 75% of free cash flow1 for FY2018
FY2018 Outlook:
1 Free cash flow excludes M&A activities

© Landis+Gyr | June 5, 2018
Important Dates Contact Investor RelationsStan MarchSVP Group Communications & Investor RelationsPhone +1 678 258 [email protected]
Christian WaeltiPhone +41 41 935 [email protected]
Dates and contacts
21
Ex-Dividend Date:July 2, 2018
Annual General Assembly: June 28, 2018, Lorzensaal, Cham, Switzerland
Contact AddressInvestor RelationsLandis+Gyr Group AGTheilerstrasse 1CH-6301 Zug+41 41 935 [email protected]/investors
Dividend Payment Date:July 4, 2018
Dividend Record Date:July 3, 2018
Release of H1 FY2018 Results:October 26, 2018

© Landis+Gyr | June 5, 2018
Appendix

© Landis+Gyr | June 5, 2018
Landis+Gyr – a global leader
23
of service to customers
as a trusted partner to utilities
120Years
Headquartered in Switzerland
with offices in 30+ countries worldwide
Over 80 millionsmart grid connected
intelligent devices deployed
Nearly USD 1 billionof self-funded
R&D investment since 2011
The largest installed base with
300+ milliondevices globally
Serving3,500+utilities
worldwide
More than 20 millionmeter reads delivered
every day under cloud services
More than 15 millionmeter points
under managed services
Strong cash flow
generation
Stable recurring revenue from managed
services and meter replacement
Global leader in Smart Metering and Smart Grid solutions
The global #1 provider of smart metering solutions to utilities

© Landis+Gyr | June 5, 2018
Best-in-class portfolio of end-to-end solutions
24
% of sales Mar-18
Broad solutions offering…
Key products
CommandCenter
Meter data management
Head-end systems
AEMO accredited BPO hub
Network operation centers in Lenexa, KS and Noida,
IndiaDistribution Automation
Load management receivers and systemsICG meters
Residential AMI meters Ultrasonic smart gas metersNon-AMI
Residential heat and cold meters
Diaphragm gas meters1
In-home display units
Portfolio
Software & services
Software OtherServices
Connected intelligent devices
Smart gasAdvanced load
mgmt(ALM)
Distributed Energy
Resources
Industrial, commercial & grid metering
Other devicesResidential AMI
Standalone devices
Non-AMI electricity
meters
Heat/cold meters Standalone gas
11% 71% 18%
Retailer Distribution system operator/vertically integrated utility/ transmission system operator
Prosumers/residential/commercial/industrial customers
Distribution Transmission & centralized generation
Landis+Gyr focus
…across the value chain
1 Built and sold only in Australia and New Zealand
© Landis+Gyr | June 5, 2018
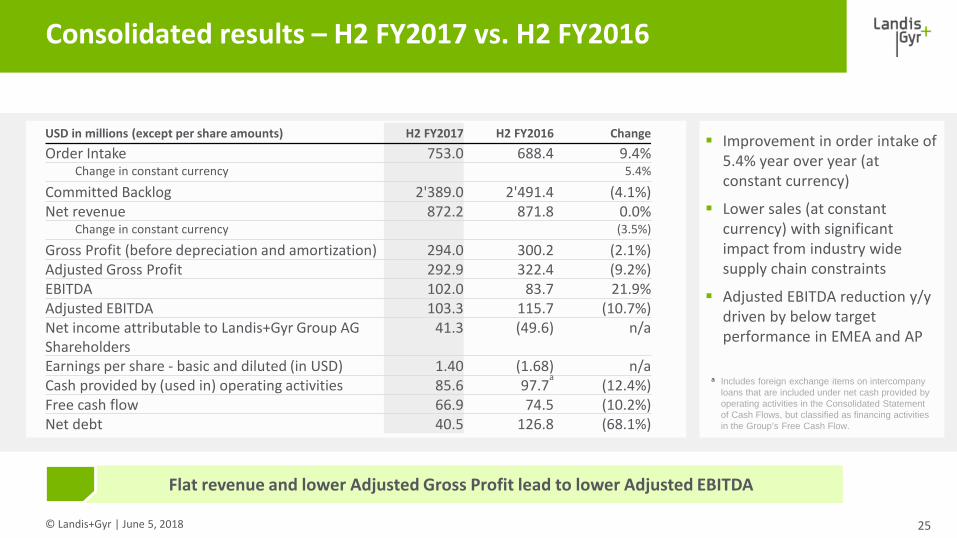
Flat revenue and lower Adjusted Gross Profit lead to lower Adjusted EBITDA
Consolidated results – H2 FY2017 vs. H2 FY2016
25
USD in millions (except per share amounts) H2 FY2017 H2 FY2016 ChangeOrder Intake 753.0 688.4 9.4%
Change in constant currency 5.4%
Committed Backlog 2'389.0 2'491.4 (4.1%)Net revenue 872.2 871.8 0.0%
Change in constant currency (3.5%)
Gross Profit (before depreciation and amortization) 294.0 300.2 (2.1%)Adjusted Gross Profit 292.9 322.4 (9.2%)EBITDA 102.0 83.7 21.9%Adjusted EBITDA 103.3 115.7 (10.7%)Net income attributable to Landis+Gyr Group AG Shareholders
41.3 (49.6) n/a
Earnings per share - basic and diluted (in USD) 1.40 (1.68) n/aCash provided by (used in) operating activities 85.6 97.7
a(12.4%)
Free cash flow 66.9 74.5 (10.2%)Net debt 40.5 126.8 (68.1%)
Improvement in order intake of 5.4% year over year (at constant currency)
Lower sales (at constant currency) with significant impact from industry wide supply chain constraints
Adjusted EBITDA reduction y/y driven by below target performance in EMEA and AP
a Includes foreign exchange items on intercompany loans that are included under net cash provided by operating activities in the Consolidated Statement of Cash Flows, but classified as financing activities in the Group’s Free Cash Flow.

© Landis+Gyr | June 5, 2018
Net revenue year-over-year bridge: H2 FY2017 vs. H2 FY2016
AmericasStronger US
revenue offset expected declines
in Japan
26
Strength in the Americas offset by weakness in other regions
EMEAWeak top line in H2 FY2017 mainly due
to industry wide supply chain issues
Asia PacificLower sales caused by
Australian AMI implementation delay
due to Power of Choice regulatory change.
Net revenue year-over-year bridge:in USD millions
871.8 872.214.3 (35.8)(10.5) 32.4
400
500
600
700
800
900
1000
H2 FY2016 Americas EMEA Asia Pacific FX H2 FY2017
Increase
Decrease
Total

© Landis+Gyr | June 5, 2018
Adjusted EBITDA year-over-year bridge: H2 FY2017 vs. H2 FY2016
Adjusted Gross Profit
decline resulted from mix changes in Americas & delays in cost optimized
product launches in EMEA
27
Adjusted Operating Expenses
decrease mainly resulted from the cost reduction program in
EMEA (Project Phoenix).
Adjusted EBITDA y-o-y bridge:
in USD millions
Adjusted Gross Profit declines only partially compensated by lower Adjusted Operating Expenses
Improvement to EBITDADeterioration to EBITDATotal
115.7103.3
(37.9)24.6 0.9
0
20
40
60
80
100
120
140
H2 FY2016 Adj. Gross Profit Adj. OperatingExpenses
FX H2 FY2017

© Landis+Gyr | June 5, 2018
Cash flow – H2 FY2017 vs. H2 FY2016
28
Change in Operating
Working Capital declined by USD
3.2 million
Capex came in lower than
in the 2nd half of FY2016, consistent with our asset light
approach
in USD millions H2 FY2017 H2 FY2016 Change Net income (loss) 41.5 (49.0) n/aDepreciation, amortization and FY2016 goodwill impairment 48.7 108.3 (55.0%)
Change in OWC, net 4.5 7.7 (41.3%)Other (9.2) 30.7 n/aNet cash provided by operating activities 85.6 97.7a (12.3%)(incl. Tax payment of) (23.1) (20.4) (13.5%)Net cash used in investing activities (18.7) (23.2)b 19.4%(incl. Capex of) (18.9) (23.6) 20.0%Free Cash Flow 66.9 74.5 (10.1%)a Includes foreign exchange items on intercompany loans that are included under net cash provided by operating activities in the Consolidated Statement
of Cash Flows, but classified as financing activities in the Group’s Free Cash Flow. b Includes the cash paid for the acquisition of Consert’s net assets described under Note 8 of the Consolidated Financial Statementzs for the year ended
March 31, 2017.
© Landis+Gyr | June 5, 2018
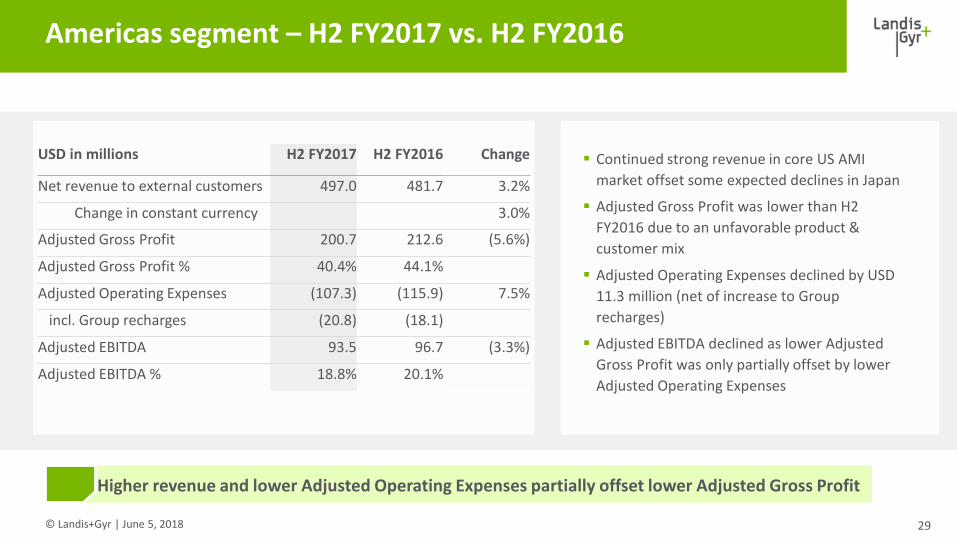
Continued strong revenue in core US AMI market offset some expected declines in Japan
Adjusted Gross Profit was lower than H2 FY2016 due to an unfavorable product & customer mix
Adjusted Operating Expenses declined by USD 11.3 million (net of increase to Group recharges)
Adjusted EBITDA declined as lower Adjusted Gross Profit was only partially offset by lower Adjusted Operating Expenses
29
Americas segment – H2 FY2017 vs. H2 FY2016
Higher revenue and lower Adjusted Operating Expenses partially offset lower Adjusted Gross Profit
USD in millions H2 FY2017 H2 FY2016 Change
Net revenue to external customers 497.0 481.7 3.2%
Change in constant currency 3.0%
Adjusted Gross Profit 200.7 212.6 (5.6%)
Adjusted Gross Profit % 40.4% 44.1%
Adjusted Operating Expenses (107.3) (115.9) 7.5%
incl. Group recharges (20.8) (18.1)
Adjusted EBITDA 93.5 96.7 (3.3%)
Adjusted EBITDA % 18.8% 20.1%

© Landis+Gyr | June 5, 2018
EMEA segment – H2 FY2017 vs. H2 FY2016
30
Lower Adjusted Operating Expenses only partly offset lower Adjusted Gross Profit
Top line in H2 FY2017 impacted mainly due to supply chain constraints
Adjusted Gross Profit impacted by delay to product cost reductions; these will now materialize in FY2018
Lower Adjusted Operating Expenses due to the effects of Project Phoenix. This was partly offset by higher group recharges
USD in millions H2 FY2017 H2 FY2016 Change
Net revenue to external customers 306.5 313.0 (2.1%)
Change in constant currency (10.5%)
Adjusted Gross Profit 76.1 91.0 (16.4%)
Adjusted Gross Profit % 24.8% 29.1%
Adjusted Operating Expenses (83.4) (85.7) 2.8%
incl. Group recharges (15.2) (12.0) (27.3%)
Adjusted EBITDA (7.3) 5.3 n/a
Adjusted EBITDA % (2.4%) 1.7%

© Landis+Gyr | June 5, 2018 31
Asia Pacific segment – H2 FY2017 vs. H2 FY2016
Market delays in Australia as Power of Choice regulatory change comes into effect lead to lower revenue
Adjusted Gross Profit % reduced due to an unfavorable mix
Adjusted Operating Expenses increased due to higher expenses in intelliHUB, our services business in Australia.
Delays in Australia market affect sales performance and Adjusted EBITDA
USD in millions H2 FY2017 H2 FY2016 Change
Net revenue to external customers 68.7 77.1 (10.9%)
Change in constant currency (13.3%)
Adjusted Gross Profit 13.4 18.3 (26.5%)
Adjusted Gross Profit % 19.6% 23.7%
Adjusted Operating Expenses (17.5) (14.4) (21.6%)
incl. Group recharges (1.2) (0.8) (41.3%)
Adjusted EBITDA (4.1) 3.9 n/a
Adjusted EBITDA % (6.0%) 5.0%

© Landis+Gyr | June 5, 2018
Adjustments to EBITDA – H2 FY2017 vs. H2 FY2016
32
Adjustments H2 FY2017Adjustments in H2 FY2017 reduced to USD 1.3 million, net: Restructuring – Costs associated with the
implementation of Project Phoenix & Project Lightfoot restructuring programs in EMEA.
Normalized Warranty Expenses – The difference between the rolling 3 year average of actual warranty costs incurred and the net P+L warranty expense.
USD in millions H2 FY2017 H2 FY2016 ChangeEBITDA 102.0 83.7 21.9%Adjustments
Restructuring Charges 6.5 2.6 150.0%Exceptional Warranty Expenses (0.1) 5.0 n/aNormalized Warranty Expenses (6.1) 20.9 n/aSpecial Items 0.9 3.5 (74.3%)
Adjusted EBITDA 103.3 115.7 (10.7%)

© Landis+Gyr | June 5, 2018
Impact of US tax reform - update
H2 FY2017 Statements of Operations release was USD 17 millionThe enactment of U.S. tax reform resulted in a benefit of USD 22 million from the re-measurement of deferred tax balances as of March 31, 2017 to the new U.S. Federal tax rate, as per the January 2018 press release. Including the impact from the re-measurement of the deferred tax balances arising from the current activity of USD 4.7 million results in the release of USD 17 million.
Cash tax benefit is confirmed at USD 15-20 million p.a.1
US tax reform impacts
1 The tax benefit is included in the FY2018 free cashflow guidance
33