fyn tyrosine kinase, a downstream target of receptor ...fyn tyrosine kinase is a downstream target...
TRANSCRIPT

1
FYN tyrosine kinase, a downstream target of receptor tyrosine
kinases, modulates anti-glioma immune responses
Andrea Comba1,2, Patrick J Dunn1,2, Anna E Argento1,2, Padma Kadiyala1,2, Maria Ventosa1,2,
Priti Patel1,2, Daniel B Zamler1,2, Felipe J Nunez1,2, Lili Zhao3, Maria G Castro1,2, Pedro R.
Lowenstein1,2
1Department of Neurosurgery, University of Michigan Medical School, Ann Arbor, MI 48109
2Department of Cell and Developmental Biology, University of Michigan Medical School, Ann
Arbor, MI 48109
3Department of Biostatistics, University of Michigan Medical School, Ann Arbor, MI 48109
Running title: FYN modulates suppressive glioma immune responses
Corresponding Author: Pedro R Lowenstein. Department of Neurosurgery University of
Michigan School of Medicine, 1150 West Medical Center Drive, MSRB II, Room 4570, Ann Arbor,
MI 48109-5689. Phone (office) 734-764-0851. Email: [email protected]
Conflicts of Interest
All authors of this paper declare no potential conflicts of interest.
All rights reserved. No reuse allowed without permission. The copyright holder for this preprint (which was not peer-reviewed) is the author/funder.. https://doi.org/10.1101/608505doi: bioRxiv preprint

2
Authorship
Conception and design: A. Comba and P.R. Lowenstein.
Development of methodology: A. Comba, P.J. Dunn, A.E. Argento, P. Kadiyala, P.R.
Lowenstein.
Acquisition of data, analysis and Interpretation A. Comba, P.J. Dunn, A.E. Argento, P.
Kadiyala, M. Ventosa, P. Patel, D.B. Zamler, F.J. Nunez, L. Zhao, M.G. Castro, P.R. Lowenstein.
Manuscript writing: A. Comba, P.J. Dunn, M.G. Castro, P.R. Lowenstein.
Review, and/or revision of the manuscript: A. Comba, P.J. Dunn, A.E. Argento, P. Kadiyala,
M. Ventosa, P. Patel, D.B. Zamler, F.J. Nunez, L. Zhao, M.G. Castro, P.R. Lowenstein.
Administrative, technical, or material support (i.e., reporting or organizing data,
constructing databases): A. Comba, P.J. Dunn, P.R. Lowenstein.
Study supervision: M.G. Castro and P.R. Lowenstein.
Manuscript word count: 6628 total manuscript word count, including words in abstract, text,
references, and figure legends
All rights reserved. No reuse allowed without permission. The copyright holder for this preprint (which was not peer-reviewed) is the author/funder.. https://doi.org/10.1101/608505doi: bioRxiv preprint

3
ABSTRACT
Background: High grade gliomas are aggressive and immunosuppressive brain tumors.
Molecular mechanisms that regulate the inhibitory immune tumor microenvironment (TME) and
glioma progression remain poorly understood. FYN tyrosine kinase is a downstream target of the
oncogenic receptor tyrosine kinases pathway and is overexpressed in human gliomas. FYN’s role
in vivo in glioma growth remains unknown. We investigated whether FYN regulates glioma
initiation, growth and invasion.
Methods: We evaluated the role of FYN using genetically engineered mouse glioma models
(GEMM). We also generated FYN knockdown stem cells to induce gliomas in immune-competent
and immune-deficient mice (NSG, CD8-/-, CD4-/-). We analyzed molecular mechanism by RNA-
Seq and bioinformatics analysis. Flow cytometry was used to characterize immune cellular
infiltrates in the FYN knockdown glioma TME.
Results: We demonstrate that FYN knockdown in diverse immune-competent GEMMs of glioma
reduced tumor progression and significantly increased survival. Gene ontologies (GOs) analysis
of differentially expressed genes in wild type vs. FYN knockdown gliomas showed enrichment of
GOs related to immune reactivity. However, in NSG, CD8-/- and CD4-/- immune-deficient mice,
FYN knockdown gliomas failed to show differences in survival. These data suggest that the
expression of FYN in glioma cells reduces anti-glioma immune activation. Examination of glioma
immune infiltrates by flow-cytometry displayed reduction in the amount and activity of immune
suppressive myeloid derived cells (MDSCs) in the FYN glioma TME.
Conclusions: Gliomas employ FYN mediated mechanisms to enhance immune-suppression
and promote tumor progression. We propose that FYN inhibition within glioma cells could improve
the efficacy of anti-glioma immunotherapies.
Keywords
Fyn Tyrosine kinase, Glioma, Anti-tumor immune responses, Myeloid-derived suppressor cells
All rights reserved. No reuse allowed without permission. The copyright holder for this preprint (which was not peer-reviewed) is the author/funder.. https://doi.org/10.1101/608505doi: bioRxiv preprint

4
Key points
Inhibition of FYN tyrosine kinase in genetically engineered mouse glioma models delays tumor
initiation and progression. The oncogenic effects of FYN in vivo are mediated by downregulation
of anti-glioma immunity.
Importance of the Study
FYN is an effector of receptor tyrosine kinases (RTK) signaling in glioma. However, its role in vivo
remains unknown. Our study demonstrates that FYN tyrosine kinase is a novel regulator of the
anti-glioma immune response. We show that FYN inactivation suppresses glioma growth,
increases survival, and enhances anti-tumor immune reactivity. Our findings suggest that
suppressing the expression of FYN in glioma cells could provide a novel therapeutic target.
All rights reserved. No reuse allowed without permission. The copyright holder for this preprint (which was not peer-reviewed) is the author/funder.. https://doi.org/10.1101/608505doi: bioRxiv preprint

5
INTRODUCTION
Glioblastoma multiforme, or high grade glioma (HGG) is the most frequent and aggressive
primary tumor of the central nervous system. It is characterized by extensive infiltrative growth
and resistance to therapy1. Mutated/activated driver genes such as the receptor tyrosine kinases
(RTK: EGFR, PDGFR, HGF/MET), tumor suppressor genes (TP53, PTEN/NF1) and downstream
RAS/MEK/ERK or PIK3/AKT pathways contribute to the malignity of glioma 2. FYN, a non-RTK
member of the SRC family kinase (SFK), is a downstream proto-oncogene target of the RTK
pathway, 3-6. However, the specific mechanisms by which FYN stimulates glioma growth and
invasion remains unknown. FYN is rarely mutated 7 in human HGG, but is significantly
overexpressed.
Several in-vitro studies showed that FYN knockdown is associated with decreased cell
migration and proliferation of glioma cells 3,8,9. Nevertheless, in vivo human glioma xenograft
models of FYN Knockdown in immune-suppressed animals failed to show differences in survival8.
Therefore, an immune-competent mouse model that enables study of gliomas with FYN
knockdown was established.
In this study we demonstrate that FYN, a downstream target of receptor tyrosine kinases
signaling, inhibits the anti-glioma immune response. We demonstrated that FYN tyrosine kinase
promotes glioma initiation and growth utilizing both immune-competent and immune-deficient
mouse glioma models. We observed that GEMM of gliomas and implantable gliomas, both with
FYN knockdown displayed an extended survival compared to wildtype FYN tumor bearing
immune-competent mice. However, FYN knockdown tumors implanted into immune-deficient
mice did not extend survival when compared to controls. Molecular analysis revealed a significant
upregulation over-representation of immune related gene ontologies (GOs) in shFYN tumors. The
over-representation of immune-related GOs suggest that possibility that FYN is somehow
suppressing immune function. Our data suggest that FYN expression in glioma cells suppresses
the immune responses by stimulating the expansion and activity of MDSCs in glioma tumor
All rights reserved. No reuse allowed without permission. The copyright holder for this preprint (which was not peer-reviewed) is the author/funder.. https://doi.org/10.1101/608505doi: bioRxiv preprint

6
microenvironment. Gliomas have been demonstrated to employ a variety of immunosuppressive
mechanism which promotes tumor progression, thus reducing the effectiveness of
immunotherapies 10,11.
Our data uncover a new paradigm of how FYN tyrosine kinase expressed within the tumor cells
regulates anti-glioma immune responses. We propose that tumor cell specific inhibition of FYN
tyrosine kinase will increase the sensitivity of gliomas to immune attack, and represents a
potential target for future treatments of glioma patients.
All rights reserved. No reuse allowed without permission. The copyright holder for this preprint (which was not peer-reviewed) is the author/funder.. https://doi.org/10.1101/608505doi: bioRxiv preprint

7
MATERIALS AND METHODS
Glioma cells
Mouse neurospheres cells were derived from genetically engineered mouse models (GEMM) of
gliomas. These cells were generated in our lab using the Sleeping Beauty (SB) transposon
system 12,13. All cells were cultured as described in Supplementary data.
Generation of stable cell lines with FYN knockdown
NP and NPA neurospheres were used to generate stable cell lines with FYN knockdown. The
pLenti pLKO-non-target shRNA control vector (SHC002) and two different pLenti-mouse shRNA
vectors for FYN were selected from Sigma Aldrich MISSION® shRNA Vectors. The FYN shRNA
identification numbers are: TRCN0000023383 (shFYN #1) and TRCN0000361213 (shFYN #2).
Cells were infected with the lentivirus as described previously by us 14. Immunoblotting was used
to confirm FYN knockdown. FYN shFYN #2 cells were selected for in vivo experiments. Moreover,
to validate the specificity of the shFYN and discard any potential off-target effects we
performed a rescue experiments as described in detail in Supplementary data.
Intracranial implantable syngeneic mouse glioma model
Studies were conducted according to the guidelines approved by the Institutional Animal Care
(IACUC) and Use Committee at the University of Michigan (approved protocol, PRO00007666
for C57BL/6 immune-competent mice and PRO00007669 for immune-suppressive mice). 3.0 x
104 neurospheres were implanted into the striatum of mouse brains to generate tumors. See
supplementary data.
Genetically engineered mouse glioma model (GEMM) generation for FYN Knockdown
All rights reserved. No reuse allowed without permission. The copyright holder for this preprint (which was not peer-reviewed) is the author/funder.. https://doi.org/10.1101/608505doi: bioRxiv preprint

8
The animal model studies were conducted in C57BL/6 mice (Jackson Laboratory), according to
IACUC approved protocol PRO00007617. A FYN knockdown glioma murine model and the
appropriate controls were created by the Sleeping Beauty (SB) transposon system as described
12,13. The genotypes of SB generated tumors were: (i) shp53 and NRAS (NP), (ii) shp53, NRAS
and shFYN (NPF), (iii) shp53, NRAS and shATRX (NPA), (iv) shp53, NRAS, shATRX and shFYN
(NPAF), (v) shp53, NRAS and PDGFβ (NPD), (vi) shp53, NRAS, PDGFβ and shFYN (NPDF).
Design and cloning of shFYN vector is in Supplementary data.
Immunoblotting
Glioma cells (1.0 x 10⁶ cells) were seeded in a 100 mm dish and grown at various time points as
shown in supplementary data.
Immunohistochemistry of paraffin embedded brains (IHC-DAB)
Immunohistochemistry assay was performed on paraffin embedded tissue as described
previously15.
Immunofluorescence of paraffin embedded brains
Brains that were fixed in 4% paraformaldehyde were processed, embedded in paraffin and
sectioned as described previously 15. FYN antibody was conjugated with Alexa Fluor™ 488
Tyramide SuperBoost™ Kit - Goat Anti-Rabbit IgG (# B40922) following the manufacture
instructions (Invitrogen- Thermo Fisher Scientific).
RNA isolation and RNA-Sequencing
SB NP, NPF, NPA, NPAF, NPD and NPDF tumors were studied by RNA-Seq analysis. RNA was
isolated using the RNeasy Plus Mini Kit (© QIAGEN) following the manufacture instructions. RNA-
All rights reserved. No reuse allowed without permission. The copyright holder for this preprint (which was not peer-reviewed) is the author/funder.. https://doi.org/10.1101/608505doi: bioRxiv preprint

9
sequencing was performed at the University of Michigan DNA Sequencing Core. Detailed analysis
is described in Supplementary data.
Flow Cytometry
For flow cytometry analysis of immune cells within the TME, we generated tumors by intracranial
implantation of 3.0 x 10⁴ NPA-NT and NPA-shFYN cells in C57Bl6 mice. Protocol was performed
as described before16 and detailed in Supplementary data.
In vitro MDSC migration assay
We generated mouse bone marrow-derived MDSC as described by Maringo et al (REF). We
analyzed in vitro MDSC (M-MDSC and PMN-MDSC) migration using Transwell® polycarbonate
membrane inserts (Corning Inc.) of 6.5 mm diameter and 8 um pore size. Detailed methodology
is described in Supplementary data.
T Cell Proliferation Assays
We measured MDSC immune suppressive activity using the in vitro T cell proliferation assay.
MDSCs were purified from TME of NPA-NT and NPA-shFYN tumors from moribund mice. MDSC
were purified by flow sorting as Gr-1high (PMN-MDSC) and Gr 1low(M-MDSCs) as described16. See
detailed methodology in Supplementary data.
Statistical Analysis. All experiments were performed in at least three or more independent
biological replicates, depending on the specific analysis. Data is presented as the mean ± SEM.
All statistical tests used are indicated within the figure legends and in Supplementary data.
All rights reserved. No reuse allowed without permission. The copyright holder for this preprint (which was not peer-reviewed) is the author/funder.. https://doi.org/10.1101/608505doi: bioRxiv preprint

10
RESULTS
FYN was identified as a potential regulator of glioma progression
FYN tyrosine kinase is activated by several receptor tyrosine kinases (RTK), such as EGFR,
PDGFR and c-MET, commonly mutated genes in gliomas. Following FYN activation, there are
several downstream RAS dependent and RAS-independent signaling pathways such as
RAS/MEK/ERK, PIK3/AKT, FAK, PXN, B-catenin, STAT3, SHC and VAV2 leading to changes in
proliferation, migration, invasion and cell-cell adhesion (Fig 1A).
We analyzed RNA-Sequencing and Microarray human data from the Gliovis
(http://gliovis.bioinfo.cnio.es) database. According to Rembrandt, TCGA, and Gravendeel
databases, FYN mRNA expression levels were higher in different types of human gliomas when
compared to normal brain tissue (Supplementary Fig. S1A). We observed that FYN expression
was positively correlated with mouse glioma cells aggressiveness. Figure 1B shows that the
survival of animals implanted with NP and NPA glioma cells is significantly shorter than that of
animals implanted with NPAI cells. In accordance, Western blot analysis in Figure 1C,
demonstrates that the levels of FYN, but not SRC, are higher in NP and NPA cells compared to
NPAI cells.
To further analyze the importance of FYN in glioma malignancy, we investigated differential
expression (DE) of genes in highly aggressive glioma NPA-neurospheres (NRAS, shp53,
shATRx, IDH-Wild-type) compared to NPAI-neurospheres (NRAS, shp53, shATRx, IDH1R132H), of
lower aggressiveness13. The network of DE genes identified FYN to be one of the most highly
connected nodes (Degree: 63; 4th node from top node), a hub in the network (Fig. 1C-D). Fig.
(1D) and (1E) display the network of FYN, a set of nodes directly connected to FYN. Higher
magnification of the networks is shown in Supplementary Figure S1A-B. Functional network
GO term analysis disclose Cell Proliferation, Cell migration, MAPK cascade, Positive regulation
of PI3K signaling, VEGF receptor signaling, Cellular response to PDGF as significant GO
All rights reserved. No reuse allowed without permission. The copyright holder for this preprint (which was not peer-reviewed) is the author/funder.. https://doi.org/10.1101/608505doi: bioRxiv preprint

11
Biological Processes involving FYN (Supplementary Fig. 1B). The list of GO terms with their
respectively q and p values are shown in Supplementary, Table S1.
Loss of FYN reduces tumor malignancy and prolongs survival of mice harboring GEMM
tumors.
The Sleeping Beauty Transposon System GBM model (GEMM) was used to understand the
function of FYN 12. We generated a FYN-deficient genetically engineered mouse glioma model
(Supplementary Fig. S3A and B). We corroborated the efficacy of the shRNAs of FYN by WB
analysis (Supplementary Fig. S3C). The shFYN-(b) was selected for the GEMM glioma
generation. We generated tumors harboring wildtype or FYN knockdown in the presence of
various genotype combinations (Supplementary Fig. S3D).
Downregulation of FYN increased median survival (MS) in comparison to wildtype FYN control
groups (Fig. 2A, B and C) in all genotype models. NPF group displayed an increased MS of 131
days compared with 94 days in the NP control group (Fig. 2A). The experimental group with
knockdown of FYN in the context of ATRX loss (NPAF) exhibited an increased survival (MS: 142
days) compared with the NPA control (MS: 80 days), (Fig. 2B). In the third experimental group,
FYN knockdown plus PDGFβ ligand upregulation (NPDF), also displayed an increased MS of 108
days compared with the NPD control group (MS: 69 days) (Fig. 2C). We corroborated the
downregulation of FYN protein in all experimental groups as shown in Fig. 2D, 2E and 2F
respectively. Histopathology analysis of tumors showed no evidence of significant differences in
glioma malignant pathological markers (Fig. 2G, H, I and J). We further evaluated cellular
proliferation of the tumor. Quantification demonstrated a significant decrease in the ratio of P-H3-
S10 cells per total cells in FYN knockdown groups (Fig. 2K and I). These data demonstrate that
FYN downregulation increases animal survival by decreasing tumor initiation, development and
proliferation.
All rights reserved. No reuse allowed without permission. The copyright holder for this preprint (which was not peer-reviewed) is the author/funder.. https://doi.org/10.1101/608505doi: bioRxiv preprint

12
RNA-Seq and bioinformatics analysis reveals increased representation of immune
ontologies in FYN knockdown glioma models
RNA-sequencing and bioinformatics analysis was used to discover changes in gene ontologies
(GOs) that could help us understand the mechanism by which FYN knockdown leads to the
inhibition of tumor growth and progression. Genomic studies were performed in the following
GEMM groups: NPF vs NP, NPAF vs NPA, and NPDF vs NPD. RNA-Seq analysis revealed a
group of 515 DE genes in NPF vs NP (205 upregulated genes and 310 downregulated genes;
1295 DE genes in NPAF vs NPA (469 upregulated and 826 downregulated) and 630 DE genes
in NPDF vs NPD (565 upregulated and 65 downregulated) (Supplementary Fig. S4A-D). Using
network analysis (Cytoscape) we analyzed the functional interaction of the DE genes resulting
from FYN knockdown (Supplementary Fig. S4). The analysis of the network interactions
revealed several genes which represent hubs and thus potential regulators of the network
functions (Supplementary Fig. S5 A-C). We found in NPF vs NP that STAT1, ITGA2, ITGA3,
ITGA9, GNA14, CAMK2A represent highly connected hubs of the network. In NPAF vs NPA the
most connected genes on the network were NFKB1, STAT1, SHC1, ITGB2, FN1, VCL, ITGB7,
CAMK2A. In NPDF vs NPD the hubs of the network are represented by FYN, STAT1, SYK,
RAC2, VAV1, PIK3CG, ITGB2. These genes play an essential role in gene regulation and
biological processes. Moreover, the functional network analysis found the following pathways as
commonly overrepresented in all three shFYN tumors independent of the genetic background of
the tumors: Extracellular matrix organization, Focal adhesion, IL12-mediated signaling events,
Integrin signaling pathway, Pathways in cancer, PI3K-Akt signaling pathway and Cytokine-
cytokine receptor interaction (Fig. Supplementary S6A-C and Supplementary Table S2A-C
S3). As is shown in the figures, other pathways were specifically impacted for each genetic
condition. Further, GOs analysis performed by I-PathwayGuide platform (Advaita Corporation, MI,
USA), corrected for multiple comparisons using Elim pruning method, is compatible with the
hypothesis that FYN knockdown mediates an activation of immune response among all GEMM
All rights reserved. No reuse allowed without permission. The copyright holder for this preprint (which was not peer-reviewed) is the author/funder.. https://doi.org/10.1101/608505doi: bioRxiv preprint
13
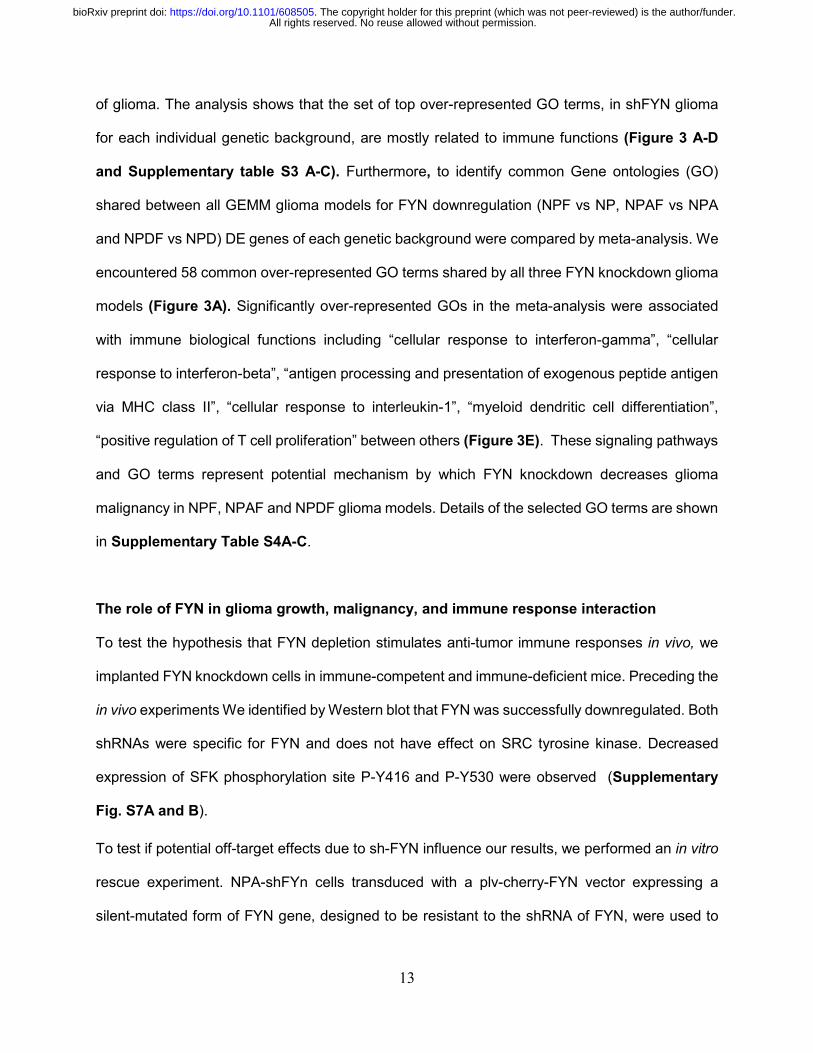
of glioma. The analysis shows that the set of top over-represented GO terms, in shFYN glioma
for each individual genetic background, are mostly related to immune functions (Figure 3 A-D
and Supplementary table S3 A-C). Furthermore, to identify common Gene ontologies (GO)
shared between all GEMM glioma models for FYN downregulation (NPF vs NP, NPAF vs NPA
and NPDF vs NPD) DE genes of each genetic background were compared by meta-analysis. We
encountered 58 common over-represented GO terms shared by all three FYN knockdown glioma
models (Figure 3A). Significantly over-represented GOs in the meta-analysis were associated
with immune biological functions including “cellular response to interferon-gamma”, “cellular
response to interferon-beta”, “antigen processing and presentation of exogenous peptide antigen
via MHC class II”, “cellular response to interleukin-1”, “myeloid dendritic cell differentiation”,
“positive regulation of T cell proliferation” between others (Figure 3E). These signaling pathways
and GO terms represent potential mechanism by which FYN knockdown decreases glioma
malignancy in NPF, NPAF and NPDF glioma models. Details of the selected GO terms are shown
in Supplementary Table S4A-C.
The role of FYN in glioma growth, malignancy, and immune response interaction
To test the hypothesis that FYN depletion stimulates anti-tumor immune responses in vivo, we
implanted FYN knockdown cells in immune-competent and immune-deficient mice. Preceding the
in vivo experiments We identified by Western blot that FYN was successfully downregulated. Both
shRNAs were specific for FYN and does not have effect on SRC tyrosine kinase. Decreased
expression of SFK phosphorylation site P-Y416 and P-Y530 were observed (Supplementary
Fig. S7A and B).
To test if potential off-target effects due to sh-FYN influence our results, we performed an in vitro
rescue experiment. NPA-shFYn cells transduced with a plv-cherry-FYN vector expressing a
silent-mutated form of FYN gene, designed to be resistant to the shRNA of FYN, were used to
All rights reserved. No reuse allowed without permission. The copyright holder for this preprint (which was not peer-reviewed) is the author/funder.. https://doi.org/10.1101/608505doi: bioRxiv preprint
14
rescue the shFYN induced knockdown. Expression of this construct counteracted the inhibition of
sh-FYN (Supplementary Fig. S7C). We then tested the biological effects of FYN expression on
cell viability. We observed a decreased proliferation in NPA-shFYN cells compared to NPA-NT.
FYN overexpression within NPA-shFYN cells reversed the effects of FYN knockdown
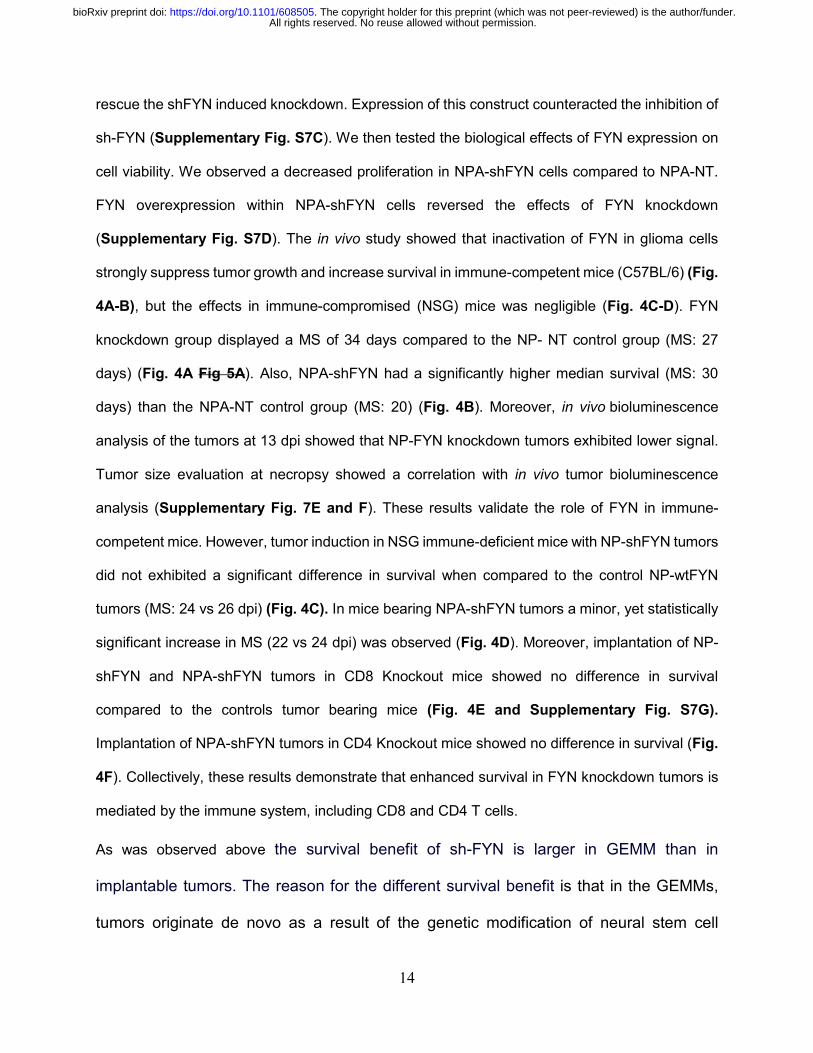
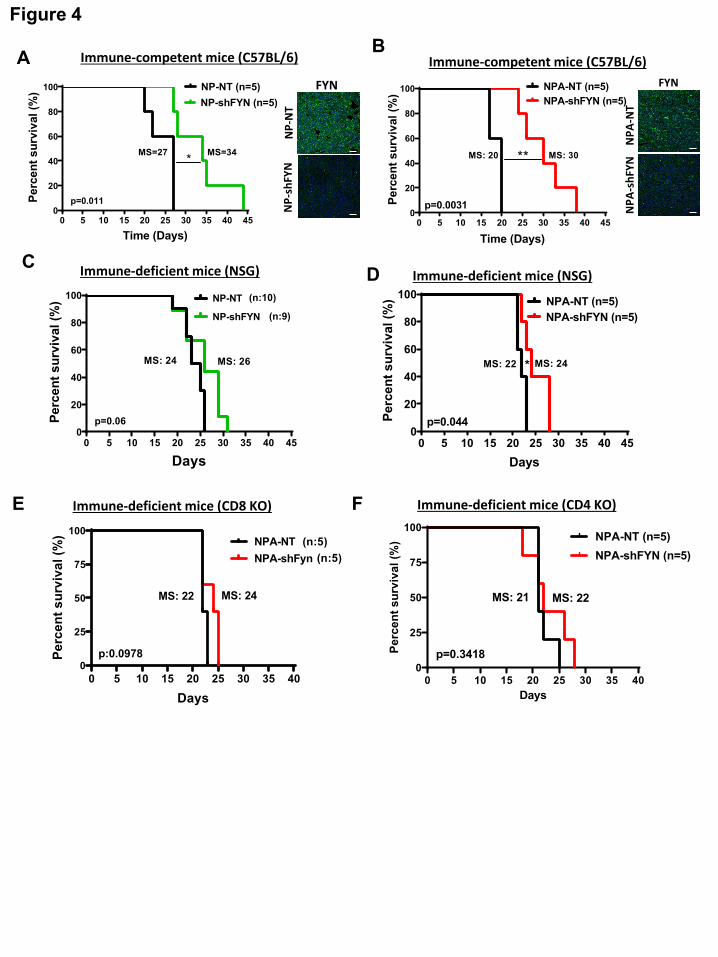
(Supplementary Fig. S7D). The in vivo study showed that inactivation of FYN in glioma cells
strongly suppress tumor growth and increase survival in immune-competent mice (C57BL/6) (Fig.
4A-B), but the effects in immune-compromised (NSG) mice was negligible (Fig. 4C-D). FYN
knockdown group displayed a MS of 34 days compared to the NP- NT control group (MS: 27
days) (Fig. 4A Fig 5A). Also, NPA-shFYN had a significantly higher median survival (MS: 30
days) than the NPA-NT control group (MS: 20) (Fig. 4B). Moreover, in vivo bioluminescence
analysis of the tumors at 13 dpi showed that NP-FYN knockdown tumors exhibited lower signal.
Tumor size evaluation at necropsy showed a correlation with in vivo tumor bioluminescence
analysis (Supplementary Fig. 7E and F). These results validate the role of FYN in immune-
competent mice. However, tumor induction in NSG immune-deficient mice with NP-shFYN tumors
did not exhibited a significant difference in survival when compared to the control NP-wtFYN
tumors (MS: 24 vs 26 dpi) (Fig. 4C). In mice bearing NPA-shFYN tumors a minor, yet statistically
significant increase in MS (22 vs 24 dpi) was observed (Fig. 4D). Moreover, implantation of NP-
shFYN and NPA-shFYN tumors in CD8 Knockout mice showed no difference in survival
compared to the controls tumor bearing mice (Fig. 4E and Supplementary Fig. S7G).
Implantation of NPA-shFYN tumors in CD4 Knockout mice showed no difference in survival (Fig.
4F). Collectively, these results demonstrate that enhanced survival in FYN knockdown tumors is
mediated by the immune system, including CD8 and CD4 T cells.
As was observed above the survival benefit of sh-FYN is larger in GEMM than in
implantable tumors. The reason for the different survival benefit is that in the GEMMs,
tumors originate de novo as a result of the genetic modification of neural stem cell
All rights reserved. No reuse allowed without permission. The copyright holder for this preprint (which was not peer-reviewed) is the author/funder.. https://doi.org/10.1101/608505doi: bioRxiv preprint

15
progenitors in one day old pups. In the implantable glioma model, tumors are induced by
intracranial implantation of 30,000 cells. Median survival is 80, 94 days in GEMM, and 27,
20 days in implantable tumors. Percentagewise, sh-FYN increases survival by 139%,
177% in GEMM (NP, NPA), and by 125%, 150% in NP, NPA implantable tumors (Fig 2A-
B; Fig. 4A-B). We believe that the survival benefit of shFYN is reduced in implantable
gliomas due to their increased growth rate.
FYN downregulation in glioma reduces Myeloid derived suppressive cells (MDSC) amount
and activation markers, and inhibitory potency within the tumor microenvironment (TME)
To determine whether downregulation of FYN in gliomas has an effect on the immune response,
we examined the immune cellular infiltrates in the TME. First, we analyzed the role of T cells in
the TME of shFYN tumors. No significant difference in the frequency of CD4+ T cells (CD45+,
CD3+, CD4+) or CD8+ T cells (CD45+, CD3+, CD8+) were observed in NPA-NT versus NPA-shFYN
tumors (Fig. 6A, B, C and D). However, we found a reduction in CD8 T cells that express PD1,
a marker of T cell exhaustion (Fig. 5E-F). In gliomas, increases in MDSCs are an important
mechanism of anti-tumor immune evasion 16. Therefore, we evaluated the expansion of MDSCs
mediated immunosuppression in glioma TME. MDSCs were identified as monocytic M-MDSC
(CD45+, CD11b+, Ly6Chi, Ly6G-) or polimorphonuclear PMN-MDSC (CD45+, CD11b+, Ly6Clo,
Ly6G+). Interestingly, we observed a 1.79-fold decrease of M-MDSC (Fig. 6G and 6I) and a 3.04-
fold decrease of PMN-MDSC (Fig. 6H and 6I) in the TME of NPA-shFYN gliomas compared to
NPA-NT controls. Further, we analyzed the immunosuppressive function of MDSC isolated from
the TME of GEMM tumors. We first characterized MDSC by expression of T cell-
immunosuppressive molecules, i.e., as ARG1 and CD80. We observed a significant decrease in
the proportion of CD80+ and arginase+ M-MDSCs, and arginase+ PMN-MDSCs in shFYN tumors
(Fig. 5 J, K, L, M). To test whether decreased numbers of MDSC in shFYN TME is due to reduced
All rights reserved. No reuse allowed without permission. The copyright holder for this preprint (which was not peer-reviewed) is the author/funder.. https://doi.org/10.1101/608505doi: bioRxiv preprint

16
MDSC migration we performed an in vitro bone marrow-derived MDSC migration assay (Fig 6A).
This experiment showed that shFYN conditioned media reduced M-MDSC migration. Migration
of PMN-MDSC was not decreased in the shFYN group (Fig. 6B). Finally, we analyzed the
functional MDSC-mediated T-cell immune suppressive activity. We observed that PMN-MDSC
(GR1hi CD11b+) or M-MDSC (Gr1low CD11b+) from the TME of NPA-NT and NPA-shFYN
decreased T-cell proliferation stimulated by SIINFEKL peptide. However, MDSCs isolated from
the sh-FYN tumors were significantly less inhibitory. These data suggest that the
microenvironment of shFYN glioma tumors reduce the capacity of MDSCs to inhibit T-cell
activation.
Besides, we analyzed the expansion and activation status of macrophages. We did not observe
a significant increase in the frequency of macrophages (CD45+, CD11c-, F4/80+) (Supplementary
Fig. 8H and I). The expression MHCII on macrophages in the TME was increased by 1.4-fold in
NPA-shFYN gliomas versus NPA-NT controls (Fig. 8J and K). It is likely that the lower proportion
and suppressive activity of MDSC in shFYN tumors leads to increases of M1 macrophages
(MHCIIhi) and therefore reduced polarization to M2 macrophages. Overall, our data show that
downregulating expression of FYN in glioma tumors decreases expansion of MDSC in the TME
due to reduced migration potential, decreased expression of CD80 and ARG1, and lower
functional immune suppressive activity.
DISCUSSION
In this study we demonstrate that glioma-cell specific genetic inhibition of FYN tyrosine kinase
increases anti-glioma immune-responses, thus significantly delaying tumor progression.
FYN is an effector of the RTK (EGFR, MET, PDGFR) pathway in glioma and other cancers.
Downstream of RTK, FYN signals through RAS dependent (via RAS/MEK/ERK) and RAS-
independent pathways (via PIK3/AKT, B-catenin, FAK, PXN, STAT3, VAV1 and/or SHC) (Fig.
All rights reserved. No reuse allowed without permission. The copyright holder for this preprint (which was not peer-reviewed) is the author/funder.. https://doi.org/10.1101/608505doi: bioRxiv preprint

17
1A). To activate several downstream molecular pathways, and physiological processes such as
cellular proliferation, migration, and cell adhesion4,17. RTK are commonly mutated drivers in high
grade gliomas; yet their detailed downstream signaling pathways remain incompletely understood
3,4,17-19.
Molecular analyses of high grade glioma from the Rembrandt, TCGA and Gravendeel databases7,
and data from Lu et al 3, indicate increased expression of FYN. These human data correlate with
our results in mouse models of gliomas, in which increased levels of FYN expression correlate
with higher glioma aggressiveness. Further, our molecular gene interaction network analysis
highlights FYN as a central network hub, suggesting it might function as a potential regulator of
glioma malignancy.
Previous studies have shown that FYN is expressed by both tumor cells and immune cells 20.
In T cells, FYN regulates effector functions and amplifies T-cell antigen receptor (TCR) signaling
4,18,19,21. However, it has been difficult to establish the role of FYN within glioma in vivo. The
function of FYN can be studied genetically (i.e. knockdown) or pharmacologically (i.e. Saracatinib,
or Dasatinib inhibitors). Genetic inhibition is highly specific. Pharmacological inhibition, however,
is non-specific. Saracatinib or Dasatinib will inhibit all SFK members and will inhibit SFK in all cell
types i.e. FYN in the immune cells.
For instance, in vitro studies using SFK inhibitors show that FYN promotes cell proliferation and
migration in gliomas 3,9,22,23. In vivo, effects of Saracatinib treatment have been mixed, yet unable
to determine any specific role of FYN in glioma growth 3,8. Importantly, Dasatinib, did not extend
survival of glioma patients in a Phase II clinical trial 24. In vivo however, there was no effect on
animal survival.
As Saracatinib and Dasatinib are non-specific inhibitors of individual SFK member 25, the genetic
inhibition of FYN remains the best option to study its functions in glioma biology. Indeed, genetic
downregulation of FYN expression inhibited glioma cells migration and proliferation in vitro 3,8,9,26,
yet failed to affect glioma progression in in vivo immune suppressive mice 8.
All rights reserved. No reuse allowed without permission. The copyright holder for this preprint (which was not peer-reviewed) is the author/funder.. https://doi.org/10.1101/608505doi: bioRxiv preprint

18
To address this paradox, we developed a genetic approach to inhibit FYN expression in tumor
cells using a GEMM model of glioma in immune competent animals. Our results suggest that
shFYN delays tumor initiation and progression in vivo by inhibiting the anti-glioma immune
response.
We demonstrated the role that FYN plays as central hub in the anti-glioma immune response and
tumor progression by inducing tumors in immune-deficient animals. The effect of FYN in delaying
tumor growth was abolished in NSG, CD8-/- and CD4-/- immune deficient animals. Both CD8 and
CD4 T cells are necessary for increased tumor rejection of sh-FYN gliomas. These studies
suggest that FYN plays a crucial role in conveying immune inhibitory messages from within the
glioma cells to the immune cells, thereby engineering the local immune response to favor tumor
growth. Herein, we uncovered a new cell-non-autonomous mechanism by which FYN knockdown
within glioma cells modulates the anti-glioma immune responses.
Analysis of the molecular changes induced by shRNA-FYN strongly suggests that the
downregulation of FYN in tumor cells activates the anti-tumor immune response. Meta-analysis
of GO for NPF vs NP, NPAF vs NPA and NPDF vs NPD revealed significantly common immune
related biological process among all genetic glioma models of FYN-knockdown such as “cellular
response to interferon-gamma”, “cellular response to interferon-beta”, “antigen processing and
presentation of exogenous peptide antigen via MHC class II”, “cellular response to interleukin-1”,
“myeloid dendritic cell differentiation”, “positive regulation of T cell proliferation” and others.
Moreover, further functional network analysis found that FYN knockdown tumors display central
hubs regulators and over-represented pathways as STAT1, a prominent regulator of the immune
system 27. This module regulates immune functions, IFNγ cellular signaling, JAK-STAT pathways,
cell differentiation of Th1, Th2 and Th17, T cell activation and NK cell mediated cytotoxicity28,29.
Although they exhibit the same final phenotype and common biological processes or signaling
pathways, the specific mechanisms by which FYN downregulation regulates the anti-glioma
immune response would be different for each GEMM of glioma.
All rights reserved. No reuse allowed without permission. The copyright holder for this preprint (which was not peer-reviewed) is the author/funder.. https://doi.org/10.1101/608505doi: bioRxiv preprint

19
Finally, our glioma TME analysis suggests that, FYN downregulation in glioma tumors decreases
MDSC expansion and their immune suppressive activity. We and others have previously reported
that glioma infiltrating MDSCs play a key role in inhibiting anti-tumor T-cell immune responses,
thus promoting tumor progression 16. The inhibitory immune-microenvironment in glioma is
thought to contribute to the ineffectiveness of immunotherapies 30. Novel therapeutics approaches
that reverse the inhibitory microenvironment are essential to counteract these effects, and we
propose that the inhibition of FYN within glioma cells could represent such a strategy. shFYN
gliomas determined a reduced MDSC migration potential, a decreased immunosuppressive cell
phenotype (lower CD80 and ARG1 cells) and lower functional immune suppressive activity. T
cell depletion of L-arginine through Arginase causes interference with the CD3ζ chain and
proliferative arrest of antigen-activated T cell. Inhibitory CD80 receptors of B7.1 family was
implicated in MDSC mediated immune suppression (REF). Glioma microenvironment of FYN
knockdown glioma diminished myeloid cell-mediated immunosuppression, leading to increased T
cell proliferation and cytotoxicity, decreased T cell exhaustion and M1 to M2 macrophages
polarization amplifying anti-glioma immunity.
We propose that inhibition of FYN within glioma cells could be an immune-mediated therapeutic
target to restrict MDSC immune suppressive expansion. Since FYN is expressed by both immune
cells and tumor cells, therapeutic approaches will need to target FYN specifically in tumor cells.
We propose that the combination of tumor cell specific FYN inhibition with other immune-
stimulatory treatments, such as immune checkpoint blockade (PDL1-PD1 inhibitors), or Ad-
hCMV-TK and Ad-hCMV-Flt3L gene therapy 11,31,32 are promising avenues that are worth of being
explored in future experiments.
Funding
Work was supported by National Institutes of Health, NIH/NINDS Grants: R37-NS094804, R01-
NS105556 to M.G.C.; NIH/NINDS Grants R01-NS076991, and R01-NS096756 to P.R.L.;
All rights reserved. No reuse allowed without permission. The copyright holder for this preprint (which was not peer-reviewed) is the author/funder.. https://doi.org/10.1101/608505doi: bioRxiv preprint
20
NIH/NIBIB: R01-EB022563; NIH/NCI U01CA224160; the Department of Neurosurgery, Rogel
Cancer Center at The University of Michigan, ChadTough Foundation, and Leah’s Happy Hearts
Foundation to M.G.C. and P.R.L. University of Michigan, MICHR Postdoctoral Translational
Scholars Program, TL1 TR002240-02, Project F049768 to A.C.
REFERENCES 1. Reifenberger G, Wirsching HG, Knobbe-Thomsen CB, Weller M. Advances in the
molecular genetics of gliomas - implications for classification and therapy. Nature reviews. Clinical oncology. 2017; 14(7):434-452.
2. Frattini V, Trifonov V, Chan JM, et al. The integrated landscape of driver genomic alterations in glioblastoma. Nature genetics. 2013; 45(10):1141-1149.
3. Lu KV, Zhu S, Cvrljevic A, et al. Fyn and SRC are effectors of oncogenic epidermal growth factor receptor signaling in glioblastoma patients. Cancer research. 2009; 69(17):6889-6898.
4. Yadav V, Denning MF. Fyn is induced by Ras/PI3K/Akt signaling and is required for enhanced invasion/migration. Mol Carcinog. 2011; 50(5):346-352.
5. Jensen AR, David SY, Liao C, et al. Fyn is downstream of the HGF/MET signaling axis and affects cellular shape and tropism in PC3 cells. Clinical cancer research : an official journal of the American Association for Cancer Research. 2011; 17(10):3112-3122.
6. Zhang S, Fan G, Hao Y, Hammell M, Wilkinson JE, Tonks NK. Suppression of protein tyrosine phosphatase N23 predisposes to breast tumorigenesis via activation of FYN kinase. Genes Dev. 2017; 31(19):1939-1957.
7. Bowman RL, Wang Q, Carro A, Verhaak RG, Squatrito M. GlioVis data portal for visualization and analysis of brain tumor expression datasets. Neuro-oncology. 2017; 19(1):139-141.
8. Lewis-Tuffin LJ, Feathers R, Hari P, et al. Src family kinases differentially influence glioma growth and motility. Mol Oncol. 2015; 9(9):1783-1798.
9. Han X, Zhang W, Yang X, et al. The role of Src family kinases in growth and migration of glioma stem cells. Int J Oncol. 2014; 45(1):302-310.
10. Preusser M, Lim M, Hafler DA, Reardon DA, Sampson JH. Prospects of immune checkpoint modulators in the treatment of glioblastoma. Nature reviews. Neurology. 2015; 11(9):504-514.
11. Ratnam NM, Gilbert MR, Giles AJ. Immunotherapy in CNS cancers: the role of immune cell trafficking. Neuro-oncology. 2019; 21(1):37-46.
12. Koschmann C, Calinescu AA, Nunez FJ, et al. ATRX loss promotes tumor growth and impairs nonhomologous end joining DNA repair in glioma. Sci Transl Med. 2016; 8(328):328ra328.
13. Núñez FJ, Mendez FM, Kadiyala P, et al. IDH1-R132H acts as a tumor suppressor in glioma via epigenetic up-regulation of the DNA damage response. 2019; 11(479):eaaq1427.
14. Yadav VN, Zamler D, Baker GJ, et al. CXCR4 increases in-vivo glioma perivascular invasion, and reduces radiation induced apoptosis: A genetic knockdown study. Oncotarget. 2016; 7(50):83701-83719.
15. Calinescu AA, Yadav VN, Carballo E, et al. Survival and Proliferation of Neural Progenitor-Derived Glioblastomas Under Hypoxic Stress is Controlled by a CXCL12/CXCR4 Autocrine-Positive Feedback Mechanism. Clinical cancer research : an official journal of the American Association for Cancer Research. 2017; 23(5):1250-1262.
All rights reserved. No reuse allowed without permission. The copyright holder for this preprint (which was not peer-reviewed) is the author/funder.. https://doi.org/10.1101/608505doi: bioRxiv preprint

21
16. Kamran N, Kadiyala P, Saxena M, et al. Immunosuppressive Myeloid Cells' Blockade in the Glioma Microenvironment Enhances the Efficacy of Immune-Stimulatory Gene Therapy. Molecular therapy : the journal of the American Society of Gene Therapy. 2017; 25(1):232-248.
17. Saito YD, Jensen AR, Salgia R, Posadas EM. Fyn: a novel molecular target in cancer. Cancer. 2010; 116(7):1629-1637.
18. Elias D, Ditzel HJ. Fyn is an important molecule in cancer pathogenesis and drug resistance. Pharmacol Res. 2015; 100:250-254.
19. Zheng J, Li H, Xu D, Zhu H. Upregulation of Tyrosine Kinase FYN in Human Thyroid Carcinoma: Role in Modulating Tumor Cell Proliferation, Invasion, and Migration. Cancer Biother Radiopharm. 2017; 32(9):320-326.
20. Palacios EH, Weiss A. Function of the Src-family kinases, Lck and Fyn, in T-cell development and activation. Oncogene. 2004; 23(48):7990-8000.
21. Yamauchi J, Miyamoto Y, Torii T, et al. Phosphorylation of cytohesin-1 by Fyn is required for initiation of myelination and the extent of myelination during development. Science signaling. 2012; 5(243):ra69.
22. Yamaguchi H, Takanashi M, Yoshida N, et al. Saracatinib impairs the peritoneal dissemination of diffuse-type gastric carcinoma cells resistant to Met and fibroblast growth factor receptor inhibitors. Cancer Sci. 2014; 105(5):528-536.
23. Liu KJ, He JH, Su XD, et al. Saracatinib (AZD0530) is a potent modulator of ABCB1-mediated multidrug resistance in vitro and in vivo. Int J Cancer. 2013; 132(1):224-235.
24. Lassman AB, Pugh SL, Gilbert MR, et al. Phase 2 trial of dasatinib in target-selected patients with recurrent glioblastoma (RTOG 0627). Neuro-oncology. 2015; 17(7):992-998.
25. Jelic D, Mildner B, Kostrun S, et al. Homology modeling of human Fyn kinase structure: discovery of rosmarinic acid as a new Fyn kinase inhibitor and in silico study of its possible binding modes. Journal of medicinal chemistry. 2007; 50(6):1090-1100.
26. Zhang S, Qi Q, Chan CB, et al. Fyn-phosphorylated PIKE-A binds and inhibits AMPK signaling, blocking its tumor suppressive activity. Cell Death Differ. 2016; 23(1):52-63.
27. Schindler C, Shuai K, Prezioso VR, Darnell JE, Jr. Interferon-dependent tyrosine phosphorylation of a latent cytoplasmic transcription factor. Science (New York, N.Y.). 1992; 257(5071):809-813.
28. Majoros A, Platanitis E, Kernbauer-Holzl E, Rosebrock F, Muller M, Decker T. Canonical and Non-Canonical Aspects of JAK-STAT Signaling: Lessons from Interferons for Cytokine Responses. Frontiers in immunology. 2017; 8:29.
29. Avalle L, Pensa S, Regis G, Novelli F, Poli V. STAT1 and STAT3 in tumorigenesis: A matter of balance. Jak-stat. 2012; 1(2):65-72.
30. Kamran N, Chandran M, Lowenstein PR, Castro MG. Immature myeloid cells in the tumor microenvironment: Implications for immunotherapy. Clinical immunology (Orlando, Fla.). 2018; 189:34-42.
31. Ivashkiv LB. IFNgamma: signalling, epigenetics and roles in immunity, metabolism, disease and cancer immunotherapy. Nature reviews. Immunology. 2018; 18(9):545-558.
32. Kamran N, Alghamri MS, Nunez FJ, et al. Current state and future prospects of immunotherapy for glioma. Immunotherapy. 2018; 10(4):317-339.
Figure 1. FYN is a potential regulator of aggressiveness in mouse gliomas. (A) FYN tyrosine
signals downstream from mutated membrane RTK and Integrin driver genes. Red:
All rights reserved. No reuse allowed without permission. The copyright holder for this preprint (which was not peer-reviewed) is the author/funder.. https://doi.org/10.1101/608505doi: bioRxiv preprint

22
mutation/amplification, green: mutation/deletion, orange: FYN overexpression. (B) Kaplan–Meier
survival curves of implantable mouse glioma models shows difference in tumor malignancy. NPAI
display an increased survival compared with NP and NPA glioma bearing mice. NPAI (MS: 34
days; n: 4), NP (MS: 24 days; n: 4), NPA (MS: 23 days; n: 4). (C) FYN levels correlate positively
with glioma cell malignancy in WB analysis comparing FYN and SRC levels in mouse (NP, NPA,
NPAI) glioma cells; loading control = β-actin. (D) Network of DE genes in high malignancy NPA
vs low malignancy NPAI mouse glioma neurospheres. FYN is the largest yellow octagon. Cluster
of nodes of identical color represents a module of highly interacting genes. The FYN network is
highlighted in yellow. (E) Right panel: the FYN network; FYN has a degree of 63. Red lines
indicate edges connecting nodes to FYN.
Figure 2. Knocking down FYN in GEMM prolongs animal survival. (A-C) Kaplan–Meier
survival curves of SB mouse glioma models demonstrate that animals bearing FYN knockdown
tumors have increased median survival (MS). (A) NP (MS: 94 days; n: 15) versus NPF (MS: 131
days; n: 29). (B) NPA (MS: 80 days; n: 16) versus NPAF (MS: 142 days; n: 28). (C) NPD (MS: 69
days; n: 15) versus NPDF (MS: 108 days; n: 23). Log-rank (Mantel-Cox) test; *** p<0.001,
****p<0.0001. (D-F, top) FYN expression in tumors (green = tumor; and Blue = DAPI stained
nuclei), quantified as fluorescence integrated density using Image-J (D-F, bottom); n=5 per
condition, scale bar = 50 μm. Ten random fields per tumor section per animal were imaged. Bars
±SEM are shown; (***p<0.001, *p<0.05 using linear mixed effect models) (G-I). Histopathological
analysis was performed in tumor sections stained with H&E; shFYN tumors were compared with
controls. Scale bars: 100 μm. P: pseudo-palisades, N: necrosis, H: hemorrhage, VP: vascular
proliferation, MS: mesenchymal component, SC: small cells, G: giant cells. (J) Table representing
histopathological semi-quantitative analysis: very low (+/-), low (+), medium (++) and high (+++).
(K-M) Cell proliferation analysis: Positive P-H3-S10 cells were counted by Image-J software.
Scale bars: 50 μm. P-H3-S10 positive cells per total cells in the visual field; n=5. Ten fields of
All rights reserved. No reuse allowed without permission. The copyright holder for this preprint (which was not peer-reviewed) is the author/funder.. https://doi.org/10.1101/608505doi: bioRxiv preprint
23
each section were selected at random. Error bars represent ±SEM; linear mixed effect models,
***p<0.001, **p<0.01.
Figure 3. Enrichment in immune-related pathways as potential mechanisms involved in
FYN-mediated tumor growth control. Overrepresented Gene Ontology (GO) biological term in
the DE genes dataset was carried out using iPathwayGuide algorisms. Over-representation
approach to compute the statistical significance was used. p-value is computed using the
hypergeometric distribution and corrected for multiple comparisons using elim pruning methods.
Minimum DE genes/term of 6. (A) Venn diagram of GOs Biological Process. Meta-analysis of
different genetic glioma models shows individual GO terms and 58 common biological process
shared between all groups. For GO analysis, genes with 0.05 p-value and a log fold change of
at least east 0.585 absolute value were considered significant. (B, C, D) Graph representing the
top 20 most significant enriched GO terms identified for each individual genetic glioma model. (B)
Enriched GO terms of NPF vs NP. (C) Enriched GO terms of NPAF vs NPA. (D) Enriched GO
terms of NPDF vs NPD. (E) Bars graph showing the significant over-represented 58 common GO
terms biological process identified by meta-analysis.
Figure 4. Tumor growth delay and increased survival in FYN downregulated gliomas is
immune mediated.
(A-B) Kaplan–Meier survival curves for glioma in C57BL/6 immune-competent mice. (A) NP-FYN
knockdown gliomas displayed significant increases in MS: 27 vs 34 days; *p=0.011. (B) Mice
bearing gliomas with NPA-FYN knockdown displayed significant increase in MS: 20 vs 30 days;
**p=0.0031 compared to the control; n=5. FYN expression was detected by immunofluorescence.
Tumor: green; Nuclei: blue; scale bars: 50 μm. (C-D) Kaplan–Meier survival curves in NSG
immune-compromised mice. (C) NP-FYN knockdown gliomas displayed no significant increases
in MS (24 vs 26 days; p=0.06) n=9/10. (D) NPA-FYN knockdown displayed a minor increase in
All rights reserved. No reuse allowed without permission. The copyright holder for this preprint (which was not peer-reviewed) is the author/funder.. https://doi.org/10.1101/608505doi: bioRxiv preprint

24
MS (22 vs 24 days; *p=0.044); n=5. (E-F) Kaplan–Meier survival curve for NPA-NT vs NPA-
shFYN glioma in (E) CD8 and (F) CD4 KO immune-deficient mice. No significant difference was
observed in survival. For each implantable model n=5 was used. Statistics were assessed using
the log-rank Mantel-Cox test.
Figure 5. Downregulation of FYN in glioma modulates immune responses through
reduction in MDSC expansion. Immune cells within the TME of NPA-NT or NPA-shFYN tumors
were analyzed by flow cytometry. (A-B) Percentage of CD4-T (CD4+, CD3+) cells within the CD45+
cell population. Representative flow plots for each group are displayed (C-D) Percentage of CD8-
T cells (CD8+, CD3+) within the CD45+ cell population. Representative flow plots for each group
are displayed. (E-F) Percentage of PD1+ T cells within the CD8+ CD3+ and CD45+ cell
population. Representative histogram flow plot for each group are displayed. (G) Percentage of
monocytic myeloid derived suppressor cells (M-MDSCs: CD11b+, Ly6Chi, Ly6G-) within the
CD45+ cell population. (H) Percentage of polymorphonuclear myeloid derived suppressor cells
(PMN-MDSCs: CD11b+, Ly6Clo, Ly6G+) within the CD45+ cell population. (I) Representative flow
plots of M-MDSC and PMN-MDSC cell analysis. (J-M) Percentage of CD80+ and Arginase+ cells
within (J-K) M-MDSC (CD45+, CD11b+, Ly6Chi, Ly6G-) cell population and (L-M) PMN-MDSC
(CD45+, CD11b+, Ly6Clo, Ly6G+) cell population. (K-M) Representative histogram of CD80+ and
ARGINASE+ cell analysis. Red-shaded: NPA-NT, Grey-shaded: NPA-shFYN, Solid Black-
dashed: FMO Control. Each graph indicates individual values and mean ± SEM (n= 10). Data
were analyzed using ANOVA test. ns= non-significant; *p < 0.05.
Figure 6. FYN knockdown in glioma decrease MDSC migration potential and immune
suppressive activity within the tumor microenvironment. (A) Diagram of experimental design
of MDSC transwell migration assay. MDSCs derived from bone marrow and induced with IL6 and
GM-CSF were seeded on the top of the Transwell and incubated for 15 hours in NT and shFYN
All rights reserved. No reuse allowed without permission. The copyright holder for this preprint (which was not peer-reviewed) is the author/funder.. https://doi.org/10.1101/608505doi: bioRxiv preprint

25
conditioned media. The migrated cells were analyzed using CellTiter-Glo®. (B) MDSC migration
assay results. Data is expressed as percentage of migrating cells relative to the control (plain
media). Error bars represent ±SEM. Experiment was performed 3 times with 3 replicates per
treatment. Statistical significance was determined using One-way ANOVA test, followed by
Duncan multiple comparisons. ns: Non-significant, *p<0.05, ***p<0.001, ****p<0.0001. (C)
Diagram representing the experimental design to analyze the immunosuppressive potential
of MDSCs. Gr-1high (PMN-MDSC) and Gr-1low (M-MDSC) were purified from the TME of moribund
NPA-NT and NPA-shFYN tumor-bearing mice. They were cultured with CFSE-
labeled splenocytes from Rag2/OT-1 transgenic mice. Cells were stimulated with SIINFEKL
peptide and proliferation was analyzed 4 days after by flow cytometry. (D) Representative flow
plots for CFSE stains from splenocytes alone SIINFEKL stimulated and non-stimulated, and the
effect of SIINFEKL-induced T cell proliferation in the presence of MDSCs from the TME. Numbers
in parentheses indicate the ratio of MDSCs to splenocytes. (E) Graph shows T cell proliferation
relative to SIINFEKEL+ control. Experiment was repeated 3 times. Tumors from 5 mice per group
were pooled together in each experiments to obtain sufficient number MDSCs. Mean ± SEM are
indicated. Data were analyzed using one-way ANOVA, followed by Duncan multiple comparisons.
ns: non-significant, *p<0.05, **p<0.005.
All rights reserved. No reuse allowed without permission. The copyright holder for this preprint (which was not peer-reviewed) is the author/funder.. https://doi.org/10.1101/608505doi: bioRxiv preprint

Figure 1A
B
FYN tyrosine kinase signaling in GBM
Mouse glioma FYN network(NPA vs NPAI)
The mouse glioma network(NPA vs NPAI)
EDays
Perc
ent s
urvi
val (
%)
0 5 10 15 20 25 30 35 400
102030405060708090
100NP (n=4), MS: 24NPA (n=4), MS: 23NPAI (n=4), MS: 34
**
p=0.0015
D
C
All rights reserved. No reuse allowed without permission. The copyright holder for this preprint (which was not peer-reviewed) is the author/funder.. https://doi.org/10.1101/608505doi: bioRxiv preprint

A B C
D E F
G H I
J
K M
0 2 × 1 0 6 4 × 1 0 6 6 × 1 0 6 8 × 1 0 6 1 × 1 0 7
N P
N P F
I n t e g r a t e d d e n s i t y
* * *
0 2 × 1 0 6 4 × 1 0 6 6 × 1 0 6 8 × 1 0 6 1 × 1 0 7
N P D
N P D F
I n t e g r a t e d d e n s i t y
*
0 2 × 1 0 6 4 × 1 0 6 6 × 1 0 6 8 × 1 0 6 1 × 1 0 7
N P A
N P A F
I n t e g r a t e d d e n s i t y
* * *
N P N P F0 .0 0
0 .0 5
0 .1 0
0 .1 5
0 .2 0
P-H
3 c
ell
s/T
ota
l c
ell
s
* *
N P A N P AF0 .0 0
0 .0 1
0 .0 2
0 .0 3
0 .0 4
P-H
3 c
ell
s/T
ota
l c
ell
s
* * * *
N P D N P D F0 .0 0
0 .0 2
0 .0 4
0 .0 6
0 .0 8
P-H
3 c
ell
s/T
ota
l c
ell
s
0 5 0 1 0 0 1 5 0 2 0 0 2 5 0 3 0 00
2 0
4 0
6 0
8 0
1 0 0
T im e (D a y s )
Pe
rce
nt
su
rviv
al
(%)
N P
M S : 9 4
(n = 1 5 )
N P F
M S : 1 3 1
(n = 2 9 )
p < 0 .0 0 0 1
* * * *
0 5 0 1 0 0 1 5 0 2 0 0 2 5 0 3 0 00
2 0
4 0
6 0
8 0
1 0 0
T im e (D a y s )
Pe
rce
nt
su
rviv
al
(%)
N P A
N P A F
M S : 8 0 M S : 1 4 2
(n = 2 8 )
(n = 1 6 )
p < 0 .0 0 0 1
* * * *
0 5 0 1 0 0 1 5 0 2 0 0 2 5 0 3 0 00
2 0
4 0
6 0
8 0
1 0 0
T im e (D a y s )
Pe
rce
nt
su
rviv
al
(%)
N P D
M S : 6 9
(n = 1 5 )
N P D F
M S : 1 0 8
(n = 2 3 )
p < 0 .0 0 1
* * *
FYN
NP NPF
FYN
NPA NPAF
FYN
NPD NPDF
P-H3-S10
NP
NPF
P-H3-S10
NPA
NPA
F
NPD
NPD
F
P-H3-S10
NP NPF
GVP
PN
SC
SC
NPA NPAF
VPSC
MSH
MSG
PH
N
NPD NPDF
PN
MS MS
SC
VP
Figure 2
TUMOR Giant cells Necrosis Hemorrhage Small cells
Mesenchymal Sarcomatouscomponents
Pseudo-Palisades
Vascular proliferation Invasion
NP ++ ++ +++ ++ ++ ++ +++ +++
NPF ++ +++ +++ +++ + + +++ ++
NPA +++ +++ +++ ++ +++ +/- ++ +++
NPAF +++ + +++ +++ ++ +/- ++ +++
NPD ++ +++ +++ ++ +++ +++ ++ +++
NPDF + + + ++ +++ ++ ++ +++
+/- Very Low+ Low
++ Medium+++ High
l
All rights reserved. No reuse allowed without permission. The copyright holder for this preprint (which was not peer-reviewed) is the author/funder.. https://doi.org/10.1101/608505doi: bioRxiv preprint

A) B)
0 20 40 60 80
Positive reg. of cardiac muscle cell diff.Phagocytosis
Positive reg. of IL-1 beta secretionCell-matrix adhesion
Defense responseCollagen catabolic process
Defense response to protozoanAntigen proc. and pres. via MHC class II
Positive reg. of ERK1 and ERK2 cascadeCell adhesion
Response to bacteriumHeterophilic cell-cell adhesion
Excitatory postsynaptic potentialCollagen fibril organization
AngiogenesisExtracellular matrix organization
Inflammatory responsePositive reg. of apoptotic process
MemoryCellular response to interferon-gamma
Cellular response to interferon-beta
-log2 (p value)
Enriched GO terms - NPAF vs NPA
0 5 10 15 20 25
Positive reg. of fibroblast proliferationNegative reg. of cell proliferation
Positive reg. of cell migrationCartilage dev. involved in end. bone morphog.
Positive reg. of bone mineralizationIntegrin-mediated signaling pathway
Positive reg. of osteoblast differentiationCollagen fibril organization
Protein heterotetramerizationPositive reg. of ERK1 and ERK2 cascade
Cellular response to heatResponse to interferon-gamma
Neutrophil chemotaxisMemory
Negative reg. of canonical Wnt signaling path.Positive reg. of mesenchymal cell proliferation
Defense response to protozoanCellular response to interferon-gamma
Extracellular matrix organizationCellular response to interferon-beta
Antigen proc. and pres. via MHC class II
-log2 (p value)
Enriched GO terms - NPF vs NP
0 20 40 60 80 100
Activation of innate immune responseMyD88-dependent TLR sig. pathway
Response to interferon-gammaPositive reg. of T cell proliferation
Positive reg. of ERK1 and ERK2 cascadePositive reg. of interleukin-1 beta secretion
Positive reg. of TNF biosynthetic processChemokine-mediated signaling pathway
Protection from NK cell mediated cytotoxicityAntigen proc. and pres. via MHC class II
Microglial cell activationNeutrophil chemotaxis
Adaptive immune responseDefense response to Gram-positive bacterium
Response to bacteriumDefense response to protozoan
Cellular response to interferon-gammaInflammatory response
Defense response to virusInnate immune response
Cellular response to interferon-beta
-log2 (p value)
Enriched GO terms - NPDF vs NPDC) D)
NPAF vs NPA
697 485
369
205
95 4458
NPF vs NP
NPDF vs NPD
Figure 3
E)
0 20 40 60 80 100
Cellular response to interleukin-1Positive reg. of tumor necrosis factor production
Cellular response to tumor necrosis factorPositive reg of type I interferon-mediated signaling path.
Protection from NK cell mediated cytotoxicityPositive reg. of interleukin-6 secretion
Positive reg. of MAP kinase activityPositive reg. of reactive oxygen species met. process
Positive reg. of phagocytosis, engulfmentNeutrophil chemotaxis
Positive reg. of cell migrationPositive reg. of angiogenesis
Response to interferon-gammaNegative regulation of cell proliferation
Det. of mech. stimulus involved in sensory per. of painPositive reg. of NFKB transcription factor activity
Integrin-mediated signaling pathwayPositive reg. of smooth muscle cell proliferation
Positive reg. of smooth muscle cell migrationCell-matrix adhesion
Defense response to protozoanAntigen proc. and pres. via MHC class IIPositive reg. of ERK1 and ERK2 cascade
Collagen fibril organizationExtracellular matrix organization
Inflammatory responseCellular response to interferon-gamma
Cellular response to interferon-beta
-log2 (p value)0 10 20 30
Bone mineralizationBone remodeling
Positive reg. of epithelial cell proliferationPositive reg. of osteoblast differentiation
Positive reg. of JUN kinase activityCollagen-activated tyrosine kinase receptor signaling path.
Negative reg. of type I interferon-mediated signaling path.Positive reg. of transcription by RNA polymerase II
Positive reg. of viral entry into host cellPositive reg. of T-helper 1 type immune response
Positive reg. of cell proliferationPositive regulation of T cell proliferation
Vascular smooth muscle contractionAmyloid-beta clearance
Positive reg. of cell-cell adhesion mediated by integrinPositivereg. of IFNg-mediated signaling pathway
Eosinophil chemotaxisMyeloid dendritic cell differentiation
Positive reg. of peptidyl-tyrosine phosphorylationBranching morphogenesis of an epithelial tube
Positive reg. of calcium ion transportComplement activation, alternative pathway
Antigen proc. and pres. via MHC class I, TAP-dependentCytosol to ER transport
Defense response to bacteriumChemokine-mediated signaling pathwayPositive reg. of interleukin-8 production
Negative reg. of chondrocyte differentiationMonocyte chemotaxis
Positive reg. of fever generation
90 100
-log2 (p value)
NPF vs NPNPAF vs NPANPDF vs NPD
Shared GO terms – Biological Process
All rights reserved. No reuse allowed without permission. The copyright holder for this preprint (which was not peer-reviewed) is the author/funder.. https://doi.org/10.1101/608505doi: bioRxiv preprint
A
0 5 10 15 20 25 30 35 40 450
20
40
60
80
100
Time (Days)
Perc
ent s
urvi
val (
%) NPA-NT (n=5)
NPA-shFYN (n=5)
**MS: 20 MS: 30
p=0.0031
B
FYN
NPA
-NT
NPA
-shF
YN
Figure 4
Immune-competent mice (C57BL/6)
FE
Immune-deficient mice (NSG)
0 5 10 15 20 25 30 35 40 450
20
40
60
80
100
Days
Perc
ent s
urvi
val (
%) NPA-NT (n=5)
NPA-shFYN (n=5)
p=0.044
*MS: 22 MS: 24
Immune-deficient mice (CD8 KO)
0 5 10 15 20 25 30 35 400
25
50
75
100
Days
Perc
ent s
urvi
val (
%) NPA-NT
NPA-shFyn(n:5)
(n:5)
p:0.0978
MS: 22 MS: 24
0 5 10 15 20 25 30 35 400
25
50
75
100
Days
Perc
ent s
urvi
val (
%) NPA-NT (n=5)
NPA-shFYN (n=5)
p=0.3418
MS: 21 MS: 22
Immune-deficient mice (CD4 KO)
0 5 10 15 20 25 30 35 40 450
20
40
60
80
100
Time (Days)
Perc
ent s
urvi
val (
%) NP-NT (n=5)
NP-shFYN (n=5)
p=0.011
MS=27 MS=34*
NP-
NT
NP-
shFY
N
FYN
Immune-competent mice (C57BL/6)
0 5 10 15 20 25 30 35 40 450
20
40
60
80
100
Days
Perc
ent s
urvi
val (
%) NP-NT
NP-shFYN
(n:10)
(n:9)
MS: 24 MS: 26
p=0.06
DCImmune-deficient mice (NSG)
All rights reserved. No reuse allowed without permission. The copyright holder for this preprint (which was not peer-reviewed) is the author/funder.. https://doi.org/10.1101/608505doi: bioRxiv preprint

CNPA-NT NPA-shFYN
0
2
4
6
8CD4 T cells
% C
D3+
CD
4+ T
cel
ls
ns
NPA-NT NPA-shFYN0
1
2
3
4
5CD8 T cells
% o
f CD3
+ CD
8+ T
cel
ls
ns
NPA-NT NPA-shFYN0
20
40
60PD1 T- cells
% o
f PD1
+ CD8
+ CD3
+ / T c
ells
*
D
Nor
mal
ized
to m
ode
% cells
PD1CD45+
CD3+ CD8+
Figure 5
NPA-NT NPA-shFYN0
10
20
30
40
50 M-MDSC
% M
-MDS
C(C
D11b
+ Ly6
CHi
Ly6
G- )
*
NPA-NT NPA-shFYN0
5
10
15
20
25PMN-MDSC
%PM
N-M
DSC
(CD1
1b+ L
y6C
low
Ly6
G+ )
*
A B
H
0
20
40
60
80
100CD80
% o
f CD8
0 M
-MDS
C ce
lls(C
D11b
+ Ly6
CHi L
y6G
- CD80
+ )
*
NPA-NT NPA-shFYN 0
20
40
60
80CD80
% o
f CD8
0 PM
N-M
DSC
cells
(CD1
1b+ L
y6CHi
Ly6
G- CD
80+ )
ns
NPA-NT NPA-shFYN0
10
20
30
40
50ARGINASE
% o
f ARG
+ M
-MDS
C ce
lls(C
D11b
+ Ly6
CHi L
y6G
- CD80
+ )
*
NPA-NT NPA-shFYN 0
5
10
15ARGINASE
% o
f ARG
+ M
-MDS
C ce
lls(C
D11b
+ Ly6
CHi L
y6G
- CD80
+ )
*
NPA-NT NPA-shFYN
M-MDSC PMN-MDSC
CD80 ARGINASE
% cells% cells
Nor
mal
ized
to m
ode
CD80 ARGINASENor
mal
ized
to m
ode
% cells % cells
J
E
F
G I
L
MK
All rights reserved. No reuse allowed without permission. The copyright holder for this preprint (which was not peer-reviewed) is the author/funder.. https://doi.org/10.1101/608505doi: bioRxiv preprint

Figure 6
M-MDSC PMN-MDSC0
50
100
150
200
250
300
Rela
tive
Cell
Mig
ratio
n (%
) ControlNT CMshFYN CM
ns
***
* ns
**** ****
48 hrs CM
Bone marrow cells
Sorting: M-MDSC and PMN-MDSC
Induction:GM-CSF and IL-6
4 days
NPA-NT NPA-shFYN
A BMDSCs Migration Assay
C
FSC-
A
CD45
GR1
CD11B
GR1Hi (PMN-MDSC)
GR1Low (M-MDSC)
SIINFEKEL
4 days
T Cell proliferation by flow
CFSE labeled OT-1 splenocytes
SINFEKEL -
SINFEKEL +
GR1Hi MDSC (1:1)
Gr1Hi MDSC (2:1)
Gr1LOW MDSC (1:1)
Gr1LOW MDSC (2:1)
0
20
40
60
80
100
120
Perc
ent o
f pro
lifer
ativ
e ce
lls (%
)
**
NPA-NTNPA-shFYN
**ns
CFSE
Coun
t
% Proliferating cells
Splenocytes Alone
+ SINFEKEL
Gr1Hi (1:1)- SINFEKELSplenocytes+MDSC Splenocytes+MDSC
Gr1Hi (2:1) Gr1Low (2:1)
Gr1Low (1:1)
D E
All rights reserved. No reuse allowed without permission. The copyright holder for this preprint (which was not peer-reviewed) is the author/funder.. https://doi.org/10.1101/608505doi: bioRxiv preprint