g. marius clore and vincenzo venditti · feature review structure, dynamics and biophysics of the...
TRANSCRIPT
Feature Review
Structure, dynamics and biophysics ofthe cytoplasmic protein–proteincomplexes of the bacterialphosphoenolpyruvate: sugarphosphotransferase systemG. Marius Clore and Vincenzo Venditti
Laboratory of Chemical Physics, National Institute of Diabetes and Digestive and Kidney Diseases, National Institutes of Health,
Bethesda, MD 20892-0520, USA
Review
The bacterial phosphotransferase system (PTS) couplesphosphoryl transfer, via a series of bimolecular protein–protein interactions, to sugar transport across the mem-brane. The multitude of complexes in the PTS provides aparadigm for studying protein interactions, and for un-derstanding how the same binding surface can specifi-cally recognize a diverse array of targets. Fifteen years ofwork aimed at solving the solution structures of allsoluble protein–protein complexes of the PTS has servedas a test bed for developing NMR and integrated hybridapproaches to study larger complexes in solution and toprobe transient, spectroscopically invisible states, in-cluding encounter complexes. We review theseapproaches, highlighting the problems that can be tack-led with these methods, and summarize the currentfindings on protein interactions.
The PTS as a paradigm for understanding complexprotein interactionsThe bacterial phosphoenolpyruvate: sugar phosphotrans-ferase system (PTS) is the key signal transduction pathwayinvolved in the regulation of central carbon metabolism inbacteria [1–7]. The PTS comprises a sequential cascade ofbimolecular protein–protein complexes whereby a phos-phoryl group originating on phosphoenolpyruvate (PEP) istransferred onto incoming sugars, thereby coupling phos-phoryl transfer to active sugar transport across the mem-brane. The first two steps of the PTS are common toall sugars: Enzyme I (EI) is autophosphorylated by PEP
0968-0004/$ – see front matter .
Published by Elsevier Ltd. http://dx.doi.org/10.1016/j.tibs.2013.08.003
Corresponding author: Clore, G.M. ([email protected]).Keywords: signal transduction; protein–protein recognition; bacterial phosphotrans-ferase system; NMR spectroscopy; hybrid methods in structure determination;residual dipolar couplings; solution X-ray scattering; sparsely populated states;encounter complexes.
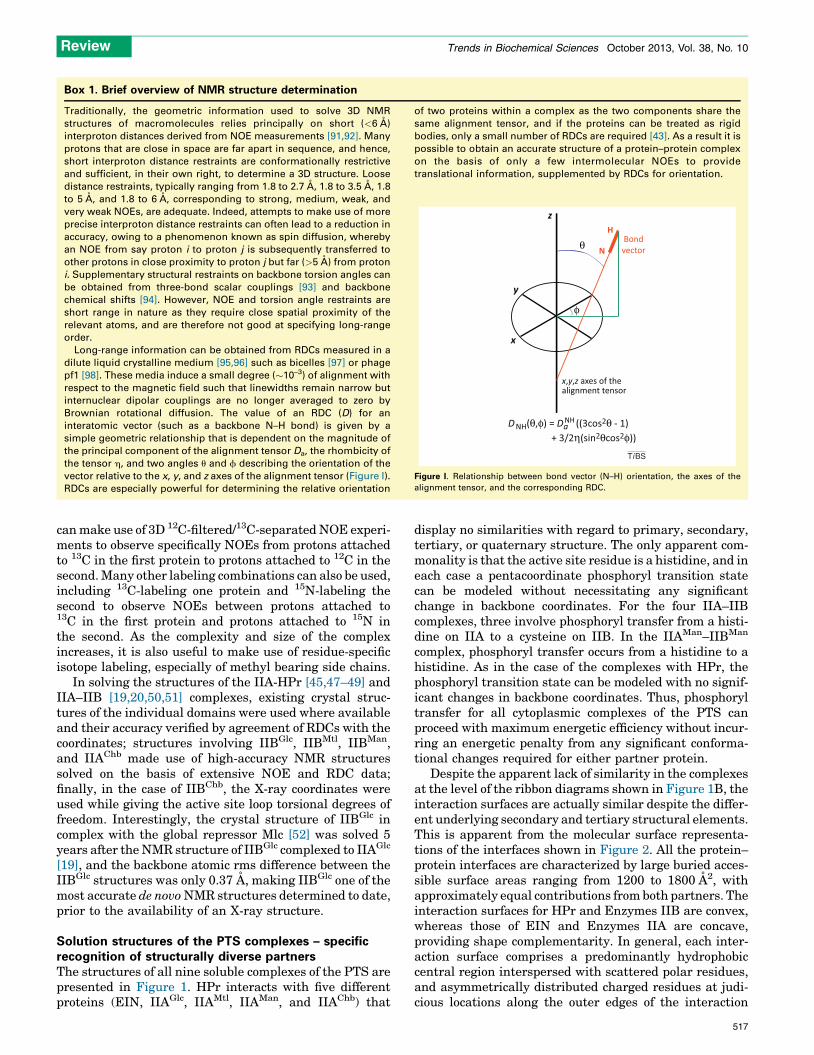
and subsequently transfers the phosphoryl group to thehistidine phosphocarrier protein HPr. HPr donates thephosphoryl group to the A component of the sugar-specificEnzymes II. There are four classes of Enzymes II: glucose(the first branch of the PTS to have been discovered in1964 [1]), mannitol, mannose, and lactose/chitobiose(Figure 1A). The organization of the sugar-specificEnzymes II is similar: there are two cytoplasmic domains,IIA and IIB, and a transmembrane domain IIC, which maybe supplemented by a fourth transmembrane domain IID.These domains may occur either as isolated proteins or becovalently joined by long linkers in a single contiguousprotein (Figure 1A). IIA accepts the phosphoryl group fromHPr and donates it to IIB; finally the transmembranedomain IIC catalyzes the coupled translocation and phos-phoryl transfer from IIB to the incoming sugar. Despite thesimilar organization of Enzymes II, the IIA domains fromthe four sugar classes bear no similarity to one another interms of sequence, or secondary, tertiary, or quaternarystructure [8–14]. The IIB domains from the mannitol[15,16] and chitobiose [17,18] branches are similar in termsof secondary and tertiary structure but have no significantsequence similarity outside of the active site loop. Theactive site loop of the IIB domain of the glucose branch[19] bears some similarities to that of the IIB domains fromthe mannitol and chitobiose branches, but displays nooverall similarity in sequence, or secondary or tertiarystructure. Lastly the IIB domain of the mannose pathway[20–22] bears no similarity at all to that of the other threebranches.
In addition to their function within the PTS cascade,components of the PTS are also involved in the regulationof many other proteins, including glycogen phosphorylase,adenylate kinase, glycerol kinase, various non-PTS per-meases, and the global repressor Mlc [3,7,23–27]. In addi-tion, under conditions of nitrogen limitation, competitiveinhibition of EI by a-ketoglutarate [28], the carbon sub-strate for ammonia assimilation, blocks sugar transferacross the cell membrane, thereby providing a direct
Trends in Biochemical Sciences, October 2013, Vol. 38, No. 10 515
Glossary
Heteronuclear NMR: NMR experiments that make use of correlations between
different types of NMR active nuclei, such as 1H, 15N, and 13C.
Multidimensional NMR: Experiments that correlate chemical shifts in several
dimensions. For example, a 2D 1H-15N correlation experiment correlates the
chemical shift of a backbone amide proton with the 15N shift of its directly
bonded nitrogen atom via the one-bond 1H-15N scalar coupling. A 2D
experiment comprises a preparation pulse, an evolution period during which
the nuclear spins are labeled according to their chemical shifts, a mixing period
during which the spins are correlated to one another (e.g., through-bond via
scalar couplings or through space via the nuclear Overhauser effect), and a
detection period. A 3D experiment that correlates chemical shifts in three
dimensions is constructed from two 2D experiments by leaving out the
detection period of the first 2D experiment and the preparation pulse of the
second 2D experiment. Similarly, extension to a 4D experiment which
correlates chemical shifts in four dimensions is constructed by combining a
3D experiment with a 2D one using exactly the same procedure.
Nuclear Overhauser effect (NOE): The NOE detects through-space interactions
between protons separated by less than 5 A and constitutes the mainstay of
traditional NMR protein structure determination.
Relaxation dispersion spectroscopy: This is a class of NMR experiment
designed to analyze exchange dynamics in the submillisecond to millisecond
time scale that is dependent upon differences in chemical shifts between the
species. The technique is capable of detecting exchange between an NMR
visible major species and a spectroscopically invisible species populated as
little as 1%. The experiment yields exchange rates, populations and the
chemical shift differences between the species.
Residual dipolar couplings (RDC): RDCs are measured by taking the difference
in scalar couplings recorded in aligned and isotropic (i.e., water) media.
Examples of aligned media are bicelles and phage. These alignment media
generate a very weak force on the protein that results in a small degree of
alignment with respect to the magnetic field. As a result dipolar couplings
between nuclei, as well as other orientation-dependent interactions, are no
longer averaged to zero through Brownian rotational diffusion. The size of the
RDC between two directly bonded nuclei is related to the orientation of the
vector connecting the two nuclei to the alignment tensor.
Solution X-ray scattering: Small (SAXS) and wide (WAXS) angle X-ray
scattering yield 1D profiles of scattering intensity as a function of the scattering
vector q (given by 4p sinu/l; where 2u is the angle between the incident beam and
the detector and l the wavelength of the X-rays) [83]. The scattering profiles are
determined by the pairwise distances between all atoms in a molecule and
therefore contain information on molecular shape and size. Because of the
convoluted nature of SAXS/WAXS it is not possible, outside of the very low q
range, to extract features of the scattering curve to a particular structure, and it is
generally not feasible to derive unique 3D structures from 1D profiles as many
models may be compatible with a particular scattering profile. However, direct
refinement against SAXS/WAXS data in combination with other experimental
restraints, such as those from NMR can be extremely powerful [40,41,88–90].
Small angle neutron scattering (SANS): The principals of SANS are the same
as those for SAXS/WAXS except neutrons instead of X-rays are used. The
values of the atomic and solvent scattering amplitudes are different for SAXS/
WAXS and SANS; therefore, the two techniques provide complementary
information so that SANS can be used to validate the results of refinement
against SAXS/WAXS. Furthermore, contrast- matched SANS on protein
complexes in 40.4% D2O in which one component is protonated and the other
deuterated enables one to selectively record SANS profiles originating from
only one component of the complex.
Review Trends in Biochemical Sciences October 2013, Vol. 38, No. 10
biochemical link between central nitrogen and carbonmetabolism in bacteria [29].
Many reviews have been written on the biology of thePTS and on the structures of individual components of thePTS [2–7]. Although crystal structures [8–13,17,21,22,30–35] have been solved for many of the cytoplasmic isolatedproteins or domains of the PTS (the remainder being solvedby NMR [14–16,18–20,36–41]), crystallization of PTS com-plexes has proved refractory. This is largely due to the factthat the complexes are transient and rather weak withequilibrium dissociation constants (Kd) ranging from mi-cro- to millimolar. Fortunately, this is not an impedimentto the structure determination of such complexes in solu-tion by NMR.
The multiplicity of protein–protein interactions inthe PTS provides a paradigm for studying the factors
516
governing specific recognition of multiple diverse targets.The current review focuses specifically on the NMR work inour laboratory, initiated in 1997 with the structure deter-mination of the N-terminal domain of EI [39], aimed atunderstanding the structural basis of specific protein–pro-tein recognition within the PTS; the fundamental biophys-ical mechanisms underlying protein–protein interactions;and the nature of large conformational rearrangements inmultidomain proteins. In terms of structural biology andbiophysics, these studies of protein–protein complexes ofthe PTS have provided a test bed for developing hybridmethods for solving the structures of large complexes andproteins in solution combining NMR and, in someinstances, solution X-ray scattering, with crystal orNMR structures of individual domains, and for developingNMR methods for detecting and characterizing sparselypopulated, transient encounter complexes formed by ran-dom collisions between partner proteins that precede theformation of the specific complex.
Solving the 3D solution structures of PTS complexesThe first structure of a PTS protein–protein complex to bedetermined was that between the N-terminal domain of EI(EIN) and HPr [42], for which the traditional approachinvolving a complete NMR structure determination of theentire complex was used (Box 1). It was rapidly realized,however, that this time-consuming approach could be bothspeeded up and rendered more accurate by making use ofthe available crystal or NMR structures of the free proteins[43]. This assumes that the backbone conformation of theproteins undergoes minimal changes upon complex forma-tion, which can be readily ascertained both from the mea-surement of residual dipolar couplings (RDCs; seeGlossary) as well as the observation of small backbonechemical shift changes upon complexation. The remainderof the PTS complexes were therefore solved by a procedureknown as conjoined rigid body/torsion angle simulatedannealing (Box 2), in which the proteins are treated asrigid bodies that are free to translate and rotate relative toone another, and interfacial side chains are given torsionaldegrees of freedom [43,44]. The driving force for thesecalculations resides in intermolecular nuclear Overhauserenhancement (NOE)-derived interproton distancerestraints combined, where possible, with RDCs to provideorientational restraints and heteronuclear scalar couplingsto derive torsion angle restraints for the interfacial sidechains. This approach does not require that the completebackbone be treated as a rigid body: if there is evidence thata region of the backbone undergoes a conformational changeupon complexation, then it is a simple matter to give thatregion torsional degrees of freedom whose conformationalspace is dictated by experimental NMR restraints (NOEsand RDCs measured on the complex) [45].
Whether one chooses to do a full NMR structure deter-mination or to make use of known structures of the freeprotein, it is essential to distinguish unambiguously inter-molecular NOEs from intramolecular NOEs within theindividual proteins. This is readily accomplished by mak-ing use of appropriate isotopic labeling of the individualproteins [46]. For example, by 13C labeling one protein andhaving the other protein at natural isotopic abundance one
Box 1. Brief overview of NMR structure determination
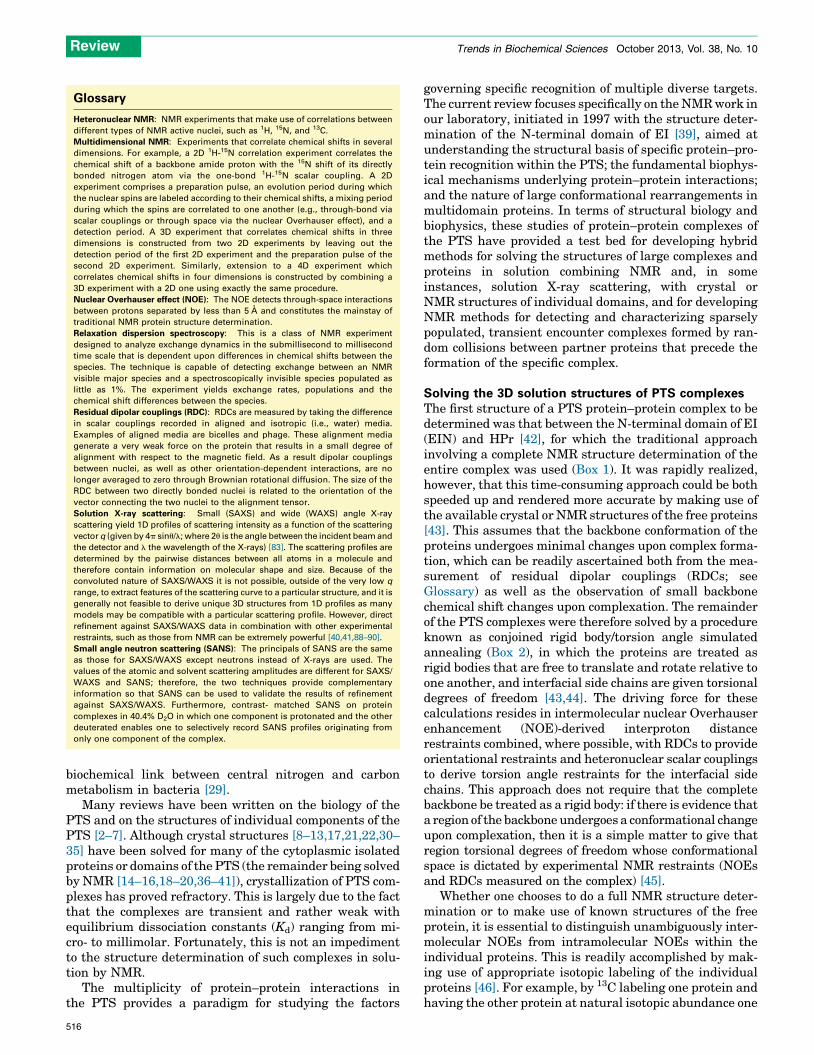
Traditionally, the geometric information used to solve 3D NMR
structures of macromolecules relies principally on short (<6 A)
interproton distances derived from NOE measurements [91,92]. Many
protons that are close in space are far apart in sequence, and hence,
short interproton distance restraints are conformationally restrictive
and sufficient, in their own right, to determine a 3D structure. Loose
distance restraints, typically ranging from 1.8 to 2.7 A, 1.8 to 3.5 A, 1.8
to 5 A, and 1.8 to 6 A, corresponding to strong, medium, weak, and
very weak NOEs, are adequate. Indeed, attempts to make use of more
precise interproton distance restraints can often lead to a reduction in
accuracy, owing to a phenomenon known as spin diffusion, whereby
an NOE from say proton i to proton j is subsequently transferred to
other protons in close proximity to proton j but far (>5 A) from proton
i. Supplementary structural restraints on backbone torsion angles can
be obtained from three-bond scalar couplings [93] and backbone
chemical shifts [94]. However, NOE and torsion angle restraints are
short range in nature as they require close spatial proximity of the
relevant atoms, and are therefore not good at specifying long-range
order.
Long-range information can be obtained from RDCs measured in a
dilute liquid crystalline medium [95,96] such as bicelles [97] or phage
pf1 [98]. These media induce a small degree (�10–3) of alignment with
respect to the magnetic field such that linewidths remain narrow but
internuclear dipolar couplings are no longer averaged to zero by
Brownian rotational diffusion. The value of an RDC (D) for an
interatomic vector (such as a backbone N–H bond) is given by a
simple geometric relationship that is dependent on the magnitude of
the principal component of the alignment tensor Da, the rhombicity of
the tensor h, and two angles u and f describing the orientation of the
vector relative to the x, y, and z axes of the alignment tensor (Figure I).
RDCs are especially powerful for determining the relative orientation
of two proteins within a complex as the two components share the
same alignment tensor, and if the proteins can be treated as rigid
bodies, only a small number of RDCs are required [43]. As a result it is
possible to obtain an accurate structure of a protein–protein complex
on the basis of only a few intermolecular NOEs to provide
translational information, supplemented by RDCs for orientation.
x
y
z
θ
φ
D NH (θ,φ) = Da ((3cos2θ - 1) + 3/2η(sin2θcos2φ))
NH
N
HBondvector
x,y,z axes of thealignment tensor
TiBS
Figure I. Relationship between bond vector (N–H) orientation, the axes of the
alignment tensor, and the corresponding RDC.
Review Trends in Biochemical Sciences October 2013, Vol. 38, No. 10
can make use of 3D 12C-filtered/13C-separated NOE experi-ments to observe specifically NOEs from protons attachedto 13C in the first protein to protons attached to 12C in thesecond. Many other labeling combinations can also be used,including 13C-labeling one protein and 15N-labeling thesecond to observe NOEs between protons attached to13C in the first protein and protons attached to 15N inthe second. As the complexity and size of the complexincreases, it is also useful to make use of residue-specificisotope labeling, especially of methyl bearing side chains.
In solving the structures of the IIA-HPr [45,47–49] andIIA–IIB [19,20,50,51] complexes, existing crystal struc-tures of the individual domains were used where availableand their accuracy verified by agreement of RDCs with thecoordinates; structures involving IIBGlc, IIBMtl, IIBMan,and IIAChb made use of high-accuracy NMR structuressolved on the basis of extensive NOE and RDC data;finally, in the case of IIBChb, the X-ray coordinates wereused while giving the active site loop torsional degrees offreedom. Interestingly, the crystal structure of IIBGlc incomplex with the global repressor Mlc [52] was solved 5years after the NMR structure of IIBGlc complexed to IIAGlc
[19], and the backbone atomic rms difference between theIIBGlc structures was only 0.37 A, making IIBGlc one of themost accurate de novo NMR structures determined to date,prior to the availability of an X-ray structure.
Solution structures of the PTS complexes – specificrecognition of structurally diverse partnersThe structures of all nine soluble complexes of the PTS arepresented in Figure 1. HPr interacts with five differentproteins (EIN, IIAGlc, IIAMtl, IIAMan, and IIAChb) that
display no similarities with regard to primary, secondary,tertiary, or quaternary structure. The only apparent com-monality is that the active site residue is a histidine, and ineach case a pentacoordinate phosphoryl transition statecan be modeled without necessitating any significantchange in backbone coordinates. For the four IIA–IIBcomplexes, three involve phosphoryl transfer from a histi-dine on IIA to a cysteine on IIB. In the IIAMan–IIBMan
complex, phosphoryl transfer occurs from a histidine to ahistidine. As in the case of the complexes with HPr, thephosphoryl transition state can be modeled with no signif-icant changes in backbone coordinates. Thus, phosphoryltransfer for all cytoplasmic complexes of the PTS canproceed with maximum energetic efficiency without incur-ring an energetic penalty from any significant conforma-tional changes required for either partner protein.
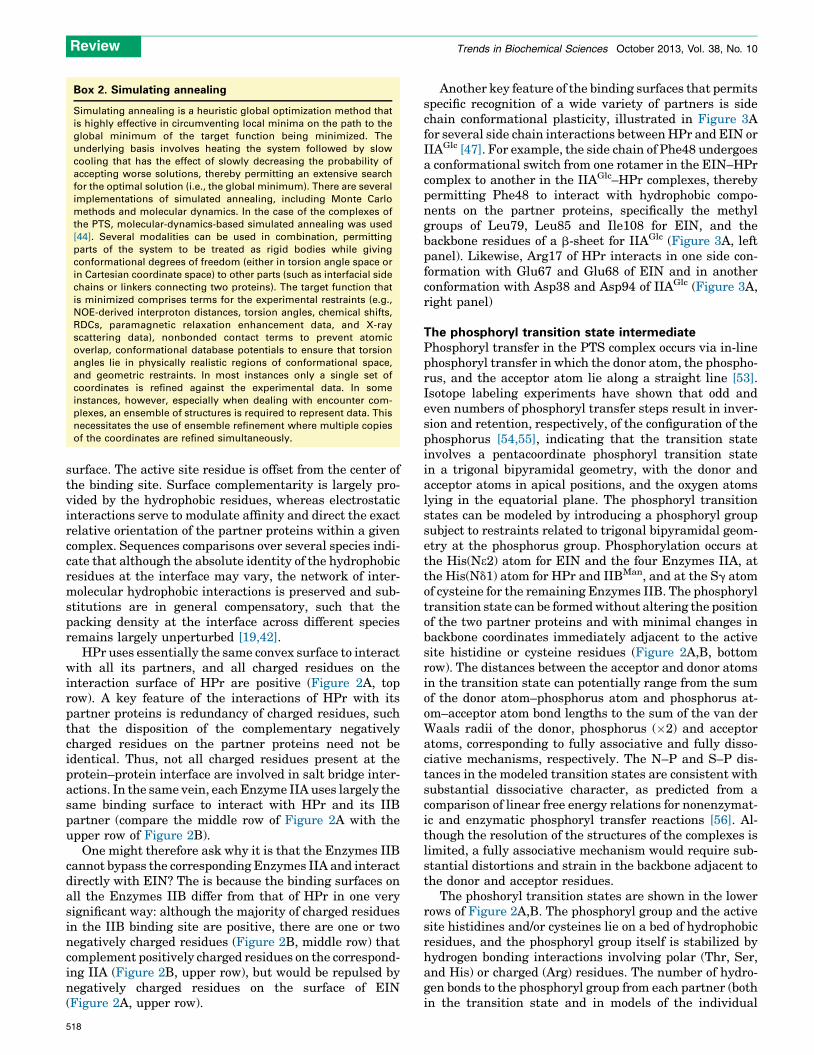
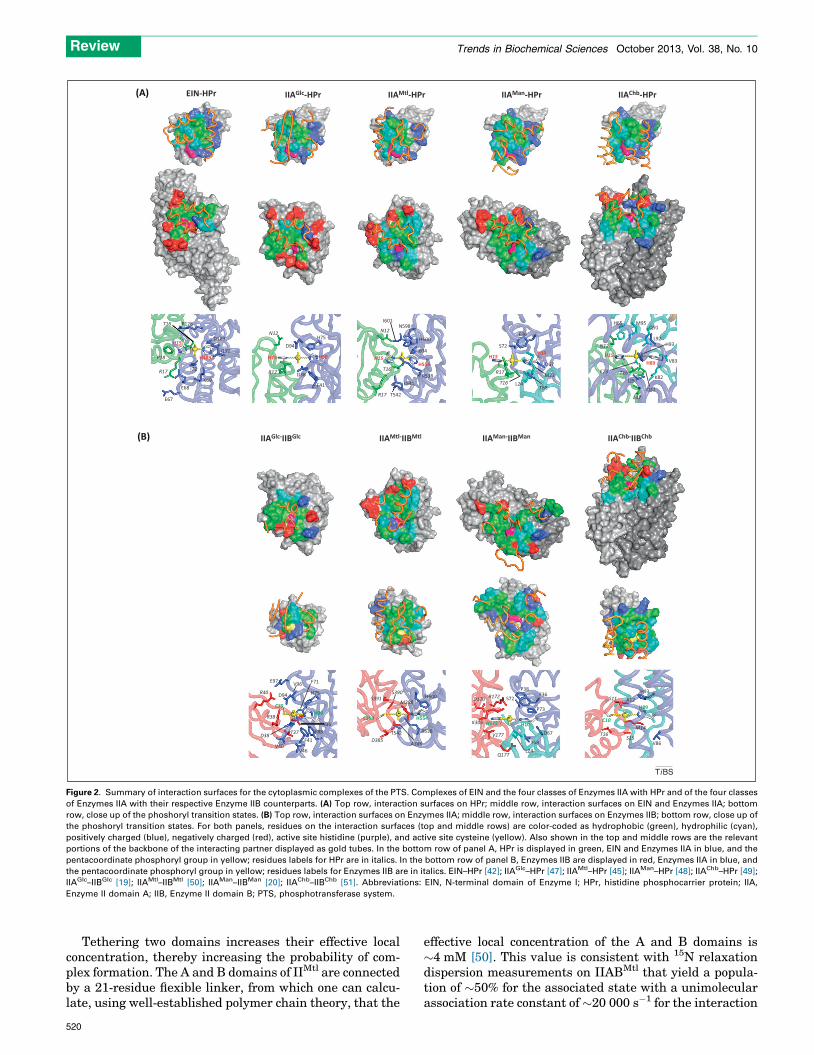
Despite the apparent lack of similarity in the complexesat the level of the ribbon diagrams shown in Figure 1B, theinteraction surfaces are actually similar despite the differ-ent underlying secondary and tertiary structural elements.This is apparent from the molecular surface representa-tions of the interfaces shown in Figure 2. All the protein–protein interfaces are characterized by large buried acces-sible surface areas ranging from 1200 to 1800 A2, withapproximately equal contributions from both partners. Theinteraction surfaces for HPr and Enzymes IIB are convex,whereas those of EIN and Enzymes IIA are concave,providing shape complementarity. In general, each inter-action surface comprises a predominantly hydrophobiccentral region interspersed with scattered polar residues,and asymmetrically distributed charged residues at judi-cious locations along the outer edges of the interaction
517
Box 2. Simulating annealing
Simulating annealing is a heuristic global optimization method that
is highly effective in circumventing local minima on the path to the
global minimum of the target function being minimized. The
underlying basis involves heating the system followed by slow
cooling that has the effect of slowly decreasing the probability of
accepting worse solutions, thereby permitting an extensive search
for the optimal solution (i.e., the global minimum). There are several
implementations of simulated annealing, including Monte Carlo
methods and molecular dynamics. In the case of the complexes of
the PTS, molecular-dynamics-based simulated annealing was used
[44]. Several modalities can be used in combination, permitting
parts of the system to be treated as rigid bodies while giving
conformational degrees of freedom (either in torsion angle space or
in Cartesian coordinate space) to other parts (such as interfacial side
chains or linkers connecting two proteins). The target function that
is minimized comprises terms for the experimental restraints (e.g.,
NOE-derived interproton distances, torsion angles, chemical shifts,
RDCs, paramagnetic relaxation enhancement data, and X-ray
scattering data), nonbonded contact terms to prevent atomic
overlap, conformational database potentials to ensure that torsion
angles lie in physically realistic regions of conformational space,
and geometric restraints. In most instances only a single set of
coordinates is refined against the experimental data. In some
instances, however, especially when dealing with encounter com-
plexes, an ensemble of structures is required to represent data. This
necessitates the use of ensemble refinement where multiple copies
of the coordinates are refined simultaneously.
Review Trends in Biochemical Sciences October 2013, Vol. 38, No. 10
surface. The active site residue is offset from the center ofthe binding site. Surface complementarity is largely pro-vided by the hydrophobic residues, whereas electrostaticinteractions serve to modulate affinity and direct the exactrelative orientation of the partner proteins within a givencomplex. Sequences comparisons over several species indi-cate that although the absolute identity of the hydrophobicresidues at the interface may vary, the network of inter-molecular hydrophobic interactions is preserved and sub-stitutions are in general compensatory, such that thepacking density at the interface across different speciesremains largely unperturbed [19,42].
HPr uses essentially the same convex surface to interactwith all its partners, and all charged residues on theinteraction surface of HPr are positive (Figure 2A, toprow). A key feature of the interactions of HPr with itspartner proteins is redundancy of charged residues, suchthat the disposition of the complementary negativelycharged residues on the partner proteins need not beidentical. Thus, not all charged residues present at theprotein–protein interface are involved in salt bridge inter-actions. In the same vein, each Enzyme IIA uses largely thesame binding surface to interact with HPr and its IIBpartner (compare the middle row of Figure 2A with theupper row of Figure 2B).
One might therefore ask why it is that the Enzymes IIBcannot bypass the corresponding Enzymes IIA and interactdirectly with EIN? The is because the binding surfaces onall the Enzymes IIB differ from that of HPr in one verysignificant way: although the majority of charged residuesin the IIB binding site are positive, there are one or twonegatively charged residues (Figure 2B, middle row) thatcomplement positively charged residues on the correspond-ing IIA (Figure 2B, upper row), but would be repulsed bynegatively charged residues on the surface of EIN(Figure 2A, upper row).
518
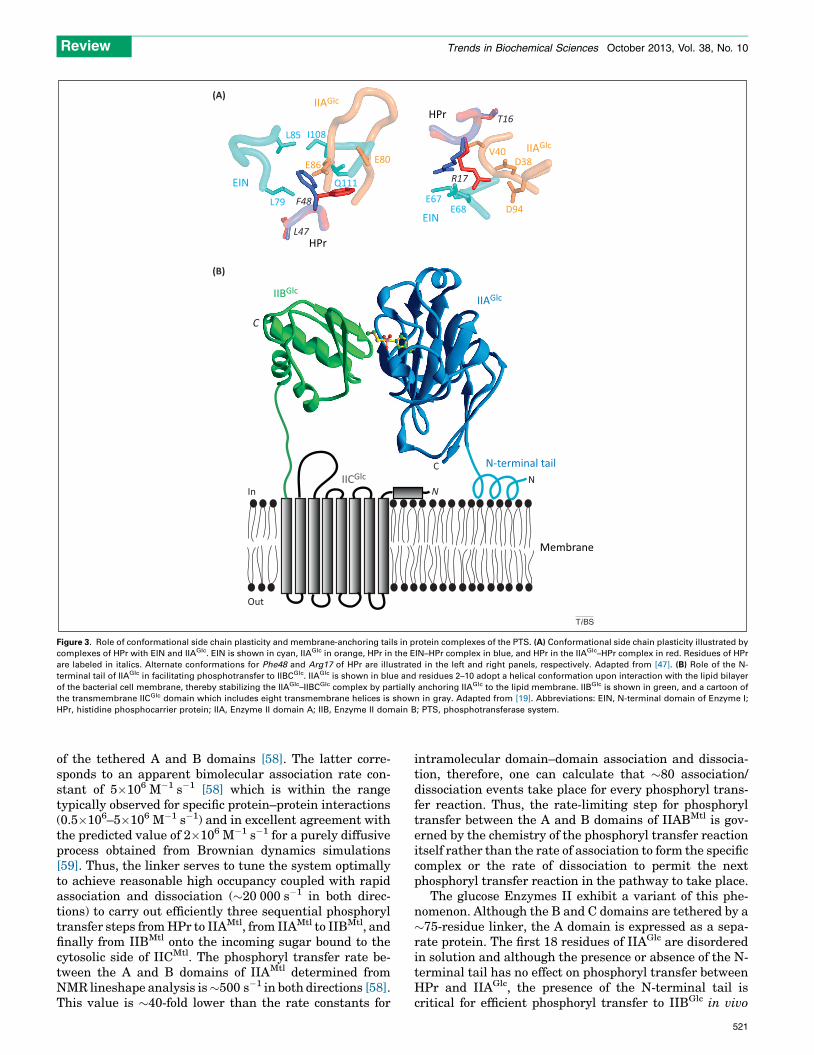
Another key feature of the binding surfaces that permitsspecific recognition of a wide variety of partners is sidechain conformational plasticity, illustrated in Figure 3Afor several side chain interactions between HPr and EIN orIIAGlc [47]. For example, the side chain of Phe48 undergoesa conformational switch from one rotamer in the EIN–HPrcomplex to another in the IIAGlc–HPr complexes, therebypermitting Phe48 to interact with hydrophobic compo-nents on the partner proteins, specifically the methylgroups of Leu79, Leu85 and Ile108 for EIN, and thebackbone residues of a b-sheet for IIAGlc (Figure 3A, leftpanel). Likewise, Arg17 of HPr interacts in one side con-formation with Glu67 and Glu68 of EIN and in anotherconformation with Asp38 and Asp94 of IIAGlc (Figure 3A,right panel)
The phosphoryl transition state intermediatePhosphoryl transfer in the PTS complex occurs via in-linephosphoryl transfer in which the donor atom, the phospho-rus, and the acceptor atom lie along a straight line [53].Isotope labeling experiments have shown that odd andeven numbers of phosphoryl transfer steps result in inver-sion and retention, respectively, of the configuration of thephosphorus [54,55], indicating that the transition stateinvolves a pentacoordinate phosphoryl transition statein a trigonal bipyramidal geometry, with the donor andacceptor atoms in apical positions, and the oxygen atomslying in the equatorial plane. The phosphoryl transitionstates can be modeled by introducing a phosphoryl groupsubject to restraints related to trigonal bipyramidal geom-etry at the phosphorus group. Phosphorylation occurs atthe His(Ne2) atom for EIN and the four Enzymes IIA, atthe His(Nd1) atom for HPr and IIBMan, and at the Sg atomof cysteine for the remaining Enzymes IIB. The phosphoryltransition state can be formed without altering the positionof the two partner proteins and with minimal changes inbackbone coordinates immediately adjacent to the activesite histidine or cysteine residues (Figure 2A,B, bottomrow). The distances between the acceptor and donor atomsin the transition state can potentially range from the sumof the donor atom–phosphorus atom and phosphorus at-om–acceptor atom bond lengths to the sum of the van derWaals radii of the donor, phosphorus (�2) and acceptoratoms, corresponding to fully associative and fully disso-ciative mechanisms, respectively. The N–P and S–P dis-tances in the modeled transition states are consistent withsubstantial dissociative character, as predicted from acomparison of linear free energy relations for nonenzymat-ic and enzymatic phosphoryl transfer reactions [56]. Al-though the resolution of the structures of the complexes islimited, a fully associative mechanism would require sub-stantial distortions and strain in the backbone adjacent tothe donor and acceptor residues.
The phoshoryl transition states are shown in the lowerrows of Figure 2A,B. The phosphoryl group and the activesite histidines and/or cysteines lie on a bed of hydrophobicresidues, and the phosphoryl group itself is stabilized byhydrogen bonding interactions involving polar (Thr, Ser,and His) or charged (Arg) residues. The number of hydro-gen bonds to the phosphoryl group from each partner (bothin the transition state and in models of the individual
Phosphoenol-pyruvate (PEP)
Pyruvate
EI
P-EI
P-HPr
HPr
IIAGlc IIBGlc IICGlc
IIAMtl
IIAMan
IIAChb
IICMtl
IICChb
IIBMtl
IICMan
IIDManIIBMan
IIBChb
P P
P P
P P
P P
Glucose
Glucose-6-phosphate
Mannitol
Mannose
Lactose/chitobiose
Mannitol-1-phosphate
Mannose-6-phosphate
Lactose-6-phosphate
EIN-HPr
IIAGlc-HPr
IIAGlc -IIBGlc
IIAMtl-HPr
IIAMtl-IIBMtl
IIAMan-HPr
IIAMan-IIBMan
IIAChb-HPr
IIAChb-IIBChb
Glucose branch Mannitol branch Mannose branch Lactose/chitobiose branch
(A)
(B)
TiBS
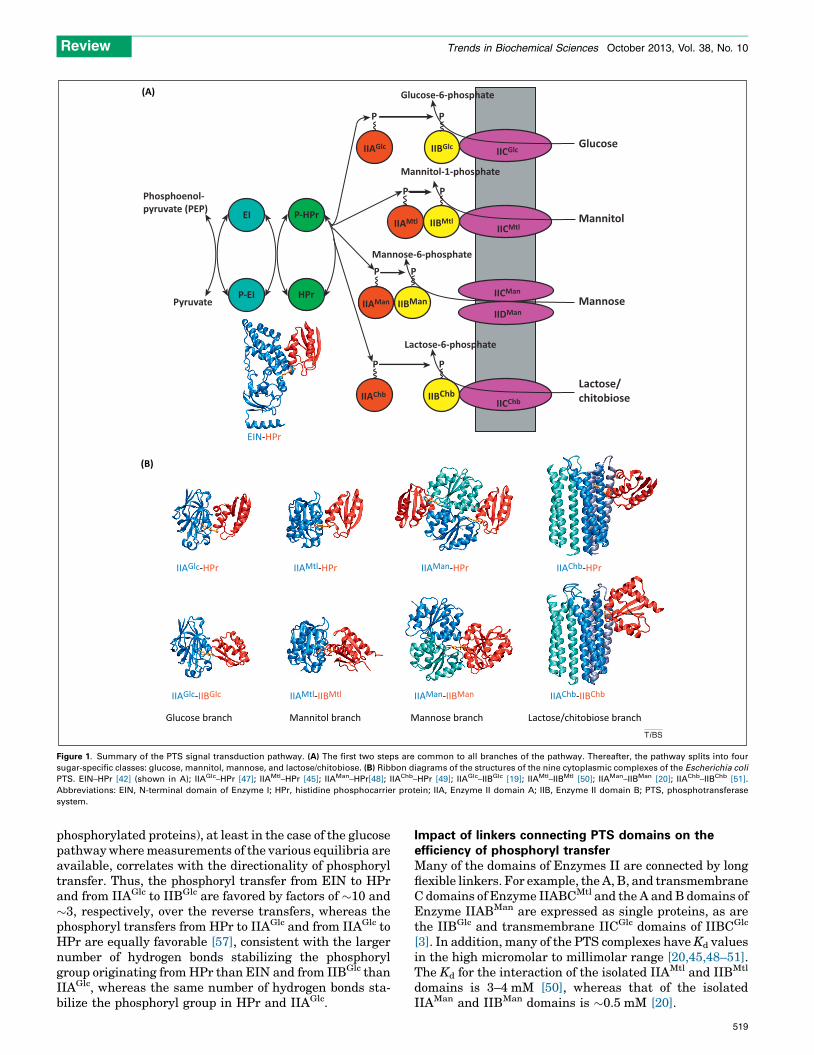
Figure 1. Summary of the PTS signal transduction pathway. (A) The first two steps are common to all branches of the pathway. Thereafter, the pathway splits into four
sugar-specific classes: glucose, mannitol, mannose, and lactose/chitobiose. (B) Ribbon diagrams of the structures of the nine cytoplasmic complexes of the Escherichia coli
PTS. EIN–HPr [42] (shown in A); IIAGlc–HPr [47]; IIAMtl–HPr [45]; IIAMan–HPr[48]; IIAChb–HPr [49]; IIAGlc–IIBGlc [19]; IIAMtl–IIBMtl [50]; IIAMan–IIBMan [20]; IIAChb–IIBChb [51].
Abbreviations: EIN, N-terminal domain of Enzyme I; HPr, histidine phosphocarrier protein; IIA, Enzyme II domain A; IIB, Enzyme II domain B; PTS, phosphotransferase
system.
Review Trends in Biochemical Sciences October 2013, Vol. 38, No. 10
phosphorylated proteins), at least in the case of the glucosepathway where measurements of the various equilibria areavailable, correlates with the directionality of phosphoryltransfer. Thus, the phosphoryl transfer from EIN to HPrand from IIAGlc to IIBGlc are favored by factors of �10 and�3, respectively, over the reverse transfers, whereas thephosphoryl transfers from HPr to IIAGlc and from IIAGlc toHPr are equally favorable [57], consistent with the largernumber of hydrogen bonds stabilizing the phosphorylgroup originating from HPr than EIN and from IIBGlc thanIIAGlc, whereas the same number of hydrogen bonds sta-bilize the phosphoryl group in HPr and IIAGlc.
Impact of linkers connecting PTS domains on theefficiency of phosphoryl transferMany of the domains of Enzymes II are connected by longflexible linkers. For example, the A, B, and transmembraneC domains of Enzyme IIABCMtl and the A and B domains ofEnzyme IIABMan are expressed as single proteins, as arethe IIBGlc and transmembrane IICGlc domains of IIBCGlc
[3]. In addition, many of the PTS complexes have Kd valuesin the high micromolar to millimolar range [20,45,48–51].The Kd for the interaction of the isolated IIAMtl and IIBMtl
domains is 3–4 mM [50], whereas that of the isolatedIIAMan and IIBMan domains is �0.5 mM [20].
519
H189
H15
H15H10
R126
R17
P18
E67
E68K69
I72
I192
D129
R17
T16
T16 L24
M23
T68
D67
F36
S72
H15H554
R17
N12
T16
T542
L541R538
N598I601
I604
H600
H15H89
L47Q51
T16
N12
I25
L92H93
K82
V83
H65 M95Q91
E73
H15 H90
N12
R17 D38
F41
D94H75
EIN-HPr IIAMtl-HPr IIAMan-HPrIIAGlc-HPr IIAChb-HPr
IIAMan- IIBManIIAMtl-IIBMtl IIAChb- IIBChbIIAGlc-IIBGlc
H175 H10
Q177
V177
K305
D170 R172P38
F36
P73
S72
D67
T68L24
C384 H554
D385
S390
A386
S391M388
T542 R538
H600
C10
H89C35H90
V86
H93
S15T16
M14
S11 A12
V40V46
F41F88
D38
H75
F71
D94
V96E97
T37
R38
R40
I36
(A)
(B)
TiBS
Figure 2. Summary of interaction surfaces for the cytoplasmic complexes of the PTS. Complexes of EIN and the four classes of Enzymes IIA with HPr and of the four classes
of Enzymes IIA with their respective Enzyme IIB counterparts. (A) Top row, interaction surfaces on HPr; middle row, interaction surfaces on EIN and Enzymes IIA; bottom
row, close up of the phoshoryl transition states. (B) Top row, interaction surfaces on Enzymes IIA; middle row, interaction surfaces on Enzymes IIB; bottom row, close up of
the phoshoryl transition states. For both panels, residues on the interaction surfaces (top and middle rows) are color-coded as hydrophobic (green), hydrophilic (cyan),
positively charged (blue), negatively charged (red), active site histidine (purple), and active site cysteine (yellow). Also shown in the top and middle rows are the relevant
portions of the backbone of the interacting partner displayed as gold tubes. In the bottom row of panel A, HPr is displayed in green, EIN and Enzymes IIA in blue, and the
pentacoordinate phosphoryl group in yellow; residues labels for HPr are in italics. In the bottom row of panel B, Enzymes IIB are displayed in red, Enzymes IIA in blue, and
the pentacoordinate phosphoryl group in yellow; residues labels for Enzymes IIB are in italics. EIN–HPr [42]; IIAGlc–HPr [47]; IIAMtl–HPr [45]; IIAMan–HPr [48]; IIAChb–HPr [49];
IIAGlc–IIBGlc [19]; IIAMtl–IIBMtl [50]; IIAMan–IIBMan [20]; IIAChb–IIBChb [51]. Abbreviations: EIN, N-terminal domain of Enzyme I; HPr, histidine phosphocarrier protein; IIA,
Enzyme II domain A; IIB, Enzyme II domain B; PTS, phosphotransferase system.
Review Trends in Biochemical Sciences October 2013, Vol. 38, No. 10
Tethering two domains increases their effective localconcentration, thereby increasing the probability of com-plex formation. The A and B domains of IIMtl are connectedby a 21-residue flexible linker, from which one can calcu-late, using well-established polymer chain theory, that the
520
effective local concentration of the A and B domains is�4 mM [50]. This value is consistent with 15N relaxationdispersion measurements on IIABMtl that yield a popula-tion of �50% for the associated state with a unimolecularassociation rate constant of �20 000 s�1 for the interaction
F48L79
L85 I108
Q111
E86 E80
R17
T16
E67E68 D94
D38V40
L47
(A)
(B)
N
Out
In
C
C
N
IIBGlcIIAGlc
N-terminal tailIICGlc
Membrane
HPr
IIAGlc
EIN
HPr
IIAGlc
EIN
TiBS
Figure 3. Role of conformational side chain plasticity and membrane-anchoring tails in protein complexes of the PTS. (A) Conformational side chain plasticity illustrated by
complexes of HPr with EIN and IIAGlc. EIN is shown in cyan, IIAGlc in orange, HPr in the EIN–HPr complex in blue, and HPr in the IIAGlc–HPr complex in red. Residues of HPr
are labeled in italics. Alternate conformations for Phe48 and Arg17 of HPr are illustrated in the left and right panels, respectively. Adapted from [47]. (B) Role of the N-
terminal tail of IIAGlc in facilitating phosphotransfer to IIBCGlc. IIAGlc is shown in blue and residues 2–10 adopt a helical conformation upon interaction with the lipid bilayer
of the bacterial cell membrane, thereby stabilizing the IIAGlc–IIBCGlc complex by partially anchoring IIAGlc to the lipid membrane. IIBGlc is shown in green, and a cartoon of
the transmembrane IICGlc domain which includes eight transmembrane helices is shown in gray. Adapted from [19]. Abbreviations: EIN, N-terminal domain of Enzyme I;
HPr, histidine phosphocarrier protein; IIA, Enzyme II domain A; IIB, Enzyme II domain B; PTS, phosphotransferase system.
Review Trends in Biochemical Sciences October 2013, Vol. 38, No. 10
of the tethered A and B domains [58]. The latter corre-sponds to an apparent bimolecular association rate con-stant of 5�106 M�1 s�1 [58] which is within the rangetypically observed for specific protein–protein interactions(0.5�106–5�106 M�1 s�1) and in excellent agreement withthe predicted value of 2�106 M�1 s�1 for a purely diffusiveprocess obtained from Brownian dynamics simulations[59]. Thus, the linker serves to tune the system optimallyto achieve reasonable high occupancy coupled with rapidassociation and dissociation (�20 000 s�1 in both direc-tions) to carry out efficiently three sequential phosphoryltransfer steps from HPr to IIAMtl, from IIAMtl to IIBMtl, andfinally from IIBMtl onto the incoming sugar bound to thecytosolic side of IICMtl. The phosphoryl transfer rate be-tween the A and B domains of IIAMtl determined fromNMR lineshape analysis is �500 s�1 in both directions [58].This value is �40-fold lower than the rate constants for
intramolecular domain–domain association and dissocia-tion, therefore, one can calculate that �80 association/dissociation events take place for every phosphoryl trans-fer reaction. Thus, the rate-limiting step for phosphoryltransfer between the A and B domains of IIABMtl is gov-erned by the chemistry of the phosphoryl transfer reactionitself rather than the rate of association to form the specificcomplex or the rate of dissociation to permit the nextphosphoryl transfer reaction in the pathway to take place.
The glucose Enzymes II exhibit a variant of this phe-nomenon. Although the B and C domains are tethered by a�75-residue linker, the A domain is expressed as a sepa-rate protein. The first 18 residues of IIAGlc are disorderedin solution and although the presence or absence of the N-terminal tail has no effect on phosphoryl transfer betweenHPr and IIAGlc, the presence of the N-terminal tail iscritical for efficient phosphoryl transfer to IIBGlc in vivo
521
Review Trends in Biochemical Sciences October 2013, Vol. 38, No. 10
[60,61]. It turns out that residues 2–10 of the N-terminaltail of IIAGlc associate with Escherichia coli membranes toform an amphiphatic helix [62], thereby bringing IIAGlc inclose proximity to IIBGlc and stabilizing the IIAGlc–IIBGlc
interaction by effectively increasing the local concentrationof IIAGlc and IIBCGlc (Figure 3B).
Solution structure of intact EI and its complex with HPr– approaches to solving structures of larger (>100 kDa)complexes in solutionThe N-terminal domain (EIN) of EI can transfer a phos-phoryl group to and accept a phosphoryl group from HPrbut cannot be autophosphorylated by PEP [63–66]. Autop-hosphorylation of EI requires the presence of the C-termi-nal dimerization domain EIC. Intact EI is a 128-kDa dimerand therefore large by NMR standards. The probability ofsuccessfully solving a structure of this size using conven-tional NMR methodology is small, and even if it could bedone, the coordinate accuracy would be low. To solve thesolution structure efficiently and accurately of such asystem therefore requires the development of hybrid meth-odology that makes use of prior available structural infor-mation combined with limited solution RDC and small(SAXS) and wide (WAXS) angle X-ray scattering [40].
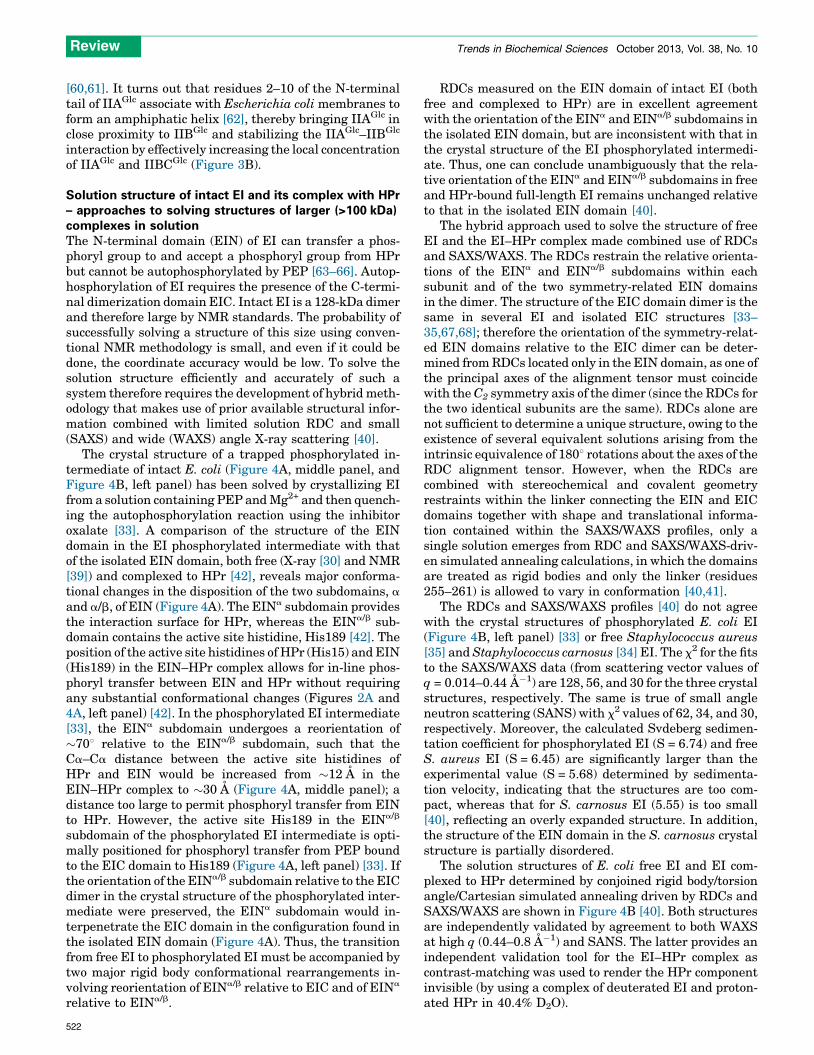
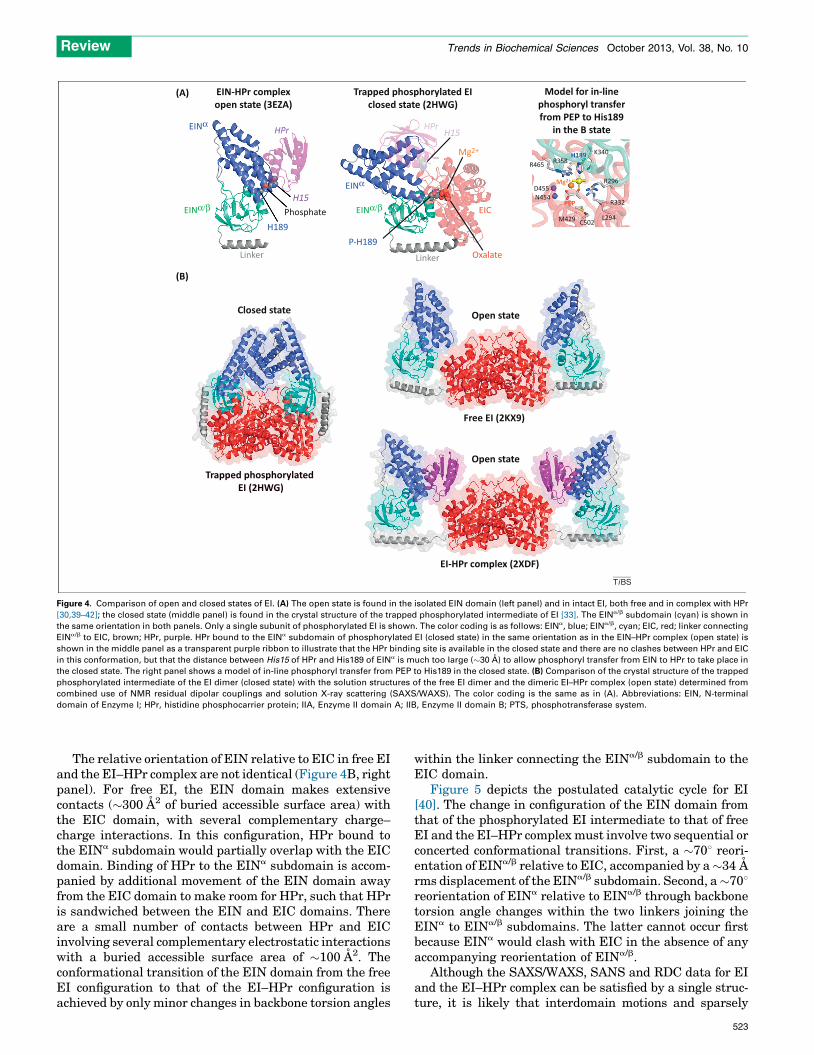
The crystal structure of a trapped phosphorylated in-termediate of intact E. coli (Figure 4A, middle panel, andFigure 4B, left panel) has been solved by crystallizing EIfrom a solution containing PEP and Mg2+ and then quench-ing the autophosphorylation reaction using the inhibitoroxalate [33]. A comparison of the structure of the EINdomain in the EI phosphorylated intermediate with thatof the isolated EIN domain, both free (X-ray [30] and NMR[39]) and complexed to HPr [42], reveals major conforma-tional changes in the disposition of the two subdomains, a
and a/b, of EIN (Figure 4A). The EINa subdomain providesthe interaction surface for HPr, whereas the EINa/b sub-domain contains the active site histidine, His189 [42]. Theposition of the active site histidines of HPr (His15) and EIN(His189) in the EIN–HPr complex allows for in-line phos-phoryl transfer between EIN and HPr without requiringany substantial conformational changes (Figures 2A and4A, left panel) [42]. In the phosphorylated EI intermediate[33], the EINa subdomain undergoes a reorientation of�708 relative to the EINa/b subdomain, such that theCa–Ca distance between the active site histidines ofHPr and EIN would be increased from �12 A in theEIN–HPr complex to �30 A (Figure 4A, middle panel); adistance too large to permit phosphoryl transfer from EINto HPr. However, the active site His189 in the EINa/b
subdomain of the phosphorylated EI intermediate is opti-mally positioned for phosphoryl transfer from PEP boundto the EIC domain to His189 (Figure 4A, left panel) [33]. Ifthe orientation of the EINa/b subdomain relative to the EICdimer in the crystal structure of the phosphorylated inter-mediate were preserved, the EINa subdomain would in-terpenetrate the EIC domain in the configuration found inthe isolated EIN domain (Figure 4A). Thus, the transitionfrom free EI to phosphorylated EI must be accompanied bytwo major rigid body conformational rearrangements in-volving reorientation of EINa/b relative to EIC and of EINa
relative to EINa/b.
522
RDCs measured on the EIN domain of intact EI (bothfree and complexed to HPr) are in excellent agreementwith the orientation of the EINa and EINa/b subdomains inthe isolated EIN domain, but are inconsistent with that inthe crystal structure of the EI phosphorylated intermedi-ate. Thus, one can conclude unambiguously that the rela-tive orientation of the EINa and EINa/b subdomains in freeand HPr-bound full-length EI remains unchanged relativeto that in the isolated EIN domain [40].
The hybrid approach used to solve the structure of freeEI and the EI–HPr complex made combined use of RDCsand SAXS/WAXS. The RDCs restrain the relative orienta-tions of the EINa and EINa/b subdomains within eachsubunit and of the two symmetry-related EIN domainsin the dimer. The structure of the EIC domain dimer is thesame in several EI and isolated EIC structures [33–35,67,68]; therefore the orientation of the symmetry-relat-ed EIN domains relative to the EIC dimer can be deter-mined from RDCs located only in the EIN domain, as one ofthe principal axes of the alignment tensor must coincidewith the C2 symmetry axis of the dimer (since the RDCs forthe two identical subunits are the same). RDCs alone arenot sufficient to determine a unique structure, owing to theexistence of several equivalent solutions arising from theintrinsic equivalence of 1808 rotations about the axes of theRDC alignment tensor. However, when the RDCs arecombined with stereochemical and covalent geometryrestraints within the linker connecting the EIN and EICdomains together with shape and translational informa-tion contained within the SAXS/WAXS profiles, only asingle solution emerges from RDC and SAXS/WAXS-driv-en simulated annealing calculations, in which the domainsare treated as rigid bodies and only the linker (residues255–261) is allowed to vary in conformation [40,41].
The RDCs and SAXS/WAXS profiles [40] do not agreewith the crystal structures of phosphorylated E. coli EI(Figure 4B, left panel) [33] or free Staphylococcus aureus[35] and Staphylococcus carnosus [34] EI. The x2 for the fitsto the SAXS/WAXS data (from scattering vector values ofq = 0.014–0.44 A�1) are 128, 56, and 30 for the three crystalstructures, respectively. The same is true of small angleneutron scattering (SANS) with x2 values of 62, 34, and 30,respectively. Moreover, the calculated Svdeberg sedimen-tation coefficient for phosphorylated EI (S = 6.74) and freeS. aureus EI (S = 6.45) are significantly larger than theexperimental value (S = 5.68) determined by sedimenta-tion velocity, indicating that the structures are too com-pact, whereas that for S. carnosus EI (5.55) is too small[40], reflecting an overly expanded structure. In addition,the structure of the EIN domain in the S. carnosus crystalstructure is partially disordered.
The solution structures of E. coli free EI and EI com-plexed to HPr determined by conjoined rigid body/torsionangle/Cartesian simulated annealing driven by RDCs andSAXS/WAXS are shown in Figure 4B [40]. Both structuresare independently validated by agreement to both WAXSat high q (0.44–0.8 A�1) and SANS. The latter provides anindependent validation tool for the EI–HPr complex ascontrast-matching was used to render the HPr componentinvisible (by using a complex of deuterated EI and proton-ated HPr in 40.4% D2O).
Trapped phosphorylated EI (2HWG)
(B)
Free EI (2KX9)
EI-HPr complex (2XDF)
P-H189Oxalate
Mg2+
H15
H15
H189Phosphate
EIN-HPr complexopen state (3EZA)
Trapped phosphorylated EI closed state (2HWG)
(A)
PEP
Mg2+D455N454
R358
M429 C502L294
R296
R332
K340
R465H189
Model for in-linephosphoryl transferfrom PEP to His189
in the B state
Open state
Open state
Closed state
EINα
EINα/β
HPr
Linker
EINα
EINα/β
HPr
Linker
EIC
TiBS
Figure 4. Comparison of open and closed states of EI. (A) The open state is found in the isolated EIN domain (left panel) and in intact EI, both free and in complex with HPr
[30,39–42]; the closed state (middle panel) is found in the crystal structure of the trapped phosphorylated intermediate of EI [33]. The EINa/b subdomain (cyan) is shown in
the same orientation in both panels. Only a single subunit of phosphorylated EI is shown. The color coding is as follows: EINa, blue; EINa/b, cyan; EIC, red; linker connecting
EINa/b to EIC, brown; HPr, purple. HPr bound to the EINa subdomain of phosphorylated EI (closed state) in the same orientation as in the EIN–HPr complex (open state) is
shown in the middle panel as a transparent purple ribbon to illustrate that the HPr binding site is available in the closed state and there are no clashes between HPr and EIC
in this conformation, but that the distance between His15 of HPr and His189 of EINa is much too large (�30 A) to allow phosphoryl transfer from EIN to HPr to take place in
the closed state. The right panel shows a model of in-line phosphoryl transfer from PEP to His189 in the closed state. (B) Comparison of the crystal structure of the trapped
phosphorylated intermediate of the EI dimer (closed state) with the solution structures of the free EI dimer and the dimeric EI–HPr complex (open state) determined from
combined use of NMR residual dipolar couplings and solution X-ray scattering (SAXS/WAXS). The color coding is the same as in (A). Abbreviations: EIN, N-terminal
domain of Enzyme I; HPr, histidine phosphocarrier protein; IIA, Enzyme II domain A; IIB, Enzyme II domain B; PTS, phosphotransferase system.
Review Trends in Biochemical Sciences October 2013, Vol. 38, No. 10
The relative orientation of EIN relative to EIC in free EIand the EI–HPr complex are not identical (Figure 4B, rightpanel). For free EI, the EIN domain makes extensivecontacts (�300 A2 of buried accessible surface area) withthe EIC domain, with several complementary charge–charge interactions. In this configuration, HPr bound tothe EINa subdomain would partially overlap with the EICdomain. Binding of HPr to the EINa subdomain is accom-panied by additional movement of the EIN domain awayfrom the EIC domain to make room for HPr, such that HPris sandwiched between the EIN and EIC domains. Thereare a small number of contacts between HPr and EICinvolving several complementary electrostatic interactionswith a buried accessible surface area of �100 A2. Theconformational transition of the EIN domain from the freeEI configuration to that of the EI–HPr configuration isachieved by only minor changes in backbone torsion angles
within the linker connecting the EINa/b subdomain to theEIC domain.
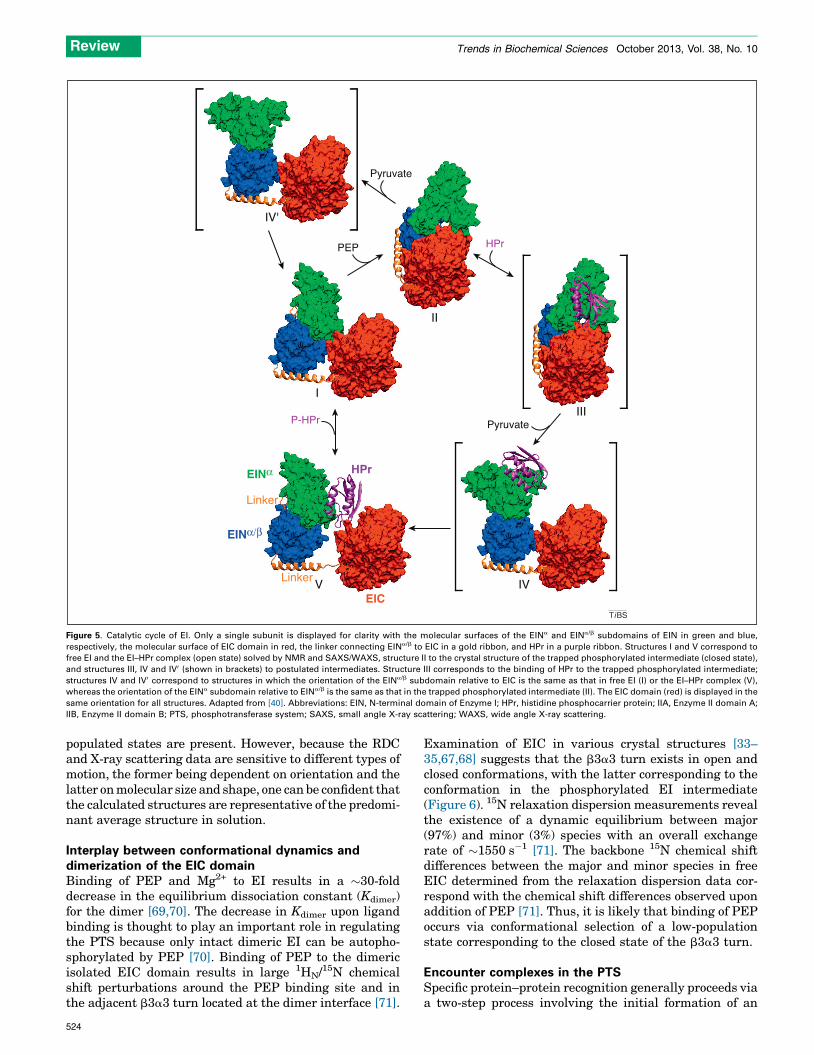
Figure 5 depicts the postulated catalytic cycle for EI[40]. The change in configuration of the EIN domain fromthat of the phosphorylated EI intermediate to that of freeEI and the EI–HPr complex must involve two sequential orconcerted conformational transitions. First, a �708 reori-entation of EINa/b relative to EIC, accompanied by a �34 Arms displacement of the EINa/b subdomain. Second, a �708reorientation of EINa relative to EINa/b through backbonetorsion angle changes within the two linkers joining theEINa to EINa/b subdomains. The latter cannot occur firstbecause EINa would clash with EIC in the absence of anyaccompanying reorientation of EINa/b.
Although the SAXS/WAXS, SANS and RDC data for EIand the EI–HPr complex can be satisfied by a single struc-ture, it is likely that interdomain motions and sparsely
523
I
II
III
IVV
HPr
P-HPr Pyruvate
Pyruvate
PEP
IV'
EIC
EINα
EINα/β
Linker
HPr
Linker
TiBS
Figure 5. Catalytic cycle of EI. Only a single subunit is displayed for clarity with the molecular surfaces of the EINa and EINa/b subdomains of EIN in green and blue,
respectively, the molecular surface of EIC domain in red, the linker connecting EINa/b to EIC in a gold ribbon, and HPr in a purple ribbon. Structures I and V correspond to
free EI and the EI–HPr complex (open state) solved by NMR and SAXS/WAXS, structure II to the crystal structure of the trapped phosphorylated intermediate (closed state),
and structures III, IV and IV0 (shown in brackets) to postulated intermediates. Structure III corresponds to the binding of HPr to the trapped phosphorylated intermediate;
structures IV and IV0 correspond to structures in which the orientation of the EINa/b subdomain relative to EIC is the same as that in free EI (I) or the EI–HPr complex (V),
whereas the orientation of the EINa subdomain relative to EINa/b is the same as that in the trapped phosphorylated intermediate (II). The EIC domain (red) is displayed in the
same orientation for all structures. Adapted from [40]. Abbreviations: EIN, N-terminal domain of Enzyme I; HPr, histidine phosphocarrier protein; IIA, Enzyme II domain A;
IIB, Enzyme II domain B; PTS, phosphotransferase system; SAXS, small angle X-ray scattering; WAXS, wide angle X-ray scattering.
Review Trends in Biochemical Sciences October 2013, Vol. 38, No. 10
populated states are present. However, because the RDCand X-ray scattering data are sensitive to different types ofmotion, the former being dependent on orientation and thelatter on molecular size and shape, one can be confident thatthe calculated structures are representative of the predomi-nant average structure in solution.
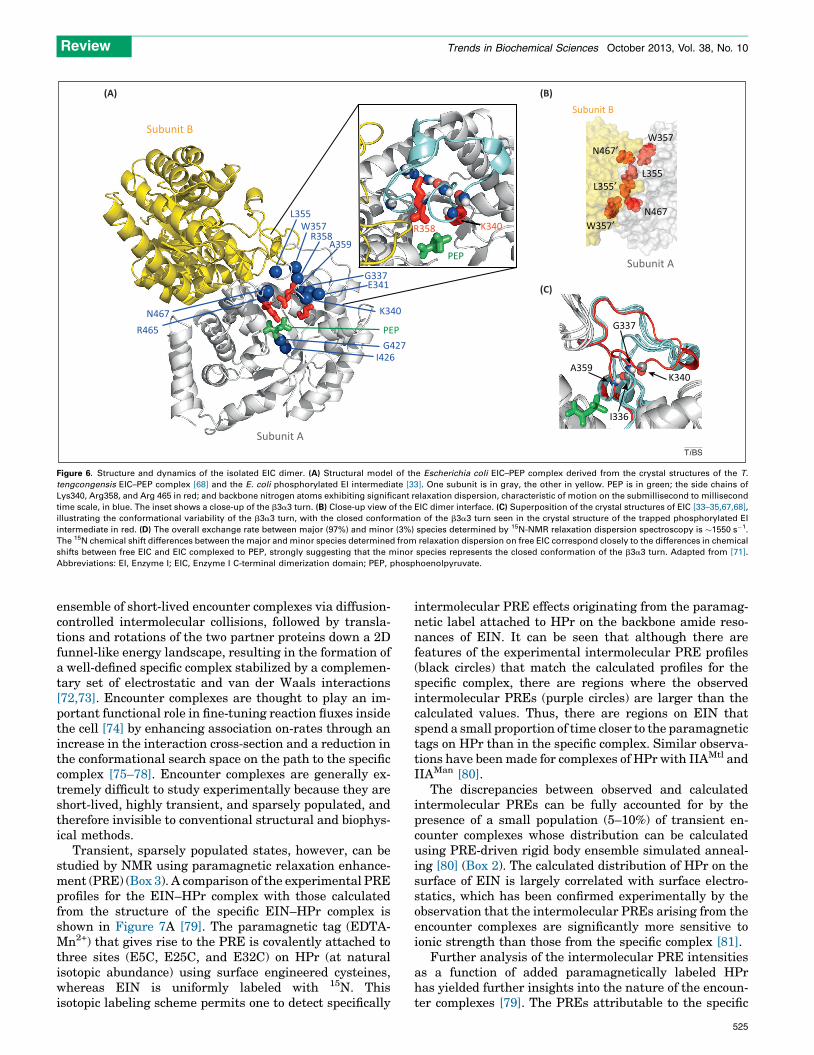
Interplay between conformational dynamics anddimerization of the EIC domainBinding of PEP and Mg2+ to EI results in a �30-folddecrease in the equilibrium dissociation constant (Kdimer)for the dimer [69,70]. The decrease in Kdimer upon ligandbinding is thought to play an important role in regulatingthe PTS because only intact dimeric EI can be autopho-sphorylated by PEP [70]. Binding of PEP to the dimericisolated EIC domain results in large 1HN/
15N chemicalshift perturbations around the PEP binding site and inthe adjacent b3a3 turn located at the dimer interface [71].
524
Examination of EIC in various crystal structures [33–35,67,68] suggests that the b3a3 turn exists in open andclosed conformations, with the latter corresponding to theconformation in the phosphorylated EI intermediate(Figure 6). 15N relaxation dispersion measurements revealthe existence of a dynamic equilibrium between major(97%) and minor (3%) species with an overall exchangerate of �1550 s�1 [71]. The backbone 15N chemical shiftdifferences between the major and minor species in freeEIC determined from the relaxation dispersion data cor-respond with the chemical shift differences observed uponaddition of PEP [71]. Thus, it is likely that binding of PEPoccurs via conformational selection of a low-populationstate corresponding to the closed state of the b3a3 turn.
Encounter complexes in the PTSSpecific protein–protein recognition generally proceeds viaa two-step process involving the initial formation of an
N467R465
W357R358
A359
G337E341
K340
PEPG427
I426
L355
K340
G337
I336
A359
(C)
(B)(A)
L355
W357
N467
L355′
W357′
N467′
R358 K340
PEP
Subunit A
Subunit B
Subunit A
Subunit B
TiBS
Figure 6. Structure and dynamics of the isolated EIC dimer. (A) Structural model of the Escherichia coli EIC–PEP complex derived from the crystal structures of the T.
tengcongensis EIC–PEP complex [68] and the E. coli phosphorylated EI intermediate [33]. One subunit is in gray, the other in yellow. PEP is in green; the side chains of
Lys340, Arg358, and Arg 465 in red; and backbone nitrogen atoms exhibiting significant relaxation dispersion, characteristic of motion on the submillisecond to millisecond
time scale, in blue. The inset shows a close-up of the b3a3 turn. (B) Close-up view of the EIC dimer interface. (C) Superposition of the crystal structures of EIC [33–35,67,68],
illustrating the conformational variability of the b3a3 turn, with the closed conformation of the b3a3 turn seen in the crystal structure of the trapped phosphorylated EI
intermediate in red. (D) The overall exchange rate between major (97%) and minor (3%) species determined by 15N-NMR relaxation dispersion spectroscopy is �1550 s�1.
The 15N chemical shift differences between the major and minor species determined from relaxation dispersion on free EIC correspond closely to the differences in chemical
shifts between free EIC and EIC complexed to PEP, strongly suggesting that the minor species represents the closed conformation of the b3a3 turn. Adapted from [71].
Abbreviations: EI, Enzyme I; EIC, Enzyme I C-terminal dimerization domain; PEP, phosphoenolpyruvate.
Review Trends in Biochemical Sciences October 2013, Vol. 38, No. 10
ensemble of short-lived encounter complexes via diffusion-controlled intermolecular collisions, followed by transla-tions and rotations of the two partner proteins down a 2Dfunnel-like energy landscape, resulting in the formation ofa well-defined specific complex stabilized by a complemen-tary set of electrostatic and van der Waals interactions[72,73]. Encounter complexes are thought to play an im-portant functional role in fine-tuning reaction fluxes insidethe cell [74] by enhancing association on-rates through anincrease in the interaction cross-section and a reduction inthe conformational search space on the path to the specificcomplex [75–78]. Encounter complexes are generally ex-tremely difficult to study experimentally because they areshort-lived, highly transient, and sparsely populated, andtherefore invisible to conventional structural and biophys-ical methods.
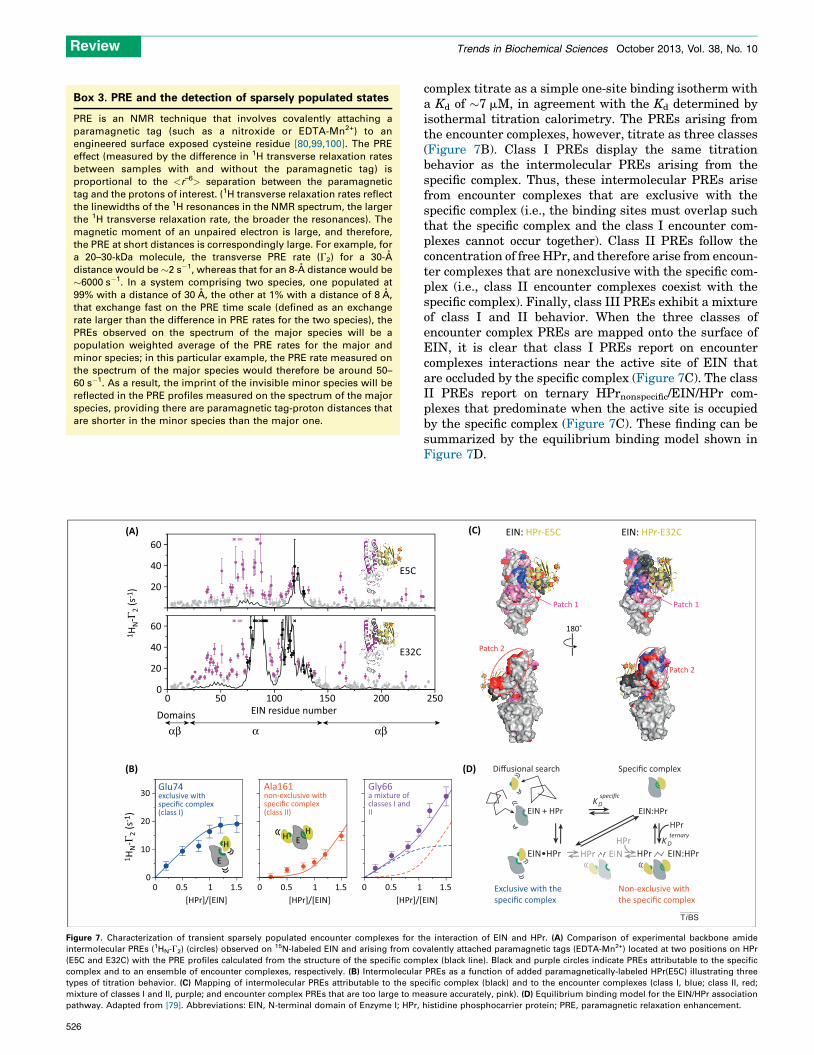
Transient, sparsely populated states, however, can bestudied by NMR using paramagnetic relaxation enhance-ment (PRE) (Box 3). A comparison of the experimental PREprofiles for the EIN–HPr complex with those calculatedfrom the structure of the specific EIN–HPr complex isshown in Figure 7A [79]. The paramagnetic tag (EDTA-Mn2+) that gives rise to the PRE is covalently attached tothree sites (E5C, E25C, and E32C) on HPr (at naturalisotopic abundance) using surface engineered cysteines,whereas EIN is uniformly labeled with 15N. Thisisotopic labeling scheme permits one to detect specifically
intermolecular PRE effects originating from the paramag-netic label attached to HPr on the backbone amide reso-nances of EIN. It can be seen that although there arefeatures of the experimental intermolecular PRE profiles(black circles) that match the calculated profiles for thespecific complex, there are regions where the observedintermolecular PREs (purple circles) are larger than thecalculated values. Thus, there are regions on EIN thatspend a small proportion of time closer to the paramagnetictags on HPr than in the specific complex. Similar observa-tions have been made for complexes of HPr with IIAMtl andIIAMan [80].
The discrepancies between observed and calculatedintermolecular PREs can be fully accounted for by thepresence of a small population (5–10%) of transient en-counter complexes whose distribution can be calculatedusing PRE-driven rigid body ensemble simulated anneal-ing [80] (Box 2). The calculated distribution of HPr on thesurface of EIN is largely correlated with surface electro-statics, which has been confirmed experimentally by theobservation that the intermolecular PREs arising from theencounter complexes are significantly more sensitive toionic strength than those from the specific complex [81].
Further analysis of the intermolecular PRE intensitiesas a function of added paramagnetically labeled HPrhas yielded further insights into the nature of the encoun-ter complexes [79]. The PREs attributable to the specific
525
0 0.5 1 1.5[HPr]/[EIN]
0
10
20
30
0 0.5 1 1.5[HPr]/[EIN]
0 0.5 1[HPr]/[
Glu74exclusive withspecific complex(class I)
Ala161non-exclusive withspecific complex(class II)
Gly66a mixture of classes I andII
H
E
HH E
Domains EIN residue number
α
0 50 100 150 200
αβαβ
20
40
60
0
20
40
60
E5C
E32C
(A)
(B)
1 HN
-Γ2 (
s-1)
1 HN
-Γ2 (
s-1)
Figure 7. Characterization of transient sparsely populated encounter complexes for t
intermolecular PREs (1HN-G2) (circles) observed on 15N-labeled EIN and arising from co
(E5C and E32C) with the PRE profiles calculated from the structure of the specific com
complex and to an ensemble of encounter complexes, respectively. (B) Intermolecular
types of titration behavior. (C) Mapping of intermolecular PREs attributable to the spe
mixture of classes I and II, purple; and encounter complex PREs that are too large to me
pathway. Adapted from [79]. Abbreviations: EIN, N-terminal domain of Enzyme I; HPr,
Box 3. PRE and the detection of sparsely populated states
PRE is an NMR technique that involves covalently attaching a
paramagnetic tag (such as a nitroxide or EDTA-Mn2+) to an
engineered surface exposed cysteine residue [80,99,100]. The PRE
effect (measured by the difference in 1H transverse relaxation rates
between samples with and without the paramagnetic tag) is
proportional to the <r–6> separation between the paramagnetic
tag and the protons of interest. (1H transverse relaxation rates reflect
the linewidths of the 1H resonances in the NMR spectrum, the larger
the 1H transverse relaxation rate, the broader the resonances). The
magnetic moment of an unpaired electron is large, and therefore,
the PRE at short distances is correspondingly large. For example, for
a 20–30-kDa molecule, the transverse PRE rate (G2) for a 30-A
distance would be �2 s�1, whereas that for an 8-A distance would be
�6000 s�1. In a system comprising two species, one populated at
99% with a distance of 30 A, the other at 1% with a distance of 8 A,
that exchange fast on the PRE time scale (defined as an exchange
rate larger than the difference in PRE rates for the two species), the
PREs observed on the spectrum of the major species will be a
population weighted average of the PRE rates for the major and
minor species; in this particular example, the PRE rate measured on
the spectrum of the major species would therefore be around 50–
60 s�1. As a result, the imprint of the invisible minor species will be
reflected in the PRE profiles measured on the spectrum of the major
species, providing there are paramagnetic tag-proton distances that
are shorter in the minor species than the major one.
Review Trends in Biochemical Sciences October 2013, Vol. 38, No. 10
526
complex titrate as a simple one-site binding isotherm witha Kd of �7 mM, in agreement with the Kd determined byisothermal titration calorimetry. The PREs arising fromthe encounter complexes, however, titrate as three classes(Figure 7B). Class I PREs display the same titrationbehavior as the intermolecular PREs arising from thespecific complex. Thus, these intermolecular PREs arisefrom encounter complexes that are exclusive with thespecific complex (i.e., the binding sites must overlap suchthat the specific complex and the class I encounter com-plexes cannot occur together). Class II PREs follow theconcentration of free HPr, and therefore arise from encoun-ter complexes that are nonexclusive with the specific com-plex (i.e., class II encounter complexes coexist with thespecific complex). Finally, class III PREs exhibit a mixtureof class I and II behavior. When the three classes ofencounter complex PREs are mapped onto the surface ofEIN, it is clear that class I PREs report on encountercomplexes interactions near the active site of EIN thatare occluded by the specific complex (Figure 7C). The classII PREs report on ternary HPrnonspecific/EIN/HPr com-plexes that predominate when the active site is occupiedby the specific complex (Figure 7C). These finding can besummarized by the equilibrium binding model shown inFigure 7D.
1.5EIN]
EIN + HP r
EIN•HP r HPr EIN:HP r
HPr
HPr
EIN:HPr
HPr EIN
Specific complex
K
Dspecific
K Dternary
Diffusional search
Exclusive with the specific complex
Non-exclusive with the specific complex
250
180˚
Patch 2
EIN: HPr-E5C EIN: HPr-E32C
Patch 2
Patch 1Patch 1
(C)
(D)
TiBS
he interaction of EIN and HPr. (A) Comparison of experimental backbone amide
valently attached paramagnetic tags (EDTA-Mn2+) located at two positions on HPr
plex (black line). Black and purple circles indicate PREs attributable to the specific
PREs as a function of added paramagnetically-labeled HPr(E5C) illustrating three
cific complex (black) and to the encounter complexes (class I, blue; class II, red;
asure accurately, pink). (D) Equilibrium binding model for the EIN/HPr association
histidine phosphocarrier protein; PRE, paramagnetic relaxation enhancement.
323
159
H10′E
H175
α3
α1
α2
α3
α1
α4
323
159
H10′
H175
α3α1
α2′
α3′
α1
α4
IIAMan-IIBMan produc�vephosphoryl transfer competent
IIAMan-IIBMan non-produc�vephosphoryl transfer incompetent
IIBMan
IIAMan subunit B
IIAMan subunit A
TiBS
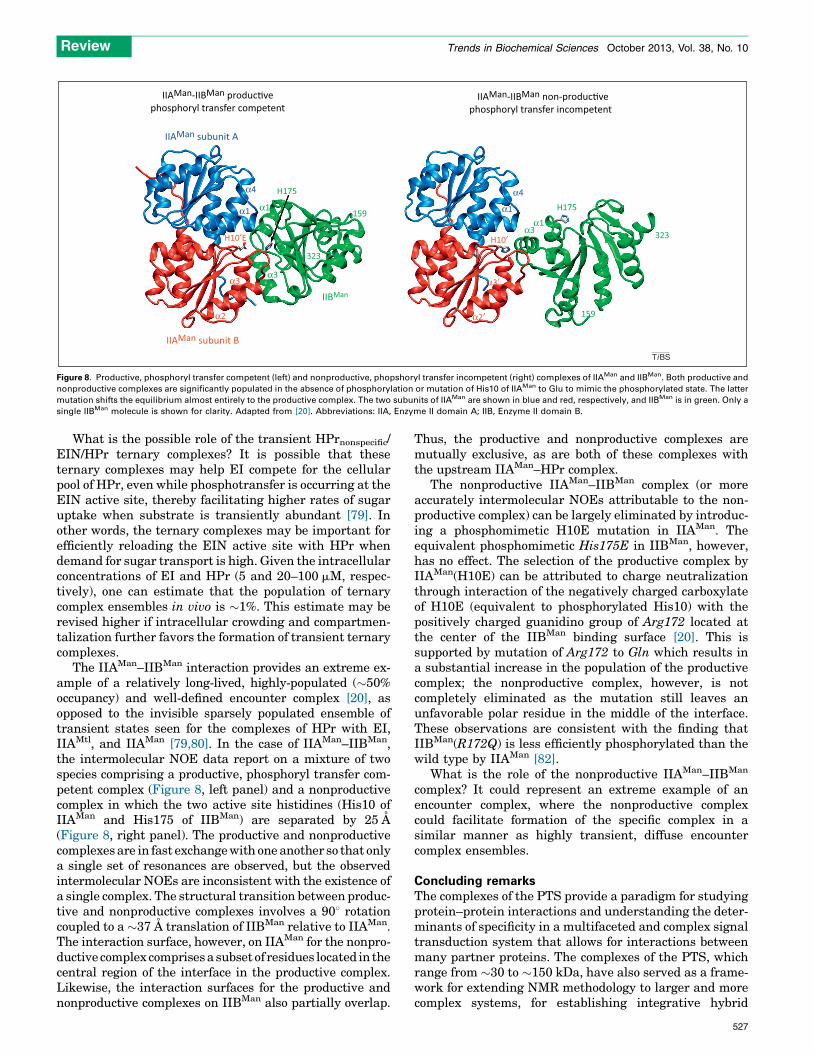
Figure 8. Productive, phosphoryl transfer competent (left) and nonproductive, phopshoryl transfer incompetent (right) complexes of IIAMan and IIBMan. Both productive and
nonproductive complexes are significantly populated in the absence of phosphorylation or mutation of His10 of IIAMan to Glu to mimic the phosphorylated state. The latter
mutation shifts the equilibrium almost entirely to the productive complex. The two subunits of IIAMan are shown in blue and red, respectively, and IIBMan is in green. Only a
single IIBMan molecule is shown for clarity. Adapted from [20]. Abbreviations: IIA, Enzyme II domain A; IIB, Enzyme II domain B.
Review Trends in Biochemical Sciences October 2013, Vol. 38, No. 10
What is the possible role of the transient HPrnonspecific/EIN/HPr ternary complexes? It is possible that theseternary complexes may help EI compete for the cellularpool of HPr, even while phosphotransfer is occurring at theEIN active site, thereby facilitating higher rates of sugaruptake when substrate is transiently abundant [79]. Inother words, the ternary complexes may be important forefficiently reloading the EIN active site with HPr whendemand for sugar transport is high. Given the intracellularconcentrations of EI and HPr (5 and 20–100 mM, respec-tively), one can estimate that the population of ternarycomplex ensembles in vivo is �1%. This estimate may berevised higher if intracellular crowding and compartmen-talization further favors the formation of transient ternarycomplexes.
The IIAMan–IIBMan interaction provides an extreme ex-ample of a relatively long-lived, highly-populated (�50%occupancy) and well-defined encounter complex [20], asopposed to the invisible sparsely populated ensemble oftransient states seen for the complexes of HPr with EI,IIAMtl, and IIAMan [79,80]. In the case of IIAMan–IIBMan,the intermolecular NOE data report on a mixture of twospecies comprising a productive, phosphoryl transfer com-petent complex (Figure 8, left panel) and a nonproductivecomplex in which the two active site histidines (His10 ofIIAMan and His175 of IIBMan) are separated by 25 A(Figure 8, right panel). The productive and nonproductivecomplexes are in fast exchange with one another so that onlya single set of resonances are observed, but the observedintermolecular NOEs are inconsistent with the existence ofa single complex. The structural transition between produc-tive and nonproductive complexes involves a 908 rotationcoupled to a �37 A translation of IIBMan relative to IIAMan.The interaction surface, however, on IIAMan for the nonpro-ductive complex comprises a subset of residues located in thecentral region of the interface in the productive complex.Likewise, the interaction surfaces for the productive andnonproductive complexes on IIBMan also partially overlap.
Thus, the productive and nonproductive complexes aremutually exclusive, as are both of these complexes withthe upstream IIAMan–HPr complex.
The nonproductive IIAMan–IIBMan complex (or moreaccurately intermolecular NOEs attributable to the non-productive complex) can be largely eliminated by introduc-ing a phosphomimetic H10E mutation in IIAMan. Theequivalent phosphomimetic His175E in IIBMan, however,has no effect. The selection of the productive complex byIIAMan(H10E) can be attributed to charge neutralizationthrough interaction of the negatively charged carboxylateof H10E (equivalent to phosphorylated His10) with thepositively charged guanidino group of Arg172 located atthe center of the IIBMan binding surface [20]. This issupported by mutation of Arg172 to Gln which results ina substantial increase in the population of the productivecomplex; the nonproductive complex, however, is notcompletely eliminated as the mutation still leaves anunfavorable polar residue in the middle of the interface.These observations are consistent with the finding thatIIBMan(R172Q) is less efficiently phosphorylated than thewild type by IIAMan [82].
What is the role of the nonproductive IIAMan–IIBMan
complex? It could represent an extreme example of anencounter complex, where the nonproductive complexcould facilitate formation of the specific complex in asimilar manner as highly transient, diffuse encountercomplex ensembles.
Concluding remarksThe complexes of the PTS provide a paradigm for studyingprotein–protein interactions and understanding the deter-minants of specificity in a multifaceted and complex signaltransduction system that allows for interactions betweenmany partner proteins. The complexes of the PTS, whichrange from �30 to �150 kDa, have also served as a frame-work for extending NMR methodology to larger and morecomplex systems, for establishing integrative hybrid
527
Review Trends in Biochemical Sciences October 2013, Vol. 38, No. 10
approaches combining RDCs and solution X-ray scatteringto tackle systems in excess of 100 kDa, and for developingnovel biophysical techniques based on NMR paramagneticrelaxation enhancement to uncover the existence of tran-sient, spectroscopically invisible, sparsely populated en-counter complexes that constitute the first step towardsspecific complex formation.
There remain two open questions/challenges that stillneed to be addressed with respect to the structural biologyand biophysics of the PTS. The first relates to EI and themechanism and dynamics of large interdomain structuralrearrangements that must occur during the course of thecatalytic cycle. How, for example, are small local structuralchanges in the EIC domain upon binding to PEP transmit-ted to the EIN domain? In the absence of PEP does the openfree state coexit with a small population of spectroscopi-cally invisible closed state (Figure 4), and if so, what is thepopulation of the latter; what are the interconversion ratesbetween the species; and how are these populations andrates modulated by different ligands (e.g., the substratePEP versus the inhibitor a-ketoglutarate, both of whichbind to the same site on EIC [28]). These questions canlargely be addressed by multidimensional hetreonuclearNMR spectroscopy, including the application of relaxationdispersion and paramagnetic relaxation enhancementmeasurements, but are rendered especially challengingowing to the large size (by NMR standards) of EI. Thesecond area relates to high-resolution structures of thetransmembrane sugar transporters (IIC and IID; Figure 1)of the PTS, their interaction with Enzymes IIB, and themechanism of selective sugar transport across the mem-brane. Although there have been some low-resolution elec-tron microscopy (EM) and cysteine crosslinking studies onthe IIC transporters from the glucose [83,84] and mannitol[85,86] branches, this field remains largely an open book.Encouragingly crystals of IICGlc diffracting to 4.5 A reso-lution have been recently obtained [87]. Solving structuresof the transmembrane transporters will require extensivebiochemical work to obtain either crystals diffracting tohigh resolution or suitable preparations for single moleculeanalysis by EM.
AcknowledgmentsG.M.C. thanks members of his laboratory, past and present, andcolleagues who have made major contributions to the work on complexesof the PTS, in particular, D. Garrett, M. Cai, G. Wang, G. Cornilescu, D.Williams, J. Hu, K. Hu, J-Y. Suh, Y-S. Jung, C. Tang, J. Iwahara, Y.Takayama, A. Grishaev, and C. Schwieters. This work was supported byfunds from the Intramural Program of the NIH, NIDDK, and theIntramural AIDS Targeted Antiviral Program of the Office of the Directorof the NIH (to G.M.C.).
References1 Kundig, W. et al. (1964) Phosphate bound to histidine in a protein as
an intermediate in a novel phospho-transferase system. Proc. Natl.Acad. Sci. U.S.A. 52, 1067–1074
2 Meadow, N.D. et al. (1990) The bacterial phosphoenolpyruvate:glycose phosphotransferase system. Annu. Rev. Biochem. 59, 497–542
3 Postma, P.W. et al. (1993) Phosphoenolpyruvate: carbohydratephosphotransferase systems of bacteria. Microbiol. Rev. 57, 543–594
4 Herzberg, O. and Klevit, R. (1994) Unraveling a bacterial hexosetransport pathway. Curr. Opin. Struct. Biol. 4, 814–822
5 Robillard, G.T. and Broos, J. (1999) Structure/function studieson the bacterial carbohydrate transporters, enzymes II, of the
528
phosphoenolpyruvate-dependent phosphotransferase system. Biochim.Biophys. Acta 1422, 73–104
6 Siebold, C. et al. (2001) Carbohydrate transporters of the bacterialphosphoenolpyruvate: sugar phosphotransferase system (PTS). FEBSLett. 504, 104–111
7 Deutscher, J. et al. (2006) How phosphotransferase system-relatedprotein phosphorylation regulates carbohydrate metabolism inbacteria. Microbiol. Mol. Biol. Rev. 70, 939–1031
8 Feese, M.D. et al. (1997) Structural studies of the Escherichia colisignal transducing protein IIAGlc: implications for target recognition.Biochemistry 36, 16087–16096
9 Worthylake, D. et al. (1991) Three-dimensional structure of theEscherichia coli phosphocarrier protein IIIGlc. Proc. Natl. Acad. Sci.U.S.A. 88, 10382–10386
10 Liao, D.I. et al. (1991) Structure of the IIA domain of the glucosepermease of Bacillus subtilis at 2.2 A resolution. Biochemistry 30,9583–9594
11 van Montfort, R.L. et al. (1998) The structure of the Escherichia coliphosphotransferase IIAmannitol reveals a novel fold with twoconformations of the active site. Structure 6, 377–388
12 Nunn, R.S. et al. (1996) Structure of the IIA domain of the mannosetransporter from Escherichia coli at 1.7 A resolution. J. Mol. Biol. 259,502–511
13 Sliz, P. et al. (1997) The structure of enzyme IIAlactose
from Lactococcus lactis reveals a new fold and points topossible interactions of a multicomponent system. Structure 5,775–788
14 Tang, C. et al. (2005) Solution structure of enzyme IIAChitobiose fromthe N,N0-diacetylchitobiose branch of the Escherichia coliphosphotransferase system. J. Biol. Chem. 280, 11770–11780
15 Legler, P.M. et al. (2004) Three-dimensional solution structure of thecytoplasmic B domain of the mannitol transporter IImannitol of theEscherichia coli phosphotransferase system. J. Biol. Chem. 279,39115–39121
16 Suh, J.Y. et al. (2005) Visualization of the phosphorylated active siteloop of the cytoplasmic B domain of the mannitol transporter IIMannitol
of the Escherichia coli phosphotransferase system by NMRspectroscopy and residual dipolar couplings. J. Mol. Biol. 353,1129–1136
17 van Montfort, R.L. et al. (1997) The structure of an energy-couplingprotein from bacteria, IIBcellobiose, reveals similarity to eukaryoticprotein tyrosine phosphatases. Structure 5, 217–225
18 Ab, E. et al. (2001) NMR structure of cysteinyl-phosphorylated enzymeIIB of the N,N0-diacetylchitobiose-specific phosphoenolpyruvate-dependent phosphotransferase system of Escherichia coli. J. Mol.Biol. 308, 993–1009
19 Cai, M. et al. (2003) Solution structure of the phosphoryl transfercomplex between the signal-transducing protein IIAGlucose and thecytoplasmic domain of the glucose transporter IICBGlucose of theEscherichia coli glucose phosphotransferase system. J. Biol. Chem.278, 25191–25206
20 Hu, J. et al. (2008) Solution NMR structures of productive and non-productive complexes between the A and B domains of thecytoplasmic subunit of the mannose transporter of theEscherichia coli phosphotransferase system. J. Biol. Chem. 283,11024–11037
21 Schauder, S. et al. (1998) Crystal structure of the IIB subunit of afructose permease (IIBLev) from Bacillus subtilis. J. Mol. Biol. 276,591–602
22 Orriss, G.L. et al. (2003) Crystal structure of the IIBSor domain of thesorbose permease from Klebsiella pneumoniae solved to 1.75 Aresolution. J. Mol. Biol. 327, 1111–1119
23 Seok, Y.J. et al. (1997) High affinity binding and allostericregulation of Escherichia coli glycogen phosphorylase by thehistidine phosphocarrier protein, HPr. J. Biol. Chem. 272,26511–26521
24 Peterkofsky, A. et al. (1993) Bacterial adenylyl cyclases. Prog. NucleicAcids Res. Mol. Biol. 44, 31–65
25 Novotny, M.J. et al. (1985) Allosteric regulation of glycerol kinase byenzyme IIIGlc of the phosphotransferase system in Escherichia coliand Salmonella typhimurium. J. Bacteriol. 162, 810–816
26 Nam, T.W. et al. (2001) The Escherichia coli glucose transporterenzyme IICBGlc recruits the global repressor Mlc. EMBO J. 20,491–498
Review Trends in Biochemical Sciences October 2013, Vol. 38, No. 10
27 Seitz, S. et al. (2003) Analysis of the interaction between the globalregulator Mlc and EIIBGlc of the glucose-specific phosphotransferasesystem in Escherichia coli. J. Biol. Chem. 278, 10744–10751
28 Venditti, V. et al. (2013) Structural basis for Enzyme I inhibition by a-ketoglutarate. ACS Chem. Biol. 8, 1232–1240
29 Doucette, C.D. et al. (2011) a-Ketoglutarate coordinates carbon andnitrogen utilization via enzyme I inhibition. Nat. Chem. Biol. 7, 894–901
30 Liao, D.I. et al. (1996) The first step in sugar transport: crystalstructure of the amino terminal domain of enzyme I of the E. coliPEP: sugar phosphotransferase system and a model of thephosphotransfer complex with HPr. Structure 4, 861–872
31 Jia, Z. et al. (1993) The 2.0-A resolution structure of Escherichia colihistidine-containing phosphocarrier protein HPr. A redetermination.J. Biol. Chem. 268, 22490–22501
32 Herzberg, O. et al. (1992) Structure of the histidine-containingphosphocarrier protein HPr from Bacillus subtilis at 2.0-Aresolution. Proc. Natl. Acad. Sci. U.S.A. 89, 2499–2503
33 Teplyakov, A. et al. (2006) Structure of phosphorylated enzyme I, thephosphoenolpyruvate:sugar phosphotransferase system sugartranslocation signal protein. Proc. Natl. Acad. Sci. U.S.A. 103,16218–16223
34 Marquez, J. et al. (2006) Structure of the full-length enzyme I of thephosphoenolpyruvate-dependent sugar phosphotransferase system.J. Biol. Chem. 281, 32508–32515
35 Oberholzer, A.E. et al. (2009) Crystal structure of enzyme I of thephosphoenolpyruvate sugar phosphotransferase system in thedephosphorylated state. J. Biol. Chem. 284, 33169–33176
36 Wittekind, M. et al. (1992) Solution structure of the phosphocarrierprotein HPr from Bacillus subtilis by two-dimensional NMRspectroscopy. Protein Sci. 1, 1363–1376
37 van Nuland, N.A.J. et al. (1994) The high-resolution structure of thehistidine-containing phosphocarrier protein HPr from Escherichiacoli determined by restrained molecular dynamics from nuclearmagnetic resonance nuclear Overhauser effect data. J. Mol. Biol.237, 544–559
38 van Nuland, N.A.J. et al. (1995) High-resolution structure of thephosphorylated form of the histidine-containing phosphocarrierprotein HPr from Escherichia coli determined by restrainedmolecular dynamics from NMR NOE data. J. Mol. Biol. 246, 180–193
39 Garrett, D.S. et al. (1997) Solution structure of the 30 kDa N-terminaldomain of enzyme I of the Escherichia coli phosphoenolpyruvate:sugarphosphotransferase system by multidimensional NMR. Biochemistry36, 2517–2530
40 Schwieters, C.D. et al. (2010) Solution structure of the 128 kDaenzyme I dimer from Escherichia coli and its 146 kDa complexwith HPr using residual dipolar couplings and small- and wide-angle X-ray scattering. J. Am. Chem. Soc. 132, 13026–13045
41 Takayama, Y. et al. (2011) Combined use of residual dipolar couplingsand solution X-ray scattering to rapidly probe rigid-bodyconformational transitions in a non-phosphorylatable active-sitemutant of the 128 kDa enzyme I dimer. J. Am. Chem. Soc. 133, 424–427
42 Garrett, D.S. et al. (1999) Solution structure of the 40,000 Mr
phosphoryl transfer complex between the N-terminal domain ofenzyme I and HPr. Nat. Struct. Biol. 6, 166–173
43 Clore, G.M. (2000) Accurate and rapid docking of protein-proteincomplexes on the basis of intermolecular nuclear overhauserenhancement data and dipolar couplings by rigid bodyminimization. Proc. Natl. Acad. Sci. U.S.A. 97, 9021–9025
44 Schwieters, C.D. and Clore, G.M. (2001) Internal coordinates formolecular dynamics and minimization in structure determinationand refinement. J. Magn. Reson. 152, 288–302
45 Cornilescu, G. et al. (2002) Solution structure of the phosphoryltransfer complex between the cytoplasmic A domain of themannitol transporter IIMannitol and HPr of the Escherichia coliphosphotransferase system. J. Biol. Chem. 277, 42289–42298
46 Clore, G.M. and Gronenborn, A.M. (1998) Determining the structuresof large proteins and protein complexes by NMR. Trends Biotechnol.16, 22–34
47 Wang, G. et al. (2000) Solution structure of the phosphoryl transfercomplex between the signal transducing proteins HPr and IIAglucose ofthe Escherichia coli phosphoenolpyruvate:sugar phosphotransferasesystem. EMBO J. 19, 5635–5649
48 Williams, D.C., Jr et al. (2005) Solution NMR structure of the 48-kDaIIAMannose-HPr complex of the Escherichia coli mannosephosphotransferase system. J. Biol. Chem. 280, 20775–20784
49 Jung, Y.S. et al. (2012) Solution structure of the IIAChitobiose-HPrcomplex of the N,N0-diacetylchitobiose branch of the Escherichiacoli phosphotransferase system. J. Biol. Chem. 287, 23819–23829
50 Suh, J.Y. et al. (2006) Solution structure of a post-transition stateanalog of the phosphotransfer reaction between the A and Bcytoplasmic domains of the mannitol transporter IIMannitol of theEscherichia coli phosphotransferase system. J. Biol. Chem. 281,8939–8949
51 Jung, Y.S. et al. (2010) Solution structure of the IIAChitobiose-IIBChitobiose complex of the N,N0-diacetylchitobiose branch of theEscherichia coli phosphotransferase system. J. Biol. Chem. 285,4173–4184
52 Nam, T.W. et al. (2008) Analyses of Mlc-IIBGlc interaction and aplausible molecular mechanism of Mlc inactivation by membranesequestration. Proc. Natl. Acad. Sci. U.S.A. 105, 3751–3756
53 Herzberg, O. (1992) An atomic model for protein-protein phosphorylgroup transfer. J. Biol. Chem. 267, 24819–24823
54 Begley, G.S. et al. (1982) Stereochemical course of the reactionscatalyzed by the bacterial phosphoenolpyruvate:glucosephosphotransferase system. Biochemistry 21, 5552–5556
55 Mueller, E.G. et al. (1990) Stereochemical course of the reactionscatalyzed by the bacterial phosphoenolpyruvate:mannitolphosphotransferase system. Biochemistry 29, 6892–6896
56 Hollfelder, F. and Herschlag, D. (1995) The nature of the transitionstate for enzyme-catalyzed phosphoryl transfer. Hydrolysis of O-arylphosphorothioates by alkaline phosphatase. Biochemistry 34, 12255–12264
57 Rohwer, J.M. et al. (2000) Understanding glucose transport by thebacterial phosphoenolpyruvate:glycose phosphotransferase systemon the basis of kinetic measurements in vitro. J. Biol. Chem. 275,34909–34921
58 Suh, J.Y. et al. (2007) Intramolecular domain-domain association/dissociation and phosphoryl transfer in the mannitol transporter ofEscherichia coli are not coupled. Proc. Natl. Acad. Sci. U.S.A. 104,3153–3158
59 Northrup, S.H. and Erickson, H.P. (1992) Kinetics of protein-proteinassociation explained by Brownian dynamics computer simulation.Proc. Natl. Acad. Sci. U.S.A. 89, 3338–3342
60 Meadow, N.D. and Roseman, S. (1982) Sugar transport by the bacterialphosphotransferase system. Isolation and characterization of a glucose-specific phosphocarrier protein (IIIGlc) from Salmonella typhimurium.J. Biol. Chem. 257, 14526–14537
61 Meadow, N.D. et al. (1986) Limited proteolysis of IIIGlc, a regulatoryprotein of the phosphoenolpyruvate:glycose phosphotransferasesystem, by membrane-associated enzymes from Salmonellatyphimurium and Escherichia coli. J. Biol. Chem. 261, 13504–13509
62 Wang, G. et al. (2000) A novel membrane anchor function for the N-terminal amphipathic sequence of the signal-transducing proteinIIAGlucose of the Escherichia coli phosphotransferase system. J.Biol. Chem. 275, 39811–39814
63 Chauvin, F. et al. (1996) The N-terminal domain of Escherichia colienzyme I of the phosphoenolpyruvate/glycose phosphotransferasesystem: molecular cloning and characterization. Proc. Natl. Acad.Sci. U.S.A. 93, 7028–7031
64 Chauvin, F. et al. (1996) Enzyme I: the first protein and potentialregulator of the bacterial phosphoenolpyruvate: glycosephosphotransferase system. Res. Microbiol. 147, 471–479
65 Saier, M.H., Jr et al. (1980) Phosphoryl exchange reaction catalyzedby enzyme I of the bacterial phosphoenolpyruvate: sugarphosphotransferase system. Kinetic characterization. J. Biol.Chem. 255, 8579–8584
66 Meadow, N.D. et al. (2005) Transient state kinetics of Enzyme I of thephosphoenolpyruvate:glycose phosphotransferase system ofEscherichia coli: equilibrium and second-order rate constants forthe phosphotransfer reactions with phosphoenolpyruvate and HPr.Biochemistry 44, 12790–12796
67 Oberholzer, A.E. et al. (2005) Crystal structure of thephosphoenolpyruvate-binding enzyme I-domain from theThermoanaerobacter tengcongensis PEP: sugar phosphotransferasesystem (PTS). J. Mol. Biol. 346, 521–532
529
Review Trends in Biochemical Sciences October 2013, Vol. 38, No. 10
68 Navdaeva, V. et al. (2011) Phosphoenolpyruvate: sugarphosphotransferase system from the hyperthermophilicThermoanaerobacter tengcongensis. Biochemistry 50, 1184–1193
69 Patel, H.V. et al. (2006) Properties of the C-terminal domain of enzymeI of the Escherichia coli phosphotransferase system. J. Biol. Chem.281, 17579–17587
70 Patel, H.V. et al. (2006) The monomer/dimer transition of enzyme I ofthe Escherichia coli phosphotransferase system. J. Biol. Chem. 281,17570–17578
71 Venditti, V. and Clore, G.M. (2012) Conformational selection andsubstrate binding regulate the monomer/dimer equilibrium of theC-terminal domain of Escherichia coli enzyme I. J. Biol. Chem. 287,26989–26998
72 Gabdoulline, R.R. and Wade, R.C. (2002) Biomolecular diffusionalassociation. Curr. Opin. Struct. Biol. 12, 204–213
73 Schreiber, G. et al. (2009) Fundamental aspects of protein-proteinassociation kinetics. Chem. Rev. 109, 839–860
74 Blundell, T.L. and Fernandez-Recio, J. (2006) Cell biology: briefencounters bolster contacts. Nature 444, 279–280
75 Northrup, S.H. et al. (1988) Brownian dynamics of cytochrome c andcytochrome c peroxidase association. Science 241, 67–70
76 Schreiber, G. and Fersht, A.R. (1996) Rapid, electrostatically assistedassociation of proteins. Nat. Struct. Biol. 3, 427–431
77 Zhou, H.X. and Szabo, A. (2004) Enhancement of association rates bynonspecific binding to DNA and cell membranes. Phys. Rev. Lett. 93,178101
78 Harel, M. et al. (2007) On the dynamic nature of the transition statefor protein-protein association as determined by double-mutant cycleanalysis and simulation. J. Mol. Biol. 371, 180–196
79 Fawzi, N.L. et al. (2010) Mechanistic details of a protein-proteinassociation pathway revealed by paramagnetic relaxationenhancement titration measurements. Proc. Natl. Acad. Sci. U.S.A.107, 1379–1384
80 Tang, C. et al. (2006) Visualization of transient encounter complexesin protein-protein association. Nature 444, 383–386
81 Suh, J.Y. et al. (2007) Role of electrostatic interactions in transientencounter complexes in protein-protein association investigated byparamagnetic relaxation enhancement. J. Am. Chem. Soc. 129,12954–12955
82 Gutknecht, R. et al. (1998) Mutational analysis of invariant argininesin the IIAB(Man) subunit of the Escherichia coli phosphotransferasesystem. J. Biol. Chem. 273, 12234–12238
83 Koch, M.H. et al. (2003) Small-angle scattering: a view on theproperties, structures and structural changes of biologicalmacromolecules in solution. Q. Rev. Biophys. 36, 147–227;Zhuang, J. et al. (1999) Purification and electron microscopiccharacterization of the membrane subunit (IICBGlc) of theEscherichia coli glucose transporter. Arch. Biochem. Biophys. 372,89–96
84 Jeckelmann, J.M. et al. (2011) Structure and function of the glucosePTS transporter from Escherichia coli. J. Struct. Biol. 176, 395–403
530
85 Koning, R.I. et al. (1999) The 5 A projection structure of thetransmembrane domain of the mannitol transporter enzyme II. J.Mol. Biol. 287, 845–851
86 van Montfort, B.A. et al. (2001) Cysteine cross-linking defines part ofthe dimer and B/C domain interface of the Escherichia coli mannitolpermease. J. Biol. Chem. 276, 12756–12763
87 Zurbriggen, A. et al. (2010) Expression, purification, crystallizationand preliminary X-ray analysis of the EIICGlc domain of theEscherichia coli glucose transporter. Acta Crystallogr. Sect. F:Struct. Biol. Cryst. Commun. 66, 684–688
88 Grishaev, A. et al. (2005) Refinement of multidomain proteinstructures by combination of solution small-angle X-ray scatteringand NMR data. J. Am. Chem. Soc. 127, 16621–16628
89 Grishaev, A. et al. (2008) Refined solution structure of the 82-kDaenzyme malate synthase G from joint NMR and synchrotron SAXSrestraints. J. Biomol. NMR 40, 95–106
90 Schwieters, C.D. and Clore, G.M. (2007) A physical picture of atomicmotions within the Dickerson DNA dodecamer in solution derivedfrom joint ensemble refinement against NMR and large-angle X-rayscattering data. Biochemistry 46, 1152–1166
91 Clore, G.M. and Gronenborn, A.M. (1991) Structures of larger proteinsin solution: three- and four-dimensional heteronuclear NMRspectroscopy. Science 252, 1390–1399
92 Clore, G.M. and Gronenborn, A.M. (1998) New methods of structurerefinement for macromolecular structure determination by NMR.Proc. Natl. Acad. Sci. U.S.A. 95, 5891–5898
93 Bax, A. et al. (1994) Measurement of homo- and heteronuclear Jcouplings from quantitative J correlation. Methods Enzymol. 239,79–105
94 Shen, Y. et al. (2009) TALOS+: a hybrid method for predicting proteinbackbone torsion angles from NMR chemical shifts. J. Biomol. NMR44, 213–223
95 Prestegard, J.H. et al. (2000) NMR structures of biomolecules usingfield oriented media and residual dipolar couplings. Q. Rev. Biophys.33, 371–424
96 Clore, G.M. and Garrett, D.S. (1999) R-factor, free R, and completecross-validation for dipolar coupling refinement of NMR structures. J.Am. Chem. Soc. 121, 9008–9012
97 Tjandra, N. and Bax, A. (1997) Direct measurement of distances andangles in biomolecules by NMR in a dilute liquid crystalline medium.Science 278, 1111–1114
98 Clore, G.M. et al. (1998) Measurement of residual dipolar couplings ofmacromolecules aligned in the nematic phase of a colloidal suspensionof rod-shaped viruses. J. Am. Chem. Soc. 120, 10571–10572
99 Iwahara, J. and Clore, G.M. (2006) Detecting transient intermediatesin macromolecular binding by paramagnetic NMR. Nature 440, 1227–1230
100 Clore, G.M. and Iwahara, J. (2009) Theory, practice, and applicationsof paramagnetic relaxation enhancement for the characterization oftransient low-population states of biological macromolecules andtheir complexes. Chem. Rev. 109, 4108–4139