g whamsa free weighted histogram analysis …cmb.bio.uni-goettingen.de/pub/hub_jctc2010.pdf ·...
TRANSCRIPT

g_whamsA Free Weighted Histogram AnalysisImplementation Including Robust Error and
Autocorrelation Estimates
Jochen S. Hub,*,† Bert L. de Groot,‡ and David van der Spoel†
Department of Cell and Molecular Biology, Uppsala UniVersity, Box 596,75124 Uppsala, Sweden, and Computational Biomolecular Dynamics Group,
Max-Planck-Institute for Biophysical Chemistry,Am Fassberg 11, 37077 Gottingen, Germany
Received August 30, 2010
Abstract: The Weighted Histogram Analysis Method (WHAM) is a standard technique used tocompute potentials of mean force (PMFs) from a set of umbrella sampling simulations. Here,we present a new WHAM implementation, termed g_wham, which is distributed freely with theGROMACS molecular simulation suite. g_wham estimates statistical errors using the techniqueof bootstrap analysis. Three bootstrap methods are supported: (i) bootstrapping new trajectoriesbased on the umbrella histograms, (ii) bootstrapping of complete histograms, and (iii) Bayesianbootstrapping of complete histograms, that is, bootstrapping via the assignment of randomweights to the histograms. Because methods ii and iii consider only complete histograms asindependent data points, these methods do not require the accurate calculation of autocorrelationtimes. We demonstrate that, given sufficient sampling, bootstrapping new trajectories allowsfor an accurate error estimate. In the presence of long autocorrelations, however, (Bayesian)bootstrapping of complete histograms yields a more reliable error estimate, whereas bootstrap-ping of new trajectories may underestimate the error. In addition, we emphasize that theincorporation of autocorrelations into WHAM reduces the bias from limited sampling, in particular,when computing periodic PMFs in inhomogeneous systems such as solvated lipid membranesor protein channels.
Introduction
The concept of potentials of mean force (PMFs), originallyintroduced by Kirkwood,1 is frequently used to characterizethe energetics of transitions in solid, fluid, and biomolecularsystems. A routinely used technique to compute the PMFalong a given reaction coordinate � is umbrella sampling.That technique aims to overcome limited sampling atenergetically unfavorable configurations by restraining thesimulation system with an additional (typically harmonic)
potential.2 Accordingly, a set of Nw separate umbrellasimulations are carried out, with an umbrella potential
which restrains the system at the position �ic (i ) 1, ..., Nw)
with a force constant Ki. From each of the Nw umbrellasimulations (sometimes referred to as “umbrella windows”),an umbrella histogram hi(�) is recorded, representing theprobability distribution Pi
b(�) along the reaction coordinatebiased by the umbrella potential wi(�). The probably mostwidely used technique to compute the PMF from histograms,that is, to unbias the distributions Pi
b(�), is the weightedhistogram analysis method (WHAM).3
On the basis of the histogram method of Ferrenberg andSwendsen,4 the idea of WHAM is to estimate the statistical
* Author to whom correspondence should be addressed. Tel.:+46-(0)18-4715056. Fax: +46-(0)18-511755. E-mail: [email protected].
† Uppsala University.‡ Max-Planck-Institute for Biophysical Chemistry.
wi(�) ) Ki/2(� - �ic)2 (1)
J. Chem. Theory Comput. 2010, 6, 3713–3720 3713
10.1021/ct100494z 2010 American Chemical SocietyPublished on Web 11/16/2010
uncertainty of the unbiased probability distribution given theumbrella histograms, and subsequently to compute the PMFthat corresponds to the smallest uncertainty. For a derivationof the equations, we refer to the original publication byKumar et al.3 An excellent (and less technical) review onumbrella simulations and the WHAM procedure has beenpresented by Roux.5 The WHAM equations read3
and
Here, � denotes the inverse temperature 1/kBT, with theBoltzmann constant kB and the temperature T, and nj is thetotal number of data points in histogram hj. The statisticalinefficiency gi is given by gi ) 1 + 2τi, with the integratedautocorrelation time τi of umbrella window i (in units of thesimulation frame time step.) Note that the gi’s cancel fromthe WHAM equations if (and only if) the autocorrelationtimes in all umbrella windows equal. In contrast, if the gi’sdiffer between different histograms, the factors gi
-1 assignlower weights to histograms with longer autocorrelations.P(�) denotes the unbiased probability distribution that isrelated to the PMF via W (�) ) -�-1 ln[P(�)/P(�0)]. Here,�0 is an arbitrary reference point where the PMF W (�0) isdefined to zero. The WHAM equations contain two unknownquantities, that is, the free energy constants fj and theunbiased distribution P(�), and must therefore be solvediteratively. Depending on the number of histograms and theheight of the barriers in the PMF, the WHAM equationstypically converge within tens of iterations and up to tensof thousands of iterations.
Alternative approaches to derive the PMF and the uncer-tainty from a set of umbrella simulations have beenproposed,6-8 as well as several extensions to the umbrellasampling technique.9,10
Despite the fact that WHAM has been widely used toderive PMFs from biomolecular simulations, a standardprotocol to compute the statistical errors for the derived PMFhas not yet evolved. Therefore, we here present a newWHAM implementation, termed g_wham, that allows oneto compute robust error estimates using different bootstraptechniques. We apply the techniques on two test systems todemonstrate the potential and the limitations of the bootstrapmethods. Besides the ability to estimate the statistical error,g_wham supports a number of features that are expected tobe useful to the community. To compute PMFs alongperiodic reaction coordinates such as dihedral angles orcoordinates in a simulation box with periodic boundaryconditions, a periodic WHAM is implemented. Nonharmonicumbrella potentials can be provided as tabulated potentials.g_wham allows for the estimatation of autocorrelation timesand the incorporation of these into WHAM. As shown in
the Results, this procedure may yield more realistic PMFestimates in the presence of long autocorrelations.
The software is freely distributed with the GROMACSsimulation suite.11 If the umbrella simulations were carriedout using the GROMACS pull options, g_wham convenientlyreads the GROMACS output files. In the case of morecomplex reaction coordinates, or if the simulations were notcarried out using GROMACS, the user may provide g_whaminput files in text format. A detailed description of g_wham,including all options, is provided in the Appendix and isavailable with the command line g_wham -h.
Methods
Error Estimates from Bootstrap Analysis. g_whamestimates the statistical uncertainty of the PMF usingbootstrap analysis.12 Bootstrapping is a resampling techniquethat can be applied to estimate the uncertainty of a quantityA(a1, ..., an) which is computed from a large set of nobservations al (l ) 1, ..., n). To calculate the uncertainty inA, one could redo the n observations multiple times, yieldingseveral independent estimates for A and hence the uncertaintyin A. That procedure would require many more observationsand is therefore often not tractable.
The observations al are typically drawn from an unknownunderlying probability distribution P(a). The idea of boot-strapping is to estimate P(a) using the n observations andsubsequently generate new random sets of n hypotheticalobservations, based on the estimated distribution. Each ofthe sets of n hypothetical observations is used to calculate ahypothetical value for A. The uncertainty in A is then givenby the standard deviation of the hypothetical values for A.For a detailed introduction into the bootstrap technique, werefer to the monograph by Chernick.13
Bootstrapping Trajectories Based on Umbrella His-tograms. The WHAM procedure computes the PMF basedon the Nw trajectories �i(t) along the reaction coordinate, eachtaken from one of the umbrella windows (i ) 1, ..., Nw). Allpositions �i during the Nw simulations may thus be consideredas the large set of observations, which we referred to as al
in the previous paragraph.14 Alternatively, complete umbrellahistograms may be considered as the individual observations(see next section).15 Note that the probability distributionsof �i are already available as the umbrella histograms. Thus,we can generate new hypothetical observations, that is, a“bootstrapped” trajectory �b,i(t) for each umbrella histogramhi(�), such that �b,i(t) is distributed according to the respectivehistogram. Each bootstrapped trajectory �b,i(t) yields a newhistogram hb,i(�). The new set of Nw histograms hb,i issubsequently applied in WHAM to compute a bootstrappedPMF Wb(�). The whole procedure is repeated Nb times (e.g.,Nb ) 200), yielding a large set of Nb bootstrapped PMFsW b,k(�) (k ) 1, ..., Nb). The uncertainty of the PMF is thengiven by the standard deviation as calculated by the Nb
bootstrapped PMFs, that is via
P(�) )∑i)1
Nw
gi-1hi(�)
∑j)1
Nw
njgj-1 exp[-�(wj(�) - fj)]
(2)
exp(-�fj) ) ∫ d� exp[-�wj(�)] P(�) (3)
σPMF(�) ) [(Nb - 1)-1 ∑k)1
Nb
(Wb,k(�) - ⟨Wb(�)⟩)2]1/2 (4)
3714 J. Chem. Theory Comput., Vol. 6, No. 12, 2010 Hub et al.

Here, ⟨W b(�)⟩ ) Nb-1∑i)k
Nb W b,k(�) denotes the average ofthe bootstrapped PMFs at position �. One could also calculatethe uncertainty via the standard deviation of the respectiveprobabilities ∝ exp (-�W b,k(�)), which could subsequentlybe translated into the uncertainty of the PMF. We found thatthat this procedure yields similar error estimates comparedto the definition in eq 4 applied here.
Any property generated from MD simulations has a naturaltime correlation. In order for the bootstrapping procedure togenerate correct error estimates, that autocorrelation mustbe taken into account explicitly. Here, we chose the followingprocedure to generate autocorrelated bootstrapped trajectories�b(t) with a given integrated autocorrelation time (IACT) τ,and distributed according to a histogram h(�). (Here, h(�)may denote any of the given histograms, and the procedureis repeated for each histogram.) First, given a normallydistributed random variable of zero mean and unit varianceRt ∼ N (0,1), we generate a time series x(t) via
where a ) exp(-1/τ). Then, x(t) ∼ N (0,1) and the IACT ofx(t) equals τ. The normally distributed x(t) is translated intoan evenly distributed series on [0,1) using the error functionvia x′(t) ) (1 + erf[x(t)�2])/2. Eventually, we solve theequation
for �b(t), where Ch(�b(t)) denotes the cumulative distributionfunction of the (normalized) histogram. Then, �b(t) will bedistributed according to h(�), with an approximate IACTof τ.
Bootstrapping Complete Histograms. The conforma-tional sampling of macromolecules during MD simulationsis frequently affected by long autocorrelations, with auto-correlation times ranging from pico- to microseconds or evenlonger. A complete sampling of all coordinates perpendicularto the reaction coordinate is therefore often intractable, inparticular during a typically short umbrella simulation. Insuch situations, the individual umbrella histograms do notrepresent all accessible areas of phase space. Bootstrappedtrajectories based on such nonconverged histograms, fol-lowing the procedure in the previous paragraph, would alsonot represent all accessible areas of phase space. In addition,note that bootstrapping trajectories from given histogramsrequire at least approximate knowledge of the IACT. Givenonly incomplete sampling, however, the IACT may beseverely underestimated because slow transitions may notoccur during the short umbrella simulations. Bootstrappingtrajectories based on incomplete histograms in combinationwith underestimated IACTs would severely underestimatethe uncertainty.
If the simulations are affected by such long autocorrela-tions, we suggest carrying out the simulation of eachumbrella window multiple times from independent initialframes. Then, we consider complete histograms as individualobservations and randomly select a new set of Nw histograms
from the given set of Nw histograms, allowing one to multiplyselect a specific histogram (sampling with replacement).15
Hence, in contrast to the bootstrapping of trajectories basedon umbrella histograms (see previous paragraph), we do notgenerate new trajectories and histograms. To ensure that thebootstrapped histograms span the whole reaction coordinate,that is, that no gaps between the bootstrapped histogramsare generated, the histograms can be grouped along thereaction coordinate, and histograms can be bootstrappedwithin each group separately. We show that, given limitedsampling, bootstrapping of complete histograms allows fora more accurate estimation of the uncertainty (see Results).
Bayesian Bootstrapping of Complete Histograms. Aspointed out in the previous paragraph, introducing groupsof histograms (and subsequent bootstrapping only within eachgroup) avoids gaps along the reaction coordinate betweenbootstrapped histograms, but an appropriate choice for thenumber of histograms per group may be unclear. Therefore,we propose a method related to the so-called Bayesianbootstrap that avoids the introduction of groups of histogramsby instead assigning random weights to all histograms withineach bootstrap.
When applying the usual bootstrap on individual observa-tions, n observations are selected with replacement from thegiven n observations ai (i ) 1, ..., n), where the probabilityof selecting any of the specific observations equals 1/n.Hence, all observations ai are selected with equal probability.Rubin proposed an alternative procedure, known as theBayesian bootstrap, that instead assigns random weights ωi
to each observation.16 Then, each observation ai is selectedwith probability ωi (instead of 1/n), or alternatively, theweights ωi are assigned to the observations when computingthe observable A(a1, ..., an) from the observations. Accordingto the Bayesian bootstrap, the weights ωi are generated asfollows: draw n - 1 uniform random variables between 0and 1, and let u(1), u(2), ..., u(n-1) denote their values inincreasing order. In addition, let u(0) ) 0 and u(n) ) 1. Therandom weights are then given by the gaps between twoconsecutive random numbers, i.e., ωi ) u(i) - u(i-1), wherei ) 1, ..., n. For each bootstrap turn, new random weightsare generated.
Note that the bootstrapping of complete histograms(compare previous section) is equivalent to the assignmentof random weights to the histograms, if these randomweights are an integer multiple of 1/Nw. Here, we suggestthe assignment of continuous random weights to thehistograms, and selection of the weights according to theBayesian bootstrap. That procedure resembles the boot-strapping of compete histograms in the sense that itconsiders only complete histograms as independent datapoints and thus is expected to yield realistic error estimatesin the presence of long autocorrelations. However, becausethe continuous weights ωi are (almost) never exactly zero,it excludes the possibility of generating gaps along thereaction coordinate in the bootstrapped histogram set. TheWHAM procedure with weighted histograms was imple-mented by multiplying the inverse statistical inefficienciesgi-1 in eq 2 by ωi.
x(0) ) R0 (5)
x(t + 1) ) ax(t) + √1 - a2Rt+1 (6)
x'(t) ) Ch(�b(t)) ≡ ∫-∞
�b(t)h(�′) d�′ (7)
g_whamsA Free WHAM Implementation J. Chem. Theory Comput., Vol. 6, No. 12, 2010 3715
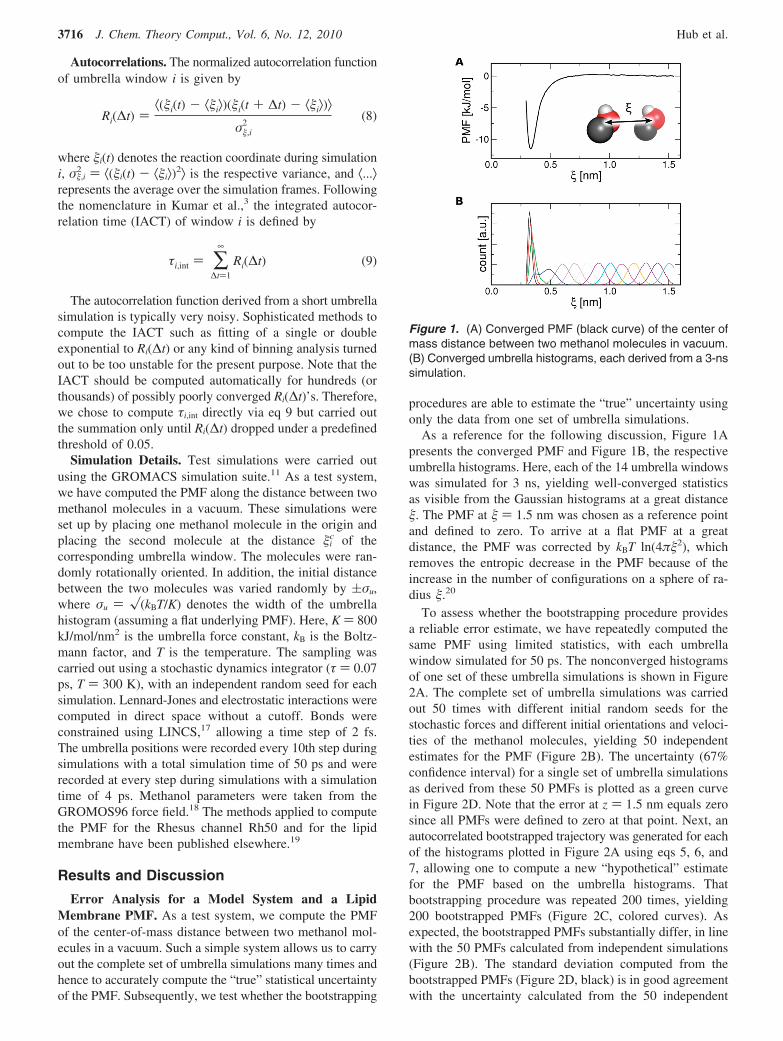
Autocorrelations. The normalized autocorrelation functionof umbrella window i is given by
where �i(t) denotes the reaction coordinate during simulationi, σ�,i
2 ) ⟨(�i(t) - ⟨�i⟩)2⟩ is the respective variance, and ⟨...⟩represents the average over the simulation frames. Followingthe nomenclature in Kumar et al.,3 the integrated autocor-relation time (IACT) of window i is defined by
The autocorrelation function derived from a short umbrellasimulation is typically very noisy. Sophisticated methods tocompute the IACT such as fitting of a single or doubleexponential to Ri(∆t) or any kind of binning analysis turnedout to be too unstable for the present purpose. Note that theIACT should be computed automatically for hundreds (orthousands) of possibly poorly converged Ri(∆t)’s. Therefore,we chose to compute τi,int directly via eq 9 but carried outthe summation only until Ri(∆t) dropped under a predefinedthreshold of 0.05.
Simulation Details. Test simulations were carried outusing the GROMACS simulation suite.11 As a test system,we have computed the PMF along the distance between twomethanol molecules in a vacuum. These simulations wereset up by placing one methanol molecule in the origin andplacing the second molecule at the distance �i
c of thecorresponding umbrella window. The molecules were ran-domly rotationally oriented. In addition, the initial distancebetween the two molecules was varied randomly by (σu,where σu ) �(kBT/K) denotes the width of the umbrellahistogram (assuming a flat underlying PMF). Here, K ) 800kJ/mol/nm2 is the umbrella force constant, kB is the Boltz-mann factor, and T is the temperature. The sampling wascarried out using a stochastic dynamics integrator (τ ) 0.07ps, T ) 300 K), with an independent random seed for eachsimulation. Lennard-Jones and electrostatic interactions werecomputed in direct space without a cutoff. Bonds wereconstrained using LINCS,17 allowing a time step of 2 fs.The umbrella positions were recorded every 10th step duringsimulations with a total simulation time of 50 ps and wererecorded at every step during simulations with a simulationtime of 4 ps. Methanol parameters were taken from theGROMOS96 force field.18 The methods applied to computethe PMF for the Rhesus channel Rh50 and for the lipidmembrane have been published elsewhere.19
Results and Discussion
Error Analysis for a Model System and a LipidMembrane PMF. As a test system, we compute the PMFof the center-of-mass distance between two methanol mol-ecules in a vacuum. Such a simple system allows us to carryout the complete set of umbrella simulations many times andhence to accurately compute the “true” statistical uncertaintyof the PMF. Subsequently, we test whether the bootstrapping
procedures are able to estimate the “true” uncertainty usingonly the data from one set of umbrella simulations.
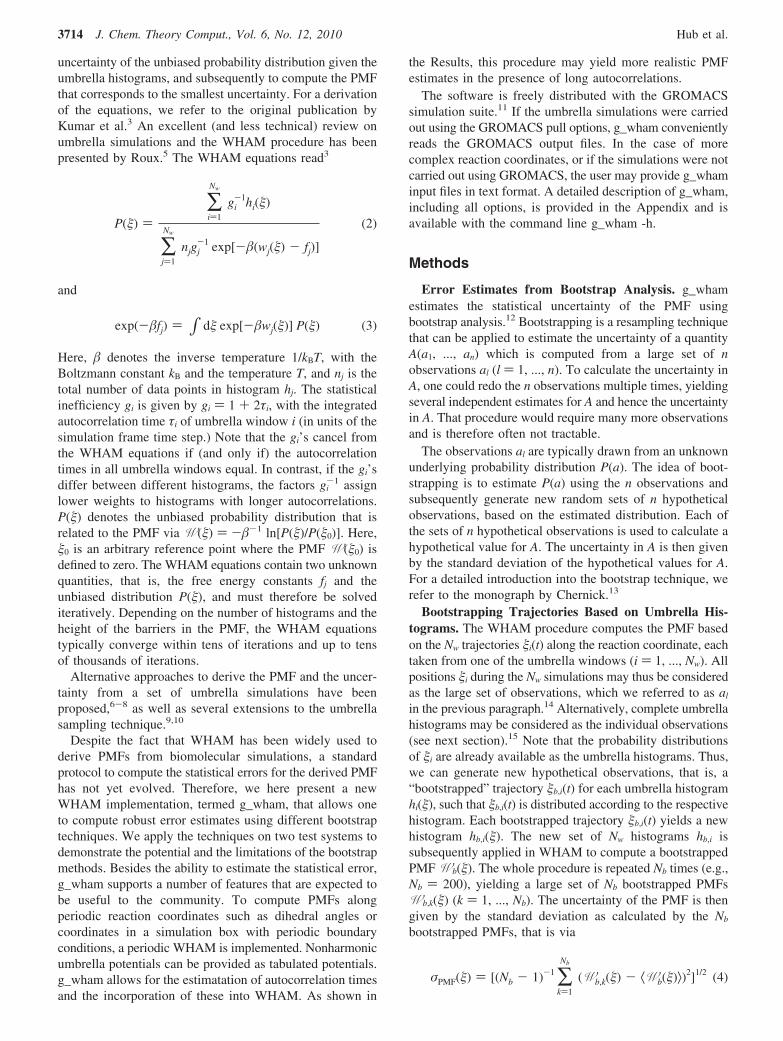
As a reference for the following discussion, Figure 1Apresents the converged PMF and Figure 1B, the respectiveumbrella histograms. Here, each of the 14 umbrella windowswas simulated for 3 ns, yielding well-converged statisticsas visible from the Gaussian histograms at a great distance�. The PMF at � ) 1.5 nm was chosen as a reference pointand defined to zero. To arrive at a flat PMF at a greatdistance, the PMF was corrected by kBT ln(4π�2), whichremoves the entropic decrease in the PMF because of theincrease in the number of configurations on a sphere of ra-dius �.20
To assess whether the bootstrapping procedure providesa reliable error estimate, we have repeatedly computed thesame PMF using limited statistics, with each umbrellawindow simulated for 50 ps. The nonconverged histogramsof one set of these umbrella simulations is shown in Figure2A. The complete set of umbrella simulations was carriedout 50 times with different initial random seeds for thestochastic forces and different initial orientations and veloci-ties of the methanol molecules, yielding 50 independentestimates for the PMF (Figure 2B). The uncertainty (67%confidence interval) for a single set of umbrella simulationsas derived from these 50 PMFs is plotted as a green curvein Figure 2D. Note that the error at z ) 1.5 nm equals zerosince all PMFs were defined to zero at that point. Next, anautocorrelated bootstrapped trajectory was generated for eachof the histograms plotted in Figure 2A using eqs 5, 6, and7, allowing one to compute a new “hypothetical” estimatefor the PMF based on the umbrella histograms. Thatbootstrapping procedure was repeated 200 times, yielding200 bootstrapped PMFs (Figure 2C, colored curves). Asexpected, the bootstrapped PMFs substantially differ, in linewith the 50 PMFs calculated from independent simulations(Figure 2B). The standard deviation computed from thebootstrapped PMFs (Figure 2D, black) is in good agreementwith the uncertainty calculated from the 50 independent
Ri(∆t) )⟨(�i(t) - ⟨�i⟩)(�i(t + ∆t) - ⟨�i⟩)⟩
σ�,i2
(8)
τi,int ) ∑∆t)1
∞
Ri(∆t) (9)
Figure 1. (A) Converged PMF (black curve) of the center ofmass distance between two methanol molecules in vacuum.(B) Converged umbrella histograms, each derived from a 3-nssimulation.
3716 J. Chem. Theory Comput., Vol. 6, No. 12, 2010 Hub et al.

simulations (Figure 2D, green), demonstrating that thebootstrapping procedure provides a reliable error estimatewithout the requirement to carry out new independentsimulations. Alternatively, the uncertainty was estimatedfrom trajectories that were bootstrapped from Gaussiandistributions with the average and width taken from therespective umbrella histogram (Figure 2D, red), yieldingalmost identical and hence equally accurate error estimates.
Biomolecular simulations naturally contain long autocor-relations. The histograms based on short umbrella simulationsmay therefore not represent all parts of phase space. Inaddition, the IACTs may be severely underestimated sinceslow transitions do not occur during the short simulations.
Consequently, bootstrapping trajectories based on thesehistograms (in combination with underestimated IACTs) willunderestimate the uncertainty. This fact is demonstrated inFigure 3A. To emulate umbrella sampling of a biomolecularsystem with long autocorrelations, we computed the PMFof the methanol distance based on 4 ps simulations (usingthe first 0.5 ps for equilibration), resulting in highly non-converged histograms. Ten independent umbrella simulationswere carried out for each of the 14 umbrella windowpositions, yielding 140 histograms. The whole set of umbrellasimulations was carried out 100 times, allowing one tocompute the true uncertainty (as one standard deviation) inthe PMF (Figure 3A, green curve). Figure 3A compares the
Figure 2. (A) Nonconverged histograms, each derived from50 ps simulations. (B) 50 PMFs derived from 50 fullyindependent sets of umbrella simulations. (C) PMF (blackcurve) derived from the set of nonconverged histograms (A).Autocorrelated trajectories were bootstrapped from the his-tograms shown in A 200 times, yielding 200 bootstrappedPMFs (colored curves in C). (D) Statistical uncertainty calcu-lated from the 50 independent simulations (green) shown inB and from the 200 bootstrapped PMFs (black) shown in C.Alternatively, the uncertainty was estimated from trajectoriesthat were bootstrapped from Gaussian distributions of theaverage and σ taken from the umbrella histograms (red).
Figure 3. Estimating uncertainties in the presence longautocorrelations. (A) The PMF along the methanol-methanoldistance (not shown) was computed from 140 umbrellahistograms, each derived from a 4 ps simulation. As areference, the uncertainty σPMF was computed from 100independent sets of umbrella simulations (green curve).Generating bootstrapped trajectories for each umbrella his-togram leads to an underestimated uncertainty (black curve).Estimating the uncertainty by bootstrapping complete histo-grams (red curve) or using the Bayesian bootstrap oncomplete histograms (blue curve) yields more accurate errorestimates. (B) PMF for ammonia permeation across a lipidmembrane containing 40 mol % cholesterol. (C) Statisticaluncertainty of the ammonia PMF computed by bootstrappingtrajectories for each umbrella histogram (black curve) and by(Bayesian) bootstrapping of complete histograms (red andblue curves).
g_whamsA Free WHAM Implementation J. Chem. Theory Comput., Vol. 6, No. 12, 2010 3717

true uncertainty to the estimated uncertainty derived fromthree different bootstrapping methods. Because the estimateduncertainties vary slightly between the different sets ofindependent umbrella simulations, Figure 3A plots estimateduncertainties averaged from 15 (of the 100) sets of umbrellasimulations. The uncertainty computed by bootstrappingtrajectories is shown as a black curve, demonstrating thatthis procedure greatly underestimates the uncertainty in thatcase. The red curve in Figure 3A presents the uncertaintyestimated by bootstrapping complete histograms. Here, thehistograms were grouped into 14 sets of 10 histograms, witheach group containing the 10 histograms at the same umbrellaposition. Consequently, 10 histograms were bootstrappedfrom each of the 14 sets, and the PMF was computed fromthe 140 bootstrapped histograms using WHAM. The wholeprocedure was repeated 200 times, providing 200 hypotheti-cal estimates for the PMF (not shown) and allowing one tocompute the uncertainty using eq 4. As visible from Figure3A, bootstrapping complete histograms yields a more ac-curate estimate of the uncertainty, despite the poor samplingwithin each umbrella window. The blue curve in Figure 3Apresents the uncertainty estimated using Bayesian bootstrap-ping of complete histograms, that is, by assigning randomweights to the individual histograms (see Methods). TheBayesian bootstrap also yields a reasonable error estimatebecause the method considers only complete histograms asindependent data points, similar to the bootstrapping ofcomplete histograms.
For a second comparison between the different bootstrap-ping methods, Figure 3B presents the PMF for ammoniapermeation across a biological membrane composed of thelipids POPE and POPC plus 40 mol % cholesterol. The flatregions at small and large z correspond to the ammoniamolecule in the two bulk water regions above and belowthe membrane, whereas the two maxima in the PMFcorrespond to the hydrophobic regions of the two membraneleaflets. The PMF has been computed from 656 histograms(not shown), each taken from 1 ns of simulation, where thefirst 50 ps were removed for equilibration. The initial framesfor the umbrella simulations at a specific z coordinate weregenerated by inserting ammonia at various randomly chosenpositions in the membrane plane, justifying the assumptionthat the histograms are independent. Figure 3C shows theestimated uncertainty computed via (i) bootstrapped trajec-tories (black), (ii) bootstrapping of complete histograms with12 histograms within each group (red), and (iii) Bayesianbootstrapping of complete histograms (blue). Method i yieldsa very small uncertainty of only 0.5 kJ/mol, whereas methodsii and iii yield an uncertainty of ∼2 kJ/mol at the mainbarriers in the PMF. Because considerable computationaleffort is required to compute the PMF in Figure 3B, wecannot compute the uncertainty from independent sets ofumbrella simulations for this example. However, Figure 3Csuggests that the individual histograms do not represent allaccessible areas of phase space, leading to an underestimateduncertainty as computed from method i. Presumably, slowtransitions on a multi-nanosecond time scale may affect thesampling in this case, whereas the autocorrelation analysisbased on the shorter simulations yields spuriously short
IACTs. In contrast to method i, methods ii and iii do notdepend on the accurate computation of the IACTs but onlyrequire the histograms to be independent. Therefore, methodsii and iii are expected to yield a reliable error estimate inthis case.
To estimate uncertainties in the presence of long (possiblyunknown) autocorrelations, we therefore suggest carrying outmany short umbrella simulations instead of a few long umbrellasimulations, such that each position along the reaction coordinateis covered by at least several independent histograms. Givensufficiently many independent histograms, the error can beestimated using bootstrapping of complete histograms or usingthe Bayesian bootstrap of complete histograms.
Effect of Autocorrelations. As visible from the WHAMequations, eqs 2 and 3, the IACTs cancel if (and only if) theIACTs are equal in all umbrella windows. In nonhomogeneoussystems, however, that assumption may not hold. An examplewould be umbrella simulations for solute permeation across alipid membrane or across a protein channel surrounded by bulkwater. Here, the IACTs of windows in the bulk are typicallylower than the IACTs of windows inside the lipid membraneor inside the protein channel. We found that neglecting theIACTs may lead to artifacts in particular when computing thePMF along a periodic reaction coordinate. As an example,Figure 4A presents a nonconverged PMF for ammonia perme-ation across the Rhesus protein channel Rh50 from N. europaea(Figure 4C). The PMF was derived from 365 400-ps histograms,taken from 500 ps simulations, using the first 100 ps forequilibration. The simulations were carried out with periodicboundary conditions, implying that a PMF for solute permeationshould yield the same free energy in the two bulk-water regionsbelow and above the channel. The black curve in Figure 4Awas computed by a nonperiodic WHAM. The PMF is notconverged, as apparent from the substantial offset of ∼15 kJ/mol between the two bulk-water regions. To account for theperiodicity of the system, a periodic WHAM assuming equalIACTs of all umbrella windows could be carried out (red curve).However, with equal IACTs, the WHAM procedure assignsequal weights to all histograms and, hence, equally distributesthe offset of 15 kJ/mol along the reaction coordinate to enforcea periodic PMF. As a consequence, an unphysical slope isinduced in the bulk-water regions of the PMF (|z| > 2 nm). Amore realistic procedure is therefore to compute the IACTs foreach umbrella window and to apply them within WHAM. TheIACT derived by direct integration of the autocorrelationfunction for the displacement for each umbrella window isplotted in Figure 4B as black dots. Because the IACTs cannotbe accurately computed from the limited sampling in theumbrella windows, we suggest smoothing the IACT along thereaction coordinate yielding a semiquantitative autocorrelationmeasure (Figure 4B, red curve). Whereas the IACTs are smallin bulk water, substantial autocorrelations limit the samplingwithin the channel, suggesting that the 15 kJ/mol is a conse-quence of slow sampling within the channel. The PMFcomputed by a periodic WHAM that takes IACTs into accountis shown in Figure 4A as a blue curve. As expected, the PMFis flat in the bulk-water regions (in agreement with thenonperiodic WHAM result, black curve), whereas corrections
3718 J. Chem. Theory Comput., Vol. 6, No. 12, 2010 Hub et al.

were introduced in the less sampled channel region to yield aperiodic PMF.
Converged PMFs for ammonia permeation across the Rh50channel as well as the biological implications have beenpublished elsewhere.19
Conclusions
We have presented a new WHAM implementation, termedg_wham, that is freely distributed with the GROMACSsimulation suite. The g_wham software is easy to use,flexible, and efficiently implemented. Statistical uncertaintiesare quantified using different bootstrap analysis methods: (i)bootstrapping of hypothetical trajectories based on theumbrella histograms together with the respective autocor-relation time, (ii) by bootstrapping complete histograms, or(iii) by using the Bayesian bootstrap of complete histograms,that is, by assigning random weights to the histograms. Wehave shown that method i provides an accurate error estimateif (and only if) the histograms are sufficiently converged. Ifthe histograms are affected by long autocorrelations, asfrequently occurrs in simulations of large biomolecules,methods ii and iii provide a more accurate error estimate. Innonhomogeneous systems such as a protein channel or a lipidmembrane surrounded by bulk water, the autocorrelationtimes may substantially vary along the reaction coordinate
and thus not cancel from the WHAM equations. Consistentapplication of the autocorrelations has here been shown toyield a more accurate estimate for the PMF in such systems,in particular when computing a periodic PMF.
Acknowledgment. This study was supported by aMarie Curie Intra-European Fellowship within the 7thEuropean Community Framework Programme, by the Max-Planck-Society, and by the Deutsche Forschungsgemein-schaft (SFB:803).
Appendix
g_wham Input Modes. A help file, including all commandline options, is provided by the g_wham tool via thecommand g_wham -h. g_wham supports three input modes.In modes 1 and 2, g_wham reads specific GROMACS files,These modes are thus convenient for GROMACS users. Inmode 3, g_wham reads only text files and is therefore suitablefor non-GROMACS users as well.
1. With option -it, the user provides a file which containsthe file names of the umbrella simulation run-input files(GROMACS tpr-files). In addition, with option -ix, theuser provides a file which contains the file names ofthe pull position output files (pullx.xvg etc.) writtenby the GROMACS mdrun program.
Figure 4. Effect of autocorrelations in a periodic WHAM. (A) Nonconverged PMF of ammonia permeation across the Rhesusprotein channel Rh50 (black). The limited sampling accounts for a substantial offset of ∼15 kJ/mol between the two end pointsof the PMF corresponding to the two bulk water regions. A periodic WHAM assuming equal integrated autocorrelation times(IACTs) accounts for the periodicity of the system (red curve) but induces approximately a linear slope in the complete PMF,including the well-sampled bulk water regions. Blue curve: PMF derived from periodic WHAM incorporating the calculated IACTs.The PMFs in the bulk-water regions are almost flat, in accordance with the bulk-water regions in the nonperiodic PMF (black).(B) IACTs calculated by direct integration of the autocorrelation functions (black dots), and by subsequent smoothing with aGaussian filter (red curve). (C) Simulation box of an Rh50 trimer embedded in a lipid membrane and solvated in water and 150mM electrolyte.
g_whamsA Free WHAM Implementation J. Chem. Theory Comput., Vol. 6, No. 12, 2010 3719

2. This mode is the same as mode 1, except that the userprovides with option -if a file which contains the filenames of the pull force output files (pullf.xvg etc.)written by the GROMACS mdrun program.
3. With option -ip, the user provides a file which containsthe file names of the pull output files written byGROMACS 3 (pdo files). pdo files are text files andcan be generated by non-GROMACS users. Each pdofile contains a header with the umbrella positions andforce constants, and the body contains the simulationtime versus the displacement of the system with respectto the umbrella center. The pdo file format (with atypical header) is explained with the g_wham help fileprovided with g_wham -h.
WHAM Options. Default values for the following optionsare listed in square brackets:
-min, -max: boundaries of the profile [0,0]-auto: determine boundaries automatically [yes]-bins: number of bins used [200]-temp: temperature in Kelvin [298.15]-tol: tolerance. The WHAM iterations stop when the
probabilities change less than the tolerance. [10-6]-b, -e, -dt: specify simulation times in picoseconds (begin,
end, time step) that are used in WHAM [50, infinity, 0]-cycl: periodic (or cyclic) WHAM [no]-tab: file name with tabulated potential in the case of
nonharmonic umbrella potentialsOutput Control-o: file name of PMF output file-hist: file name of histogram output file-histonly: write histograms and exit [no]-boundsonly: determine boundaries automatically and exit
[no]-log: write negative logarithm of the probabilities; that is,
enable output in energy units; otherwise, write probabilities[yes]
-unit: define energy unit (kJ/mol, kcal/mol, kBT) [kJ/mol]-zprof0: set profile to zero at this position [0]-sym: symmetrize profile around � ) 0 (useful for
membranes, for instance) [no]-v: verbose mode [no]Autocorrelation Handling-ac: calculate integrated autocorrelation times (IACTs)
using eqs 8 and 9 and use in WHAM [no]-acsig: smooth IACTs along reaction coordinate using a
Gaussian filter of width defined here [0]-ac-trestart: when computing the autocorrelation functions
for �i(t), restart the calculation after the time delay definedhere [1 ps]
-oiact: (smoothed) IACT output file name-iiact: IACT input file name. If the user prefers to calculate
the IACTs not using g_wham, the IACTs can be providedto g_wham using this option.
Bootstrapping Control-bsprof: output file name of all bootstrapped profiles-bsres: output file name with average and standard deviation
of bootstrapped profiles (that is, the uncertainty of the PMF)-nBootstrap: number of bootstraps carried out to estimate
the uncertainty (use, e.g., 100) [0]
-bs-method: bootstrap method applied (‘b-hist’, ‘hist’,‘traj’, or ‘traj-gauss’); Bayesian bootstrapping of completehistograms, bootstrap complete histograms, bootstrap newtrajectories from the umbrella histograms, or bootstrap newtrajectories from Gaussian distributions with average andwidth taken from the respective histogram [b-hist]
-bs-tau: specify integrated autocorrelation time used forall histograms with bootstrap methods ‘traj’ or ‘traj-gauss’;if not provided (default), use calculated IACTs (options -acand -acsig)
-histbs-block: number of histograms in one group withbootstrap method ‘hist’; histograms will be bootstrapped onlywithin each group separately; that procedure avoids gapswithout any histogram data along the reaction coordinate.
-bs-seed: random seed for bootstrapping (-1 generates aseed) [-1]
-vbs: verbose bootstrapping (output cumulative distributionfunctions for each histogram and a histogram file for eachbootstrapped PMF) [no].
References
(1) Kirkwood, J. G. J. Chem. Phys. 1935, 3, 300–313.
(2) Torrie, G. M.; Valleau, J. P. Chem. Phys. Lett. 1974, 28,578–581.
(3) Kumar, S.; Bouzida, D.; Swendsen, R. H.; Kollman, P. A.;Rosenberg, J. M. J. Comput. Chem. 1992, 13, 1011–1021.
(4) Ferrenber g, A. M.; Swendsen, R. H. Phys. ReV. Lett. 1989,63, 1195–1198.
(5) Roux, B. Comput. Phys. Commun. 1995, 91, 275–282.
(6) Kastner, J.; Thiel, W. J. Chem. Phys. 2005, 123, 144104.
(7) Kastner, J.; Thiel, W. J. Chem. Phys. 2006, 124, 234106.
(8) Shirts, M. R.; Chodera, J. D. J. Chem. Phys. 2008, 129, 124105.
(9) Bartels, C.; Karplus, M. J. Phys. Chem. B 1998, 102, 865–880.
(10) Souaille, M.; Roux, B. Comput. Phys. Commun. 2001, 135,40–57.
(11) Hess, B.; Kutzner, C.; van der Spoel, D.; Lindahl, E. J. Chem.Theory Comput. 2008, 4, 435–447.
(12) Efron, B. Ann. Stat. 1979, 7, 1–26.
(13) Chernick, M. R. Bootstrap Methods: A Guide for Practi-tioners and Researchers, 2nd ed.; Wiley-Interscience: NewYork, 2007.
(14) Grossfield, A. An implementation of WHAM: the weightedhistogram analysis method. http://membrane.urmc.rochester.edu/Software/WHAM/WHAM.html (accessed October 6, 2010).
(15) Hub, J. S.; de Groot, B. L. Biophys. J. 2006, 91 (3), 842–848.
(16) Rubin, D. B. Ann. Stat. 1981, 9, 130–134.
(17) Hess, B. J. Chem. Theory Comput. 2008, 4, 116–122.
(18) Van Gunsteren, W. F.; Berendsen, H. J. C. Gromos Manual;BIOMOS, Biomolecular Software, Laboratory of PhysicalChemistry, University of Groningen: Groningen, The Neth-erlands, 1987.
(19) Hub, J. S.; Winkler, F. K.; Merrick, M.; de Groot, B. L. J. Am.Chem. Soc. 2010, 132, 13251–13263.
(20) Neumann, R. Am. J. Phys. 1980, 48, 354–357.
CT100494Z
3720 J. Chem. Theory Comput., Vol. 6, No. 12, 2010 Hub et al.