g8 education limited 2012 interim results overview for personal … · 2012-08-26 · g8 education...
TRANSCRIPT

G8 Education Limited – 2012
Interim Results Overview
G8 Education Limited (ASX:GEM) 27 August 2012
For
per
sona
l use
onl
y
Page 2
Overview G8 Education’s child care portfolio comprises:
Australia
140 owned and contracted child care centres
Seven brands: Early Learning Services
World of Learning
Community Kids
Casa Bambini
Holiday Club
Kindy Patch
Headstart
Singapore
20 owned/operated child care centres
51 franchised child care centres F
or p
erso
nal u
se o
nly
Page 3
Significant events in HY12
Reported a 29% increase in revenue to $78m through a combination of organic and acquisition growth.
Reported a profit after tax of $6.78m in HY12 compared to $3.75m in HY11 which was a 66% increase in Earnings Per Share.
Reported an underlying Net Profit After Tax of $6.43m in HY12 against $4.45m in HY11, which represents a 44% increase.
Underlying EBIT of $10.1m in HY12 v $7.2m in HY11, an increase of 39%
Acquired an additional two child care centres and sold an underperforming child care centres in Australia.
For
per
sona
l use
onl
y

Page 4
Significant events in HY12
• Underlying Earnings Per Share increased in the half year from June 2011 to June 2012 by 32.6% from 2.4 cents to 3.2 cents per share
• Underlying NPAT has increased by
44.4% in HY 2012 compared to HY 2011.
• Like for like centre EBIT increase of
12% in HY12 compared to HY11 • Continuing strong cash NPAT to
underlying NPAT conversion at 92%. (30 June 2012 was a Saturday which resulted in one weeks revenue and wages being outstanding as at 30 June 2012).
-
0.50
1.00
1.50
2.00
2.50
3.00
3.50
-
1,000,000
2,000,000
3,000,000
4,000,000
5,000,000
6,000,000
7,000,000
HY10 HY11 HY12
June Half Year EPS & NPAT Growth
Underlying NPAT
Underlying EPS (cents)
30 June 2012 Half Year EPS & NPAT Growth
For
per
sona
l use
onl
y

Page 5
G8’s Vision & Mission
Quality Education & Care
To nurture and develop children’s minds, social skills and confidence in a safe and
stimulating environment
Employees
To commit to employee development and a rewarding culture which will ensure an
engaged and driven workforce
Community
To be responsive to local families and deliver upon community expectations
Profitability
To grow and derive value for shareholders through
innovative services, systems and management
A portfolio of outstanding early childhood education brands
Focus on the importance of early childhood education
Make good centres great through focusing on outstanding early childhood education management
Our mission is to be Australasia’s leading provider of high quality, developmental and educational child care services, and to achieve this through growth and sustainability.
For
per
sona
l use
onl
y

Page 6
Share Price
0
500,000
1,000,000
1,500,000
2,000,000
2,500,000
3,000,000
3,500,000
4,000,000
4,500,000
5,000,000
$0.00
$0.20
$0.40
$0.60
$0.80
$1.00
$1.20
Close Volume
For
per
sona
l use
onl
y

Page 7
2012 Interim Results Half-year ended 30 June 2012
For
per
sona
l use
onl
y

Page 8
2012 Interim Results
Source: Interim Report Lodged 27 August 2012
Consolidated
Half year 30 June ($’000) 2011 2012 Variance
Revenue 60,695 78,670 29.6%
Expenses (54,233) (68,376) 26.1%
Earnings Before Interest and Tax 6,462 10,294 59.3%
Interest (1,036) (1,190) 14.9%
Net Profit Before Tax 5,426 9,104 67.8%
Net Profit After Tax 3,746 6,781 81%
Less non-recurring abnormal transactions (post tax effect):
Write back deferred consideration to revenue - (629)
(Gain) / Loss on sale of non-current assets 530 (16)
Singapore court case legal expenses 178 80
Amortisation of NAB facility fee on refinance - 196
Share based payment expense - 19
Underlying Net Profit After Tax 4,454 6,431 44%
Underlying EPS (cents per share) 2.41 3.20 29% For
per
sona
l use
onl
y

Page 9
Australia
For
per
sona
l use
onl
y

Page 10
Child Care Centres – owned and contracted
Australian Centres Total centres
Queensland 59
New South Wales 47
Victoria 15
Australian Capital Territory 6
South Australia 13
Total centres 140
Total licence Capacity per day 10,383
Singapore Centres Total centres
Owned centres 8
Operated centres 12
Franchised centres 51
Franchisees seeking premises 10
Total centres 81
Total licence capacity per day for owned centres 618
For
per
sona
l use
onl
y
Page 11
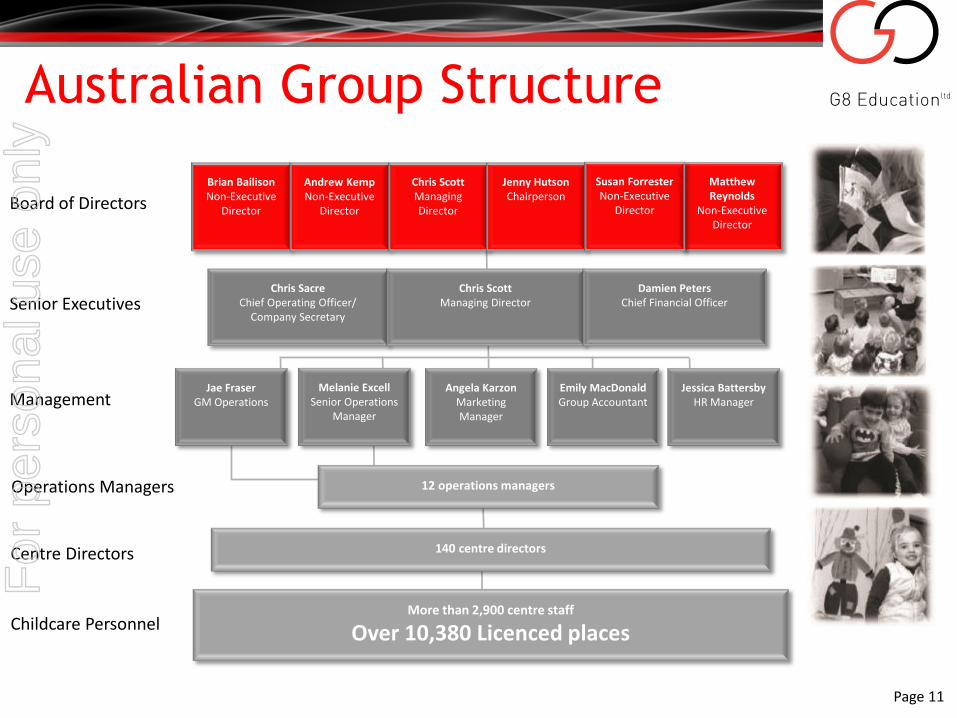
Australian Group Structure
Chris Sacre Chief Operating Officer/
Company Secretary
Chris Scott Managing Director
Damien Peters Chief Financial Officer
12 operations managers
140 centre directors
More than 2,900 centre staff
Over 10,380 Licenced places
Board of Directors
Senior Executives
Management
Operations Managers
Centre Directors
Childcare Personnel
Jae Fraser GM Operations
Melanie Excell Senior Operations
Manager
Angela Karzon Marketing Manager
Emily MacDonald Group Accountant
Jessica Battersby HR Manager
Matthew Reynolds
Non-Executive Director
Brian Bailison Non-Executive
Director
Andrew Kemp Non-Executive
Director
Chris Scott Managing Director
Jenny Hutson Chairperson
Susan Forrester Non-Executive
Director
For
per
sona
l use
onl
y

Page 12
Australian operations The trading environment continues to be positive with average 2012 occupancy across
centres currently exceeding 2011 levels.
Increase in occupancy on a like for like basis of 3.2% for HY12 against HY11.
The demand drivers for childcare remain strong:
The 0-5 year old population has grown by 183,000 since 2006, this increase is 6x the rate experienced over the prior 20 years
38 % of 0-5 year olds attending some form of childcare in 2011 against 33% in 2006 and 21% in 2000.
Since 2008 there has been a 32% increase in the number of children using childcare, which is almost twice the rate that Long Day Care (LDC) places are being created.
There has been a sharp decline in the rate of expansion of the LDC industry, measuring by the number of places in LDC centres, the industry’s CAGR from 2002 – 2008 was 9.5%, since 2008 the rate has slowed to just 3.2%
Government subsidies have been supportive, with the means tested child care benefit having increased 35% over the last 7 years and non means tested child care rebate having increased 88%. This compares to a 22% increase in CPI.
Source: Petra Capital paper on G8 Education Limited – The boom continues April 2012
For
per
sona
l use
onl
y

Page 13
Australian operations The new National Quality Standards were implemented from 1 January 2012 with 22 centres
within the portfolio being selected for assessment rating.
Up skilling of existing staff members continues to be well received with employees engaging in further studies for either the Bachelor or Diploma level qualifications in early childhood education.
Staff excellence remains a strong focus for the group with 12 staff members nominated for the HESTA national childcare awards for providing outstanding education as nominated by either colleagues or families.
Casa Bambini Blackburn was named in the top 5 childcare centres and preschools within Victoria in 2012 as nominated by parents.
Focus on providing a quality kindergarten curriculum has resulted in 34 centres being approved by the relevant state authority to receive the kindergarten funding. This funding only applies to QLD, VIC and SA.
Funding amount received has been applied to employ quality teachers, improve existing facilities and development of existing curriculum framework.
Implementation of a dedicated training role in head office to develop and deliver internal training for G8 staff members to increase professional development
For
per
sona
l use
onl
y

Page 14
Singapore operations Improvements of facilities in the owned centres have been completed and
resulted in favorable increases in occupancy and EBIT
Development of operations managers and centre directors to focus on delivering an exceptional educational learning experience for the children while focus on business deliverables
Cherie Hearts Update
• The Group is a defendant in proceedings before the High Court of Singapore in regards to the completion of a Business Acquisition Contract.
• Judgement was handed down on 11 April 2012.
• The trial judge awarded specific performance of the Business Acquisition Contract in favour of G8 Education Ltd. The plaintiff lodged an appeal in respect of the judge’s decision. G8 Education Ltd has cross claimed in the appeal.
• The appeal is scheduled for hearing in during the week commencing 3 September 2012.
For
per
sona
l use
onl
y

Page 15
Capital structure
Shares on issue at 30 June 2012 203,770,273
Net Debt at 30 June 2012
Senior debt facility with BankWest
$25.3 million
$50.0 million
Dividend Policy
Quarterly dividends to 65% cash payout ratio Dividend at 1.5 cents per share per quarter fully franked
For
per
sona
l use
onl
y

Page 16
Substantial shareholders
Shareholder Number of Shares Percentage holding
Perpetual Nominees Limited and subsidiaries 29.6 million 14.4%
Wallace Infrastructure Pty Ltd 24.0 million 12.0%
Northcape Capital Pty Ltd 16.7 million 8.34%
Paradice Investment Management Pty Ltd 14.8 million 7.4%
Challenger Limited 10.3 million 5.0%
For
per
sona
l use
onl
y

Page 17
Board of Directors
Jenny Hutson, B.Com, LLB, FAIM, Chairperson
Merchant banker and fund manager Experienced corporate adviser and company director Over 20 years experience in capital markets involving listed companies Member of the G8 Education Audit Committee.
Chris Scott, B.Econ(Hons), Managing Director Over 25 years experience in senior management positions including as founder and managing director of ASX listed S8
Limited which was an integrated travel company that made 36 acquisitions over 5 years and was capitalised at $700 million.
More than 20 years business in Singapore where he was involved in a number of successful businesses Exceptional operational, analytical and strategic skills critical in selection of potential acquisition.
Susan Forrester BA, LLB(Hons), EMBA, FAICD, Non-Executive Director Experienced company director with diverse portfolio career Keen focus on strategic development, corporate governance, brand and reputation management and
strategic human resources Currently a director of Ergon Energy and a senior consultant to Board Matters Pty Ltd which provides expert advice to
listed and unlisted boards on governance.
For
per
sona
l use
onl
y
Page 18
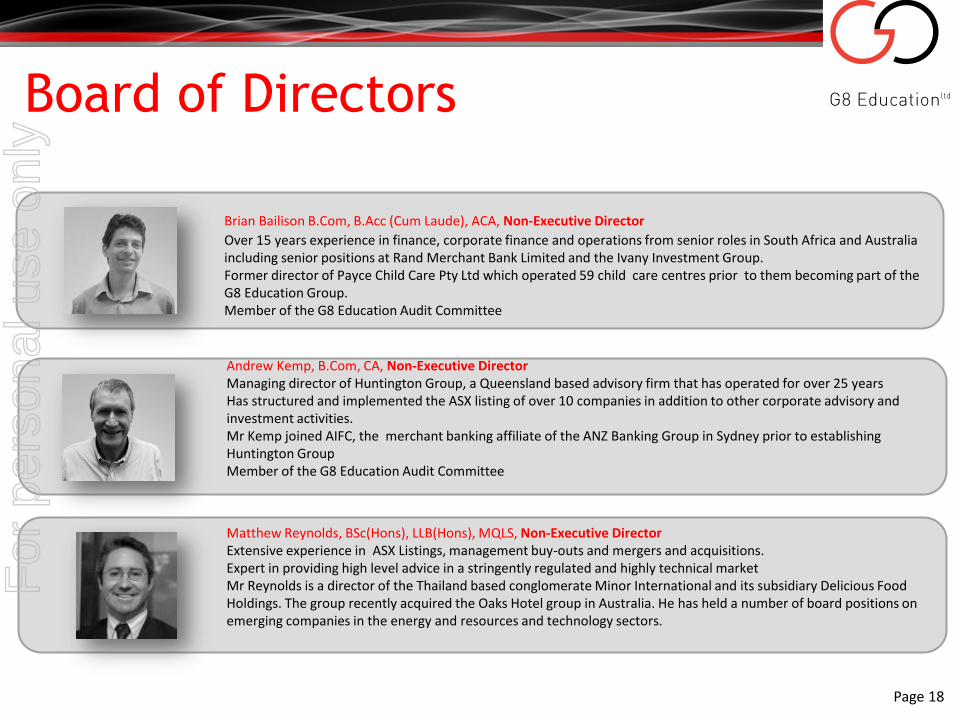
Board of Directors
Brian Bailison B.Com, B.Acc (Cum Laude), ACA, Non-Executive Director
Over 15 years experience in finance, corporate finance and operations from senior roles in South Africa and Australia including senior positions at Rand Merchant Bank Limited and the Ivany Investment Group.
Former director of Payce Child Care Pty Ltd which operated 59 child care centres prior to them becoming part of the G8 Education Group.
Member of the G8 Education Audit Committee
Andrew Kemp, B.Com, CA, Non-Executive Director Managing director of Huntington Group, a Queensland based advisory firm that has operated for over 25 years Has structured and implemented the ASX listing of over 10 companies in addition to other corporate advisory and investment activities. Mr Kemp joined AIFC, the merchant banking affiliate of the ANZ Banking Group in Sydney prior to establishing Huntington Group Member of the G8 Education Audit Committee
Matthew Reynolds, BSc(Hons), LLB(Hons), MQLS, Non-Executive Director Extensive experience in ASX Listings, management buy-outs and mergers and acquisitions. Expert in providing high level advice in a stringently regulated and highly technical market
Mr Reynolds is a director of the Thailand based conglomerate Minor International and its subsidiary Delicious Food Holdings. The group recently acquired the Oaks Hotel group in Australia. He has held a number of board positions on emerging companies in the energy and resources and technology sectors.
For
per
sona
l use
onl
y

Page 19
Questions?
For
per
sona
l use
onl
y