ga s m - wur e-depot home
TRANSCRIPT

GA S M ^
C*
: &H/5' - mm, .oei:--!
With special thanks to the sponsors of the workshop. - Agricultural University Wageningen, Netherlands - Bavaria BV, Lieshout, Netherlands - Coöperatieve Vereniging Suiker Unie U.A., Breda, Netherlands - Gist-brocades NV, Delft, Netherlands - Foundation LEB-fund, Wageningen, Netherlands - Ministry of Housing, Physical Planning and Environment of the
Netherlands - Pâques BV, Balk, Netherlands

Granular anaerobic sludge; microbiology and technology Proceedings of the GASMAT-workshop
Lunteren, Netherlands, 25-27 October 1987
G. Lettinga, A.J.B, Zehnder, J.T.C. Grotenhuis en L.W. Hulshoff Pol
•.I .' ; J : &c>"?'to«£<seg 59 [
87Ü0 AÂ WAGï^SNQHN f Vei.no. Oc370 - 19fe,3 £
^
Puduc Wageningen 1988
b 'Sï3

!>
CIP-data Koninklijke Bibliotheek, Den Haag
ISBN 90-220-0936-X NUGI 829
© Centre for Agricultural Publishing and Documentation, Wageningen, 1988
No part of this publication, apart form bibliographic data and brief quotations embodied in critical reviews, may be reproduced, re-recorded or published in any form, including print, photocopy, microfilm,electronic or electromagnetic record without written permission from the publisher Pudöc, P.O. Box 4, 6700 AA Wageningen, Netherlands.
Printed in the Netherlands

CONTENTS
Preface 1
MICROBIOLOGICAL ASPECTS 3
Energetics of syntrophic methane formation and the influence of aggregation - B. Schink and R.K. Thauer 5
Structure and microbial activities of granular anaerobic sludge - H.C. Djbourguier, G. Prensier and G. Albagnac 18
Aggregate formation in anaerobic gaslift reactors - G.R. Zoutberg, R. Mulder, M.J. Teixera de Mattes and O.M. Neijssel 34
Immobilization of anaerobic bacteria in methancgenic aggregates -J.T.C. Grotenhuis, E. Koornneef and CM. Plugge 42
Modeling granule growth in a propionate-fed uasbr - J.C. Kissel, J.T.C. Grotenhuis and A.J.B. Zehnder 48
Specific immunological probes for studying the bacterial associations in granules and biofilms - G. Prensier, /
H.C. rxibourguier, I. Thomas, G. Albagnac and M.N. Buisson 55 Pyruvate and fumarate conversion by a methancgenic propionate-
oxidizing coculture - F.P. Houwen, Cheng Guangsheng, G.E. Folkers, W.M.J.G. v.d. Heuvel and C. Dijkema 62
Anaerobic degradation of papermill sludge in a rudad-digester -C.G.M. Caerteling, H.J. Gijzen, H.J.M. Op den Camp, H.J. Lubberding and G.D. Vogels 71
Structural characteristics and metabolic activities of granular methancgenic sludge on a mixed defined substrate -H.C. rxibourguier, M.N. Buisson, J.P. Tissier, G. Prensier and G. Albagnac 78
Biofilm development in lab-scale methancgenic fluidized bed reactors - L.G.M. Gorris and J.M.A. van Deursen 87
Presence of viruses and other-potential bacterial predators in granular methancgenic sludges - G. Prensier, J.L. Roustan, H.C. rxibourguier and G. Albagnac 96
Colony formation and life cycles of anaerobic bacteria attached to surfaces - U. Szewzyk and B. Schink 102
EVALUATION REPORT MICROBIOLOGICAL ASPECTS 105
Report on the microbiological aspects of granulation - D.B. Archer 107
TECHNOLOGICAL ASPECTS 113
Immobilization of anaerobic biomass - M.S. Switzenbaum, J.P. Robins and R.F. Hickey 115
Granular sludge in UASB-reactors - W.J. de Zeeuw 132 The 'spaghetti theory' on anaerobic sludge formation, or the > inevitability of granulation - W.M. Wiegant 146 The selection pressure as a driving force behind the granulation of
anaerobic sludge - L.W. Hulshoff Pol, K. Heijnekamp and G. Lettinga 153

Physical properties of bacterial aggregates in a continuous-flow reactor with biomass retention - H.H. Beeftink and J.C. van den Heuvel 162
Light and scanning electron microscope observations on the granular biomass of experimental SBAF and HABR reactors -A. Tilche and X. Yang 170
Stability and control of UASB reactors treating potato-starch wastewater: comparison of laboratory and full-scale results -J.M. Paris, T. Vicent, M.D. Balaguer, C. Cassu, J. Cairo and J. Canals 179
Metal effect on microbial aggregation during upflow anaerobic sludge bed-filter (UBF) reactor start-up - S.R. Guiot, S.S. Gorur, D. Bourque and R. Samson 187
Granulation results in anaerobic fluidized bed reactors - J. Iza, P.A. Garcia, I. Sanz and F. Fdz-Polanco 195
Granulation of denitrifying sludge - J.P. van der Hoek 203 Growth of granular sludge in the biopaq IC-reactor -
P.J.F.M. Hack, S.H.J. Vellinga and L.H.A. Habets 211 Sodium inhibition of acetoclastic methanogens in granular sludge
from a UASB reactor - A. Rinzema, J. van Lier and G. Lettinga 216 Start-up of a UASB reactor on a carbohydrate substrate -
R. Sierra-Alvarez, L.W. Hulshoff Pol and G. Lettinga 223 Physical and biological factors influencing the growth of
anaerobic granular sludge - D.J. Wijbenga and H.Th.P. Bos 229
EVALUATION REPORT TECHNOLOGICAL ASPECTS 235
Report on the technological aspects of granulation - E. Colleran 237
List of participants 241
Advertisements 251
<*
J

PREFACE
The formation of anaerobic granular sludge and biofilms on mobile and
stationary support material has in recent years attracted the interest of
both microbiologists and engineers. Immobilization of anaerobic microbial
populations has proven to be a powerful tool for the development of new
wastewater technologies. Though knowledge on biofilm and granule formation
is expending, still many questions remain to be answered.
To obtain a more efficient transfer of knowledge between engineers and
microbiologists we decided to organize a workshop in which scientists of
both disciplines were invited to discuss the recent advances in anaerobic
granule and biofilm formation including their possible new applications.
This publication arose from this workshop which was held from 25-27
October, 1987 in Lunteren, The Netherlands. The presentations during the
workshop are given in the different chapters and the discussions of the two
days have been summarized and critically evaluated by two rapporteurs. We
hope that this book will act as a stimulus for a more intense collaboration
between microbiologists and engineers, in order to fully exploit the poten
tial of immobilized biomass in wastewater treatment and other biotechno-
logical processes which are of environmental importance.
It is not only appropriate but also a pleasure to acknowledge the people
who helped to made this workshop a success. They are Paul de Jong, Titia
Kalker, Eddie Koornneef, Carolien Plugge and Marieke Smit.
Wageningen, November 1987 The editors
Microbiological aspects

ENERGETICS OF SYNTROPHIC METHANE FORMATION AND THE INFLUENCE OF AGGREGATION
B. Schink1 and R. K. Thauer2
'Lehrstuhl Mikrobiologie I, Eberhard-Karls-Universität, Auf der Morgenstelle 28, D-7400 Tübingen, W.-Germany
2 Fachbereich Biologie - Mikrobiologie, Philipps-Universität. D-3550 Marburg, W.-Germany
Summary
Complex organic matter is converted to CH* and CO2 by anaerobic microbial communities. The free energy change associated with the overall conversion is small, and has to be shared by two to four groups of bacteria. The primary fermenters which convert the organic matter to acetic acid, COz , H2 and reduced products such as lactic acid, propionic acid, and butyric acid, use up most of the free energy available. The so-called secondary fermenters or obligately proton-reducing bacteria which convert the reduced fermentation products of the primary fermenters to rnethanogenic substrates have to share fractions of ATP-equivalents with the hydrogen-oxidizing and acetate-utilizing rnethanogenic bacteria. The cooperation between the partner organisms in such syntrophic relationships is optimal if the di f fnsion distance for transfer metabolites (H2 , acetate) is as small as possible. Aggregation of bacteria of different trophic groups is of high importance for the energetics and kinetics of substrate conversion in rnethanogenic microbial communities, therefore. This problem is being discussed on the basis of theoretical considerations as well as data available from ecological studies.
Introduction
Oxygen serves two main functions in the microbial degradation of organic matter: It participates as a reaction partner in oxygenase reactions involved in the primary attack on substrates such as hydrocarbons, aromatic or ether compounds, and it acts as an acceptor for electrons derived during the oxidation of organic matter to CO2 . If the compounds usually degraded in oxygenase reactions are degraded in the absence of oxygen at all, this degradation has to proceed via pathways completely different from those used in the presence of oxygen. Such pathways have been worked out in the recent past for several types of compounds often considered to be nondegradable in the absence of oxygen, and it turned out that the degradation potential of anaerobic microbial communities is by far greater than commonly assumed (Evans, 1977; Young, 1984; Schink, 1986; Schink, 1988).
In some cases, anaerobic breakdown of certain substrates proved to be even more efficient and to produce less toxic degradation intermediates than aerobic degradation, e. g. in
the case of chlorobenzoates (Su et al., 1983; Boyd and Shelton, degradation of certain environm phenols, aromatic amines and ni high interest in the recent pas treatment of such waste constit dependent, radical formation to polymers which resist any furth presence or absence of oxygen, degradation of surfactants, ana treatment are desirable because occurring in aerated activated Schink, 1937) .
Whereas the role of oxygen a oxygenase reactions depends on and cannot be performed by any electron acceptor in the oxidat organic matter can be taken ove compounds, such as nitrate, sul free energy change of the compl matter is calculated here for g (all calculations are based on et al. , 1977) : -
flita et al., 1982; Horowitz 1984). The anaerobic
ental pollutants tro derivatives h
such as as gained
t, therefore, because uents often leads the production of er degradation ei In other cases su erobic techniques
of enormous foam sludge basins (Wa
via aerobic oxygen-
phenolic ther ;h as for
in the
waste formation
:iener and
s a reaction partner m its unique electron structure other molecule, its role as an ion of easily degradable r readily by other oxidized fate, or carbon dioxide. The ete oxidation of organic lucose as a model substrate the tables published in Thauer
C6 Hi 2 0 6 + 6 0 2
C I H I Ï O S , + 4 . 8 NO;." + 4 . 8 H'
C6 Hi 2 Ot + 3 SO4 'l~ + 3 H'
C6 Hi 2 0 6
> 6 CO2 + 6 H2O ( 1 ) A G o ' = - 2 8 3 0 k J / m o l
> 6 CO2 + 2 . 4 N2 + 8 . 4 H 2 0 ( 2 ) ÄGo ' = - 2 6 7 0 k J / m o l
> 6 CO2 + 3 HS- + 6 H2O ( 3 ) A Go' = - 5 1 0 k J / m o l
> 3 CH< + 3 C0 2 ( 4 ) AGo ' = - 3 9 0 k J / m o l
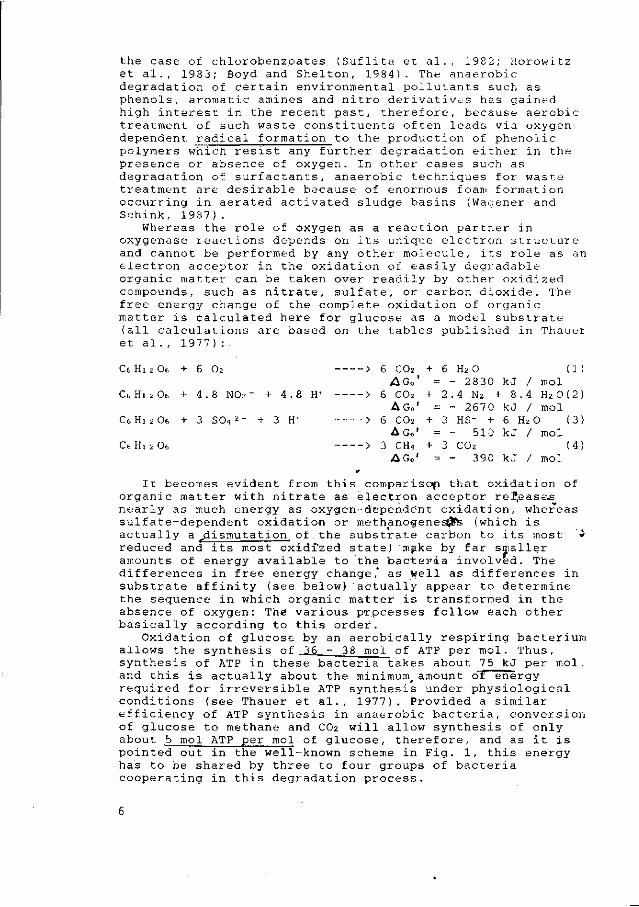
It becomes evident from this comparison that oxidation of organic matter with nitrate as electron acceptor releases nearly as much energy as oxygen-dependént oxidation, whereas sulfate-dependent oxidation or methanogenes^Ts (which is actually a jjismutation of the substrate carbon to its most < reduced and its most oxidized state) make by far smaller amounts of energy available to the bacteria involved. The differences in free energy change,* as well as differences in substrate affinity (see below) actually appear to determine the sequence in which organic matter is transformed in the absence of oxygen: The various processes follow each other basically according to this order.
Oxidation of glucose by an aerobically respiring bacterium allows the synthesis of 36 - 38 mol of ATP per mol. Thus, synthesis of ATP in these bacteria takes about 75 kJ per mol, and this is actually about the minimum, amount o'f energy required for irreversible ATP synthesis under physiological conditions (see Thauer et al., 1977). Provided a similar efficiency of ATP synthesis in anaerobic bacteria, conversion of glucose to methane and CO2 will allow synthesis of only about 5 mol ATP per mol of glucose, therefore, and as it is pointed out in the well-known scheme in Fig. 1, this energy has to be shared by three to four groups of bacteria cooperating in this degradation process.

BIOLOGICAL POLYMERS
HYDROLYTIC A N D FERMENTATIVE MICROORGANISMS
ALCOHOLS,
CARBOXYLIC ACIDS
(except a c e t a t e )
HYDROGENOPHIUC
METHANOGENS
Fig.1 : Carbon and electron flow in a methanogenic ecosystem with complete conversion to methane and C0 o (after Zehnder et al. 1982)
Glucose
2 ATP
2 CO-
2.6 H_
-* 2 NADH + H+ 4" S
2.6 FdH„
2 Pyruvate
2 Acetyl-CoA I
/ ^ 0. 6 ATP „ N _ * 0. 7 ATP
O.6 Acetate 0.7 Butyrate
Fig. 2: Variable thermodynamic efficiency in glucose fermentation by Clostridium sp. Explanations in the text. (After Thauer et al., 1977).
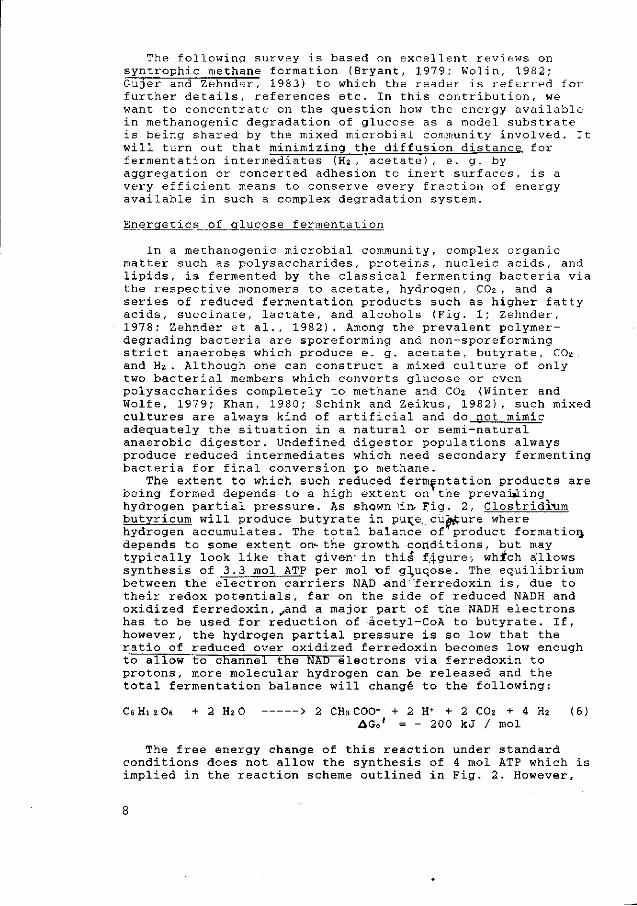
The following survey is based on excellent reviews on syntrophic methane formation (Bryant, 1979; Wolin, 1982; Gujer and Zehnder, 1983) to which the reader is referred for further details, references etc. In this contribution, we want to concentrate on the question how the energy available in methanogenic degradation of glucose as a model substrate is being shared by the mixed microbial community involved. It will turn out that minimizing the diffusion distance for fermentation intermediates (H2 , acetate), e. g. by aggregation or concerted adhesion to inert surfaces, is a very efficient means to conserve every fraction of energy available in such a complex degradation system.
Energetics of glucose fermentation
In a methanogenic microbial community, complex organic matter such as polysaccharides, proteins, nucleic acids, and lipids, is fermented by the classical fermenting bacteria via the respective monomers to acetate, hydrogen, ÇO2 , and a series of reduced fermentation products such as higher fatty acids, succinate, lactate, and alcohols (Fig. 1; Zehnder, 1978; Zehnder et al., 1982). Among the prevalent polymer-degrading bacteria are sporeforming and non-sporeforming strict anaerobes which produce e. g. acetate, butyrate, CO2 . and H2 . Although one can construct a mixed culture of only two bacterial members which converts glucose or even polysaccharides completely to methane and COz (Winter and Wolfe, 1979; Khan, 1980; Schink and Zeikus, 1982), such mixed cultures are always kind of artificial and do not mimic adequately the situation in a natural or semi-natural anaerobic digestor. Undefined digestor populations always produce reduced intermediates which need secondary fermenting bacteria for final conversion to methane.
The extent to which such reduced fermentation products are being formed depends to a high extent on the prevailing hydrogen partial pressure. As shown^in- Fig. 2, Clostridium butyricum will produce butyrate in pure, cuifure where hydrogen accumulates. The total balance of product formation, depends to some extent on- the growth conditions, but may typically look like that given' in thil figure,-, whfch allows synthesis of 3.3 mol ATP per mol <o£ g^uqose. The equilibrium between the electron carriers NAD and"ferredoxin is, due to their redox potentials, far on the side of reduced NADH and oxidized ferredoxin, and a major part of the NADH electrons has to be used for reduction of äcetyl-CoA to butyrate. If, however, the hydrogen partial pressure is so low that the ratio of reduced over oxidized ferredoxin becomes low enough to allow to channel the NAD electrons via ferredoxin to protons, more molecular hydrogen can be released and the total fermentation balance will changé to the following:
Ce Hi 2 Oe + 2 H2O > 2 CH3COO- + 2 H+ + 2 CO2 + 4 H2 ( 6 ) AGo ' = - 2 0 0 k J / m o l
The free energy change of this reaction under standard conditions does not allow the synthesis of 4 mol ATP which is implied in the reaction scheme outlined in Fig. 2. However,

if the hydrogen partial pressure is lowered to 1Q-11 bar, a value rather close to natural conditions (see below), the reaction releases 290 kJ / mol in agreement with the postulated synthesis of 4 ATP. It appears from this consideration that a low hydrogen partial pressure increases significa.ntly the energy gain of hydrogen-releasing primary fermenting bacteria, and that the amount of reduced fermentation intermediates, e. g. butyrate, depends strongly on the hydrogen partial pressure. Therefore, the cooperation between primary fermenters and methanogenic bacteria is not a "metabiontic" one as assumed earlier (Toerien and Hattingh, 1969) but the methane bacteria exert a profound influence via the hydrogen partial pressure back on the primary fermenters.
From the above considerations it also becomes evident that the primary fermenting bacteria take the lion's share. namely, 3-4 ATP, of the 5 ATP available during methanogenic glucose fermentation. Only relatively little, energy is left over for the secondary fermenters and the methanogenic bacteria.
Energetics of butyrate fermentation
The fermentation of butyrate to acetate and hydrogen is a highly endergonic reaction under standard conditions:
CHs CH2 CHz COO- + 2 H2 0 > 2 CH3 COO" + H* + 2 H2 / ( 7 )
A G , ' = + 4 8 k J / m o l
This reaction can occur only if the equilibrium is shifted to the right side, e. g. by removal of one of the reaction products:
4 H2 + C0 2 > CH4 + 2 H 2 0 ( 8 ) A Go' = - 1 3 1 k J / m o l CH4
Multiplication of the first reaction by 2 and addition of both leads to the overall reaction:
2 CH3 CH2 CH2 COO- + C0 2 + 2 H 2 0 > 4 CH3COO~ + CH4 + 2 H* ( 9 ) AG»' = - 34 kJ / 2 mol butyrate
This is the reaction of anaerobic butyrate oxidation first described by Barker (1936) and later by Stadtman and Barker (1951) for a non-defined mixed culture ("Methanobacterium suboxydans") and defined mixed cultures growing by catalyzing this reaction have been isolated repeatedly in the recent past (Mclnerney et al., 1979; Shelton and Tiedje, 1984; Stieb and Schink, 1985). In these cultures as well as in undefined digestor populations, oxidation of butyrate to acetate becomes possible if the hydrogen partial pressure is being kept low enough by the methanogenic bacteria. Nonetheless, such a culture again is kind of artificial since in a natural system the acetate formed does not accumulate but is degraded by acetotrophic methane bacteria:
CH3COO- + H+ > CH4 + C02 (10) AG»' = - 36 kJ / mol

Combining eq. (9) and (10) yields the energy balance for the whole process of methane formation from butyrate:
2 CH3 CH2 CH2 COO- + 2 H* + 2 H2 0 > 5 CH- + 3 CO2 (11) AG»' = - 177 kJ / 2 mol butyrate
If we use concentrations for the respective reactants in this equation which are close to the conditions prevailing in a methanogenic digestor (butyrate: ImM, CH-i and CO2 : 1 bar) , the free energy change of the overall reaction changes to - 143 kJ. This total reaction is being catalyzed by a community of three different bacteria, a proton-reducing fermenter, a hydrogen-oxidizing, and an acetate-cleaving methanogen. The partial reactions, eq. (7), (8), and (10), have to run twice, once, and four times, respectively, yielding a total of 7 reactions in a whole sequence. If we assume that all partial reactions share equal parts of the total energy available, the free energy change for every partial reaction is about - 20 kJ / mol (Fig. 3 ) :
do" 4 ' 6 bar) CO_ (1 .0 bar) A^
( 1 .0 mM) / - 20 kJ
2 Butyrate
-• CH (1.0 bar)
-20 kJ \ M 4 CH4 (1.0 bar)
4 Acetate < (1.0 mM) - 20 kJ *4 C02 (1.0 bar)
Fig. 3: Assumed steady-state metabolite concentrations and corresponding free energy phang^s in.methanogenic'butyrate degradation *^
One can use these energy gains of every,partial reaction to calculate the corresponding concentrations of thfe ' fermentation intermediates acetate a,ndi hydrogen, and ends up with concentrations in the range.of 'those measured in e. g. digestor sludge,, i. e. acetate: ImM; pH2 : 10~ 4 - 6 bar («•0.1 JJ.M) . Thus, t|ie assumption appears reasonable that the free energy available is being shared to nearly equal parts by all three types of bacteria involved in this process, and the question arises how this small amount of energy per partial reaction can be used for ATP synthesis.
Energy sharing among the fatty acid-'degrading bacteria
It becomes evident from the above considerations that the total free energy change available in butyrate conversion to methane (eq. 11) allows, depending on the actual substrate concentrations applied, conservation of 20 - 25 kJ per mol partial reaction. This is an amount of energy in the range of
10

one third of an ATP equivalent (see above). Evidence has been provided in the recent past that bacterial membrane-bound ATPases, similar to those studied in mitochondria and chloroplasts, couple synthesis of one molecule of ATP with the transfer of 3 protons across the membrane (Maloney, 1983). Thus, the equivalent of 1 transported proton is the smallest amount of energy which can be converted into biologically useful energy, meaning: into ATP synthesis. Although it is by far too early to generalize that all proton ATPases in the microbial world will operate with the same stoichiometry, this assumption allows at present to explain why 1/3 of an ATP is the minimum energy quantum which can support microbial energy metabolism. In the recent past, bacteria have been isolated which are able to grow with reactions releasing energy in this range (Pfennig and Biebl, 1976; Schink and Pfennig, 1982), and acetate cleavage by methanogenic bacteria is another example of a reaction supporting bacterial growth with an amount of free energy in the range of 1/3 ATP.
The biochemistry of fermentative butyrate oxidation has been described recently (Wofford et al. 1986). It proceeds via the classical ß-oxidation pathway which allows a net synthesis of 1 ATP per mol of butyrate by substrate level phosphorylation in the acetate kinase reaction. Two of the electrons derived during this oxidation arise at a redox potential of -190 mV (ß-hydroxybutyryl CoA dehydrogenase') , the other two at -126 mV (butyryl CoA dehydrogenase; Gustafson et al., 1986). It is not clear at present whether the hydrogen partial pressure in the medium can be lowered far enough to simply "pull" these electrons to the potential of free hydrogen and release them as such. It can be speculated that the butyrate-fermenting anaerobe spends part (2/3 ?) of the ATP synthetized in the acetate kinase reaction to drive a reversed electron transport reaction to release the electrons at a lower redox potential (Thauer and Morris, 1984). With this, 1/3 of an ATP would remain available to the butyrate fermenter s energy metabolism, and it would help the methane bacterium to take up its hydrogen at a concentration which allows it sufficient ATP synthesis as well. Fermentation of propionate to acetate, CO2 and hydrogen has to meet similar problems as described for butyrate. The syntrophic oxidation of propionate probably proceeds via the succinate pathway (Koch et al., 1983; Schink, 1985) which would yield 1 ATP by substrate level phosphorylation in the acetate kinase reaction, and three pairs of electrons at redox potentials of - 190, - 30, and - 500 mV, respectively. Especially the electrons released in the succinate dehydrogenase reaction would need to be shifted to a potential low enough to reduce protons, and such a reverse electron transport driven by a membrane-bound ATPase could require again the equivalent of 2/3 ATP. Evidence of such an anaerobic reverse electron transport system has recently been obtained with the acetate-oxidizing, sulfur-reducing Desulfuromonas acetoxidans: In this bacterium, the transfer of electrons from succinate to sulfur (Eo = -30 and -270 mV, respectively) is coupled to a proton translocation across the cytoplasmic membrane (Paulsen et al., 1986). It has still to
11

D25°C = Diffusion constant for H2
d
J ^ - A - D - —-;— mol-sec"
4 .9 • IO"5cm2- sec"1
A = Surface area of H 2
forming bacterium
= 4 7rr2
c = Concentration of H2 in water
d = Distance between H 2 - forming and H2 - consuming bacteria
Fig. 4: Calculation of hydrogen flux from a hydrogen-producing to a hydrogen-oxidizing bacterium
I0 9 cells/ml 10s cells/ml
equal distr ibution
cluster "^ formation.
d = 8 j jm r = I j jm C,= 0 :05JJM
C 2 = 0 . 0 0 5 J J M
3 H2 = IQnmol H2
min- ml
d = 0.08 jjm r = I jjm Ci = 0 .05JJM
c2= 0.005 JJM
J H2~-IQOOnmol H 2
min • ml
Fig. 5: Effect of diffusion distance on the hydrogen flux between two types of bacteria, either in suspended (left) or aggregated distribution (right).
12

be proven whether analogous systems work in the syntrophic fatty acid-oxidizing bacteria.
The effect_qf_ diffusion distance
The diffusion of hydrogen from a hydrogen producer to a hydrogen consumer can be described by a simple diffusion equation (Fig. 4 ) : The flux of hydrogen is directly proportional to the surface area of the producing bacterium and the concentration difference at the surfaces of both partners, and it is inversely proportional to the diffusion distance. The distance term is especially of interest with very small distances as described in the following example (Fig. 5 ) :
A mixed culture of two partner organisms cooperating in interspecies hydrogen transfer is assumed to contain 109
cells per ml. If the cells are homogeneously dispersed through the medium, the average distance of the cells to each other is about 8 urn. If the same bacteria form aggregates and thus minimize the diffusion distance to 1/100 of the original one, the hydrogen flux increases 100 fold. As long as the hydrogen diffusion is the rate-limiting factor in the cooperation of the partner organisms (as appears to be the case with all fatty acid-degrading syntrophic associations), the formation of cell clusters can have a very severe effect on growth and substrate degradation kinetics.
The importance of this consideration has been demonstrated recently in a simple experiment. A mixed culture of a syntrophic ethanol-oxidizing and a homoacetogenic bacterium converted ethanol with CO2 to acetate according to the following equation:
2 CH3 CH2 OH + 2 CO2 > 3 CH3 COO- + 3 H' A Go' = - 92.4 kJ / 2 mol ethanol
The hydrogen concentration in the homogeneously mixed culture reached a maximum of 5 uM in the early logarithmic phase, and the doubling time of the total culture was about 7 hours. If the two partner organisms were separated by a dialysis membrane, the hydrogen concentrations in the producer's and the consumer's compartment differed considerably (^24 and 6 3 JUM, respectively), and the doubling times of both partners increased to 14 - 18 hours (Stieb and Schink, 1987) . This simple experiment demonstrates that even in the syntrophic oxidation of ethanol which is energetically much more favourable than fatty acid oxidation, hydrogen diffusion can be the rate-limiting step in substrate degradation and bacterial growth.
Hydrogen transfer in sediments and sludges
Techniques have recently become available which allow to measure the partial pressure as well as the formation and consumption rate of hydrogen in sediment and sludge samples. Comparison of the hydrogen flux in such samples with the corresponding rate of CO2 reduction to methane revealed that only about 5 - 6 % of CO2-dependent methane formation can be
13

covered by the measurable hydrogen flux (Conrad et al.,1985). This discrepancy was explained as a consequence of compartmentalization within the sediment structure: Hydrogen-producing and hydrogen-forming bacteria may live in close contact to each other ("iuxtapositioning") and the hydrogen flux between the two partners may not be accessible to the measurement technique applied. The same conclusion was drawn from calculations of the Gibb s free energy changes for fatty acid oxidation reactions under in situ conditions (Conrad et al., 1986). Further experiments on methane formation in the anoxic sediments of the holomictic Lake Mendota provided evidence that the discrepancy of hydrogen flux and CO2 reduction rate increased during the stratification period (Conrad et al., 1987). This result could mean that the efficiency of interspecies hydrogen transfer increases during the summer stratification period due to growth of the partner bacteria in close contact to each other. Structural relationships between the syntrophic partners become important with this view, therefore, and this is well demonstrated also by electron microscopical studies of sludge pellets (Dubourgier and Prensier, this meeting report).
From this point of view, the outcome of the competition between sulfate-reducing and methanogenic bacteria for hydrogen and acetate, which has so far mainly been interpreted as simply a consequence of different substrate affinity constants (Kristjansson et al., 1982; Schönheit et al., 1982; Kristjansson and Schönheit, 1983) has to be revised to give rise to a more structurally oriented approach. The efficiency of metabolite transfer between different trophic groups in a mixed microbial community will depend to a high degree on the diffusion distance between partner organisms, and a high heterogeneity of the microstructure of such a community can -influence the outcome of this competition by far more than small differences in substrate affinities. , '.-, 1 • .' »
A very special case of, compartmentaliza*ion within the anaerobic sediment community appears to be the engulfment 0$ methanogenic bacteria by-anaerobic protozoa (van Bruggen et al., 1983; van Bruggen et al. ,' .1985) .,* Dqj.ng so, tÄe \ fermenting protozoa choose their »hydrçgen-oxidizing partner very definitely, and we do not know y'ët what the selection criteria are. However, this is not a problem of bacterial aggregation any more^and cannot, .be treated in detail here, therefore.
Outlook
Aggregation and concerted attachment to surfaces is a very efficient way of shortening diffusion' distances between different kinds of bacteria. Especially anaerobes depend to a high extent on an efficient transfer of hydrogen and other intermediate metabolites, and just anaerobic habitats such as sediments and sludges are characterized by the presence of nearly unlimited amounts of surfaces. A look with a microscope at a sediment or sludge sample demonstrates that the majority of bacteria in such an environment is attached to
14

surfaces, and that the free-floating cell is more the exception than the rule. Nonetheless, the classical techniques for cultivation and isolation of bacteria still select for bacteria growing in dispersed cultures, and only recently suited techniques for the selection of surface-associated anaerobic bacteria have been developed (Szewzyk and Pfennig, 1986). Perhaps the study of syntrophic bacteria isolated with similar techniques will help us to answer some interesting questions, e. g. how syntrophic aggregates grow. Since the different partners in a surface-associated community each can give rise only to cell clusters of identical offspring which, however, depend on close cooperation with bacteria in a different cluster, growing syntrophic aggregates would need to be "rearranged" from time to time to improve the metabolite transfer between the partners. Thus, in this case, a developing order has to be destroyed periodically to improve the system's efficiency, a situation quite opposite to the creation of order in the development of a multicellular higher animal or plant. Perhaps anaerobic microbial communities will yield more surprises to exemplify that, multicellular organizations developed into more than the one solution which is usually considered to be the only successful one for life on earth.
Re f e rences
Barker, H.A., 1936. On the biochemistry of the methane fermentation. Arch. Microbiol. 7:404-419.
Boyd, S.A. & D.R. Shelton, 1984. Anaerobic biodégradation of chlorophenols in fresh and acclimated sludge. Appl. Environ. Microbiol. 47:272-277.
Bryant, M .P., 1979. Microbial methane production - theoretical aspects. J. Anim. Sei. 48:193-201.
Conrad, R., T.J. Phelps & J.G. Zeikus, 1985. Gas metabolism evidence in support of the juxtaposition of hydrogen-producing and methanogenic bacteria in sewage sludge and lake sediments. Appl. Environ. Microbiol. 50:595-601.
Conrad, R., B. Schink & T.J. Phelps, 1986. Thermodynamics of H2-consuming and H2-producing metabolic reactions in diverse methanogenic environments under in situ conditions. FEMS Microbiol. Ecol. 38:353-360.
Conrad, R., F.S. Lupton & J.G. Zeikus, 1987. Hydrogen metabolism and sulfate-dependent inhibition of methanogen-esis in a eutrophic lake sediment (Lake Mendota). FEMS Microbiol. Ecol. 45:107-115.
Evans, W.C., 1977. Biochemistry of the bacterial catabolism of aromatic compounds in anaerobic environments. Nature (London) 270:17-22.
Gujer, W. & A.J.B. Zehnder, 1983. Conversion processes in anaerobic digestion. Wat. Sei. Tech. 15:127-167.
Gustafson, W.G., B.A. Feinberg & J.T. McFarland, 1986. Energetics of ß-oxidation. Reduction potentials of general fatty acyl-CoA dehydrogenase, electron transfer flavo-protein, and fatty acyl-CoA substrates. J. Biol. Chem.
-" 261:7733-7741. Horowitz, A., J.M. Suflita & J.M. Tiedje, 1983. Reductive
dehalogenations of halobenzoates by anaerobic lake sedi-

nient microorganisms. Appl. Environ. Microbiol. 45:1459-1465.
Khan, A.W., 1S80. Degradation of cellulose to methane by a coculture of Acetivibrio çeJ ul_oJLy_ti_çus and Me_th_ano_sarj cina barkeri. FEMS-Letters 9:233-235.
Koch, M., J. Dolfing, K. Wuhrmann & A.J.B. Zehnder,1983. Pathways of propionate degradation by enriched methano-genic cultures. Appl. Environ. Microbiol. 45:1411-1414.
Kristjansson, J.K. & P. Schönheit, 1983. Why do sulfate-red-ucing bacteria outcompete methanogenic bacteria for substrates ? Oecologia (Berlin) 60:264-266.
Kristjansson, J.K., P. Schönheit & R.K. Thauer,1982. Different Ksvalues for hydrogen of methanogenic bacteria and sulfate reducing bacteria:An explanation for the apparent inhibition of methanogenesis by sulfate. Arch. Microbiol. 131:278-282.
Maloney, P.C., 1983. Relationship between phosphorylation potential and electrochemical H' gradient during glycolysis in Streptococcus 1actis. J. Bacteriol. 153:1461-1470.
Mclnerney, M.J., M.P. Bryant & N. Pfennig, 1979. Anaerobic bacterium that degrades fatty acids in syntrophic association with methanogens. Arch. Microbiol. 122:129-135.
Paulsen, J., A. Kroger & R.K. Thauer, 1986. ATP-driven succinate oxidation in the catabolism of Desufuromonas acetoxidans. Arch. Microbiol. 144:78-83.
Pfennig, N. & H. Biebl, 1976. Desulforomonas acetoxidans gen. nov. and sp. nov., a new anaerobic, sulfur-reducing, acetate-oxidizing bacterium. Arch. Microbiol. 110:3-12.
Schink, B., 1985. Mechanism and kinetics of succinate and propionate degradation in anoxic freshwater sediments and sewage sludge. J. Gen. Microbiol. 131:643-650.
Schink, B., 1986. Environmental aspects of the degradation potential of anaerobic bacteria. In: H^C. Dubourgier, G. Albagnac, J. Montreuil, C. Raymond, P. Sautiere &*J. . Guillaume (Eds.): Biology 'of anaerobic bacteria. Elsevier, Amsterdam, p. 2-15. v •• £*•>
Schink, B., 1988. Principles and limits of anaerobic degradation - environmental arid technological' aspects.. In: A.J. B. Zehnder (Ed.): Environmental Microbiology of Anaexobes. John Wiley and Sons, New York-, ('in pç-ess)
Schink, B. & N. Pfennig, 1982.' Poropionigenium modestum gen. nov. sp. nov., a new strictly anaerobic, nonsporing bacterium growing on succinate. Arch. Microbiol. 133:209-216.
Schink, B. & J.G. Zeikus, 1982. Microbial ecology of pectin decomposition in anoxic lake sediments. J. Gen. Microbiol. 128:393-404.
Schönheit, P., J.K. Kristjansson & R.K. Thauer, 1982. Kinetic mechanism for the ability of sulfate reducers to outcompete methanogens for acetate. Arch. Microbiol. 132: 285-288.
Shelton, D.R. & J.M. Tiedje, 1984. Isolation and partial characterization of bacteria in an anaerobic consortium that mineralizes 3-chlorobenzoic acid. Appl. Environ. Microbiol. 48:840-848.
Stadtman, T.C. & H.A. Barker, 1951. Studies on the methane fermentation. VIII. Tracer experiments on fatty acid oxid-
16

ation by methane bacteria. J. Bacteriol. 61:67-80. Stieb, M. & B. Schink, 1985. Anaerobic oxidation of fatty
acids by Clostridium bryantii sp. nov. , a sporef orrning , obligately syntrophic bacterium. Arch. Microbiol. 140: 387-390.
Stieb, M. & B. Schink, 1987. Cultivation of syntrophic anaerobic bacteria in membrane-separated culture devices. FEMS Microbiol. Ecol. 45:71-76.
Suflita, J.M., A. Horowitz, D.R. Shelton & J.M. Tiedje, 1982. Dehalogenation: a novel pathway for the anaerobic biodeqradation of haloaromatic compounds. Science (Wash.) 218:1115-1117.
Szewzyk, U. & N. Pfennig, 1986. A simple method for enrichment and cultivation of anaerobic, surface-colonizing bacteria. J. Microbiol. Meth. 5:289-294.
Thauer, R.K., K. Jungermann & K. Decker, 1977. Energy conservation in chemotrophic anaerobic bacteria. Bacteriol. Rev. 41:100-180.
Thauer, R.K. & J.G. Morris, 1984. Metabolism of chemotrophic anaerobes: old views and new aspects. In: D.P. Kelly & N.G. Carr (Eds.): The Microbe 1984, Part II, Prokaryotes and Eukaryotes. Soc. Gen. Microbiol. Symp. Vol. 36. Cambridge University Press, p. 123-168.
Toerien, D.F. & W.H.J. Hattingh, 1969. Anaerobic digestion. I. The microbiology of anaerobic digestion. Wat. Res. ,3 : 385-416.
Van Bruggen, J.J.A., C K . Stumm & G.D. Vogels, 1983. Symbiosis of methanogenic bacteria and sapropelic protozoa. Arch. Microbiol. 136:89-95.
Van Bruggen, J.J.A., C K . Stumm, K.B. Zwart & G.D. Vogels, 1985. Endosymbiontic methanogenic bacteria of the sapropelic amoeba Ma st_ig.ella. FEMS Microbiol. Ecol. 31:187-192.
Wagener, S. & B. Schink, 1987. Anaerobic degradation of nonionic and anionic surfactants in enrichment cultures and fixed-bed reactors. Wat. Res. 21:625-622.
Winter, J. & R.S. Wolfe, 1979. Complete degradation of carbohydrate to carbon dioxide and methane by syntrophic cultures of Aç^tob^cjterium woodii. and Methanosarcina bar--keri. Arch. Microbiol. 121:97-102.
Wofford, N.Q., P.S. Beaty & M.J. Mclnerney, 1986. Preparation of cell-free extracts and the enzymes involved in fatty acid metabolism in Syntrophomonas wolfei. J. Bacteriol. 167:179-185.
Wolin, M.J., 1982. Hydrogen transfer in microbial communities. In: A.T. Bull & J.H. Slater (Eds.): Microbial interactions and communities, Vol.1. Academic Press, London, p. 323-356.
Young, L.Y., 1984. Anaerobic degradation of aromatic compounds. In: D.T. Gibson (Ed.): Microbial degradation of organic compounds. Marcel Dekker, New York. p. 487-523.
Zehnder, A.J.B., 1978. Ecology of methane formation. In: R. Mitchell (Ed.): Water pollution microbiology, Vol. 2. J. Wiley, New York, pp. 349-376.
Zehnder, A.J.B., K. Ingvorsen, T. Marti, 1982. Microbiology >' of methane bacteria. In: D.E. Hughes et al. (Eds.)
Anaerobic digestion 1981. Elsevier Biomedical Press, Amsterdam, pp. 45-68.
17

STRUCTURE AND MICROBIAL ACTIVITIES OF GRANULAR ANAEROBIC SLUDGE
H.C. Dubourguier ( G.Prensier.G.Albagnac
Institut National de la Recherche Agronomique - Station de Technologie Alimentaire - BP 39 - 59651 VILLENEUVE D'ASCQ - France
Introduction
Aggregation is a general process observed in natural environments and which is utilized in anaerobic digestion. Consequences of aggregation to bacterial physiology and to industry have been reviewed (Calleja et al., 1984). This phenomenon :
- leads to internal gradients of physicochemical conditions in aggregates - leads to heterogeneous syntrophic ordered populations of micro-organisms - affects overall stoichiometry, rates of growth and metabolisms - allows the manipulation of growth rate independent of the dilution rate - allows the manipulation of biomass as a single phase - facilitates cell separation - allows high cell concentration in continuous fermenters - allows continuous fermenters to be operated beyond normal washout flow rates.
Two main types of anaerobic reactors can be distinguished in which bacterial aggregates are formed either as biofilms fixed on an inert added support like anaerobic filters and fluidized bed reactors, or as bacterial congglomerates retained Ky internal settling systems like clarigester reactors and upflow sludge blanket digesters. However, in upflow anaerobic filters, significant' amount of the active 1biomass is often found as bacterial congglomerates (unpublished results on several industrial digesters) at the bottom part of"the digester. On the other hand, hybrid (filter-sludge bed) upflow systems have been développe^ (Lettinga et al. , 1981,' Guiot et, al. , ' 1#86) . The various types of anaerobic bacterial congglomerates ' have 'beeil described as- floes, granules, pellets, flocculent sludge. In this'paper, we will adapt the description of Dolfing (1987) : '
- floes are congglomerates with a loose structure. After settling, a layer of floeä .> forms macroscopically one fluffy layer. - granules and pellets present a well-defined appearance. After settling, these congglomerates are still visible as separate entities.
In addition, granules vary in their shape and in their composition. As objective criteria for classification have not yet been clearly established, granules include the various forms previously described, i.e. filamentous, rod-type, spiky (Hulshoff-Pol et al., 1983), platelet, stratified (Alibhai & Forster, 1986).
Chemical composition
The granules vary widely in their mineral contents. Ash contents of
18
A

samples taken at various occasions from the same reactor varied between 10 and 20% (Dolfing et al., 1985)• Ash contents sampled from various UASB reactors were between 21-46% (Alibhai & Forster, 1986) or between 11 and 55% (Hulshoff-Pol et al., I986). In this last study, a good correlation between the density and ash content of granules was found (r ash/density = 0.943)- As a gradient of density may be established in upflow reactors, a gradient of ash content may be also found. That was observed in a 5 m -UASB digester by sampling at six different levels (Table 1) and all along the period of experiments (< 8 months). Thus, variability of ash contents may be due not only to the characteristics of wastewaters but also to the sampling method and the level in the digester.
Dolfing et al. (1985) reported that about 30% of the ash fraction consisted of FeS. In primary dilution tubes, FeS was observed sticking firmly to the sheath of Methanothrix sp. (Dubourguier et al., 1985)• This might be explained by the higher surface tension of FeS as compared to water (Grotenhuis et al., 1986) and by the hydrophobicity of Methanothrix soehngenii as determined by its adhesion to various inert supports (Verrier et al., 1987, 1988). By this interaction, FeS might contribute to stabilize bacterial aggregation within granules. In addition to FeS, other minerals are found in high amounts. Typical results are reported in Table 1. Compared with methanogens, these data point out the high concentration of nickel and cobalt, particularly in the lab-scale sample, probably as sulfide precipitates. About 50% of the calcium content is due to carbonate. Calcium phosphates might be also present because of the high amount of phosphorus. In addition, gradient of minerals may be observed in a same digester (Table 1).
Table 1. Mineral composition of granules compared with Methanobrevibacter arboriphilicus AZ. All values are expressed as g per 1000 g dry weight. The digester samples (I to VI) were taken the same day from the lower (I) to the upper (VI) part of the UASB reactor.
Dubourguier et al. (1987) this book <2) after Scherer et al. (1983)
Total calcium as Ca CO Magnesium Potassium Sodium Iron Phosphorus Nickel Cobalt Total sulfur
I
23.9 14.4 7-9
14.6 7-2
43.4 12.2 1.16 1.11
20.1 Ash content (%) 48
Digester sample number II III
24.4 24.4 12.8 10.8
7-7 7-4 I.34 12.9 6.2 7.O
43.5 43.2 12.6 12.2 O.87 0.81 O.73 0.64
24.9 21.2 44 37
IV
24.8 12.0 7-4
13.2 8.6
42.8 13.O 0.80 0.61
21.7 33
V
26.0 12.0 7-2
12.2 8.7
43.O I3.5 0.68 0.46
21.2 36
VI
26.7 10.8
7.4 12.0 7-5
45.I I3.5 0.64 0.39
23.5 44
Laboratory sample
9.3O 4.5 3-9
13.5 2.9 9-9 7-6 O.47 -
I8.3 13
Meth. AZ^J
0.55 -
3-9 52.5 3.65 1.3
28.5 O.O65 O.OI5 9.9O -
Surface X-ray analysis (Dubourguier et al., 1987, this book) and X-ray analysis of broken granules (Alibhai & Forster, 1986) did not revealed a unique pattern of mineral deposition. In situ mineral

precipitates can be evidenced either by local X-ray analysis (Robinson et al., 1984) or by elemental mapping performed on sections. Calcium phosphate, ferrous sulfide and silicates have been demonstrated by these techniques. Spatial distribution of minerals within granules appeared to be linked to the local environmental conditions which are modified by the local bacterial activities. In addition, the presence of mineral precipitates within granules pointed out the efficiency of methanogens and other trophic groups to remove specific ions such as Ni, Co, Fe from the medium, even when they are at low concentrations (Dubourguier et al., 1987 > this book). Lastly, a correlation between the ash content (minerals) and the granule strength (cohesion) does not exist or is at least not clear (r ash/strength = O.676, Hulshoff-Pol et al., 1986). This suggest that other parameters are involved in the stabilization of granules.
Extracellular polymers play generally a significant role in adhesion and in stabilization of the resulting biofilm. However, the extracellular polysaccharidic fraction of granules is only 1 to 2% based on dry weight (Dolfing et al., 1985)• This value is very low compared with the high amounts of capsular materials produced by some Enterobacteria, Leuconostoc or Streptococci. This extracellular material contained 13% of uronic acids. However, other molecules such as proteins may account as extracellular polymers. However, very weak bonding between macromolecules and surfaces can lead to very strong, apparently irreversible adsorption as a consequence of the large number of contacts there can be between polymers and substrates (Robb, 1984). In addition to negative groups of uronic acids, the proteins may provide important binding sites since although they may have a net negative charge, the positive groups can form strong bonds to negative sites. Lipopolysaccharides have been proposed as important constituents of the matrix in anaerobic biofilms (Robinson et al., 1984). But the matrix is not stained by ruthenium red which is specific for polysaccharides and hyaluronic acid (Dolfing et al., I985). Nevertheless, polymers are always clearly evidenced by scanning electron microscopy, bacterial cells and colonies being often covered by abundant extracellular material which ^appears in some 1 casés as fibrils (Dubourguier et al., 1985t Dolfing et jfcL• , 1985)- Previous studies have shown that numerous empty »cell 'walls can be observed in. the matrix. In addition, the gtructure of this matrix can be described" in some cases (Dubourguier et al. , .1985) • A translucent matqfrial '("gel-like") is often observed within micrqcólonies" of Syntrophomorias sp. Some gram negative bacteria present typicaï "capsules surrounded by large area of fibrous extracellular 'material. Other genera are only embedded in fibrous unorganised matrix. Some bacteria synthetize fimbriae-like structures. "'Lastly, many bacteria present S-layers. All these extracellular bacterial polymers contribute likely to the stabilization of granules and thus, render difficult any attempt to disintegrate chemically the overall structure. For example, treatments such as HCl 0.01 N, NaOH 0.1 N, 5% EDTA, boiling, autoclaving did not result in a complete disintegration of granules. However, the methods weakened always the granules. After autoclaving, 33% of the dry weight could be suspended by sonification compared with only 9% for untreated granules (Dolfing, I985). Further studies are still necessary to assess the functional polymers and the nature of interactions involved in the stabilization of the granular structure.
20

Microbiological analysis
Microbiological counting is one of the techniques available to assess each physiological group of bacteria that occur in granular methanogenic sludge. The classical methods to evaluate the numbers of bacteria in a sample are to culture them on agar plates and count the colonies after a period of time. Adaptation of these methods to anaerobiosis and slow-growing bacteria have been done and led to the agar roll tube technique and the deep agar method. These methods destroy the interactions between the species of the sample and can give great distortions in understanding the community structure because of the selectivity in the culturing methods. Total microflora may be assessed by staining the nucleic acids with acridine orange (Hobbie et al., 1977) or with DAPI (Porter and Feig, I98O) of bacteria present in adequate dilutions of the samples and counting the fluorescence created by epifluorescent illumination. As the granular sludge is a concentrate of bacteria, this method gives always the same results, i.e. between 1x10 and 4x10 cells per g VSS. In addition, no information can be obtained on specific trophic groups.
By serial dilution and inoculation of culture media containing one carbon source, estimation of the most probable numbers is possible if at last 3 subculture tubes are inoculated per carbon source. In these conditions, the accuracy will be equal to about one dilution (De Man, 1975)- More accurate results can be obtained by inoculating 5 or 10 tubes per dilution. After incubation (one week to several months), analysis of metabolic end-products concurrently with microscopic examination will give the most probable numbers of bacteria degrading one carbon source and also the presumptive identification of the dominant bacteria. By this technique, similar results were obtained on granules grown on waste stream of liquid sugar factory, on granules grown on wastewaters from starch industry and on granules grown on a defined mixed substrate (Table 2 ) . The presence of sulfate reducers degrading propionate and butyrate has to be explained by the low concentration of sulfate in the wastewater (about 0.5 mM) whereas sulfate-reducers degrading ethanol compete with syntrophic organisms by interspecies hydrogen transfer. As the hydrogenophillc methanogens are in higher numbers than syntrophic organisms, addition of hydrogen scavengers such as hydrogenophilic methanogens or H -utilizing sulfate reducers is not necessary contrarily to the agar roll tube or the deep agar techniques where a lawn of hydrogen-organisms has always to be added to allow the growth of syntrophic organisms.
The MPN technique does not allow a quantitative assessment of the main physiological groups present in granular sludge. It underestimates the numbers of organisms by direct microscopic count of between 10 and 10 . Possibly, some metabolically active organisms are not cultivable in artificial culture media. Also, culture conditions, i.e. non-limiting substrate are different from reactors where the substrates are often limited. In addition, like in natural habitats or in medical microbiology, the problem of clump or chain forming bacteria still remains in addition to the syntrophic microcolonies present in granules which must be dispersed before counting. The ideal method of granule disintegration will result in individual cells with their complete metabolic activities and without any lysis effect. Nevertheless, the MPN method gives an overview of the various trophic groups and allows 'presumptive identification of the main genera present in granular sludge. By this technique, we have identified Propionibacterium, Desulfovibrio growing on lactate by H -interspecies transfer,

Syntrophobacter sp., Syntrophomonas sp., Methanobrevibacter sp., Methanosplrlllum sp. and Methanothrlx sp. (Dubourguier et al.. 1985). If the last dilution is then subcultured and serves as a source for further purification and characterization, definitive identification of significant bacteria can be performed more rapidly than starting with enrichments. By this method, Pelobacter carbinolicus has been identified in UASB digestor and contact anaerobic digester (Dubourguier et al., 1986), Desulfobulbus elongatus (Samain et al., 1984) and Syntrophomonas sapovorans {Roy et al., 1986 a & b) were characterized in digesters treating respectively vegetable canning wastewaters and chilling factory wastewaters. Lastly, the last positive tubes may also serve as references for ultrastructural comparison of dominant bacteria, for immunological testing and for metabolic activities.
Table 2. Bacterial counts in UASB reactors treating starch industry wastewaters (I and II) or waste stream of a liquid sugar factory (III). Samples I and II were taken at three months interval.
from Dolfing et al., I985
Metabolic group Substrate No. of organisms (ml" )#
I II III*
Acidogens
Methanogens
Syntrophs
Sulfate-reducers
Glucose Lactate
yco Acetate Ethanol Propionate Butyrate Valerate Lactate Ethanol Propionate Butyrate
nd l.lxlO9
2.2xl09
1.5xl09
1.1x10 3.0x10* 1.1x10
n d « 1.1x10* 6.5xl06
l.lxlO7
6.5xlOß.>
l.lxlO9
3xl09
2.5xl09
2.5xl09
2.OxlO9
2.5x10** 1.1x10
nd l.lxlO9
2.0xloL 6.5xl07>
2. OxlO7
iolu
nd
K 10U
10' 10' 10' nd nd nd nd
Structure of granules • »* ;, ' * »
Various techniques may be used to, study'the structure of granules. Direct examination by light microscopy with Nomarsky optics (interferential contrast)^ evidenced heterogeneities. Various kinds of bacterial congglomerates may be observed. Filamentous cells of Methanothrix sp. are covered by colonies of cocci or rods and form microflocs of 10-50 um (Fig. 1 ) . Aggregation of these microflocs due to filaments of Methanothrix which form bridges between the floes may be seen (Fig. 2 ) . As a result, one may find that larger granules (> 200 um) originate from several microflocs. These larger granules often present precipitates of sulfide which can be observed as dark precipitates. In some area, bundles of filamentous bacteria are clearly visible. By epifluorescent illumination, some Methanosarcina clumps are found and many fluorescent rods are observed in all the congglomerates. Staining of thin section with toluidine blue allows identification of active bacteria by their intense colour. Methanosarcina clumps are still easily found as well as Methanothrix filaments and bundles (Fig.
22

3 ) . By this technique, the active bacteria are not randomly distributed within the granules but microcolonies are quite well defined within a clear matrix which entraps also dark precipitates. Active bacterial cells can be found in various location even in the core of granules.
Scanning electron microscopy allows examination of the surface of samples which can be broken after fixation. In some granules, funnels may be found (Fig. 4 ) . They correspond either to an artifact due to sudden degassing during fixation or to the channel for gas transport. Precise observations • are always rendered difficult by the presence of large amounts of extracellular material which covers bacterial cells and microcolonies. In some places, this extracellular material is absent or removed by the fixation procedures. In these area, we have been able to evidence microcolonies of Methanobrevibacter arboriphilicus (Fig. 5 ) . bundles of Methanothrix soehngenii (Fig. 6 ) . Syntrophic microcolonies can be also observed : large rods (Syntrophobacter or Pelobacter ?) associated with Methanobrevibacter (Fig. 7) and slightly curved rods (Syntrophomonas ?) associated with Methanospirillum-like cells (Fig. 8 ) . Cristals of mineral precipitates may be observed and identified by X-ray analysis as containing either Ca and minor amounts of P or Fe and S. Such precipitates have been also observed in biofilms (Robinson et al., 1984).
Scanning electron microscopy also suggests the existence of a network formed by Methanothrix cells which are found in all micrographs with various orientations (Fig. 9 ) .
Transmission electron microscopy is the most valuable technique to study the intimate structure of granules. At low magnification, all the previous observations can be still found : presence of microcolonies embedded in a clear matrix with numerous cells of Methanothrix. At higher resolution, the matrix appears to contain large amounts of empty cell walls of various bacterial genera. In some cases, colonies of empty cell walls of Methanothrix were found and were due to lytic bacteriophages (see G. Prensier et al., this book). The matrix generally appears as being translucent to electrons. However, some bacterial cells present various kinds of extracellular material (see above).
Presumptive identification of bacteria can be done by their main ultrastructural characteristics and comparison with references : shape, structure of the cell enveloppes, cytoplasm appearance, cytoplasmic inclusions. Propionibacterium sp. is easily identified and found in granules grown on starch industry wastewaters or on a mixed-defined substrate containing glucose and lactate (Fig. 10). They form microcolonies of irregular rods with a gram positive cell wall. Microcolonies of syntrophic organisms degrading propionate have been identified by ultrastructural characteristics and by immunology as being Syntrophobacter associated with Methanobrevibacter (see Prensier et al.,this book). Other syntrophic microcolonies are always present. They also associate Methanobrevibacter but with Syntrophomonas. This last syntroph can also be found as apparently pure microcolonies (Fig. 11). Pelobacter-like cells may be found and identified by the typical structure of their gram negative wall (Fig. 12). Distances between syntrophs and hydrogenophilic methanogens are very short, especially in the case of Syntrophobacter (< 50 nm) and thus favour hydrogen interspecies transfer.
The ratios methanogens/syntrophs were determined for Syntrophomonas and Syntrophobacter in a lab scale UASB reactor and in a UASB digester treating wastewaters from starch industry (Table 3)-
Apparently, cell physiology of many genera present in granules is
23

modified by the environmental conditions of the reactor. Thierry's staining is specific of polysaccharides. By this staining, only the inner part of the cell wall of Methanobrevibacter is stained. Many polysaccharidic polymers found are cytoplasmic inclusions, mainly in Syntrophobacter (Fig. 13), in Methanosarcina and in Methanothrix cells (Fig. 14). In this last organism, cytoplasmic inclusions have been proved to be glycogen (Pellerin et al., I986). In Syntrophomonas, the cytoplasmic inclusions appear as large holes within a dark cytoplasm after conventional fixation procedure. In contrast, by cryosectioning, they appear as clearer zones in the cytoplasm (Prensier et al., this book). These characteristics suggest a polyhydroxybutyrate nature.
Table 3- Ratio between methanogens and syntrophic bacteria. Numbers of determinations are indicated in brackets,
on 17 microcolonies, 6 were pure Syntrophomonas
Origin of methanogen/ methanogen/ granules Syntrophobacter Syntrophomonas
laboratory 2.46 (16) 0.71 (20) industry 2.33 (l6) 0.48 (11)*
Metabolic activities
The specific metabolic activity can be easily measured in batch experiments with defined substrates. With a mixture of volatile fatty acids, the value should be in the range of 6.5 - 27 umol CH /g VSS/min (Hulshoff-Pol et al., 1986). Specific activities measured on granules grown on various substrates point out the adaptation of the microflora, maximal values being obtained when»the test substrate is identical to the growth substrate (Table 4 ) . Compared to»v the assumed specific activities of 250 umol CH /g/min for hydrogenophilic methähogens and 25 umol CH /g/min for acetoclastic 'methanogens (Dolfing and Bloemen, I985).a significant portion of the bactetria ifPesent in granules consists of methanogenic bacteria (20 to $0%). The specific activities* of the various trophic .groups may be classified as sugar,> acetate > propionate. Even limited overload' 'will induce /propionate accumulation before the appearance of acetate in .the medium, propionate degradation being the main rate limiting reaction• in the methanogenesis from soluble substrates/ One might expect a relation between granule size and metabolic potential .of the bacteria. In a study of propionate degradation, no significant variation of potential activities nor of the apparent Km values for propionate have been detected with increasing the diameter of propionate-grown granules between 2.3 to 4.6 mm. In contrast, the diameter of the granules influenced clearly the apparent rate constant for acetate conversion (Dolfing, 1985). These results have been confirmed in a UASB* reactor fed with sucrose. Acid-forming bacteria were associated more with small floes and granules (< 1.2 mm) whereas activities of acetoclastic methanogens were higher in granules with a diameter above 1.2 mm (Guiot et al., I986).
Some attempts to correlate the potential methanogenic activities and specific coenzyme contents such as F420, F430, sarcinapterin and methanopterin have been done but they still need further investigations (Dolfing and Mulder, I985, Gorris and Van der Drift, 1986) and they
24

<D . P
G 5 1 c
<L o CO " H
co o-> o t l M O.
^ f •• a >> U f j
(U .H C O 'H a « H 3 . CU
u ra cd M
cd T3 M 0 3 01 (/!
ra <D cd u a <M
x o cu
ra CD U M CD
•O 4-> 3 cd
•H 3 en CD
•p o co
•H cd G 3 CD ta a 0 o 3 >>
XI i H P CD CD > a -H
•p H O cd CD
rH tt 3 ra § CD 3 u u ta a
3 co o 3 t i o ta
• H M — . cd m > 0 0
ON CU TH
o ^ -co M CD G
•H -ri 4-> C M
•H i-H > O
•H O • P ü M cd CD
• p CJ CM
• H cd <H •H •• O CD X I •
CD p cd p CD U cd
* en M CD P cd 3 CD P CO cd 3
U cd
ta 3 CO
Ci o
>> rH CD
> •H • P O CD a en CD • U rH
0
3 3 O Xi M -P M CD
- ^ + i n CO CD ON P r-i cd •— p
CD M o CD cd
T3 rH 13
s 3 T3 CD
§S a
M 0 G -H •H a CM O M H o a o + M CD CD P -P <M cd CU 4->
CD .. o
cd CO
«• T3 J-\
§ i t ^ x ! 4-1
» CD cd
ttvO r-l VO » CO O
T3 S
• H - 3 xi +->
CD Xi <D r-i i n
"§ -'S EH I-H 3
CD - -P
cd cd m c
o - -H
^r a o
- M
>> H P en 3
T3 C
•rH
X ! Ü M cd 4-> en
CD P cd H -p
ra 3 en
T3 CD X
• I -
a cd
G o G 3 O H
ta x o 0
X I
eo •H X i • p
' • .H
cd
• P CD
u CD
•H
a M 3 0
X I 3 a
•• CM a m e n
i ra
i P
i G
1 CD
i a
O ^
0 0
t—
X ! 1 'H MO
1 M
1 CD
1 Q
i X
1 CD
1 CM
1 O
1 O
1 Z
1
cd v£>
X ! m
cd un
•=r
m
CM
*H
CD • P cd M
4-> M
X I 3 en
• P
co CD P
-=1- c ^ ^ r ^ r \o i • V£> 1
0 0 O CM 0 0 r ^ CTN ! *-H t-H tH 1 1 1
1 1 1 O 1
\X> r n v f i ^ r CM ^O 1
r—.=1- v ü o o c i i
CM v u CM \£> O
U> ON-S" o . CM * H
e n MO m t—
. . . . m O O H r o " ( M H
CM CM
1 CO t-H
• H -4 - C O H O
m - H - 0 0 o S c O
CM
CM CTv tH
* 1 m i n
o T H
O CM O VO
CM' C O VX> i n IH CM
>-o 0 O >-D O
CM' <M <M O TH
VX>
<T> 1
ON
*H
H ^ O H C O
CO- rH J " CM
^ j - c o i n
,-H "-O CM
CD • P cd CD
CD CD G -P 4-> p O cd cd cd - H M a -p a >> M CD O -P
o iO O H 3 K ' M cd a x i
CD J-> cd M CD
rH cd
>
CM 1
m i CM 1
CT\ i
-H" 1
CT\ 1
-H" | vH 1
-H" |
CM 1
CTl 1
rH 1
O 1
CM 1
»H 1
f "- 1
rH CD 1 O -P 1 g m h i Cd 4-> cd 1 X I O ho i •P cd 3 i CD •-! en i
25

^
••tiH *
Fig. 1. Microflocs formed by bacteria Fig. 2. Microgranules bridged by adhering to Methanothrix sp. filaments of Methanothrix sp.
Fig. 3- Thin section stained by toluidine blue. Note the Methano-sarcina sp. clump and the bundle of Methanothrix sp.
Fig. 4. Funnels appearing in a granule.
26

Fig. 5- Colony of Methanobrevibacter Fig. 6. A bundle of Methanothrix sp. sp.
Fig. 7- Syntrophic microcolony Fig. 8. Note the fat slightly curved rods among Methano-spirillum sp.
27

Fig. 9- Network of Methanothrix sp. Fig. 10. Irregular cells of Propionibacterium
Fig. 11. Syntrophobacter sp. associated with Methanobrevibacter sp. along a microcolony of Syntro-phomonas.
28
Fig. 12. Typical cells of Pelobacter sp.

e*
•A,
•Ti /•
# .
't* M» • W S 'V^"» V'J .(
-1« : V "• fa&w
O Si,
t.?
Fig. 13. Thierry's staining of Syntrophobacter sp. and Methano-brevibacter sp.
M& *r «a *
ft
*.£g
t
?••-*' > '* , / •• <A"-.* ! # *
s» Ijim
Fig. 14. Thierry's staining of Methanothrix sp. cells.
Fig. 15. FeS precipitate surrounding Fig. 16. Close association sulfate reducing bacteria between Methanobrevibacter sp.
and Syntrophobacter sp.
29

could be of little value compared with the very low amount of sarcinapterin of Methanothrix soehngenii (Gorris and Van der Drift, 1986).
Lastly, the digesters are genarally operated for depollution, i.e. with loading parameters which limit the residual COD. In these almost steady state conditions, no intermediate of bacterial metabolism can be found. However, in batch experiments with excess substrate conditions, several conversion patterns may be observed in anaerobic sludges (Morfaux et al., 1981, Samain et al., 1982) even in granular sludge. The patterns of intermediates and of end products are complex and individual reactions have been recently reviewed (Grotenhuis et al., 1986). More recently, a new pathway has been evidenced in anaerobic contact sludges in which at least 10$ of propionate is directly converted by reductive carboxylation of the carboxylic group to butyrate (Tholozan et al., 1987).
Conclusions
Granules and biofilms offer a unique biotope where all the trophic groups responsible for complete mineralization of complex organic matter to methane and carbon dioxide are present within the same bacterial consortia. At present, various techniques can be used to describe the structure and the metabolism of granular sludge. However, intimate metabolism of granule can be assessed by indirect measurements and calculations.
Growth of granules remains an open question. However, microscopic examination and activity measurements suggest that microflocs may be found by agglutination of acid-forming bacteria together with limited numbers of cells of Methanothrix. This filamentous organism by its particular morphology and surface properties might establish bridges between several microflocs. Further development of acid-forming bacteria and syntrophic bacteria might favour the growth of granules of which density will be at least partly due to ferrous sulfide precipitates (sulfate reducing activity -fiig. 15") and calcium carbonate (CO -producing activity) . • As. suggested in othef- lectures during this seminar,Methanothrix, plàys ai significant role.'in grlanule strength by forming network which might stabilize tibe overall structure. However, the role of extracellular polymers and of cell walls cannot be, neglected. . " '
On the other hand, the granular structure favours ^probably the exchange of metabolites and particularly interspecies hydrogen transfer (Fig. 16). Thermodynamic calculation can 'be made in conditions which are closed to those observed in digesters. At pH 7.0 and 25°C, if each substrate concentration ^re equal to 1 mmol/1 and the partial pressure of CH in biogas (1 atm) being around 0.75 atm, the G' values for acetogenesis from valerate, butyrate and propionate will be respectively - 68.7, -10.7 and + 18.^ KJ/reaction at a partial pressure of hydrogen of 10"3 Atm. The G' for acetogenesis from propionate begins to be favorable (-5.3 KJ/reaction) at 10" Atm of hydrogen. Considering our results, this indicates that in granules, partial pressure of hydrogen is around 10"3 Atm (O.76 uM H ) and in syntrophic microçolonies degrading propionate lower than 10" Atm (O.O76 uM H ). These values are superior to the minimum threshold for hydrogen metabolism in methanogenic bacteria which around 7 to 12 Pa, i.e. 7.10"5 to 12.10"5 Atm (L0VLEY, 1985). Considering the Ks values of Methanobrevibacter AZ, the doubling time of the cells entrapped in the matrix will be around 60 hours (at 10 Atm) whether the doubling time
30

of those growing in microcolonies will be close to 700 hours. However to control these calculations, in situ measuremants are necessary. Development of pH-micro-electrodes have evidenced acetate gradients in granules (De Beer and Van den Heuvel, this book). Such micro-probes need to be extended to the measurement of "intra-microcolonial" hydrogen and to interstitial hydrogen, or to the measurement of substrate concentrations.
To increase the potential applications of granulation and of biofilms, studies of the structure and in situ activities of bacterial congglomerates are still necessary. Mechanisms by which aggregation occurs are only partly understood and more investigations on polymer cross-binding, ion-binding and hydrodynamic effects will improve our knowledge.
References
Alibhai, K.R.K. & C F . Forster, 1986. Physicochemical and biological characteristics of sludges produced in anaerobic upflow sludge blanket reactors. Enzyme Microb. Technol. 8:601-606.
Calleja, G.B., B. Atkinson, D.R. Garrod, P. Hirsch, D. Jenkins, B.F. Johnson, H. Reichenbach, A.H. Rose, B. Schink, B. Vincent & P.A. Wilderer, 1984. Aggregation group report. In : K.C. Marshall (Ed.) : Microbial Adhesion and Aggregation. Springer Verlag. Berlin. Heidelberg p. 303-321.
De Man, J.C., 1975- The probability of most probable numbers. Eur. J. Appl. Microbiol. 1:67-78.
Dolfing, J., 1985- Kinetics of methane formation by granular sludge at low substrate concentrations. The influence of mass transfer limitation.Appl. Microbiol. Biotechnol. 22:77"8l.
Dolfing, J., 1987. Microbiological aspects of granular methanogenic sludge. PhD thesis. Druk Co Pudoc Wageningen.
Dolfing, J. & W.G.B.M. Bloemen, 1985. Activity measurements as a tool to characterize the microbial composition of methanogenic environments. J. Microbiol. Methods 4:1-12.
Dolfing, J., A. Griffioen, A.R.W. Van Neerven & L.P.T.M. Zevenhuizen, 1985. Chemical and bacteriological composition of granular methanogenic sludge. Can. J. Microbiol. 31;744-750.
Dolfing, J. & J.W. Mulder, 1985. Comparison of methane production rate and coenzyme F420 content of methanogenic consortia in anaerobic granular sludge. Appl. Environ. Microbiol. 49:1142-1145.
Dubourguier, H.C., G. Prensier, E. Samain & G. Albagnac, 1985. Granular methanogenic sludge. In : Palz, W., J. Coombs & D.O. Hall (Ed.) : Energy from biomass. Elsevier Applied Science Publishers, p. 542-546.
Dubourguier, H.C., E. Samain, G. Prensier & G. Albagnac, I986. Characterization of two strains of Pelobacter carbinolicus isolated from anaerobic digesters. Arch. Microbiol. 145:248-253.
Gorris, L.G.M. & C. Van der Drift, 1986. Methanogenic cofactors in pure cultures of methanogens in relation to substrate utilization. In : Dubourguier, H.C., G. Albagnac, J. Montreuil, C. Romond, P. Sautière & J. Guillaume (Ed.) : Biology of anaerobic bacteria. Progress in Biotechnology Vol. 2. Elsevier Amsterdam, p. 144-150.
Gorris, L.G.M. & C. Van der Drift, 1986. Content of methanogenic cofactors in fluidized bed reactors. In : Anaerobic treatment. A grown-up technology. Aquatech'86. Amsterdam p. 567-570.
.Grotenhuis, J.T.C., F.P. Houwen, C.M. Plugge & A.J.B. Zehnder, 1986. Microbial interactions in granular sludge. In : Proceedings of the 4th International Symposium on Microbial Ecology. Ljubjlana.
Yougoslavia. Guiot, S.R., K.J. Kennedy & L. Van den Berg, 1986. Comparison of the
upflow anaerobic sludge blanket and sludge bed filter concepts. In : Anaerobic treatment. A grown-up technology. Aquatech'86. Amsterdam p. 533-5^6.
Hobbie, J.E., R.J. Daley & S. Jasper, 1977- Use of nucleopore filters for counting bacteria by fluorescence microscopy. Appl. Environ. Microbiol. 33:1225-1228.
Hulshoff-Pol, L.W., W. de Zeeuw, J. Dolfing & G. Lettinga, 1983- Startup and sludge granulation in UASB reactors. In : Van den Brink, W.J. (Ed.) : Proceedings European Symposium Anaerobic Wastewater Treatment. TNO Corporate Communication Department, The Hague, The Netherlands, p. 40-43.
Hulshoff-Pol, L.W., J.J.M. Van de Worp, G. Lettinga & W.A. Beverloo, 1986. Physical characterization of anaerobic granular sludge. In : Anaerobic treatment. A grown-up technology. Aquatech'86. Amsterdam p. 89-IOI.
Lettinga, G., R. Roersma, P. Grin, W. de Zeeuw, L.W. Hulshoff-Pol, L. Van Velsen, S. Hobma & G. Zeeman, I98I. Anaerobic treatment of sewage and low strength wastewater. In : Hughes, D.E., D.Ä. Stafford, B.I. Wheatley, W. Baader, G. Lettinga, E.J. Nyns, W. Verstraete, R.L. Wentworth. Anaerobic Digestion I98I. Elsevier Biomediacl Press. Amsterdam New York Oxford, p. 271-292.
Lovley, D.R., 1985. Minimum threshold for hydrogen metabolism in methanogenic bacteria. Appl. Environ. Microbiol. 49:1530-1531-
Morfaux, J.N., J.P. Touzel & G. Albagnac, I98I. Anaerobic digestion of vegetable canning wastewaters. In : Hughes, D.E., D.A. Stafford, B.I. Wheatley, W. Baader, G. Lettinga, E.J. Nyns, W. Verstraete & R.L. Wentworth : Anaerobic Digestion 1981. Elsevier Biomediacl Press. Amsterdam p. 185-199•
Pellerin, P., B. Gruson, G. Prensier, G. Albagnac & P. Debeire, 1987. Glycogen in Methanothrix. Arch. Microbiol. l46:377_38l.
Porter, K.G. & Y.S. Feig, I98O. The use of DAPI for identifying and counting aquatic microflora. Limn.'Ocean. 25:943-948.
Robb, I.D., 1984. Stereobiochemistry and function of polymers. In : Marschall K.C. (Ed.) : Microbial adhesion and aggregation. Springer Verlag. Berlin Heidelberg p. 39'-49- "* -
Robinson, R.W. , D.E. Akin, R.A. Nordstedtt, M.V. Thomas & H.C. Aldricht, 1984. Light and electron 'microscopic examinations óf methariê producing biofilms from anaerobic fixed-bed reactors. Appl. Environ. Microbiol. 48:127-136. ' , ' . ' J'
Roy, F., G. Albagnac & E. Samain, I985. Influence of calcium addition on growth of highly purified syntro'phic cultures degrading long-chain fatty acids. Appl. Environ. Microbiol. 49:702-705.
Roy, F., E. Samain, •'H.C. Dubourguier & G. Albagnac, 1986. Syntrophomonas sapovorans sp. nov. a new obligately proton reducing anaerobe oxidizing saturated and unsaturated long chain fatty acids.
Samain, E., G. Albagnac, H.C. Dubourguier & J.P. Touzel, 1982. Characterization of a new propionic acid bacterium that ferments ethanol and displays a growth factor-dependent association with a gram negative homoacetogen. FEMS Microbiol. Lett. 15:69-74.
Samain, E., H.C. Dubourguier & G. Albagnac, 1984. Isolation and characterization of Desulfobulbus elongatus sp. nov. from a mesophilic industrial digester. System. Appl. Microbiol. 5:391-401.
Scherer, P., H. Lippert & G. Wolff, 1983- Composition of the major elements and trace elements of 10 methanogenic bacteria determined by inductively coupled plasma emission spectrometry. Biol. Trace Elem.
32

Res.5:1^9-163-Tholozan, J.L., E. Samain, J.P. Grivet, R. Moletta, H.C. Dubourguier &
G. Albagnac, 1987- Reductive carboxylation of propionate into butyrate in methanogenic ecosystems. Appl. Environ. Microbiol, under press.
G. Albagnac, 1987. Initial adhesion of polymers. Biotechnology Letters (under
Dubourguier & G. Albagnac, 1988. Adhesion inert supports and development of
: Anaerobic Digestion I988. Bologna Italy
Verrier, D., B Mortier methanogenic bacteria press).
Verrier, D., B of anaerobic
Mortier, bacteria
methanogenic biofilms. (submitted).
& to
H.C. to
In
33

AGGREGATE FORMATION IN ANAEROBIC GASLIFT REACTORS
G.R. Zoutberg, R. Mulder, M.J. Teixeira de Mattos and O.M. Neijssel
Department of Microbiology, Biotechnology Centre, University of Amsterdam, P.O. Box 202^5, 1000 HE Amsterdam, The Netherlands
Summary
We have studied the mechanism of granule formation in an anaerobic gas-lift reactor, used as a model of the first stage of a two-stage anaerobic waste-water treatment system. From these studies we conclude that Seleno-monas ruminantium is the organism that is responsible for the formation of aggregates in such an open (i.e. mixed culture) system - at least when a glucose-containing medium was used. This organism could be induced to form aggregates when grown in pure culture. These latter aggregates were very similar to the aggregates formed in the mixed culture. Preliminary experiments showed that polysaccharide formation was not the cause of aggregate formation.
We succeeded in isolating a aggregating variant of Clostridium butyr-icum that would grow in anaerobic gas-lift and conventional chemostat cultures. The mechanism of aggregate formation of this variant was studied more closely and we conclude that aggregate formation by this organism occurred via the formation of an acidic polysaccharide.
Taken together, these experiments show that formation of aggregates by bacteria occurs via at least two different mechanisms. Keywords: aggregate formation, auto-immobilization, Selenomonas ruminantium, Clostridium butyricum, chemostat, anaerobic gas-lift reactor.
Introduction ~*>
There has been a lot of interest " in the' application of continuous culture systems in biotechnology, sincet they'-öfffft the advantage that they allow a more efficient use-of fermentor equipment. In a classical chemostat culture the fluid leaving the fjerméntór contains the same concentration of biomass as the fluid in the culture vessel. This is a disadvantage from a biotechnological- point éif »view, since in most processes in which micro-organisms play a role, one can consider the microbial biomass as a catalyst that carries out the desired biotransformation. A loss of biomass^ therefore causes a decreased efficiency of the process due to loss of the catalyst. Hence, many investigators have tried to develop continuous culture systems that allow biomass retention.
An interesting example of this approach has been the use of an anaerobic gas-lift reactor (AGLR) as the first stage of a two-stage anaerobic waste-water treatment system, in which sand was used as the initial carrier material for the microbial population (Beeftink & van den Heuvel 1987, Beeftink & Staugaard, I986). Thus, when such a reactor was inoculated sand was also added and, due to the adhesion of microbes to the sand grains, granules formed and biomass was retained in the fermentor. Beeftink & Staugaard (1986) found, however, that after some time the sand grains gradually disappeared from the fermentor (i.e. were washed out), but that granules remained in the reactor. These granules consisted therefore completely of microbial biomass. These observations showed that
34

sand was necessary only as the initial carrier material and that, at least in principle, it should be possible to acquire granules in such a fermentor system, but now without the addition of carrier material (auto-immobilization) .
Therefore, we undertook a study into the mechanism of aggregate formation by bacteria in such a reactor. Moreover, we wished to study the phenomenon of aggregate formation in a more general way, because such an investigation could show whether it would be possible to acquire auto-immobilization in other systems and with other organisms. In this contribution we describe the successful auto-immobilization of micro-organisms by two different mechanisms: i) granule formation caused by the presence of an aggregate-forming bacterium in the acidification stage of a two stage anaerobic waste-water treatment system, and (ii) aggregate formation in a pure culture of Clostridium butyricum induced by careful manipulation of the growth environment of the micro-organisms.
Results and discussion
Aggregate formation in mixed cultures and pure cultures of Selenomonas ruminantium.
First, the experiments of Beeftink & Staugaard (1986) were repeated. Since these authors observed aggregate formation only at high dilution rates, an AGLR with a smaller working volume was constructed by us so as to decrease the medium demands of the culture. This smaller AGLR ^working volume 100 ml) differed also from the original design in that external lift gas was used (90$ (v/v) nitrogen and 10# (v/v) carbon dioxide). The reactor was inoculated with activated sludge from the municipal wastewater treatment plant of Amsterdam-North, sand being added as carrier material. When the culture was in a steady state aggregates were readily formed, particularly at high dilution rates (above O.k h " 1 ) . Analysis of the pattern of the fermentation products that were excreted into the culture supernatants showed that also in this respect the results of Beeftink & Staugaard (1986) could be reproduced (Table 1). The granules that were formed had a diameter of approximately 2 mm, were very compact (i.e. not floc-like) and could not easily be disintegrated. They were analyzed by light microscopy and it was clear that the dominant organism was a curved rod. Other organisms were also present: a Streptococcus sp., a diplococcus and a rod-shaped bacterium (presumably a Clostridium
Table 1. Concentrations of fermentation products of a mixed culture of an acidifying stage of a two-stage anaerobic wastewater treatment system; glucose conversion is complete. Cultures at dilution rates of 0.6 h"1
grew in aggregated form, dry weight biomass concentrations up to 20 g/1. Figures
D h"1
0.2
0.6
between brackets from Beeftink & Staugaarc
acetate lactate mM mM
23 (18) 0 (-)
22 (17) 5 (-)
propionate mM
6 (M
30 (29)
1 (1986).
butyrate mM
28 (23)
9 (9)
valerate mM
2 (0)
6 (9)
35

sp.). but these organisms were quantitatively of minor importance. Another interesting feature of these granules was that no capsular material could be observed under the light microscope. It was decided to try to isolate the curved rod and to study more closely whether it played an important role in the process of granule formation.
The curved rod could indeed be isolated and was classified as Selenomonas ruminantium subsp. lactilytica. This organism was further studied in chemostat culture with glucose as the growth-limiting carbon and energy source. The organism produced acetate and propionate and small quantities of lactate from glucose. This distribution of products was different from that found in the mixed culture, but on the other hand some similarities were apparent. Thus, the concentrations of acetate, propionate and lactate were in good agreement, but it is clear that pure cultures of S^ ruminantium did not produce butyrate and valerate (data not shown). This is, of course, not surprising since the production of these substances from glucose has never been described in cultures of this organism. We propose that these compounds are produced by the other organisms in the mixed culture, such as the Clostridium sp.. At a dilution rate of 0.01 h"1 small clusters of lysed cells, possibly entrapping viable cells, were observed. At a dilution rate of 0.1 h"1, however, no lysed cells and no clusters were observed.
At this stage of the investigations there was a need for a quick assessment method of the aggregate-forming potential of a microbial culture. For this purpose we developed an even smaller AGLR (miniature AGLR, working volume 8 ml). The lift gas was the same as used for the 100 ml AGLR developed by us. This system was used under different circumstances to analyze samples from different cultures for their aggregate-forming capabilities. The miniature AGLR was inoculated with a sample from the culture under study and the dilution rate of the miniature AGLR was set immediately at 1 h'1 . After 24 hours the miniature AGLR was checked for the formation of aggregates. Our experience has shown that when aggregates were formed under these conditions, the original culture from which the inoculum was taken, wojjld also form aggregates after prolonged cultivation. When no aggregates were formed within 24 hours, the culture under study would not produce aggregates in the next»'few f days. When the microscopic aggregates of the,-.cheniostat culture of Selenomonas ruminantium grown at a dilution rate of 0.01vh7* Jf&ee above) were inoculated into this miniature AGLR, they refedily formed aggregates withiij 24 hours. These aggregates were, as expected, also- obtained in the chemostat after prolonged cultivation. Macrosçopicaljy, the aggregates were very similar to those obtained in the mixed quitures: they had the same colour (yellow-grey) and size (diameter 2.mm);' and were also very rigid. The importance of these findings lies in the fact that now aggregate formation was obtained without the addition of sand as the carrier material. A
Although the mechanism of aggregate formation by this organism in mixed and pure culture has not yet been elucidated by us, preliminary experiments (Mulder et al., 1987) indicate that cell lysis is an important factor in this process. This could be substantiated by chemical analysis of the aggregates, which showed that hexose levels were between 3 and 10% (w/w), depending on the growth conditions. And whereas one might argue that these levels are higher than those routinely found in bacterial cultures that are grown in chemostat culture under carbon-limited conditions (Herbert, 1976), they are not unusual for cultures of Selenomonas ruminantium growing on glucose (Wallace, 1980). Together with the absence of any indication of polysaccharide in photomicrographs and electronmicrographs (not shown), we tentatively conclude that some other
36

polymer must be responsible for tions.
aggregate formation under these condi-
Aggregate formation in pure cultures of Clostridium butyricum.
As described in the previous section, one of the organisms present in the first stage of an anaerobic waste-water treatment system was a Clostridium sp.. Subsequent analyses showed that it could be identified as Clostridium butyricum. Therefore we decided to study the physiology of this organism more closely in chemostat culture, using however a strain from the Delft collection (LMD-77-II) . The organism was cultivated in chemostat culture (medium of Evans et al. ,1970, but with 27 g/1 glucose, pH 6.0, temperature 30 °C) and its fermentation products were determined (Table 2).
Table 2. Effect of culture volume changes in a chemostat culture on the amount of glucose consumed and growth efficiency of Clostridium butyricum.
Culture Volume Changes
12
29
46
GLUCOSE input
mM
I52
147
147
rest mM
81
67
46
Dry weight mg/ml
1.1
1.22
1.7
ACETATE
mM
20
22
34
BUTANOL formed
mM
4
3
3
BUTYRATE
mM
29
41
54
HEXOSE in biomass
% (w/w)
14
6
5
At the moments indicated in Table 2 a miniature AGLR (see above) was inoculated with material from the chemostat. The medium that was fed to the 3 AGLR's was the same as used for the chemostat culture except that the glucose concentration was lowered to 9 g/1- After batch-wise growth for 1 hour the dilution rate of the culture was set at 1 h"1. The results of this experiment are shown in Table 3-
It is clear that the changes that were apparent in the chemostat culture after 46 volume changes were reflected in the behaviour of the cells in the miniature AGLR: within 16 hours aggregate formation could be observed. Of course, the culture was checked for contaminants, but based on all the accepted criteria (morphology, Gram stain, fermentation pattern) the culture was pure and the organism was still a bona fide Clostridium butyricum.
The large size of the aggregates that were obtained in the miniature AGLR with the inoculum from the chemostat after 46 culture volume changes caused serious technical problems and the experiment could not pursued further. However, when some of the aggregates that accumulated in the miniature AGLR were inoculated back into a normal chemostat culture (pH 6.0; 3% (w/v) glucose; D = 0.1 h-1) aggregates accumulated within 24 hours. After two weeks of cultivation on the same medium this culture
3 7

Table 3 • Effect of culture volume changes in a chemostat culture of Clostridium butyricum on the aggregate forming capacity of the cells.
Culture Volume CHEMOSTAT miniature AGLR Changes in steady state after 16 hours
12 no aggregates wash out
29 some wall growth wash out
46 wall growth and tiny aggregates large aggregates
grew truly glucose-limited (i.e. the glucose concentration of the culture fluids was virtually zero). This observation showed that an aggregating variant of C^ butyricum was isolated (see also, Zoutberg et al., 1987).
The aggregates formed by this variant were examined by light microscopy and this showed that the organisms were surrounded by an extensive layer of polymer material. Staining with Alcian Blue showed that this polymer was most likely an acidic polysaccharide. This was confirmed by chemical analysis of the granules : the hexose content of the aggregates was between 20 and 30$ (w/w). Microscopic inspection of the aggregates of this organism did not provide any evidence for lysis as a mechanism for aggregate formation. This is in sharp contrast with the results obtained with the mixed cultures and the pure cultures of Selenomonas ruminantium described above. Moreover, the colour and appearance of the aggregates formed by the variant of Clostridium butyricum were clearly different from those formed by Selenomonas ruminantium: the clostridial aggregates were chalk-white and large (usually a 'diameter of 5 m m and bigger)._
The experiments shown in Table 2 point t'o another interesting phenomenon. The medium was nominally glucose-limited, L.e. under "normal" circumstances the rest concentration of glucose should have been in th£ micromolar range. This indicates that some other factor limited the growth of the organisms under the applied growth•,conditions."* Addition of other medium components, however, did1 not.. result in increased dry weights. On the other hand, Crabbendam et al. (1985) performed similar experiments with the same organism, using the same medium except that a glucose concentration of 10 g/1 was used. These authors were able to attain true glucose-limited growth conditions. Under these conditions the same fermentation products were formed and also the ratio [acetate formed]/[butyrate formed] was similar. This shows that the cultures of the variant behaved similarly with respect to glucose metabolism.
In two respects, however, the cultures that were obtained after 46 culture volume changes were different from the'wild-type: (i) the variant showed a clearly different type of fermentation when it was grown at culture pH values below 6.0: under these conditions iso-propanol and n-butanol were also produced from glucose (Zoutberg et al., 1987) and this had never been observed in cultures of the wild-type grown at similarly low pH values (Crabbendam et al., 1985), and (ii) the concentrations of acetate and butyrate that were present in the cultures described in this contribution were substantially higher than those present in the cultures of Crabbendam et al. (1985) . This led us to investigate whether the
38

concentration of fatty acids in the culture were a factor in the selection of the aggregate-forming variant. We first determined the effect of the initial concentration of butyric and acetic acid, respectively, in the culture on the maximum specific growth rate of this organism, when it was grown at pH 6.0 in a batch culture (medium of Evans et al., 1970, input glucose 1% (w/v)). The results showed that: (i) both acids led to a decreased maximum specific growth rate of the organism with increasing concentrations of the'acid, and (ii) butyric acid showed a substantially greater effect than did acetic acid. We hypothesize that the toxic effect of these acids is caused by the undissociated form of these compounds. It has been proposed by others (e.g. Herrero et al., 1985) and by us (Hueting & Tempest, 1977. Neijssel & Tempest, 1986) previously that weak acids will act as protonophores, particularly at pH values near their pK value. This activity will lead to a dissipation of the proton-motive force across the cell membrane, which will cause a fatal energy drain. Apparently, the variant that we have obtained after prolonged cultivation in chemostat culture became more resistant to the toxic effect of weak acids. On the other hand, it is possible that the variant that we isolated was a more vigorous producer of extracellular polysaccharide. More detailed experiments are needed to elucidate the physiological reasons for the increased survival potential of the variant.
Concluding remarks
The experiments described in this article indicate that aggregate formation by bacteria can be accomplished via at least two mechanisms. The first is the presence of an aggregate forming organism in the culture system. An example is the presence of Selenomonas ruminantium in the acidifying stage of a model two-stage anaerobic waste water system. In this connection, it is tempting to speculate whether other types of media (e.g. protein- or lipid-containing media) will also lead to aggregate formation. The main problem will be whether Selenomonas ruminantium will be able to establish itself as an aggregate "nucleus" in such media. On the other hand, it is by no means certain that the aggregate-forming capacity of this organism is unique. It is very well possible that in other media other organisms will play a similar role. One has to realize that the basic strategy of the experiments described in this article and by Beeftink & Staugaard (1986) is the creation of an environment that is extremely selective for biomass retention by aggregate formation: the dilution rate of the culture is set above the maximal growth rates of the different microbes in the culture. Hence, any non-aggregating organism will be quickly washed out and only those organisms that adhere to the wall and other surfaces which are present in the culture vessel (baffles, electrodes, etc.), or are able to form aggregates that will be retained in the fermentor, will survive.
The experiments with Clostridium butyricum have made it clear that the production of extracellular polysaccharide is another important mechanism of aggregate formation. This mechanism^ is known to occur also in the formation of tooth plaque. It is also clear that apart from the production of polysaccharides a second factor plays a role in this process and it could be that resistance to the toxic effect of short-chain fatty acids is another important factor. Again, however, the experiments show that auto-immobilization is a phenomenon that is much more widespread than is commonly thought.
The significance of the approach described in this contribution is that, whereas microbiologists have usually preferred to work with nicely suspended cultures, aggregated cultures are worth studying for a great
39

number of reasons. From a fundamental point of view these culture are interesting in that they can provide us with more insight into the mechanism of microbial adherence and aggregate formation. This behaviour clearly plays an important role in the survival of microbes in Nature, since in many environments the flow rate of the fluid is many times greater than the maximal growth rate of the existing microbial population. And when at least some microbes would not possess the ability to adhere to surfaces or to form aggregates, no microbial life would be possible under such circumstances. Another reason is that auto-immobilization could provide an interesting approach in biotechnological production systems.
Acknowledgements
These investigations were supported by the Netherlands Technology Foundation (STW) , Technical Science Branch of' the Netherlands Organization for the Advancement of Pure Research (ZWO). The authors wish to thank R. de Jonge, B. Simons, G. Smit, J. Verkuijlen, and R. Willemsberg for carrying out some of the experiments and their skillful technical assistance, and Dr. J.T.M. Wouters for his advice.
References
Beeftink, H.H. & J.C. van den Heuvel, 1987. Novel Anaerobic Gas-Lift Reactor (AGLR) with retention of biomass: start-up routine and establishment of hold up. Biotechnology and Bioengineering 30:233-238.
Beeftink, H.H., & P. Staugaard, 1986. Structure and dynamics of anaero bic bacterial aggregates in a gas-lift reactor. Applied and Environmental Microbiology 52:1139-1146.
Crabbendam, P.M., O.M. Neijssel & D.W. Tempest, 1985. Metabolic and energetic aspects of the growth of Clostridium butyricum on glucose in chemostat culture. Archives of Microbiology l42:375"382.
Evans, C.G.T., D. Herbert & D.W. Tempest, 1970. The continuous cultivation of micro-organisms. 2. Construction of a chemostat. In: J.R. Norris & D.W. Ribbons (Ed.): Methods in Microbiology, Vol •£. Academic Press, London, p. 277-327. , •„., \ . '
Herbert, D. , 1976. Stoicheiometric aspects in,, microbial growth. In: A.C.R. Dean, D.C. Ellwood, C.G.T. Evans'& j'. Melling (Ed.): Continuous Culture 6: Applications and New'Fields, Ellis.Horwood Ltd. Chichester, p. I-30. ' • . . *• j , *
Herrero, A.A., R.F. Gomez, B. Snedecor, C.J. -polman & M.F. Roberts, 1985. Growth inhibition of Clostridium .thermpcel'lum by carboxylic acids: a mechanism based on uncoupling by weak acids. Applied Microbiology and Biotechnology 22:53-62. , ,
Hueting, S. & D.W. Tempest, 1977- Influence of acetate on the growth of Candida utilis in continuous culture. Archives of Microbiology 115:73-78.
Mulder, R., M.G.M. Tromp & J.T.M. Wouters, 1987. Aggregation of Seleno-monas ruminantium; initiated by cell lysis? In: O.M. Neijssel, R.R. van der Meer & K.Ch.A.M. Luyben (Ed.): Proceedings of the 4th European Congress on Biotechnology, Vol. 1, Elsevier Science Publishers B.V., Amsterdam, p. 259-
Neijssel, O.M., & D.W. Tempest, I986. Overproduction of Microbial Metabolites. In: M. Moo-Young (Ed.): Comprehensive Biotechnology Vol. 1, Chemical and Biochemical Fundamentals (Ed. H. Dalton), Pergamon Press, New York, p. 6O5-6I6.
Wallace, R.J., 1980. Cytoplasmic reserve polysaccharide in Selenomonas
40

ruminantium. Applied and Environmental Microbiology 39:630-634. Zoutberg, G.R., R. Willemsberg, R. de Jonge, G. Smit & J.T.M. Wouters,
1987. Solvent production by an aggregate-forming variant of Clostridium butyricum. In: O.M. Neijssel, R.R. van der Meer & K.Ch.A.M. Luyben (Ed.): Proceedings of the 4th European Congress on Biotechnology, Vol. 3. Elsevier Science Publishers B.V., Amsterdam, p. 531.
41

IMMOBILIZATION OF ANAEROBIC BACTERIA IN METHANOGENIC AGGREGATES
J.T.C. Grotenhuis, E. Koornneef, CM. Plugge
Department of Microbiology, Wageningen Agricultural University, Hesselink van Suchtelenweg 4, 6703 CT Wageningen, The Netherlands
Abstract
The immobilization of a mixture of a propionate-degrading coculture and Methanothrix soehngenii as well as the immobilization of a pure culture of Methanosarcina barkeri was studied in a recycling system. The recycling system consisted of a 1 1 fermentor coupled to a 0.5 1 UASB-reactor. Aggregates of up to 300 urn in diameter were formed after 52 days with the mixed culture and of up to 180 um after 25 days with M. barkeri. The recycling system is particularly useful for studying the immobilization of bacteria which have low maximum specific growth rates and low growth yields.
Introduction
Once granular sludge is obtained it can in general be cultivated quite easily in Upflow Anaerobic Sludge Blanket (UASB)-reactors on specific wastewaters (De Zeeuw, 1984; Dolfing, 1987). However, from suspended biomass a relative long period of time (60 days or more) is often needed before granulation starts (Hulshoff Pol, 1983). Not all wastewaters are suited for granule formation. The reason for this is not yet known. To obtain more insight into the granulation process an investigation was started to study the initial steps of bacterial aggregation in UASB-reactors. These experiments have been done with defined microbial populations in a recycling system- in which self immobilization of bacteria could be studied under various environmental conditions. In the following this recycling system is presented together with s\>me d ta on its performance. , , - » • •
Materials and methods < *
' * '.' - i Cultures ' •"
A propionate-degrading coculture 'as' described by Houwen et a l . (1987) was used. Methanothrix soehngenii (DSM 2139) and Methanosarcina barkeri (DSM 800) were purchased^rom the Deutsche Sammlung von Mikroorganismen, Göttingen, FRG. These methanogenic cu l tu res were chosen because in granules grown on propionate as sole carbon and energy source M. soehngenii was the most abundant acetate-degrading organism, whereas in ethanol-grown granules a lso Methanosarcina was present (Grotenhuis, unpublished r e s u l t s ) .
The media were prepared according to Houwen et a l . (1987). The propionate degrading coculture was grown in a mineral medium with 44.6 mM propionate as carbon and energy source. The two methanogenic s trains were c u l t i va t ed with 78 mM ace ta te . The medium for Methanosarcina barkeri contained a lso 2 g/1 yeast ex t r ac t . All c u l t u re s were grown in
42

Preparation of the inoculum
Bacterial suspensions (8 1) were centrifugea anaerobically for 1.5 to 2 h at 7000 x g. Sterile polypropylene tubes (250 ml) with butylrubber stoppers were used. M^ barkeri was concentrated by sedimentation in a sterile syringe. For the recycling experiment a 1:1 mixture on base of protein of the propionate-degrading coculture and M^ soehngenii was used. Protein was determined in sulfide free samples by the Lowry method. The recycling system was inoculated with cell suspensions containing 39.7 and 21.6 pg protein/ml for the mixed and pure culture, respectively.
Recycling system
The recycling system was constructed of a 1 1 fermentor and a 0.5 1 UASB-reactor (internal diameter 2.93 cm) (fig. 1). The fermentor top consisted of a 10 mm thick butylrubber plate. Sample ports at various heights of the UASB-reactor were sealed with butylrubber stoppers. The two reactors were connected to each other with butylrubber tubings. The suspension was pumped from the fermentor to the UASB and recycled from the top of the UASB to the fermentor. The system which was operated in batch mode was kept under overpressure by a 1 m watercolumn. To assure anaerobic conditions in the system the gas mixture, consisting of N2/C02
(80/20), was led through a solution of 1 mM Na2S.
Sampling of the recycling system /
For fatty acid determination samples were withdrawn from the top sample port of the UASB-reactor. For the analysis of the aggregates, at the end of the experiment the top of the UASB was removed and samples of 50 ml were taken from the top to the bottom.
Preparation for scanning electron microscopy
Samples were filtrated through 0.2 um nucleopore polycarbonate membrane filters. Then, the filters were rinsed with 25 mM sodium cacodylate buffer (pH = 6.8) and fixated for 1 hour with 2 X glutaraldehyde in cacodylate buffer. A second fixation was done with 1 X OsO. in cacodylate buffer for 0.5 hour, followed by dehydration through graded series of water-ethanol mixtures. The ethanol was replaced by COo followed by critical point drying at 40°C and 100 atm. The filters were attached to copper tape on a stub and subsequently sputter-coated with gold and examined at 15kV in a JEOL 35C electron microscope.
Results
Aggregation of the propionate-degrading culture
The mixed propionate-degrading cu l tu re aggregated r ap id ly in the recycling system. After 11 days at an upflow velocity 3.9 cm/h the f i r s t aggregates were observed a t the bottom of the UASB-reactor. The propionate concent ra t ion had decreased from 44.6 mM to 30.6 mM. The acetate concentration had increased to 6.6 mM. , Gas production from the aggregates was observed. After 52 days the experiment was stopped and aggregates were analysed. At t ha t t ime the
43

gas — = ET
/ort w&w
6 6
jl m im11 n ? nj-/,i n r iryz. n i m^in i iifcUL
A
11 I U 1 ITl
.—-gas
F i g . 1 . S chema t i c d i ag ram of t h e r e c y c l i n g s y s t em. 1. f e rmen t o r -2. magne t i c s t i r r e r ; 3. pump; 4. UASB-reactor ; 5. b a c t e r i a l f i l t e r -6. b o t t l e w i th Na2S; 7. 1 m watercolumn.
p ropionate and a c e t a t e c o n c e n t r a t i o n s w e r e 19 .5 mM and 9 2 mM r e s p e c t i v e l y .
Samples t a k en from t h e t op of t h e r e a c t o r c o n t a i n e d no a g g r e g a t e s -only suspended c e l l s from t he p r o p i o n a t e - d ^ r a d i n g c o c u l t u r e were observed. Samples a t 10 cm from t h e ( bo t t om of t h e UASB-reaVtor ehowed small aggregates conta in ing Methanothirix soëhngenii . b a c t e r i a from the p ropionate-degrading c o c u l t u r e and- i n o r g a n i c p j f&c ip i t a t e s ( f i g . 2 ) These p r e c i p i t a t e s cons is ted predominantly of calciumphosphate ( r e su l t s not shown). At t h e bo t tom s i m i l a r a g g r e g a t e s w i t h a d ia imeter ,of up to 300 urn were obse rved ( f i g . 3) . - ' ' .
Aggregation of Methanosarcina ba rke r i • '
At the s t a r t of the experiment par"tA of the inoculum sank d i r e c t l y to the bottom of the UASB-reactor. After 4 days of r e c i r c u l a t i o n a t a flow r a t e of 13.1 cm/h an i nc rease in the mass of aggregates was observed. At t h a t t ime about 25 mM ace t a t e was consumed. The formation of b a c t e r i a l aggregates was r a t h e r f a s t . A f t e r 25 days t h e r e a c t o r was s t opped , because no f u r the r consumption of a c e t a t e could be measured for 7 days Samples taken from the bottom of the UASB-reâctor showed aggregates wi th d iameters of u p t o 180 um ( f i g . 4) .
44

Fig. 2. Aggregate at 10 cm from the bottom of the UASB-reactor (bar = 10 pm).
Fig. 3. Aggregate at the bottom of the UASB-reactor (bar = 100 pm).
45

Fig. A. Aggregate of Methanosarcina barkeri present at the bottom of the UASB-reactor (bar = 10 um).
Discussion
*> The experiments described above show that a mixed propionate degrading
culture and a pure culture of Methanosarcina barkeri were al|ie to form aggregates in the recycling system.'„.The »system was inocuiated"with cultures of suspended bacteria; only in the inoculum of M _ barkeri also some small aggregates of up to 5 urn were'present.'The first aggregate^ were formed rapidly, and at the'end of the experiments their maximum size was 180 iim for M. barkeri and 300 um fo,f the propionate dejgrading culture. The minimal size of the aggregates, twhich are able to maintain in the UASB-reactor can be calculated wi.th the Stokes' law (equation 1).
d p = 2 . g • ( pr
CD P1J
In this equation d = particle size (m); (N . s. m " 2 ) ; v1
1--P-g = gravity (m
dynamic viscosity liquid upflow velocity (m . s~ );
s" ); p„ ^particle density (kg . m ); P]_ = liquid density (kg . m ).
The As can be seen this minimum particle size is dependent on v-i and p .
. . . . . . . . . . . . . . J - . , P pD is dependent on both the density of the biomass and the density
of inorganic precipitates. Remarkably, aggregates with Methanothrix
46

showed h igh amounts of i n o r g a n i c m a t e r i a l s , whereas i n e l e c t r o n micrographs of M.e thanosarc ina no p r e c i p i t a t e s were v i s i b l e . At t h e moment i t i s not c l e a r whether the two types of a c e t o c l a s t i c methanogens d i f f e r i n d e n s i t y .
The immobi l iza t ion i s a l so dependent on phys ica l -chemical p rope r t i e s of b a c t e r i a . For aerobic b ac t e r i a i t has been shown t h a t hydrophobici ty and e l e c t r o p h o r e t i c m o b i l i t y d e t e rm in e i n i t i a l s t e p s of b a c t e r i a l adhesion (Van Loosdrecht e t a l , 1987). Further they found an i nc rease in hydrophobici ty a t h i g h e r d i l u t i o n r a t e s i n c on t i nuous s y s t ems , and an i nc rease of adhesion of b ac t e r i a wi th hydrophobicity. Such an in f luence of the d i l u t i o n r a t e on the immobi l iza t ion of anaerobic b a c t e r i a can be s tudied by expanding the r ecyc l ing system to a continuous system. The r ecyc l ing system i s p a r t i c u l a r l y useful for b a c t e r i a which have low spec i f i c g rowth r a t e s and low g rowth y i e l d s . Only a v e ry low amount of b a c t e r i a l biomass i s needed for the s t a r t - u p of the r ecyc l ing system and the UASB-reactor can be run a t high flow r a t e s wi thout l oss of biomass. Experiments wi th the r ecyc l ing system de l ive r q u an t i t a t i v e data on the immobil izat ion mechanism of such anaerobic b ac t e r i a . A s e l e c t i on of the most i m p o r t a n t p a r a m e t e r s can be made by compar ing e x p e r i m e n t a l d a t a wi th n u m e r i c a l s i m u l a t i o n s . From t h i s g u i d e l i n e s f o r t h e s t a r t - u p of UASB-reactors can be obtained.
Acknowledgements
This s tudy was s uppo r t ed by t he Ne t h e r l a nd s Technology Founda t ion (STW). P a r t of t h e funding f o r t h i s r e s e a r c h was p rov ided by a s p e c i a l g rant of G i s t - b r o c a d e s NV, De l f t , The N e t h e r l a n d s . T r a n s - A t l a n t i c communication has been g r e a t l y f a c i l i t a t e d by NATO Resea r ch Grant No. 064/86.
References
Dolfing, J. , 1987. Microbiological a spects of g ranular methanogenic s ludge. PhD T h e s i s , Wageningen A g r i c u l t u r a l U n i v e r s i t y , The Nether lands .
Houwen, F.P., C. Di jkema, C.H.H. Schoenmakers , A.J.M. S tams , A.J.B. Zehnder, 1987. C-NMR s tudy of p r o p i o n a t e d e g r a d a t i o n by a methanogenic cocu l tu re , FEMS Microbiology Le t t e r s 41:269.
Hulshoff Po l , L.W., W. de Zeeuw, J . Do l f i ng , G. L e t t i n g a , 1983. S t a r t up and sludge g ranu la t ion in UASB-reactors. In: W.J. van den Brink: Proc. Europ. Symp. Anaerob ic wa s t e w a t e r t r e a t m e n t , TNO Co rpo r a t e Communication Department, The Hague, 40.
Loosdrecht, M.C.M. v a n , J . Lyk l ema , W. No rd e , G. S c h r a a , A .J .B. Zehnder, 1 987 . E l e c t r o p h o r e t i c m o b i l i t y and h y d r o p h o b i c i t y measurements as a measure to p r ed ic t the i n i t i a l s teps of b a c t e r i a l adhesion. Appl. Environ. Microbiol . 53: 1899- 1902.
Zeeuw, W.J. de , 1984. A c c l i m a t i z a t i o n of a n a e r ob i c s l udge f o r UASB-reac to r s t a r t - u p . PhD T h e s i s , Wageningen A g r i c u l t u r a l U n i v e r s i t y , The Ne the r l ands .
47

MODELING GRANULE GROWTH IN A PROPIONATE-FED UASBR
J.C. Kissel
School of Public and Environmental Affairs, Indiana University Bloomington, Indiana, USA
J.T.C. Grotenhuis, A.J.B. Zehnder
Department of Microbiology, Agricultural University Wageningen, the Netherlands
Abstract
Upflow anaerobic sludge blanket reactor (UASBR) technology appears promising, but phenomena governing the formation and growth of granules are inadequately understood. Complimentary computer and laboratory-based investigations simulations of granule growth are underway. A propionate-fed system was selected for simplicity based on prior experience modeling mixed-culture biofilms. Modeling solute concentration dependent growth of non-uniformly sized granules involves nested iterative procedures. Solute profiles within granules in each size interval are computed independently using the shooting method and an assumed external concentration. Then the external value is adjusted iteratively to achieve a mass balance on the reactor. Incorporation of MINEQL into the model allows examination of the impact of inorganic precipitates on overall granule growth. This impact is shown to be potentially quite large.
Introduction »
The advantages of anaerobic biological treatment of wastewater are well known and have been enumerated by-LettUnga et al. (1980) among* others. Upflow Anaerobic Sludge Blanket Reactor (U*6BR) technology represents a means of utilizing anaerobic systems at high hydraulic as well as organic loading rates. Optimal application however, requires that the behavior (specifically formation and growtfh) of| granules in UASBRs be more fully understood. ^Granulation involves complex mixed-culture interactions and.physical-chemical phenomena. Several investigators have reported, for instance, that availability of calcium impacts granuLe formation and growth (Lettinga et al., 1980; Hulshoff Pol et al., 1983; Alibhai et al., 1986; Mahoney et al., 1987). This may be due to precipitation of calcium-phosphate complexes as hypothesized by Mahoney et al. (1987) and suggested by the identification by Harvey et al. (1984) of calcium and phosphorous rich regions in a methanogenic biofilm; or to some calcium effect on cell viability as suggested by Boone and Mah '(1987) and the variation in granule microbial composition with calcium availability reported by Hulshoff Pol et al. (1983); or to the influence of calcium as a divalent cation on flocculation as suggested by Lettinga et al. (1980) and by Cail and Barford's (1985) finding that formation of
48

granules could be promoted by addition of polyelectrolytes. These effects may occur simultaneously and the latter two may be connected as van Loosdrecht et al. (1987a, 1987b) have found bacterial surface properties to be species and growth-condition dependent. Calcium-bacterial surface interactions can thus be expected to vary with growth conditions and possibly to differentially impact individual species in mixed cultures.
All of the above suggests that mathematical description of granule growth should include some treatment of pertinent solution chemistry. A widely-used aqueous chemical equilibrium model, MINEQL (Westall et al., 1976), has therefore been chosen for inclusion in the granule growth model described below and hereafter referred to as GGMIN.
Model Development
Mathematical modeling of real systems necessarily involves trade-offs between costs of model development and operation and sophistication of representation. The approach taken here was to start at a relatively simple, but structurally flexible, level with a view toward adding complexity as experimental data becomes available. Consequently, GGMIN currently deals with a single substrate. (Propionate has been selected based on prior modeling and laboratory experience.) Additionally granular anaerobic sludge is assumed to be describable as a suspension of heterogeneously sized, but internally homogeneous, spherical particles with a discreet distribution of diameters. The fluid in which the spheres are suspended is assumed to be completely mixed.
A mass balance on a shell of fixed volume within a spherical particle, in which degradation of a single solute occurs according to Monod kinetics and mass transport is by diffusion alone, can be written:
- = D f 3t
f3 2C 2 3C1 +
3r~2 r* 3r
k C . Xa ( 1 ,
where C = solute concentration, t = time, r = radius, D = intraparti-
cle diffusivity, k = maximum utilization rate, K = Monod coefficient,
and X = active biomass concentration. If solute utilization is rapid a r
relative to biomass growth, pseudo steady state solute diffusion and
reaction can be assumed (Kissel, et al., 1984) and eq. 1 reduces to:
dJl- -l. d±+L — ** (2) dr 2 r dr D KB + C
In GGMIN eq. 2 is solved sequentially for each particle size interval subject to dC/dr = 0 @ r = 0 (granule center). The shooting method is employed (i.e. a value of C at r = 0 is assumed and additional values of C are computed at subsequent values of r). Step size
49

intervals are chosen so that volumes of segments rather than distances between nodes are constant. At the surface the mass flow rate calculated from the solute slope in the last segment:
G. = D--A- f^l „ (3) in f LdrJr = R
and the mass flow rate calculated from the difference between the computed granule surface solute concentration and the assumed bulk solute concentration:
G , = K -A- C. .. - C , (4) out HT i bulk surface;
are compared (A = area, Kpjj = external mass transfer coefficient). If the difference is not acceptable, a new guess of C at r = 0 is made and the procedure repeated. A simple iterative scheme for selecting a new value of C at r = 0 is employed:
(G . - G. ). _ out in l
r=0,i + l " r = 0,i (G . - G, ). - (G - G. >. , (5) out in l out in l-l
Cr=0,i Cr=0,i-1
By applying the effectiveness factor concept a noniterative procedure could be used to estimate solute utilization in a sphere as has been done by Beeftink (1987). The approach used here was chosen in anticipation that multiple, interactive solutes (i.e. propionate, acetate, hydrogen) and/or heterogeneous granule composition might eventually be treated by the model. In either case effectiveness factor relationships would be unavailable.
Since the rate of solute utilization by particles in each s u e interval is dependent upon (and impacts y bulk solute concentration,*» solute profiles within each size class cannot be cogyjjuted independently. Consequently an initial guess 'of bulk solute concentration is made and then adjusted using the,same iterative strategy as represented by eq. 5. For the sirfgle solute cas£, with ten distinct granule sizes, iteration has been found to be very rapid. Generally one to three passes are,required for solute profile convergence and, after the first step, a single bulk concentration guess is adequate. Perturbations such as a change in feed concentration increase iterations but nut greatly. Prior experience suggests that multiple, interactive substrates would increase computational requirements substantially.
Following solute profile determination, granule size is updated by adding mass attributable to biological growth'(utilization rate'time interval'yield) and inorganic precipitation (precipitate concentration-reactor flow rate'time interval). Provision for empirical treatment of shear losses has been made pending adequate quantification. Biological decay, granule breakup, and attachment mechanisms other than precipitation are not considered at this Btage. Inorganic precipitates are assumed to be entirely
50

retained, so results shown below represent a maximum impact on particle growth due to precipitation. Deposition and shear losses are assumed to be uniform with respect to surface area. After granule size adjustment, solute concentration calculations are repeated.
Model Output
Results of a model trial are presented here. A similar laboratory experiment has been completed, but data analysis was incomplete at the time this paper was prepared. The simulation assumes a reactor volume of 0.5 liters and flow rate of 1.2 liters/day. The feeding regimen is shown in Table 1. Abrupt changes in propionate input were handled easily by GGMIN.
Table 1. Trial description.
Feed Endpoint Propionate Cone. Interval (days) (mg/1)
1 49 1700. 2 85 3400. 3 113 6800. 4 182 1700.
Table 2 displays total concentrations of major inorganic feed constituents. (Data is input to MINEQL in this form.) Elevated total PO4 reflects use of a phosphate buffer. Total calcium (27 mg/1) is not high relative to levels reported in some tests of calcium impact on granulation (Hulshoff Pol et al., 1983; Alibhai et al., 1986; Wahoney et al., 1987).
Table 2. Total (not free) molar concentrations of major inorganic components of feed.
Ca 2 +
M 2* Mg
+ K
6. 9E-4
1.6E-4
9. 4E-4
<
< CI
9.2E-3
3.1E-3
2. OE-3
Na 1.4E-2
H+ 1.3E-2
» Initial innoculation was assumed to consist of about 23,000 granules with a total dry masB of about 6 g. Since the model does

not consider particle breakage, the numbers of particles shown in Table 3 in each size interval at the end of the 180 day simulation are the same as were present initially. However, the corresponding diameters are changed as is reflected in the increased total mass. If biological growth alone is considered, a total mass of less than 15 g is predicted at 180 days. A maximum specific utilization rate for propionate of 0.9 g/g-day, Monod coefficient of 35 mg/1, and yield of 0.015 g/g were assumed for calculations shown here.
Also shown in Table 3 are the fraction of total mass attributable to each size interval and active and inert fractions within each size interval. Since inorganic deposition has been assumed to be evenly distributed with respect to surface area, the smaller granules (with higher specific surface area) showed increases in fractional mass at the expense of the larger granules during the simulation. Initially the largest fractions of total mass were in the intermediate size intervals. The impact of inorganic precipitation is also reflected in the higher inert content of the smaller granules. (All granules were assumed to be 31X inert material initially). Essentially all of the precipitation predicted by MINEQL is attributable to Ca50H(P04
Table
Size
3.
Interval
1 2 3 4 5 6 7 8 9
10
»3-
Model ou
No. of Granules
8900 5400 2900 2000 1300 890 S10 400 240 160
tput at 180
Diameter (cm)
0. 178 0.206 0.241 0.263 0.296 0.318 0.350 0.372 0.403 0.424.
days.
Mass (g)
4.15 3.88 3.35 3.02 2.80 2.37 2.17 1.70 1.30 1.01
Fraction Total Mass
0.161 0.151 0.130
»0.117 0.109 -y
'0.092 '0.*084 \ ' 0.066 * -. 0. 05*1 0.039 , -
Fraction Active
0.43 0.47 0.50 0.52 0.54 0.55 0.56 ^57 0.58 0.58
Fraction Inert
0.57 0.53 0.50 0.48 0.46 ?.45 0.44 0.43 0.42
, 0.42
22, 800 25. 8
Propionate concentration» at granule cçnterB and surfaces for each granule diameter are shown in Table 4. At 180 days only the smallest granules are predicted to be fully penetrated. External mass transfer resistance, which accounts for the difference between surface and bulk concentrations, was estimated using mass transfer coefficients for spheres settling at terminal velocity in accordance with Stokes' Law.
52

Table
Size
4.
Interval
1 2 3 4 5 6 7 8 9
10
Summary
Propionate
Concen
Granule Center
1.12 0.51 0.20 0. 11 0.05 0.03 0.01 0.01 0.00 0.00
concentration pre
tration
Granule Surface
20.2 19.9 19.6 19.5 19.2 19.1 19.0 18.9 18.7 18.7
ma/1)
Bulk Liquid
22.3 22.3 22.3 22.3 22.3 22.3 22.3 22.3 22.3 22.3
A sophisticated aqueous chemical equilibria model, MINEQL, and subroutines describing solute diffusion and solute degradation according to Monod kinetics in heterogeneously sized, homogeneous spherical granules have been linked. A trial simulation has shown that inorganic precipitation can potentially account for increases in granule mass that are significant relative to microbial growth. The model currently contains many simplifications, but requires little computer time. Further refinement is anticipated as information from laboratory work becomes available.
Acknowledgments
Trans-Atlantic communication has been greatly facilitated by NATO Research Grant No. 064/86. Support of J.T.C.G. has been provided by the Netherlands Technology Foundation (STW). The assistance of Chad Gubala and Mary Willet, Indiana University, is also acknowledged.
References
Alibhai, K. R. K., & C F . Forster, 1986. An Examination of the Granulation Process in UASB Reactors. Environmental Technology Letters, 7, 193-200.
Beeftink, H.H., 1987. Anaerobic Bacterial Aggregates: Variety and Variation. Ph.D. Thesis, University of Amsterdam.
Boone, D. R. S R. A. Mah, 1987. Effects of Calcium, Magnesium, pH and Extent of Growth on the Morphology of Methanosarcina mazei S-6. Applied S Environmental Microbiology, 53(7), 1699-1700.
Cail, R.G. & J. P. Barford, 1985. The Development of Granulation in an Upflow Floe Digester and an Upflow Anaerobic Sludge Blanket Digester Treating Cane Juice Stillage. Biotechnology Letters,
'' 7(7), 493-498.
53

Harvey, M., C.W. Forsberg, T. J. Beveridge, J. Pos, & J. R. Ogilvie, 1984. Methanogenic Activity and Structural Characteristics of the Microbial Biofilm on a Needle-Punched Polyester Support. Applied & Environmental Microbiology, 48_ (3), 633-648.
Hulshof f Pol, L.W., W.J. de Zeeuw, C.T.M. Velzeboer, & G. Lettinga, 1983. Granulation in UASB Reactors. Water Science S Technology, 15, 291-304.
Kissel, J.C., P.L. McCarty & R.L. Street, 1984. Numerical Simulation of Mixed Culture Biofilm. J. Environ. Engr., 110 (2), 393-411.
Lettinga, G., A.F.M, van Velsen, S.W. Hobma, W. de Zeeuw, & A. Klapwijk, 1980. Use of the Upflow Sludge Blanket (USB) Reactor Concept for Biological Wastewater Treatment, Especially for Anaerobic Treatment. Biotechnology & Bioengineering, 23, 699-734.
van Loosdrecht, M. C. M., J. Lyklema, W. Norde, G. Schraa, & A.J.B. Zehnder, 1987a. The Role of Bacterial Cell Wall Hydrophobicity in Adhesion. Applied & Environmental Microbiology, 53(8), 1893-1897.
van Loosdrecht, M. C. M., J. Lyklema, W. Norde, G. Schraa, & A.J.B. Zehnder, 1987b. Electrophoretic Mobility and Hydrophobicity as a Measure to Predict the Initial Steps of Bacterial Adhesion. Applied S Environmental Microbiology, 53(8), 1898-1901.
Mahoney, E. M., L. K. Varangu, W. L. Cairns, N. Kosaric, S R. G. E. Murray, 1987. The Effect of Calcium on Microbial Aggregation During UASB Reactor Start-Up. Water Science & Technology, 19, 249-260.
Westall, J. C., J. L. Zachary S F.M. Morel, 1976. MINEQL: A Computer Program for the Calculation of Chemical Equilibrium Composition of Aqueous Systems. Technical Note No. 18, Ralph M. Parsons Laboratory for Water Resources and Environmental Engineering, Department of Civil Engineering, Massachusetts Institute of Technology.
54

SPECIFIC IMMUNOLOGICAL PROBES FOR STUDYING THE BACTERIAL ASSOCIATIONS IN GRANULES AND BIOFILMS
G. Prensier(1>, H.C. Dubourguier*(2), I. Thomas'2', G. Albagnac(2), M.N. (2)
Buisson
(1) Institut National de la Santé et de la Recherche Médicale - 369, Rue Jules Guesde - 59650 VILLENEUVE D'ASCQ - France (2 )
Institut National de la Recherche Agronomique - Station de Technologie Alimentaire - BP 39 - 59651 VILLENEUVE D'ASCQ Cedex -France
Corresponding author
Summary
Immunsera against the dominant species present in anaerobic digesters have been obtained in rabbits. Titration and specificities were studied by immunofluorescence. The use of these immunsera to identify in situ the various bacterial morphotypes in granules is described with a particular emphasis to syntrophic microcolonies. Keywords : Methanobrevibacter, Methanothrix, Methanosarcina, Syntrophobacter, Syntrophomonas, immunolabelling, microcolonies. ,,
Introduction
Granular methanogenic sludge present in upflow anaerobic filters and UASB reactors are very complex ecosystems and numerous microcolonies of different bacterial morphotypes are evidenced. There are also many bacteria-and cell ghosts dispersed among these microcolonies. Previous microbiological studies (Dubourguier et al. , 1985) have shown that Methanobrevibacter sp., Methanospirillum sp. and Methanothrix sp. were the main methanogenic bacteria present in granular sludge. Ethanol was oxidized to acetate by Pelobacter carbinolicus (Dubourguier et al., I986) and propionate and butyrate by syntrophic organisms similar to Syntrophobacter sp. and Syntrophomonas sp. respectively.
The presumptive identification in situ of one species, based on its gross appearance, the cell wall structure and the cytoplasmic content has to be confirmed by specific methods among which immunological probes allow precise localization. This paper reports on the use of polyclonal antisera for dissecting the biological structure of granules.
Material and methods
All strains were obtained from the DSM collection. Methanothrix soehngenii FE (DSM 3013) and Methanosarcina mazei MC3 (DSM 2907) were isolated from industrial digesters in our laboratory (Touzel & Albagnac, 1983, Touzel et al., 1987). Immunsera against reference strains of methanogens and against syntrophic associations were prepared in rabbits according to Conway de Macario et al. (1982). In the case of Methanothrix sp., the conventional intravenous hyperimmunization procedure was also used.
/ The "syntrophic" antiserum against Syntrophobacter wolinii was absorbed before use with Desulfovibrio strain Gil whether the antiserum against Syntrophomonas wolfei was absorbed with Methanospirillum
55

hungatei strain JF1. Absorption was first performed 2 hours at 37 C followed by an overnight incubation at 0 C (serum/bacterial centrifugation pellet ratio : 1/1, vol/vol).
The specificity of the antisera against methanogens was checked by immunofluorescence as well as the level of absorption using methanogenic cells and Desulfovibrio Gil cells heat-fixed on glass slides. In addition, specificity was checked directly during immunoelectron microscopy.
For immunoelectron microscopy, granules were fixed in a mixture of formaldehyde (4%)-glutaraldehyde (0.1%) in Phosphate Buffer Saline (PBS : pH 7.4 - 50 mM phosphate - 150 mM NaCl). After washing in PBS, samples were infused in a cryopreservant (25% glycerol - 5% DMSO) and freezed in liquid nitrogen on metallic stubs. Cryosections were done on a Reichert's ultracut and picked up on parlodion-coated nickel grids. Grids were immediately floated on PBS with 0.1% ovalbumin (PBSO Buffer). Immunological linking was done by transferring €he grids to the specific antiserum diluted in PBS. Different dilutions were used. After washing in PBSO, the specific antibodies fixed on their corresponding antigen were revealed by the protein A-gold (5 nm in size) prepared by the method of Slot and Gueuze (I985). After washing in PBS and then in distilled water, the cryosections were embedded in a mixture of methylcellulose (2%) and aqueous uranyl acetate (0.3%) according to Griffiths et al. (1982). The grids were observed with a Hitachi HU-12A electron microscope.
Results
For immunofluorescence, all the antisera were used at the S-dilution as defined by Conway de Macario et al. (I982), i.e. the last dilution giving a 4+ positive response. In the case of Methanospirillum hungatei JF1 and of Methanobrevibacter arboriphilicus AZ, these S-titers were respectively 1:200 and 1:100. No autofluorescence was observed. The specific fluorescence was uniformly, distributed around the cells. The antiserum against M. arboriphilicus AZ cross-reacted weakly only with M. formicicum M4 and two strains of M. thermoautotrophicum TQ5E and FTF isolated in the laboratory. ,This»> antiserum recognized also M. arboriphilicus DH1. The antiserum against M.,spiriM.um JF1 was species-specific. ' ' •*
The antiserum against Methanosarcina mazei MC3- cross-reacted strongly with M. mazei S6 and less with other. Methanosarcina speciefe such as M. barkeri, M. thermophila, M. vacuolata.' The S-titer of this sera was 1: 100. The fluorescence appeared as patches.on the surface of clumps.
By the conventional procedure of Conway de Macario, Methanothrix soehngenii FE was a po£>r immunogen,, the S-titer being 1:40 in one rabbit and 1:20 in the other one. Hyperimmunisation increase slightly the antigenic response to 1:100. This antiserum tested with the homologous strain FE gave a 4+ response with some filaments and only 2+ with the other ones suggesting a surface heterogeneity within the same culture. This antiserum appeared also rather strain specific since only weak cross-reactions were observed with W. soehngenii strain Opfikon and GP6 (Fig. 1). No cross-reactions were observed neither with hydrogenophilic methanogens nor with Methanosarcina strains except a weak reaction with M. mazei S6 and MC3.
After absorption by cells on the hydrogen scavenger, the antisera against Syntrophobacter sp. and Syntrophomonas sp. gave no reaction with any of the methanogenic strains tested nor with Desulfovibrio Gil.
In thin section, the best immunological labelling was obtained
56

fluorescence
50 100 200 400 800
serum dilutions
Fig. 1. Titration of the immunserum against whole-cells of Methanothrix soehngenii FE with : whole-cells of strain FE (+), strain GP6 (*) and strain Opfikon (o).
Fig. 2. Specific labelling of Methanobrevibacter arborophilicus
Fig. 3- Specific labelling of Methanothrix soehngenii
Fig. h. Specific labelling of Methanosarcina sp.
57

Fig. 5. Labelling of Syntrophobacter wolinii
generally with the 1:10 dilution or with the pure antisera. Specificity of the labelling was checked by . examining~*barefully the morphotypes which were recognized taking in account t\ie shape, the structure "of the cell enveloppes and the appearance'"of the cytoplasm. Whichever the antiserum was used, only one morpho'type ( corresponding to the homologous antigenic cells was labelled among all the mqrphotypes present Ai granules. Thus, all the antisera used were considered speqfific .not only on indirect immunofluorescence results' but aïso on the basis 'of gold-immunolabelling electron microscopy. • • ' ?• '
Using the immunserum against M. arboriphilicus AZ, the labelling was specific of small rods with pointed ends, presenting a dark cytoplasm. This ultrastructure corresponded to 'that of the homologous species. The labelling was mostly distributed on the cell wall. A slight background labelling of the intersticial matrix was occasionnally observed when high numbers of M. arboriphilicus were present, suggesting a release of antigen probably due to cell turnover. No reaction was seen with Methanothrix cells nor with the syntropjiic organisms even within syntrophic microcolonies (Fig. 2 ) .
In contrast, the labelling obtained with the whole-cell antiserum against M. soehngenii was specific of filamentous cells of which cellular structure was typical for the immunizing organism. This labelling was randomly distributed all over the cytoplasm. In all cases, a quite high background of labelling was also observed only around the cells revealing an important release of antigen (Fig. 3)•

Methanosarcina clumps easily distinguished by their peculiar structure were labelled only by the antiserum against M. mazei MC3 used as a probe. The gold-particles were seen mainly randomly distributed in the cytoplasm. No labelling occured outside of the cells nor on the heteropolysaccharidic enveloppe (Fig. 4 ) .
The antiserum against Syntrophobacter wolinii labelled only the large rods within the syntrophic microcolonies (Fig. 5)- Cells of Methanobrevibacter sp. were never labelled. These rods in cryosections appeared with a well-defined outer membrane, a rather clear cytoplasm containing electron-translucent inclusions which were previously shown to be glycogen-like (Dubourguier et al., this book).
In the case of the antiserum against Syntrophomonas wolfei, the labelling was only observed on large rods which were present in pure or syntrophic microcolonies (Fig. 6 ) . No clear outer-membrane was present, the cytoplasm was darker than in Syntrophobacter. But cytoplasmic inclusions were mostly similar to those of Syntrophobacter. However in some cases, these inclusions appeared as little holes within the cytoplasm. This is to be related to conventional thin sections where these dark rods present large holes probably due to a loss of poly-hydroxybutyrate during granule preparation. In addition, accumulation of this reserve polymer was shown in Syntrophomonas wolfei (Mc Inerney & Bryant, 1982). Thus, we assume that the antiserum recognized only Syntrophomonas wolfei and not Syntrophobacter wolinii•
Conclusion
In complex agglomerated ecosystems such as granular methanogenic sludge, in situ identification is difficult to achieve. Only a presumptive naming can be done on the basis of structural characters as shape, cell enveloppe structure, cytoplasmic inclusions. This fact limits the interpretation of micrographs of which only Methanosarcina sp. cells and Methanothrix sp. filaments are easily recognized loosing other dominant genera in a general description as rods, cocci, etc (Robinson et al., 1984, Dolfing et al., 1985). Comparison of bacterial structures within the granules with that of pure cultures issued from collection or from direct isolation may improve the quality of presumptive identification (Dubourguier et al.. 1985). However, definitive identification requires specific probes such as polyclonal or monoclonal antibodies of which the specificity can be verified either by immunofluorescence or within the granule itself. The use of immunological probes may also allow the detection of released antigens (this work, Robinson & Erdos, 1985) and probably to study the exact nature of the intercellular matrix.
This paper is the first report on the use of a complementary set of polyclonal antibodies to analyse the structure of granules. This technique can also be used in the case of biofilms. It extends the range of applications of the antibodies for methanogenic biotechnology (Macario & Conway de Macario, 1985). Methanosarcina sp. was identified by immunoelectron microscopy on digester fluid (Robinson & Erdos, 1985). But in this case, cross-reactions within this genus are very well-known (Macario & Conway de Macario, 1983, Thomas et al., 1987) and différenciation of Methanosarcina at the species level will not be possible unless specific antibodies will be available. At the present time, it was shown that these cross-reactions within the genus Methanosarcina are due at least partly, to component C (Thomas et al., *987).
59

In the case of Methanothrix sp. , the strain specificity of the antiserum against FE may limit its use as a general probe for studying biofilms and granules. Such strain specificity was recently noticed with antisera against the strains Opfikon, GP6 and CALS-1 (Macario et al., 1987). Moreover, in immunoelectron microscopy, it recognized all the Methanothrix cells even in digesters unrelated with the origin of the immunizing strain because of its use at low dilution.
Polyclonal antibodies against syntrophs may be obtained easily by immunization of rabbits followed by the absorption on cells of the hydrogen scavenger. But the use of cryosection or of hydrophilic embedding such as Lowicryl do not give exact morphological correspondance with conventional Epon sections. In this case, careful examination of micrographs must be performed to allow identification of the genera of syntrophic bacteria. Development of antisera against Syntrophobacter wolinii have been mentioned and a rather low immune response compared with that of other gram negative rods such as E. coli was pointed out (Conway de Macario & Macario, 1987)- However using this type of antisera in immunogold electron microscopy is not affected by low titers as measured by indirect immunofluorescence.
The set of antisera used in this study has now to be extended to other bacterial genera, particularly Propionibacterium sp. and Pelobacter carbinolicus which have been demonstrated as being dominant components of anaerobic sludge treating wastewaters from agro-industry (Dubourguier et al., 1985, Dubourguier et al., 1986). These antisera may be used also for quantification of methanogenic species as it has been done in the case of Methanosarcina with the Elisa technique (Archer, 1984, Kemp et al., 1986). But the use of polyclonal antibodies is restricted because cross-reactivity with other species may be enhanced by the Elisa sensitivity. Also, antigens released by decaying cells or bacterial ghosts will give false higher responses. In this case, monoclonal antibodies may be useful. In addition, antibodies against specific enzymes involved in a dominant metabolism of the sludge such as component C for ^methanogenesis may give indirect estimation on bacterial activities. Such antibodies have been raised against the component C and its • subunits OT Methanosarcina mazei (Thomas et al. , 1987) and of Methanothrix soehngenii ("unpublished results). ' ' .. a*
t ,4.
References
* u - * ', Archer, D.B., 1984. Detection and quantitation of methanogens by'enzyme-
linked immunosorbent assay. Appl. Environ. 4licrobiol. 48:797-801. Conway de Macario, E., A.J.L. Macario & M.J. Wolin, 1982. Specific
antisera and immunological procedures for characterization of methanogenic bacteria. *,J. Bact. 149:320-328.
Conway de Macario, E. & A.J.L. Macario, 1987. Manipulation of microbial consortia with antibodies. ASM Meeting Abstracts XXVI.
Dolfing, J., A. Griffioen, A.K.W. Van Neerven & L.P.T.M. Zevenhuizen, 1985. Chemical and bacteriological composition of granular methanogenic sludge. Can. J. Microbiol. 31:'744-750.
Dubourguier, H.C., G. Prensier, E. Samain & G. Albagnac, 1985. Granular methanogenic sludge : microbial and structural analysis. In : Palz, W., J. Coombs & D.O. Hall (Ed.) : Energy from Biomass. Elsevier Applied Science Publishers. London. New York. p. 542-546.
Dubourguier, H . C , E. Samain, G. Prensier & G. Albagnac, I986. Characterization of two strains of Pelobacter carbinolicus isolated from anaerobic digesters. Arch. Microbiol. 145:248-253.
60
Griffiths, G., R. Brands, B. Burke, D. Loward & G. Warren, 1982. Viral membrane proteins acquire galactose in trans Golgi cisternae during intracellular transport. J. Cell. Biol. 95:78-85.
Kemp, H.A., M.R.A. Morgan & D.B. Archer, 1986. Enzyme-linked immunosorbent assay for methanogens using polyclonal and monoclonal antibodies. In : Anaerobic Treatment. A grown-up technology. Aquatech' 86. 15-19 September 1986. Amsterdam p. 39-49.
Macario, A.J.L. & E. Conway de Macario, 1983- Antigenic fingerprinting of methanogenic bacteria with polyclonal antibody probes. Syst. Appl. Microbiol. 4:451-458.
Macario, A.J.L. & E. Conway de Macario, 1985. Antibodies for methanogenic biotechnology. Trends in Biotechnology 3:204-208.
Macario, A.J.L., C.B. Dugan & E. Conway de Macario, 1987- Antigenic diversity of Methanothrix. ASM Meeting Abstracts I 71 p. 184.
Mc Inerney, M.J., M.P. Bryant, H.B. Hespell & J.W. Costerton, I98I. Syntrophomonas wolfei gen. nov. sp. nov., an anaerobic syntrophic fatty-acid oxidizing bacterium. Appl. Environ. Microbiol. 41:1029-IO39.
Robinson, R.W. & G.W. Erdos, 19Ö5- Immuno-electron microscopic identification of Methanosarcina sp. in anaerobic digester fluid. Can. J. Microbiol. 31:839-844.
Robinson, R.W., D.E. Akin, R.A. Nordstedt, M.V. Thomas & H.C. Aldrich, I984. Light and electron microscopic examinations of methane-producing biofilms from anaerobic fixed-bed reactors. Appl. Environ. Microbiol. 48:127-136.
Slot, J.W. & J.J. Geuze, 1985- A new method of preparing gold probes for multiple-labelling cytochemistry. Eur. J. Cell Biol. 38:87-93•
Thomas, I., H.C. Dubourguier, G. Prensier, P. Debeire & G. Albagnac, I987. Purification of component C from Methanosarcina mazei and immunolocalization in Methanosarcinaceae. Arch. Microbiol. 148:193" 201.
61

PYRUVATE AND FUMARATE CONVERSION BY A METHANOGENIC PROPIONATE-OXIDIZING COCULTURE
F.P. Houwen, Cheng Guangsheng, G.E. Folkers, W.M.J.G. v.d. Heuvel and C. Dijkema .
Department of Microbiology and Department of Molecular Physics, Agricultural University, Hesselink van Suchtelenweg 4 6703 CT, Wageningen, The Netherlands.
Suirroary
A stable, methanogenic propionate-degrading coculture was tested for the ability to convert pyruvate and fumarate. Both substrates were degraded rapidly and without a lag phase. Acetate and propionate were formed from pyruvate, whereas fumarate was predominantly converted to malate and succinate. High-resolution 13C-NMR with [3- C]-pyruvate showed the involvement of a randomizing pathway in the formation of propionate. A pyruvate-fermenting organism isolated from the coculture, did not degrade propionate in the presence of hydrogen-consuming methanogens. Keywords: coculture, pyruvate and fumarate conversion, methyl-malonyl
CoA pathway, high-resolution 13C-NMR, propionic acid fermentation.
Introduction
During complete degradation of complex organic material under methanogenic conditions, about 15% of the total carbon is degraded via propionate as an intermediate (Kaspar & Wuhrmann, 1978a; Gujer & Zehnder, 1983). Propionate is oxidized to acetate, carbon dioxide and hydrogen, according to the following,equation:
CH3CH2C00~ + 3H2° "- CH3C00" + HCC^- + H+ + 3«2
AG°'= + 76.1 kJ/mpleCBfcauer et al., 1977)
Due to the extreme positive AG° , the degradation- of propionate is only possible when hydrogen is removed by methanogenip bacteria (zehnder & Koch, 1983). Syntrophic cocultures of propionate^oxidizing bacteria and hydrogen-consuming anaerobes have been, described (Boone & Bryant, 1980; Koch et al. 1983). Although some information is available about the kinetics of the breakdown, (Kaspar & Wuhrmann, 1978a, 1978b; Zehnder S Koch, 1983; Heyes & Hall, 1983; Schink," 1985), little is known about.the biochemical pathway of propionate oxidation. Studies with 1 JC- and R e labelled propionate provided evidence for the operation of the methyl-malonyl CoA pathway (Buswell et al., 1951; Koch et al., 1983; Schink, 1985; Houwen et al., 1987), a route which is also present in some propionate-forming and propionate-degrading anaerobes (see Kaziro & Ochoa, 1964; Allen et al. 1964; Galivan & Allen, 1968; Allen & Linehan, 1977; Macy et al. 1978; Schink et al., 1984; Stams et al., 1984;. In such a pathway fumarate and pyruvate are intermediates. The AG° -values of the conversion of these intermediates to acetate, carbon dioxide and hydrogen are negative, and would allow growth of the propionate-
62

oxidizing organism in pure culture. Since it was shown that the obligate syntrophic butyrate oxidizer Syntrophomonas wolfei was able to grow on crotonate, from which the CoA-ester is an intermediate in the degradation pathway of butyrate (Beaty & Mclnerney, 1987), we decided to investigate the ability of a stable propionate-oxidizing coculture to convert pyruvate and fumarate. Preliminary results of this study are presented here.
Materials and methods
Organisms and cultivation
The propionate-degrading coculture used in this study was originally enriched by Koch et al. (1983). It contained the propionate-oxidizing bacterium (approx. 10%), two types of methanogenic bacteria (approx. 90%) and < 1% of an unknown bacterium. This coculture degraded propionate to acetate, carbon dioxide and methane; acetate was not metabolized further. Methanobrevibacter arboriphilus (DSM 744) was obtained from the culture collection from our department. Methanospirillum hunqatei (DSM 864) was purchased from the German Collection of Mcroorganisms (Gottingen, FRG). Except for the growth substrate and two trace elements (SeOo and Na2WC>4-HoO were not added), the medium had the same composition as described before (Houwen et al., 1987). For growth of M^ hunqatei, 2 gram bioTrypticase (bioMerieux) was added per liter medium. Pyruvate and fumarate were filter-sterilized as 2.5 M and 1 M solutions, /
respectively. Agar plates were prepared anaerobically in a glove box containing a gas phase of N2/H2 (96:4). To the medium were added: agar (2%), sodium pyruvate (50 mM) and in some experiments 2-bromo ethane sulfonic acid (BrES) (50 mM). To allow stabilization of the pH (7.0-7.2), the plates were stored for at least 12 hours in jars with a gas phase of 1.8 atm N2/C02 (80:20) or 1.8 atm H2/C02 (80:20).
Incubation with pyruvate and fumarate
Propionate grown cells (720 ml) were transferred anaerobically and aseptically to 160 ml vials (Aluglas verenigde Bedrijven B.V.), closed with butyl rubber stoppers (Belco). The vials were placed in a GSA-rotor (Sorvall) which was filled with 100 ml water. After centrifugation at 3000 rpm for two hours, the supernatant was removed aseptically and the cells were washed twice in a medium without carbon source. The final pellet was suspended in 20 ml of this medium and then 3 ml of the suspension was brought into 100 ml vials containing 30 ml medium with pyruvate or fumarate (40 - 50 mM) as substrates. The final cell density-was 8 x 10⁸ cells/ml. Either 1.8 atm N2/C02 (80:20) or H2/GOo (80/20) was placed above the cultures. The vials were incubated at 35°C. Samples were withdrawn weekly and analyzed as described below.
1 ? JC-NMR experiment
1.8 1 of the propionate grown coculture was centrif uged and washed anaerobically with growth medium containing 5mM sodium pyruvate. Since FeS in the suspension causes significant peak broadening in the NMR-spectra, removal of this substance was necessary. The 100 times concentrated cell suspension was therefore transferred to a tube in the anaerobic glove box. After 15 hours almost all the visible FeS-
63

precipitate had sedimented. Then, 3.2 ml of the supernatant was transferred to an NMR tube and 0.4 ml H9O was added to provide a lock signal. This suspension contained approximately 10 cells/ml. The NMR tube was closed with an overseal stopper, and the gas phase was changed to 1.2 atm H9/CO2 (80:20). At time zero 0.4 ml sodium [3- C]-pyruvate (99% enriched, MSD-Isotopes, FRG) was added with a syringe to give a concentration of 33 mM. High resolution 1JC-NMR was carried out as described before (Houwen et al., 1987).
Analytical methods
Propionate and acetate were measured gaschromatographically, using a Varian Aerograph 2400 with a chromosorb 101 column (200 cm x 2 mm) and a flame ionisation detector (FID). Samples were acidified by the addition of Amberlite IR 120(H+). 1 ul sample was injected together with 1 gl air. The carrier gas was nitrogen saturated with formic acid. The column temperature was 180°C and the detector temperature 210°C. Hydrogen and methane were determined qualitatively with a Becker Packard 417 gaschromatcgraph which was operated with argon as the carrier gas. 0.2 ml from the gas phase were injected into the molecular sieve column 13X (1 m x 0.25 inch). The temperature of both the column and the detector (FID) were 100°C. Fumarate, malate and succinate were analyzed as methyl-esters with a Kipp GC system 8200 equiped with a pack sil 19B (10 cm x 0.53 mm) column. 2 ml methanol was added to 1 ml sample and heated to 60°C for 30 minutes. After cooling, 1 ml water and 0.5 ml chloroform were added and the mixture was vigorously shaken. 1.0 ul air and 0.5 ul from the chloroform-layer were injected. Nitrogen was used as the carrier gas. The temperature of the column was 100 C for 3 minutes and increased to 280°C in 3 minutes. The injection temperature was 250°C and the FID had a temperature of 325°C. The inlet pressure was 10 kPa. Pyruvate was measured spectrophotometrically as described by Katsuki et al. (1971).
Results *" , ' - > * . .' »
Incubation with pyruvate and fumarate - ••- "*"•
' i Cell suspensions of a stable propionate-degrading mêthanogenic coculture were tested for the ability to convert pyruvate and fumarate. These experiments were performed in the presence ofv BrES to prevent methanogenesis. With /COo in the gas. phase (Fig. 1A) pyruvate is converted within one week'TO acetate, propionate and a little hydrogen. In a separate experiment in which samples were withdrawn every two days, it was observed that pyruvate degradation started without a significant adaptation time. The degradation rate of pyruvate was in the same range as that of propionate; 35 mM of the latter compound was degraded in one week (results not shown). A slower conversion was observed in the presence of hydrogen (Fig. IB). About equal amounts of acetate and propionate were formed. As the expected stochiometry of pyruvate conversion to these products (in the absence of hydrogen) is 2 to 1, respectively, hydrogen must have been taken up by the cells. Fumarate was degraded at the same rate in the presence or absence of hydrogen (Fig. 2). Malate was the predominant product in the absence of hydrogen. Only small amounts of acetate and succinate were formed. In the presence of hydrogen, besides malate also succinate was a major
64

product. Also in this case it is obvious that the cells must have taken up molecular hydrogen.
i,—A pyruvate o—o acetate •—p propionate
3 0 1
Time (weeks)
Fig. 1. Conversion of pyruvate by the coculture with N2/CO2 (A) or H2/CO2 (B) in the headspace.
• — • furnarate • — • malate A — * succinate o—o acetate
3 0 1
Time (weeks)
Fig. 2. Conversion of furnarate by the coculture with N2/C02 (A) or H2/CO2 (B) i n t h e headspace.
65

1 ? C-NMR experxment
The time dependent incorporation of the 3C-label into intermediates and end products after the addition of 33 mM [3- C]-pyruvate to the propionate-degrading coculture is shown in Figure 3. The amplitude of the resonances belonging to the "'C-labelled carbon at the C-3 position of pyruvate, resonating at 27.5 and 26.3 ppm (the second resonance is from hydrated pyruvate), decreased close to zero during the time course of the experiment.
•^C-label occurred at several positions in various compounds. These included the C-2 position of acetate (24.3 ppm), the C-3 and C-2 positions of propionate (11.2 and 31.7 ppm), the C-3/C-2 position of succinate (35.1 ppm), the C-3 position of alanine (17.3 ppm), the C-2 position of ethanol (17.8 ppm), the C-2 position of pyruvate (206.0 ppm) and the C-l position of acetate (182.2 ppm). After 25 hours the coculture was further incubated outside the NMR-apparatus to allow the methane bacteria to convert all hydrogen and thus allowing propionate to be degraded. After two weeks methane and a little hydrogen (and carbon dioxide) were present in the headspace. Pyruvate and the "intermediate" propionate had disappeared.
Isolation of a pyruvate-fermenting organism
Because of these results, attempts were made to isolate the pyruvate-fermenting organism. 0.1 ml of dilutions of the propionate-degrading coculture were brought on agar plates containing BrES. Colonies appeared after 2 - 3 weeks of incubation. After three transfers on agar plates BrES was omitted because no methane was produced by the bacteria after transfer to liquid media with pyruvate and hydrogen. Upon microscopical analysis, colonies were judged to consist of only one bacterial species. Colonies were tested for their ability to convert propionate in coculture with Methanospirillum hunqatei and/or Methanobrevibacter arboriphilus. So far, no propionate degradation has been observed. In preliminary experiments performed to identify this isolate, growth was observed on hydrogen in the presence of sulfate and acetate. This - indicates that the organism is a sulphate reducer.
Discussion > >
The ability of a stable propionate-degrading coculture to convert pyruvate and fumarate instantly was quite a surprise. The coculture was isolated from agar-shake tubes and had been maintained for more than five years in media with propionate as sole energy and carbon source. The finding indicated to us, that the propionate-degrader itself might be able to convert the two substrates. The more so as with -"C-NMR it was shown that a randomizing pathway is involyed in both propionate degradation and propionate formation (Houwen et al., 1987; this paper). Our hypothesis was further strengthened by the observation that also two thermophylic propionate-degrading cocultures degraded pyruvate and fumarate (results not shown). Unfortunately, Syntrophobacter wolinii, described by Boone and Bryant (1980), could not be tested. This organism is maintained together with a Desulfovibrio species, an organism able to degrade pyruvate and possibly also fumarate in the absence of sulfate.
66

67

w
Assuming that the propionate-degrader indeed converts pyruvate and fumarate, the product formation can easily be interpreted with the hypothetical pathway depicted in Figure 4. The conversion of pyruvate to acetate is thermodynamically favourable; reducing equivalents formed in this reaction are disposed either in the formation of hydrogen or transferred to oxaloacetate and fumarate leading to the formation of propionate. In the presence of hydrogen these reducing equivalents are channelled only in the direction of propionate. A similar process is carried out by Desulfobulbus propionicus. This organism degrades propionate in the presence of sulfate and performs a propionic acid fermentation with e.g. pyruvate in the absence of sulfate (Widdel & Pfennig, 1982; Laanbroek et al., 1982). Furthermore, it is also able to form propionate from acetate, carbon dioxide and molecular hydrogen (Laanbroek et al., 1982).
acetate " -r
T propionate
.•20.9
( 1 CoA acetyl-CoA
^ ^2[H] CO,
-47.9
propionyl-CoA
•CO,
pyruvate
27.2
_L
CoA methylmalonyl-CoA
sucany!
oxaloacetate
2[H]
CoA 1 malate
_L succinate 2[H]
47.7
•3.8
-86.2 fumarate
Fig. 4. The methyl-malonyl^CoA pathway for propionate formation and degradation. The presence of a transcarboxylase and a CoA-transferase are hypothetical. A G P -values (in the direction of propionate to acetate) are calculated from Thauer et al. (1977).
The formation of malate from fumarate, in the absence of hydrogen, can be explained by the small difference inAÖ3 between the two compounds. In the presence of hydrogen, succinate is formed. This conversion is highly exergonic and allows ATP formation (Kroger et al., 1986). Though further conversion to propionate would deliver even more energy, this product was not found. This indicates the involvement of a transcarboxylase in linking the decarboxylation of methyl-malonyl CoA to the carboxylation of pyruvate (Fig. 4). Similar transcarboxylases that do
68

not allow conversion of C-4 substrates have been described earlier (Swick & Wood, 1960; Wood, 1972; Allen & Linehan, 1977; Schink et al., 1984; Stams et al., 1984). However, because some acetate was produced, the presence of a pyruvate decarboxylating enzyme must be assumed. In the C-NMR experiment label occurred in the C-2 position of pyruvate and the C-l position of acetate. This implicates de novo synthesis of pyruvate from pyruvate, leading to randomization of the JC-label between the C-3 and C-2 atoms. A similar randomization was observed during the degradation of propionate (Houwen et al., 1987). The high amplitude of the resonance of ethanol in the first hour of the experiment did not originate from 1^C-pyruvate. It appeared to be a contamination of non-enriched ethanol as was clear from scanning for 15 minutes befor adding the JC-pyruvate. The organism isolated on pyruvate has not yet been studied in detail. Until now we have no evidence that it is indeed the propionate-degrading organism: 1) it is unable to convert propionate in coculture with methanogens 2) it does not resemble the predominant bacteria present in the propionate-degrading coculture and 3) it grows on hydrogen in the presence of sulfate. Research is in progress to identify the nature of the organism.
Acknowledgements
The valuable suggestions and comments of Prof. Dr. A.J.B. Zehnder and Dr. Ir. A.J.M. Stams are highly acknowledged. The authors thank Prof. Dr. T.J. Schaafsma for his interest in this work. This study was supported by the Foundation of Fundamental Biological Research (BION), which is subsidized by the Netherlands Organization for the Advancement of Pure Science (ZWO).
References
Allen, S.H.G., R.W. Kellermeyer, R.L. Stjernholm & H.G. Wood, 1964. Purification and properties of enzymes involved in the propionic acid fermentation. J. Bacteriol. 87:171-187.
Allen, S.H.G. & B.A. Linehan, 1977. Presence of transcarboxylase in Arachnia propionica. Int. J. Syst. Bacteriol. 27:291-292.
Beaty, P.S. & M.J. Mclnemey, 1987. Growth of Syntrophomonas wolfei in pure culture on crotonate. Arch. Microbiol. 147:389-393.
Boone, D.R. & M.P. Bryant, 1980. Propionate-degrading bacterium, Syntrophobacter wolinii sp. nov. gen. nov., from methanogenic ecosystems. Appl. Env. Microb. 40:626-632.
Buswell, A.M., L. Fina, H. Mueller & A. Yahiro, 1951. Use of 1 4 C in mechanism studies of methane fermentation. II. Propionic acid. J. Am. Chem. Soc. 73:1809-1811.
Galivan, J.H. & S.H.G. Allen, 1968. Methylmalonyl coenzyme A decarboxylase. Its role in the succinate decarboxylation by Micrococcus lactilyticus. J. Biol. Chem. 243:1253-1261.
Gujer, W. & A.J.B. Zehnder, 1983. Conversion processes in anaerobic digestion. Wat. Sei. Tech. 15:127-167.
Heyes, R.H. & R.J. Hall, 1983. Kinetics of two subgroups of propionate-using organisms in anaerobic digestion. Appl. Env. Microb. 46:710-715.
Houwen, F.P., C. Dijkema, C.H.H. Schoenmakers, A.J.M. Stams & A.J.B. ' Zehnder, 1987. ljC-NMR study of propionate degradation by a methano
genic coculture. FEMS Microbiology Letters 41:269-274.
69
Kaspar, H.F. & K. Wuhrmann, 1978a. Kinetic parameters and relative turnovers of some important catabolic reactions in digesting sludge. Appl. Env. Microb. 36:1-7.
Kaspar, H.F. & K. Wuhrmann, 1978b. Product inhibition in sludge digestion. Microbial Ecology 4:241-248.
Katsuki, H., T. Yoshida, C. Tanegashima & S. Tanaka, 1971. Improved direct method for determination of keto acids by 2,4-dinitrophenyl-hydrazine. Anal. Biochem. 43:349-356.
Kaziro, Y. & S. Ochoa, 1964. The metabolism of propionic acid. Adv. Enzymol. 26:283-378.
Koch, M., J. Dolfing, K. Wuhrmann & A.J.B. Zehnder, 1983. Pathways of propionate degradation by enriched methanogenic cultures. Appl. Env. Microb. 45:1411-1414.
Kroger, A., I. Schroder & J. paulsen, 1986. Direct and reversed electron transport in anaerobic bacteria. In: H.C. Dubourguier et al. (ED.): Biology of anaerobic bacteria. Elsevier Science Publishers B.V., Amsterdam, p. 93-104.
Laanbroek, H.J., T. Abee & I.L. Voogd, 1982. Alcohol conversions by Desulfobulbus propionicus Lindhorst in the presence and absence of sulfate and hydrogen. Arch. Microbiol 133:178-184.
Macy, J.M., L.G. Ljungdahl S G. Gottschalk, 1978. Pathway of succinate and propionate formation in Bacteroides fraqilis. J. Bacteriol. 134:84-91.
Schink, B., 1985. Mechanisms and kinetics of succinate and propionate degradation in anoxic freshwater sediments and sewage sludge. J. Gen. Microbiol. 131:643-650.
Schink, B., D.R. Kremer & T.A. Hansen, 1987. Pathway of propionate formation from ethanol in Pelobacter propionicus. Arch. Microbiol. 147:321-327.
Stams, A.J.M., D.R. Kremer, K. Nicolay, G.H. Weenk & T.A. Hansen, 1984. Pathway of propionate formation in Desulfobnl bus propionicus. Arch. Microbiol. 139:167-173.
Swick, R.W. & H.G. Wood, 1960. The role of transcarboxylation in propionic acid fermentation. Proc. Natl. Acad^Sci. USA 46:28-41.
Thauer, R.K., K. Jungermann & K. Decker, 1977. Energy conservation in chemotrophic anaerobic bacteria, Bacteriol Rev. 41:100-180.
Widdel, F. & N. Pfennig, 1982. Studies on dissimila«Kry..sulfate-reducing bacteria that decompose fatty apids. II.' Incomplete oxidation of i propionate by Desulfobulbus propionicus gen, nov., sp. nov. Arch. Microbiol. 131:360-365. . > J, ' f '.
Wood, H.G., 1972. Transcarboxylase. In: P.D. Bpyer (Ed.): The enzymes, vol. 6. Academic Press Inc, New York, p^ 83-115.
Zehnder, A.J.B. & M. Koch, 1983. Thermodynamic and kinetic interactions of the final steps in anaerobic digestion. Proc. Europ. Symp. Anaerobic waste water treatment. TNO Corporate Communication Department, The Hague, p. 86-96.
70

ANAEROBIC DEGRADATION OF PAPERMILL SLUDGE IN A RUDAD-DIGESTER
C.G.M. Caerteling, H.J. Gijzen , H.J.M. Op den Camp, H.J. Lubberding and G.D. Vogels
Department of Microbiology, Faculty of Science, University of Nijmegen, The Netherlands *Department of Botany, University of Dar es Salaam, Tanzania
Summary
The use of reticulated polyurethane foam as a support material for the immobilization of methanogenic associations was investigated. The colonization in a continuous upflow reactor fed on a mixture of acetate, propionate and butyrate was both rapid and dense. The combination of rumen microorganisms and colonized polyurethane in one reactor resulted in an efficient anaerobic degradation of papermill sludge. Keywords: rumen microorganisms, immobilization, polyurethane, papermill sludge.
Introduction
/ The high cellulolytic activity and relatively short generation time make
rumen microorganisms very suitable for the anaerobic acidogenesis of lignocellulosic residues. Recently the successful application of a rumen-derived anaerobic digestion (RUDAD) process for treatment of a cellulose-rich fraction of domestic refuse was described (Gijzen et al, 1988; Zwart et al, 1988). The acids formed in this process were converted to biogas in an UASB-type reactor. A schematic diagram of this process is shown in Fig. 1. The UASB-type reactor is an example of high-rate anaerobic diges-tors which are based on the retention of slowly growing microbial populations and which have been developed in the past 15 years (Van den Berg, 1984). Recently, reticulated polyurethane foam has been reported as an excellent support material to immobilize methanogenic consortia (Fynn & Whitmore, 1982; Huysman et al, 1983). However, applications of such support materials have been restricted mainly to the treatment of waste waters (Van den Berg, 1984).
This study describes the combination of the RUDAD process (acidogenic phase) and colonized polyurethane foam (methanogenic phase) in one reactor treating papermill sludge, a fine particulate organic waste.
Materials and methods
Colonization of polyurethane
Reticulated polyurethane foam (density 18 kg/m ; 20 pores per linear cm) was used for the immobilization of microorganisms involved in the degradation of volatile'fatty acids (VFA). A 10 1 volume cylindrical upflow reactor (15.5 cm internal diameter) was inoculated with 300, ml crushed UASB-sludge and subsequently packed with polyurethane cubes (2.2 cm edge size). The reactor was filled with half-strength buffer solution according to Rufener et al (1963), supplemented with trace elements (0.1 ml.1-1) according to Vishniac & Santer (1957), NHi,Cl (14 mM) , yeast extract (0.2 g.1- 1), sucrose (0.2 g.1 ) , sodium acetate (38 mM), propionic acid (12.8 mM) and
71
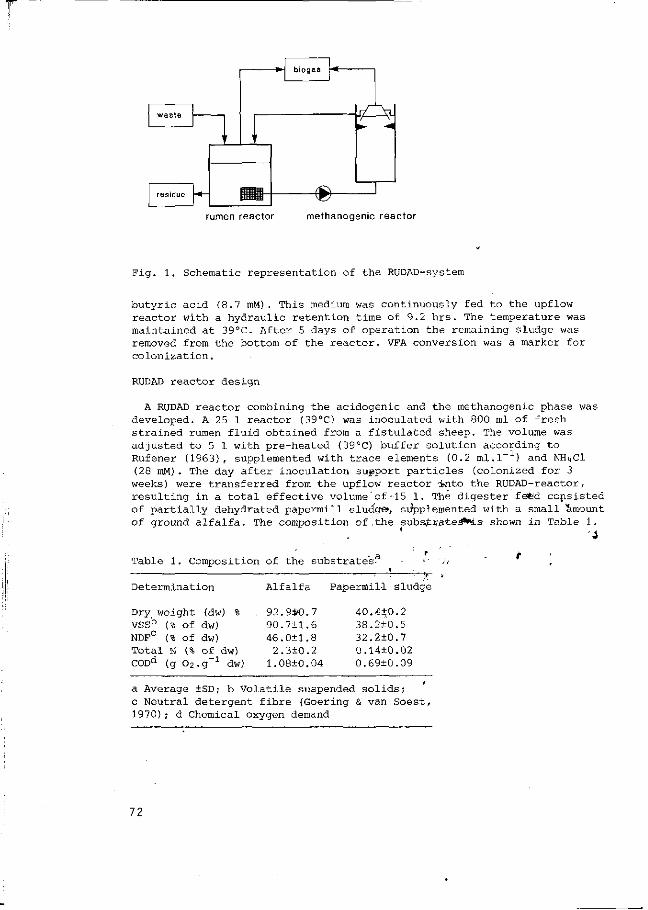
\£M
& rumen reactor methanogenic reactor
Fig. 1. Schematic representation of the RUDAD-system
butyric acid (8.7 mM) . This medium was continuously fed to the upflow reactor with a hydraulic retention time of 9.2 hrs. The temperature was maintained at 39°C. After 5 days of operation the remaining sludge was removed from the bottom of the reactor. VFA conversion was a marker for colonization.
RUDAD reactor design
A RUDAD reactor combining the acidogenic and the methanogenic phase was developed. A 25 1 reactor (39°C) was inoculated with 800 ml of fresh strained rumen fluid obtained from a fistulated sheep. The volume was adjusted to 5 1 with pre-heated (39°C) buffer solution according to Rufener (1963), supplemented with trace elements (0.2 ml. 1" ) and NHi,Cl (28 mM). The day after inoculation support particles (colonized for 3
weeks) were transferred from the upflow reactor into the RUDAD-reactor, resulting in a total effective volume'of-15 1. The digester fefe'd consisted of partially dehydrated papermill sludge», supplemented with a small "amount of ground alfalfa. The composition of ,the subsjtrateäffc'is shown in Table 1.
Table 1. Composition of the substrates?
Determination Alfalfa Papermill sludge
Dry weight (dw) % VSSb (% of dw) NDFC (% of dw) Total N (% of dw) CODd (g 02.g_1 dw)
92.9*0.7 90.711.6 46.0+1.8
2.3+0.2 1.08+0.04
40.410.2 38.2+0.5 32.210.7 0.1410.02 0.6910.09
a Average ±SD; b Volatile suspended solids; c Neutral detergent fibre (Goering & van Soest, 1970) ; cl Chemical oxygen demand
72

Fig. 2. Schematic representation of the two-phase RUDAD reactor. A, acidogenic phase; B, methanogenic phase; C. stirrer; D, bidirectional sludge pump; E, homogeneous effluent removal; F, feeding and addition of fresh fermentation medium; G, gas outlet
The lower part of the reactor (acidogenic phase) was stirred and pumped on the upper layer of support particles (methanogenic phase) at a rate of 25 l.d~ . Every day 2.5 1 of homogeneous acidogenic phase content was replaced by an equal volume of buffer containing suspended substrate. A schematic diagram of the reactor is presented in Fig. 2.
Sampling and analyses
Samples for determination of pH, VFA and neutral detergent fibre (NDF) were taken from the daily reactor effluent. Biogas production was continuously monitored and the methane content of the biogas was determined twice a week. Analytical methods were as previously described (Gijzen et al, 1986, 1988).
Results and discussion
Colonization of polyurethane foam
Colonization of the polyurethane foam as assessed by VFA conversion proceeded at a high rate (Fig. 3). Within 13 days after inoculation stable conversion efficiencies of 80-90% and 95-100% were obtained for acetate and butyrate, respectively. Propionate degradation of about 80% was reached after 20 days of operation. The rate of colonization was somewhat lower as compared to previous reports on studies with polyurethane (Fynn & Whitmore, 1982; Huysman et al, 1982). This may be due to differences in substrates and inoculum applied. After 3 weeks of colonization biomass amounted to 20 mg volatile suspended solids (VSS) per cm of support material. Scanning electron microscopic examination of the colonized support cubes revealed the presence of aggregates of bacteria (Fig. 4 ) . The bacteria appeared to be physically associated with the support material. This is in contrast to previous scanning electron micrographs on the colonization of polyurethane (Fynn & Whitmore, 1982, 1984), which did not reveal indications of physical attachment by polysaccharide fibres or surface appendages. The methanogens in the biofilm consisted mainly of
73

100 -
60
10
20
dégrada
-
/«
•4 •y •
t ionlV.)
/ / / /
( / A
7 A/
„••—
à
/ /
/ V '
\/v
12 16 20 IL Time (days)
Fig. 3. Degradation efficiency of acetate (•), propionate (A) and butyrate (o) during the colonization of polyurethane support particles
~ » *• ^SJSJT 8 * *"* ' '
Fig. 4. Scanning electron micrographs of colonized polyurethane foam
long filamentary Methanothrix-type bacteria and smaller numbers of Metha-nosaroina species.
RUDAD-reactor performance
The performance of the digester is summarized in Fig. 5. Substrate loading rates were 75 g VSS.d-1 during period 1 and 102 g VSS.d-1 during period 2, including 21 g VSS of alfalfa at both loading rates. The NDF-degradation efficiency varied between 50-70%. Only shortly after the increase of the loading rate the efficiency dropped temporarily to about 45%. In spite of the high content of inorganic material in the papermill sludge used, loading rates and conversion efficiencies were higher than
74

50
•o è 30
< g m
10
S
< LL
>
PERIOD 1 ] PERIOD 2
;M V - V A /
J\ V""
50
30
V y 0 < v '°0, ,oV
\
J I I I 1 1 1 - I L
pH
7.5
7.0
6.5
10 h
].:»•»£;•-•-»•*,
~ 100
z o p < Q
< CE C5 LU
60
20
^ N .
ta 10 30 70 90
TIME (DAYS)
Fig. 5. Performance of the two-phase digester fed on papermill sludge Period 1: loading rate 75 g VSS.d-^ Period 2: loading rate 102 g VSS.d 1
Biogas production (•), pH (o); Concentration of acetate (•), propionate (•), butyrate (T); Degradation efficiency: NDF (•), VSS (•)
those reported by Takeshita et al (1981) . The observed fluctuations in VFA levels reflect disturbances in the balance between their production in the acidogenic phase and the subsequent degradation in the methanogenic phase. Especially propionate accumulates temporarily during period 2. Specific accumulation of propionate may be explained by the fact that its anaerobic conversion is thermodynamically less favourable than that of acetate or
75

butyrate (Conrad et al, 1986), because of slow specific growth rates of propionate oxidizing populations (Zehnder & Koch, 1983) adaptation takes a long time.
At day 90 a steady-state is reached as is demonstrated by the complete conversion of VFAs in the reactor. The pH values correlated with fluctuations in the concentrations of VFA and varied between 6.0 and 7.1. Rumen ciliates were present in high numbers (about 10 -10 cells.ml ) during the entire experimental period. Exact microscopical enumeration was hindered by substrate particles.
Conclusions
The results described in this study demonstrate that polyurethane is an excellent support material for slowly growing methanogenic-phase bacteria converting VFAs to CHi».
The combination of rumen microorganisms and colonized polyurethane result in a high-rate anaerobic digestion of papermill sludge. The high loading rate (up to 20 g VSS.d-1.l~ acidogenic phase), short solid retention time (48 hours), degradation efficiency between 50-70% and simple reactor construction make this system attractive for application of other particulate solid wastes.
Acknowledgement
This work was supported by the Technology Foundation (STW), The Netherlands .
References
Conrad, R., B. Schink & T.J. Phelps, 1986. Thermodynamics of H2-consuming and H2-producing metabolic reactions in diverse methanogenic environments under in situ conditions. FEMS Microbiology Ecology 38:353-360.
Fynn, G.H. & T.N. Whitmore, 1982. Colonization of polyurethane reticulated foam biomass support particles by methanogen sçecies. Biotechnology Letters 4:577-582. • • r
Goering, H.K. & P.J. van Soest, 1970.-'Fç-rage fibre analysis. USDA, "ARS Agricultural Handbook No. 379. ^
Gijzen, H.J., K.B. Zwart, P.T. van Gelder'S G.D. Vogels, 1986. Continuous cultivation of rumen microorganisms, a system with possible application to the anaerobic degradation of lignocellulçîsiç waste materials'. Applied Microbiology and Biotechnology 25:155-.162. t
Gijzen, H.J., K.B. Zwart, M.J. Teunissen & G.D. Vogels, 1988. Anaerobic digestion of a cellulose fraction of domestic refuse by means of rumen microorganisms. Biotechnology and Bipengineering. In press.
Huysman, P., P. van Meenen, P. van Assche & W. Verstraete, 1983. Factors affecting the colonization of non-porous and porous packing materials in model upflow methane reactors. Biotechnology Letters 5:643-648.
Rufener, W.H., Jr, W.O. Nelson & M.J. Wolin, 1963. Maintenance of the rumen microbial population in continuous culture. Applied Microbiology 11:196-201.
Takeshita, N., E. Fujimura & N. Mimoto, 1981. Energy recovery by methane fermentation of pulp mill waste and sludges. Pulp and Paper Canada 82: 171-175.
Van den Berg, L., 1984. Developments in methanogenesis from industrial waste water. Canadian Journal of Microbiology 30:975-990.
Vishniac, W. & M. Santer, 1957. The thiobacilli. Bacteriological Reviews 21: 195-213.
76

Zehnder, A.J.B. & M.E. Koch, 1983. Thermodynamic and kinetic interactions of the final steps in anaerobic digestion. In: Proc. Eur. Symp. Anaerobic Waste Water Treatment, Noordwijkerhout, The Netherlands, p. 86-96.
Zwart, K.B., H.J. Gijzen, P. Cox & G.D. Vogels, 1988. Anaerobic digestion of a cellulosic fraction of domestic refuse by a two-phase rumen-derived process. Biotechnology and Bioengineering. Submitted.
77

STRUCTURAL CHARACTERISTICS AND METABOLIC ACTIVITIES OF GRANULAR METHANOGENIC SLUDGE ON A MIXED DEFINED SUBSTRATE
H.C. Dubourguier , M.N. Buisson, J.P. Tissier, G. Prensier, G. Albagnac
Institut National de la Recherche Agronomique - BP 39 _ 59651 VILLENEUVE D'ASCQ Cedex - France
Corresponding author
Summary
Little attention has been paid to relationship between structure and activities in granular sludge. Image analysis performed directly on granules with a video camera linked to a computer led to a mean size of O.56 to I.I5 mm.However, the diameter 0 50 ranged from 1.68 to 2.52 mm. Gross mineral analysis pointed out the importance of mineral precipitate, mainly of sulfides. This was confirmed by surface X-ray analysis and by elemental mapping. Identification of bacterial morphotypes was not only done by comparison with the ultrastructure of pure cultures but also with specific immunological probes against methanogens and syntrophic bacteria. The experimental potential methanogenic activities are discussed taking in account free energy changes and ultrastructure of granules with a particular emphasis to interspecific transfer of hydrogen. Keywords : hydrogen transfer, granule, Syntrophobacter, Syntrophomonas, Methanobrevibacter, Methanospirillum, propionate, butyrate.
Introduction
In upflow anaerobic sludge bed^ reactors and in upflow anaerobic filters, methanogenic congglomerates are formed^. The resulting granules were previously shown to be a complex bacterial association^. But up to now, relationships between structure^ and* activities are still unknown due to a lack of knowledge about spatial .distribution, in situ bacterial identification and functioning.« * ,A
This paper reports on the establishment of .a laboratory scale UASB reactor treating a mixed defined substrate. Main characteristics of the granular sludge are presented with a particular emphasis to minerals and microbiological features. . , •'
Material and methods — S ' ,,
The UASB reactor was seeded with 300 ml of granular sludge sampled from a 5 m -pilot treating wastewater from starch industry. Feeding solutions were separated and concentrated to avoid bacterial contamination and to allow manipulation of the individual operational parameters. Carbon solution contained (g/1) < glucose : 7.2 ; lactate : 7.2 ; acetate : 21.6 ; propionate : 11.2 ; butyrate : 8.0 ; valerate : h.8. Mineral solution I contained (g/1) : KH P0 : 39-7 ; Na HPO : 18.6 ; NaHCO : k0 and Na S, IM : 10 ml. Mineral2 solution II contained (g/1) : NaCl3 : 30 ; Nlfci : 30 ; CaCl : 11 ; MgCl : 10 and trace solution : 10 ml (NiCl , CoCl , MnCl : each 100 mg/1).2A multi-channel pump was used in order to adjust the flowrate of each solution (100 ml/day) which were diluted by distilled water in a mixing vessel.

The UASB reactor was operated during four months before starting experiments. The mean operational values were : COD removal efficiency : 99-4$ ; hydraulic retention time : 0,41 day ; volumetric load : 2.9 g COD/1 reactor/day corresponding to 26.1 g COD/1 granular sludge/day.
In all cases, granules were sampled anaerobically from the bottom of the reactor. Metabolic activities were determined as previously described (Dubourguier et al., 1986). Disintegration of granules was performed in an anaerobic chamber by vigourous shaking with a Polytron (Kinematica GmbH, Switzerland) homogeneizer (repeated 30 s. period). Numeration of dominant trophic groups was done by the MPN method using three tubes per dilution and the individual carbon substrate present in the feeding solution. For size determination, 0.5-1.0 ml of granular sludge were dispersed in 50 ml of 10J> agar in PBS buffer and poured in 2 Petri dishes. Images were obtained with a video-camera and analysed directly on a Quantimet Q 10 analyser. Twenty fields were analysed per sample.
For scanning electron microscopy (SEM), samples were fixed according to Costerton (I98O). Transmission electron microscopy and techniques used for immunogold labelling are described by Prensier et al. (this book). For X-ray analysis, osmium tetraoxyde was omitted in the fixation procedures and samples were coated with carbon. Surface analysis was performed on intact granules whereas elemental mapping was done on 10 pm sections.
Results
Granules formed a well-defined bed with a limpid supernatant. No fluffy congglomerates were evidenced. Although almost all the granules were black, some whitish congglomerates were always present. Size analysis of granule sludge showed great variations of mean diameters (Table 1) due to various profiles of size distribution. In addition, mean diameters were rather low, ranging from O.56 to 1.15 m m because of the presence of numerous granules of small size (< 0.3 mm). The volume distribution was also studied. A diameter 0 50 was defined as the maximal diameter of small granules which occupied half of the total volume of the sample studied. These values were higher than the corresponding mean diameters and ranged from 1.68 to 2.52 mm.
Table 1. Size of granules sampled monthly.
I II III IV V Total
No. of granules 4327 900 II83 3156 1370 10936 Mean diameter O.56 1.15 O.89 0.68 1.13 0.75 Variance 0.24 0.30 0.37 0.48 0.51 0.4l Diameter 0 50 2.26 1.68 2.52 2.33 2.01 2.15
The sludge concentration in the bottom part of the reactor ranged from 54 to 80 g TSS/1. The ash contents of the granules were between 8 and 18$. Typical mineral composition of granules is given in Table 2. Compared with pure strains of methanogens, the contents in Fe, Ni, Cu .and S were high and suggested the presence of sulfide precipitates. Calcium was also in high amounts and might be found as calcium carbonate or phosphate.
79

Table 2. Mineral composition of the granular sludge. All values are expressed as g per 1000 g dry matter (i) after Scherer et al., 1983-
Na K S P Ca Mg Fe Ni Co Cu
granule
2.90 13-50 I8.3O 7.6O 9.3O 3.9O 9.9O 4.69
-O.O85
M. arboriphilicus
3.65 52.5
9.9O 28.5
0.55 3-9 1.3 O.O65 O.OI5 0.020
M. mazei
40.0 7.7O 7.85
II.5 1.7 2.9 O.72 0.095 0.035 0.010
X-ray analysis is generally considered as giving information on elemental composition of a 1 um-layer of the sampled studied. Surface analysis of entire granule showed variations of element ratios, particularly in the case of P and Si (Table 3)•
Table 3- Elemental surface composition of individual granules as determined by X-ray analysis. The relative concentrations were calculated according to C/k = (peak height-background)/ background
Element
Na Al Si P S Cl K Ca Fe Co Ni Cu Zn
0.42 0.00 0.26 2.26
0.97 O.O9 1.14 O.32 O.56 0.00
0.33 O.45 0.10
0.86 O.43 I.38 2.07 1.61 0.11 I.32 0.48 1.08 0.00 0.40 0.62 0.12
0.87 0.16 0.44
3.31 1.73 0.08 2.05 0.53 1.00 0.00
p.29 0.50 0.00
0.86 0.15 0.92'* 2.88 1.62
b.o4 1.29 0.46 1.00 , 0.20
0.37 > O.83 0.00
0.63 .0.05
v O.36-2.03v
1.07 0.07
i.óa' • 0.22,,
0.54'" 0.00 O.25
' O.43 0.00
-^0.56 "0.05 0.29
. 3.Ä8 1.37 0.2
7,1-73 -, 0.50
0.60 0.00
0.37 O.43 O.I7
O.78 O.'OOV 0.42 2.96 I.85 0.2 1.99 O.5O O.78 0.00 O.25
O.67 0.20
On 10 um-thin section, spectra of various granules did not show significant differences. However, X-ray spectra of different zones within the same granule presented great variations, mainly in calcium, phosphorus and silicium contents (Fig. 1). Elemental mapping (Fig. 2) allowed in situ identification of precipitates such as calcium phosphate and ferrous sulfide. Silicate was also present. In all mappings of thin sections, a high background of P and S was observed and was attributed to the bacterial cells by comparison with the X-ray
80

-.t20 5.000 KtU 10.120 >< -.120
Fig. 1. Surface X-ray analysis of soehngenii
m B k
5.000
granules
•M keM
and
il •iL. 10. »S?
of Methanothrix
Fig. 2. Elemental mapping of a calcium phosphate precipitate within a granule.

spectrum of M. soehngenii (Fig. 1). In addition, this bacterium presented significant amounts of Cu and Zn.
Microbiological analysis was performed by the MPN method taking in account cell morphology and ultrastructure, end-products and indirect immunofluorescence. Glucose and lactate were fermented to acetate and propionate by Propionibacterium sp. (10 ). Propionate was oxidized to acetate and methane by syntrophic associations of Methanobrevibacter arboriphilicus and Syntrophobacter wolinii (10 ). Valerate was oxidized by Syntrophomonas wolfei (10 ) with M. hungatei as the main hydrogen scavenger, with M. arboriphilicus at low levels. Surprisingly, in addition to few cells of Syntrophomonas sp., a large curved rod was dominant in the butyrate dilutions (10 ). Thin sections revealed that it was different from the other syntrophs known. A nucleus-like structure and two S-layers were present. This rod ressembled to a unicellular algae and its role in butyrate degradation is under study. However, on thin sections of granules, similar rods were found but in low numbers. Thus, the MPN conditions probably favoured the growth of this very large rod. The dominant acetoclastic and hydrogenophilic methanogens were M • soehngenii (10 ) and M^ arboriphilicus (10 ).
In situ identification of these bacterial genera was performed by immunogold labelling as described elsewhere (Prensier et al., 1987, this book) and allowed to localize syntrophic microcolonies degrading either propionate or butyrate. A good correlation between the numbers of Syntrophobacter sp. and Methanobrevibacter sp. within syntrophic microcolonies was found. A mean value of 2.46 M. arboriphilicus per one cell of Syntrophobacter sp. was found (16 colonies observed). In the case of butyrate, two types of microcolonies were observed : pure cultures of Syntrophomonas sp. or association with low numbers of M. arboriphilicus. In syntrophic microcolonies, a ratio of 0.71 Methanobrevibacter sp. per one cell of syntroph was found. This observation suggested that kinetics of propionate degradation will be more influenced by disintegration of granular sludge that those of butyrate degradation. *
Methanogenic potentials reflected quite weil the general sheme of methanogenesis. In all experiments, 'an initial concentration''of 1..5 g/1 of substrate was used. No .-transientx accumulation of metaBolic intermediates was observed. Methanogenic 4 potefl*ial from glucose, lactate and acetate were not affected significantly by disintegration* of granular sludge (Table 4 ) . Propionate degradation rates were more reduced (23-64$) than the degradation rates of,, butyrate (*7.6-32#)- In contrast, methanogenic potential from * valerate was not significantly inhibited by disintegration. • , •
82

Table 4. Comparison of potential methanogens activities of intact and disintegrated granules. Values are expressed as umol CH /g VSS/mn. Samples were taken monthly.
Biomass
Intact granules
Disintegrat granules
substrate
glucose lactate acetate propionate butyrate valerate
;ed glucose lactate acetate propionate butyrate valerate
1
60.3 3.2 7.6 4.3 7-7 3.4
28.5 2.4 9.8 2.7 4.2 3-5
Sampl
2
96.5 6.5
16.3 5-2 8.6 5-5
82.0 5-3
14.5 4.0 6.2 5-2
e No.
3
94.4 7-6
15.2 10.9 6.6 3-5
85-5 6.9
14.5 3-9 6.1 2.0
4
81.I 6.7
18.4 8.3
12.4 8.4
80.4 6.4
16.3 6.4 9.8 8.0
Discussion and conclusion '
Particle size distribution of granules was varying between samples. In addition, the direct video technique used recorded all granule sizes, even when they are less than 0.3 mm. Thus, mean diameters, as defined by S(nixdi)/Eni with ni number of granules with a diameter di, are impaired by numerous small granules which are always present in sludge. These results are consistently lower than those reported by Hulshoff-Pol et al. (1986). However, the diameters 0 50 defined previously are similar to those reported by other authors and particularly those obtained by the sedimentation balance method. This technique is based on the volume of individual granules from which diameter are calculated (Hulshoff-Pol et al., 1986).
Mineral analysis showed that granules contained large amounts of sulfide precipitates of iron and nickel. Dolfing et al. (1985) reported that 30% of minerals were FeS, responsible for the black colour of the granules. Similar results can be calculated from our data. Calcium precipitates, either carbonate or phosphate represented 30-40# of the minerals, although this ion is present in low amounts in our feeding solution (around 30 mg/1). The calcium carbonate cristals are observed easily in spiky granules where they make up about 60% of the granule dry weight (Grotenhuis et al., 1986). X-ray element analysis and mapping suggest that these minerals occur in defined zones in the granule and are not uniformly distributed. Analysis performed on broken granules (Alibhai & Forster, I986) did not evidence a general rule for mineral deposition in preferential zones like surface, half radius or centre. In fact, the precipitation is probably due to local environmental conditions which are modified by microbiological activities. For example, development of sulfate-reducers, even in low
'amounts (Samain et al., 1984 ; Dubourguier et al., 1985) will concentrate ferrous sulfide around their location. This is clearly

evidenced by electron microscopy. In the same manner, calcium carbonate will precipitate close to the production zone of CO , such as microcolonies of methanogens. These precipitates provide to the bacteria natural inert supports to which they can stick. In the case of Methanothrix soehngenii, ferrous sulfide particles are frequently observed along the filament proteic sheath in the first subcultures (Dubourguier et al., 1985). In this manner, the minerals contribute not only to the settling characteristics but also to the granule stability. In contrast, mineral precipitation may limit the availability of the ions to the bacterial cells, due to their low solubility products (Table 5 ) . But, specific transport molecules with very high affinities have been demonstrated in many bacterial genera. In addition, it was shown that ZnS and FeS instead of Na S could serve as an alternative sulfur source for Methanosarcina barkeri (Scherer & Sahm, I98I).
Table 5- Solubility and solubility products of sulfides. in mg per 100 ml of cold water
<2) at 18°C.
Sulfide
FeS NiS ZnS CuS Cu S CoS MnS
Solubility'1'
O.62 O.36 O.69 0.033
lO"17
O.38 0.5
(2) Solubility product
3-7 x 10"" 1.4 x H T 2 4
1.2 x lO"23
8.5 x 10 5
2 x 10"*7
3 * 1 0t 1.4 x 10"15
Results of microbiological analysis were similar to those previously reported in UASB reactors treating wastewaters from starch industry (Dubourguier et al. , 1985) or from sugar factory ("Dolfing et a -. , 1985) . Methanothrix soehngenii is still the .mainx aqetoclastic methanogenv In our works, Methanobrevibacter sp! was dominant as^he hydrogenophilic methanogen. Careful examination of electron'micrographs of Dolfing et. al. allows presumptive identification of Methanobrevibacter sp. In the other hand, Methanospirillum hungatei is also, present Un granules (Dubourguier et al. , 1985. this study) .but.in th'in sections, it'is not observed as a dominant hydrogenophilic methanogen in syntrophic microcolonies. Considering the respective Ks of M. arboriphilicus and M. hungatei (6.6 and 5-0 uM respectively, Kristjansson et al., 1982, Robinson & Tiedje, ~ 1984)** and their maximal growth rates (0.107 and O.O7O h" ), the doubling time at low hydrogen concentration (10 Atm) are 571 and 658 hours respectively. In these conditions, and according to the model of Archer and Powell (1985). Methanobrevibacter will play the major role in syntrophic associations.
A good correlation was obtained between the number of syntrophs and those of Methanobrevibacter present within the same microcolonies. On the other hand, methanogenic potential activities were similar to those reported by Dolfing (1985) on propionate-grown granular sludge. With this substrate, the disintegration of granules inhibited significantly the rate of degradation indicating that aggregation plays a significant role in interspecies hydrogen-transfer. As the degradation rate of valerate remained unchanged while that of butyrate was weakly
84

diminished, the partial pressure of hydrogen might be in the range of 10 Atm. within the matrix. With this value and considering the concentration of all substrates equal being to 1 mM, the calculated
G'o values are 18.5. _ 10.7 and - 68.7 KJ/reaction for acetogenesis from propionate, butyrate and valerate respectively. These values are consistent with our experimental results, i.e. in these conditions, propionate would be degraded only in syntrophic microcolonies where local partial pressure of hydrogen must be below 10 Atm. Apparently, Dolfing (1985) did not find any effect of disintegration on propionate degradation. This might be due to the strength of granules and mostly of syntrophic microcolonies which could not be dispersed by a simple homogénéiser. However, in the same experimental set, methanogenesis from hydrogen was greatly enhanced after disintegration of granules and also, kinetic studies indicated that hydrogen transfer was limited within the granules at low partial pressures. These results are in agreement with our data.
References
Alibhai, K.R.K. & C.F. Forster, 1986. Physicochemical and biological characteristics of sludges produced in anaerobic upflow sludge blanket reactor. Enz. Microb. Technol. 8:601-606.
Archer, D.B. & G.E. Powell, 1985- Dependence of the specific growth rate of methanogenic mutualistic cocultures on the methanogen. Arch. Microbiol. 14:133-137-
Costerton, J.W., I98O. Some techniques involved in study of adsorption of micro-organisms to surfaces. In : Bitton G. & K.C. Marshall (Ed.) : Adsorption of micro-organisms to surface. John Wiley & Sons. New York. p. 403-432.
Dolfing, J., 1985- Kinetics of methane formation by granular sludge at low substrate concentrations. The influence of mass transfer limitation.Appl. Microbiol. Biotechnol. 22:77~8l.
Dolfing, J., A. Griffioen, A.R.W. Van Neerven & L.P.T.M. Zevenhuizen, 1985. Chemical and bacteriological composition of granular methanogenic sludge. Can. J. Microbiol. 31:744-750.
Dubourguier, H.C., G. Prensier, E. Samain & G. Albagnac, 1985- Granular methanogenic sludge. In : Palz, W., J. Coombs & D.O. Hall (Ed.) : Energy from biomass. Elsevier Applied Science Publishers, p. 542-546.
Dubourguier, H . C , E. Samain, G. Prensier & G. Albagnac, 1986. Characterization of two strains of Pelobacter carbinolicus isolated from anaerobic digesters. Arch. Microbiol. 145:248-253-
Grotenhuis, J.T.C., F.P. Houwen, C.M. Plugge & A.J.B. Zehnder, 1986. Microbial interactions in granular sludge. In : Proceedings of the 4th International Symposium on Microbial Ecology. Ljubjlana. Yougoslavia.
Hulshoff-Pol, L.W., J.J.M. Van de Worp, G. Lettinga & W.A. Beverloo, 1986. Physical characterization of anaerobic granular sludge. In : Anaerobic treatment. A grown-up technology. Aquatech' 86. Amsterdam, p. 89-101.
Kristjansson, J.K., P. Schönheit & R.K. Thauer, 1982. Different Ks values for hydrogen of methanogenic bacteria and sulfate reducing bacteria : an explanation for the apparent inhibition of methanogenesis by sulfate. Arch. Microbiol. 131:278-282.
Robinson, J.A. & J.M. Tiedje, 1984. Competition between sulfate-reducing and methanogenic bacteria for H under resting and growing conditions. Arch. Microbiol. 137:26-32.
Samain, E., H.C. Dubourguier & G. Albagnac, 1984. Isolation and
85

fr
characterization of Desulfobulbus elongatus sp. nov. from a mesophilic industrial digester. System. Appl. Microbiol. 5:391~'+01.
Scherer, P., H. Lippert & G. Wolff, 1983. Composition of the major elements and trace elements of 10 methanogenic bacteria determined by inductively coupled plasma emission spectrometry. Biol. Trace Elem. Res. 5:1^9-163.
Scherer, P. & H. Sahm, I98I. Influence of sulphur-containing compounds on the growth of Methanosarcina barker!. Eur. J. Appl. Biotechnol. 12:
28-35-
86

BIOFILM DEVELOPMENT IN LAB-SCALE METHANOGENIC FLUIDIZED BED REACTORS
L.G.M. Gorris and J.M.A. van Deursen
Department of Microbiology, Faculty of Science, University of Nijmegen, The Netherlands
Summary
Biofilm development on sand with different inocula or different substrates was studied in laboratory-scale methanogenic fluidized bed reactors. Both the course of biofilm formation during reactor start-up and the bacterial composition of newly developed biomass at steady-state were found to be similar irrespective of the type of inoculum applied. Although the course of biofilm formation was comparable with either acetate, butyrate, propionate or a mixture of these fatty acids as substrate, the composition of the biomass was dependent on the type of substrate. Biofilm formation proceeded according to a fixed pattern which could be subdivided in three consecutive phases, vis lag phase, biofilm production phase and steady-state phase. Crevices in the surface of the sand particles were found to be the sites of initial colonization. Keywords: fluidized bed, biofilm formation, biofilm composition.
Introduction
Anaerobic purification of the soluble organic fraction of industrial waste waters can be accomplished successfully by use of biological treatment systems such as the fluidized bed (FB) reactor. In this system, retention of purifying bacteria is achieved by immobilization on a mobile carrier (Heijnen et al., 1986). At Gist Brocades (Delft, The Netherlands) the FB-system is already used at full industrial scale in a two-stage process for anaerobic treatment of waste waters originating from yeast and penicillin production (Enger et al., 1986). However, a better understanding of the microbial basis of biofilm development could be exploited to improve process performance and control.
In order to study the factors which influence the microbial population dynamics during start-up of methanogenic FB-reactors with sand as the carrier material, a laboratory experimental set-up was designed and used to investigate the influence of different microbial inocula and substrate composition of the waste water on biofilm development.
Materials and methods
Experimental conditions
Start-up experiments were performed with seven all-glass FB-reactors in a set-up depicted in Fig. 1. Each reactor consisted of an effective part (a), which contained the sludge bed (b), and a settler compartment (c), which was equipped with a gas outlet (d) connected to a Mariotte flask (e). The volume of the effective part of the various reactors ranged from 650 to 950 ml. Reactor temperature was kept constant at 37°C (f). The influent liquid entered a reactor through a hook-shaped inlet tube (g). Glassbeads (h), 5 mm of diameter, were used to disperse the influent liquid evenly. The influent was composed of synthetic waste water (i,j) and liquid from the settler compartment, which was recirculated (m) to obtain

fluidization of the sludge bed. Inoculum (k) was applied as specified below. Spent liquid left the reactor through an effluent outlet equipped with a water seal (1). The main specifications and operating parameters of the various reactors are given elsewhere (Gorris, 1987). At the start of the experiments the sludge bed of the reactors consisted of bare sand with a particle diameter of 0.1-0.3 mm and a density of 2.6 g/cm .
Fig. 1. Schematic representation of experimental set-up. a, effective part; b, sludge bed; c, settler compartment; d, biogas outlet; e, 10-1 Mariotte flask; f, temperature bath circulator; g, influent inlet; h, glassbeads; i, concentrated solution of synthetic waste water; j, tap water reservoir; k, inoculum; 1, effluent outlet.
Organic loading regimen/waste water composition/inoculum
The organic load was increased gradually during start-up by employing the following loading regimen: ab -initio, the reactors received 0.5 g VFÂ-COD/h, whereas the loading rate was doubled when' the total VFA-degradatign reached 60%; an experiment was terminated when steady-state was reached at 2.0 g VFA-COD/h. ' ». .^ - f
The reactors were fed an artificially prepared waste water containing (at 1 g VFA-COD/h) : 8.4 mM acetate, 2,. 3 mM propionate and 1.9 mM butyrate (VFA-mix, reactors 1-4), 17.8 mM acetate (reactor 5 ) , 6.4 mM butyrate (reactor 6) or 9.6 mM propionate (reactor 7). KH2POit, K2HP01,, K2SO1», NHi,Cl, vitamins and minerals stock solutions were included as well (Gorris, 1987).
Reactor 1 was inoculated batch-wise by addition of 15 ml mature granules (2.1 g VSS, methanogenic activity 300 ml CHi /g VSS.d) taken from a 5-1 FB-reactor, which was fed the VFA-mix waste water at 2 g VFA-COD/h. Reactor 2 was inoculated with digested sewage sludge from a local sewage plant. The sludge (0.4 g VSS/1, 50 ml CHit/g VSS.d) had beren activated by anaerobic incubation during three days at 37°C in activation medium (Gorris, 1987) and was pumped into the influent flow at 48 ml/h during the whole experiment. Reactor 3 received effluent (80 ml/h; 4 ml CH^/l.d) from a 1-1 UASB-reactor, fed 2 g COD/h of VFA-mix waste water. Reactors 4 to 7 were inoculated by addition of effluent from the 5-1 FB-reactor (flow 300 ml/h, 10 ml-CHit/l.d). Both effluents were free of volatile fatty acids, whereas the VSS-contents were below the detection limit of the assay method.
83

Measurements and analyses
Biogas production was monitored by means of water displacement in 10-1 calibrated Mariotte flasks. The amount of methane in the biogas was measured by gas chromatographic analysis. Acetate, propionate and butyrate were quantified by gas-liquid chromatography. Standard methods were used to determine the amount of biomass (= volatile suspended solids) immobilized on sand particles (= ash weight) (g VSS/g Aw) . Samples were prepared for scanning electron microscopy as described elsewhere (Gorris, 1987).
The methanogenic activity of newly developed biomass was measured in two types of activity tests. Sludge samples taken during reactor start-up were subjected to the first test, in which they were incubated anaerobically in a test medium containing an excess of those volatile fatty acids (acetate, propionate or/and butyrate) present in the waste water fed to the reactor the samples were taken from (Gorris, 1987) to determine the maximum methane production rate (umol CHi</h) . The data obtained were used to calculate the methanogenic capacity (Mmol CH^/g Aw.h), which gives an indication of the amount of methanogenic biomass immobilized on the sand. Samples taken from the top layer of the sludge beds at steady-state were incubated similarly in a second type of activity test on each of the following substrates: H2/CO2, acetate, butyrate and propionate. This test yielded the potential methanogenic activity (pmol CHi,/g VSS.h) on each of the substrates. The ratio of all four activities of one sludge will be referred to as the relative substrate spectrum.
Based on the concentrations of specific methanogenic cofactors in sludge samples taken at steady-state, the proportions (% of total biomass)'of acetotrophic and hydrogenotrophic methanogenic bacteria were quantified using pure culture cofactor contents of Methanothrix soehngenii, Methano-sarcina barkeri and Methanobacterium formicicum as reference (Gorris, 1987).
Results and discussion
Course of biofilm development
Two types of parameters were monitored to assess the course of biofilm formation on sand during reactor start-up. Indirect parameters, viz methane production rate, total fatty acid conversion and volume of the sludge bed, were monitored as an overall indication on reactor level. Direct parameters, viz methanogenic capacity, amount of biomass on sand and volume of individual layers within the sludge bed, were determined as an indication on sludge level.
The results obtained with regard to both direct and indirect parameters in the experiment with reactor 4 are illustrated in Fig. 2. Reactor startup proceeded in a sigmoid fashion: an initial period of slow increases in both direct and indirect parameters (lag phase) was followed by a period of accelerated biofilm formation and reactor performance (biofilm production phase), which persisted until the organic load was not increased anymore and a steady-state situation was reached (steady-state phase). This overall pattern reflected the course of biofilm formation on the sand as assessed by scanning electron microscopic examination. During the first period initial colonization of the sand particles was observed. Characteristically, this incipient colonization was restricted to crevices in the carrier surface (Fig. 3a,b). During the second period, the surface of the sand particles became gradually colonized as a result of proliferation of the attached bacteria. At this stage the sludge bed consisted of three visually distinct sludge layers, which contained granules which differed in biomass content and methanogenic capacity (Fig. 2 ) . With granules
89

100
J il J 0.2
0.1 -
U) EO t i m e ( d a y s )
C H top layer
Wà middle layer
• bottom layer
• not measured
0
200
Ï . - 100
$ j i j
27 37 U 66 sample day
Fig. 2. Course of (a) loading rate and VFA-conversion, (b) methane production rate and total sludge bed volume, (c) methanogenic capacity, (d) biomass on sand, and (e) volume of individual sludge layers of reactor 4, which received FB-effluent (inoculum) and VFA-mixture (substrate).
present in the bottom layer, colonization of the carrier surface was still restricted to crevices, whereas granules in the middle or top layê*: became completely covered with biomass '(Fig. 3c). In all other reactors a similar course of biofilm formation was observed: (data' not shown) . A comparable, pattern has been described recently for start-up of a 25-1 methanogenic FB-reactor on acidified'yeast wastewater '(Mtilder, 1966). f
In Table 2 a comparison is made between the tïmes at which thé parameters showed a steep and persistent increase .in'each start-up experiment. From this, the onset of the biofilm production phase can be timed for the various reactors. Both direct and indirect parameters indicated that this phase was reached "about 40 days after the start of reactors 2 and 3, and after about 20 days in case of reactor 4. With reactor 7, fed propionate as sole carbon source, the onset appeared to be retarded to about day 80. With reactors 1, 5 and 6, however, there was a difference in the timing by both types of parameters : the indirect parameters (methane production rate and VFA-conversion) indicated an instantaneous onset of biofilm development, while the direct parameters indicated that biofilm formation accelerated after about 40 days, at which stage also the sludge bed started to expand. The discrepancy was found to be due to proliferation of bacteria in the inoculum layer (reactor 1) and the growth of floccose granules (reactors 5 and 6) on top of the sludge bed. In these cases, the course of colonization and biofilm production on the sand particles in the sludge bed was not reflected accurately by the indirect parameters.
90
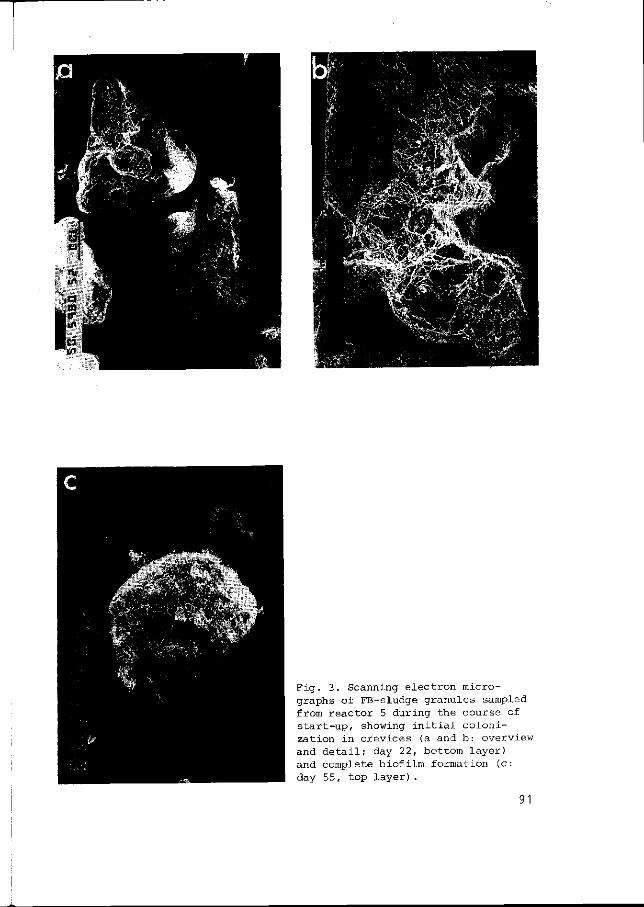
Fig. 3. Scanning electron micrographs of FB-sludge granules sampled from reactor 5 during the course of start-up, showing initial colonization in crevices (a and b: overview and detail; day 22, bottom layer) and complete biofilm formation (c: day 55, top layer).

Table 1. Comparison of the times (days) after reactor start-up at which a steep increase was observed in the various parameters3.
Inoculum and substrate Indirect parameters Direct parameters
1 FB-sludge, mix 0 43 2 sewage sludge, mix 41 39 3 UASB-effluent, mix 40 39 4 FB-effluent, mix 20 < 27 5 FB-effluent, AA 0/41 41 6 FB-effluent, BÄ 0/37 41 7 FB-effluent, PA 82 76
a: indirect parameters and direct parameters are named in the text b: mix, VFA-mixture; AA, acetate; BA, butyrate; PA, propionate
Biofilm composition
FB-granules were sampled from the top-layers of the various reactors at the end of the experiments to determine the bacterial composition of the newly developed biomass by means of microscopic observation, comparison of relative substrate spectra and quantification of methanogenic biomass.
Examination of the samples by scanning electron microscopy, revealed that the biofilms in all instances mainly consisted of bacteria morphologically resembling Methanothrix and of small amounts of Methanosaraina. Apart from these acetotrophic methanogens, various other types of bacteria were observed, but none of these could be identified by morphology alone. As judged by epifluorescence microscopic observation strongly fluorescent Methanobaaterium-type organisms were present in all sludges, except in the sludge cultured on acetate as the sole carbon source (reactor 5). In this type, the biomass appeared to consist almost completely of Methano-thrix spp and a small amount of Methanosaraina spp.
The potential methanogenic activities of the sludges on four different substrates were measured as an indication of the relative proportions of the various trophic groups in the'newly"developed biomass, which is reflected in the relative substrate spectrum '(Tabled) . Similar substrate spectra were obtained for the. sludges cultured on the VFA-mixture and off butyrate alone, although'the sludge in reactor 4 'had a „relal ively, high potential methanogenic activity with propionate 'Jks the test substrate. On average, the substrate spectrum was acetate: .propionate: butyrate: H2/C02
= 60: 5: 30: 5. This is taken as an 'indication that the relative proportions of methanogenic and acetogenic bacteria were quite similar in all these cases. With the acetate- and the' -propionate-grown sludges, however, the relative substrate spectra deviated substantially. In the former, acetate appeared to be the only substrate degraded at a significant rate, which indicates that only acetotrophic species were present in this sludge. With the propionate-grown sludge, relatively high activities were measured on propionate and H2/CO2, while the acetotrophic activity was comparatively low. This indicates that propionate consuming acetogens and hydrogenotrophic methanogens were relatively numerous in this sludge.
Based on the concentrations of specific methanogenic cofactors measured in the various sludges (data not shown), the relative amounts of different methanogenic bacteria were quantified directly (Table 3). The calculated proportions show that the biofilm composition of all sludges cultured with
92

the VFA-mixture and with butyrate were comparable, with Methanothvix spp as the predominant organism (on average 70% of total biomass). Using Methanobacterium fovmicicum as reference, substantial amounts of hydroge-notrophic methanogens were estimated (average 10%). Methanosavcina spp was found to be present in all instances, but was most abundant in sludge from reactor 1. In the acetate-grown sludge, an extremely low amount of Metha-nobactevivan was measured, while the amount of Methanothvix was estimated to be over 100% of the total biomass. Although this clearly is an over-estimation, it may still be taken as an indication of the relative abun-
Table 2. Potential methanogenic activities of newly developed FB-sludges on four test substrates, measured at steady-state to assess the relative substrate spectrum.
Inoculum/substrate Total QCHl((VSS)a
(Umol CHu/g VSS.h) Fraction
on (%) of total QcHn<vss)
the indicated substrate 'c
AA PA BA HC
1 FB-sludge, VFA-mix 2 sewage sludge, VFA-mix 3 UASB-effluent, VFA-mix 4 FB-effluent, VFA-mix 5 FB-effluent, acetate 6 FB-effluent, butyrate 7 FB-effluent, propionate
2336 3692 3825 2284 1829 3448 1593
60 59 57 56 97 56 33
2 6 5
21 1 1
28
31 33 29 23
1 27 23
7 2
lä 1
16 16
a: sum of QCH4(VSS) values on each test substrate b: the ratio of the four fractions is the relative substrate spectrum c: AA, acetate; BA, butyrate; PA, propionate; HC, H2/CO2 d: activity test not performed
Table 3. Relative amounts of methanogenic species and non-methanogens in the newly developed biomass, determined at steady-state
Inoculum/substrate3 Relative proportions (% of total biomass)
Methano- Methano- Methano-baetevium thvix savcina
non-methanogens b
1 FB-sludge, mix 2 sewage sludge, mix 3 UASB-effluent, mix 4 FB-effluent, mix 5 FB-effluent, AA 6 FB-effluent, BA 7 FB-effluent, PA
6 .4 12 .1 14 .5 6 . 2 0 . 3
11 .3 4 3 . 6
71 . 9 79 . 2 6 0 . 6 78 . 6
150 6 2 . 5 4 1 . 9
12 .1 2 . 3 9 . 1 0 . 7 2 . 7 6 . 7 2 . 7
9 . 6 6 . 4
15 .8 14 .5
c 1 9 . 6 11 .8
a: mix, VFA-mixture; AA, acetate; BA, butyrate; PA, propionate b: the relative proportions were calculated by subtraction of the sum of methanogenic proportions from 100% biomass ,c : not estimated due to overestimation of proportion Methanothvix spp
93
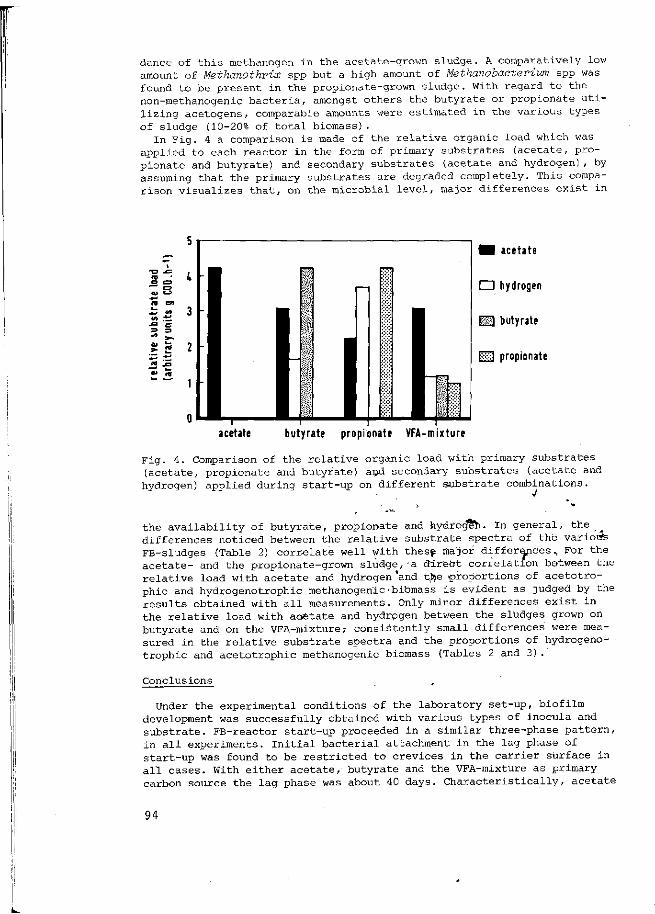
dance of this methanogen in the acetate-grown sludge. A comparatively low amount of Methanothvix spp but a high amount of Methanobacterivm spp was found to be present in the propionate-grown sludge. With regard to the non-methanogenic bacteria, amongst others the butyrate or propionate utilizing acetogens, comparable amounts were estimated in the various types of sludge (10-20% of total biomass).
In Fig. 4 a comparison is made of the relative organic load which was applied to each reactor in the form of primary substrates (acetate, propionate and butyrate) and secondary substrates (acetate and hydrogen), by assuming that the primary substrates are degraded completely. This comparison visualizes that, on the microbial level, major differences exist in
acetate
acetate butyrate propionate VFA-mixture
Fig. 4. Comparison of the relative organic load with primary substrates (acetate, propionate and butyrate) a»d secondary substrates (acetate and hydrogen) applied during start-up on different substrate combinations.
•i
the availability of butyrate, propionate and hydrogen. In general, the ^ differences noticed between the relative substrate spectra of the various FB-sludges (Table 2) correlate well with thesf ma'jor differences., For the acetate- and the propionate-grown sludge,>a direct correlation between the relative load with acetate and hydrogen'and the .proportions of acetotro-phic and hydrogenotrophic methanogen'ic -biomass is evident as judged by the results obtained with all measurements. Only minor differences exist in the relative load with acÄtate and hydrpgen between the sludges grown on butyrate and on the VFA-mixture; consistently small differences were measured in the relative substrate spectra and the proportions of hydrogenotrophic and acetotrophic methanogenic biomass (Tables 2 and 3 ) .
Conclusions ,
Under the experimental conditions of the laboratory set-up, biofilm development was successfully obtained with various types of inocula and substrate. FB-reactor start-up proceeded in a similar three-phase pattern, in all experiments. Initial bacterial attachment in the lag phase of start-up was found to be restricted to crevices in the carrier surface in all cases. With either acetate, butyrate and the VFA-mixture as primary carbon source the lag phase was about 40 days. Characteristically, acetate
94

was the main methanogenic substrate in these cases and the newly formed biomass consisted mainly of Methanothrix spp. In contrast, with propionate as primary carbon source and hydrogen produced from it as the main methanogenic substrate, the lag phase was 80 days. Also, Methanothvix spp were present in relatively low amounts, while relatively high amounts of hydrogenotrophic methanogens were measured. Thus, in general, the composition of the biomass at steady-state was a reflection of the relative amounts of primary and secundary carbon sources fed to the reactors.
The observations that the waste water composition influences the time course of reactor start-up and that initial colonization is restricted to crevices in the carrier surface may have an important practical impact. Since the time needed for reactor start-up is a decisive factor for the economical application of the FB-system in practice, it is important to obtain more information about the microbial interactions and the physico-chemical factors which influence the early stages of colonization. The laboratory fluidized bed system and the analytical techniques used here are very well suited for investigations in this field. Both are exploited at this moment to study in more detail the population dynamics during the initial colonization in methanogenic fluidized bed systems with sand as support material.
References
Enger W.A., W.M.A. van Gils, J.J. Heijnen & W.A.A. Koevoets, 1986. Full scale performance of a fluidized bed in a two-stage anaerobic wast-e water treatment at Gist-Brocades. In: Proc. Water Treatment Conference Aquatech '86. Amsterdam, The Netherlands, p. 297-303.
Gorris L.G.M., 1987. Analysis of methanogenic populations in anaerobic digesters. PhD Thesis, University of Nijmegen, The Netherlands.
Heijnen J.J., A. Mulder, W. Enger & F. Hoeks, 1986. Review on the application of anaerobic fluidized bed reactors in waste-water treatment. In: Proc. Water Treatment Conference Aquatech '86. Amsterdam, The Netherlands, p. 161-173.
Mulder A., 1986. Anaerobic purification of acidified yeast waste water in laboratory fluidized bed reactors. In: Proc. Water Treatment Conference Aquatech '86. Amsterdam, The Netherlands, p. 669-672.
95

PRESENCE OF VIRUSES AND OTHER POTENTIAL BACTERIAL PREDATORS IN GRANULAR METHANOGENIC SLUDGES
G. Prensier(1>, J.L. Roustan(2), H.C. Dubourguier*<2), G. Albagnac<2)
(1) Institut National de la Santé et de la Recherche Médicale - 369. Rue Jules Guesde - 59650 VILLENEUVE D'ASCQ - France <2> Institut National de la Recherche Agronomique - Station de Technologie Alimentaire - BP 39 - 59651 VILLENEUVE D'ASCQ Cedex -France
Corresponding author
Summary
Granules sampled from various anaerobic filters and UASB reactors were examined for the presence of viruses and other potential predators. In zones of complete bacterial cell lysis, virus-like particles were found. Two types of viruses present in Methanothrix soehngenii are described. In addition, helical bacteria (Spirochaetales) were frequently observed within empty cells, even in Methanosarcina sp. clumps. Ecological significance of these infections agents is discussed. Keywords : Virus, Spirochaetales, infection, Methanothrix, Methanosarcina, granule.
Introduction
In granular methanogenic sludge, electron microscopy pointed out the peculiar organization of various different bacterial morphotypes and revealed numerous cell debris entrapped within a matrix (Dubourguier et al. , 1985, Dolfing et al., 1985)». During studies of granular sludge from different anaerobic digesters, numerous-«, microcolonies of empty cell walls were often observed. Other .images suggesting cell lysis due to infectious agents were also, obtained*. This paper reports on the presence of viruses and helical organisms in granular- sludges.
Material and methods •
' • ' ' t Freshly sampled granules were fixed anaerobically in a cacodylate
buffer (O.O7 M - pH 7.4) containing, glutaral'dehyde (1.2%) and ruthenium red (0.05$). After washing in ruthenium red cacodylate buffer, samples were post-fixed in the , same buffer containing osmium tetraoxyde (1%). Dehydration was performed in graded ethanol solution and inclusion was done in Epon Epikote. Sections were stained with uranyl-acetate (2%) in alcohol (50$) followed by lead citrate. Negative staining of viral particles was performed on carbon coated parlodion grids with 3# aqueous uranyl acetate.
Results
Granular sludges were sampled from various upflow industrial anaerobic filters and UASB (industrial or laboratory) reactors. All were operating on wastewaters from agro-industry. In respect with their origin, the granules had a normal appearance without any sign of viral infection and had a specific activity in the range 0.15-0.35 g COD
96

CH /g VSS/day. The overall structure of granules were similar to that previously
described (Dubourguier et al. , 1985. Dolfing et al., 1985)• Briefly, all granules studied were very complex and constituted of various bacterial morphotypes entrapped in a heterogeneous matrix. Methanothrix sp. cells were observed in all the sections as dispersed and non oriented, but also wounded in balls. Microcolonies of Syntrophobacter sp. always associated with numerous Methanobrevibacter sp. were observed. Another typical morphotype identified as Syntrophomonas sp. was also always arranged as microcolonies but associated with limited numbers of Methanobrevibacter sp.. Methanosarcina clumps were always present but in low numbers. In glucose/lactate/VFA-fed UASB laboratory digesters, Propionibacteria were observed mainly localized at the periphery of granules.
Besides active bacterial cells characterized by their cytoplasmic appearance, numerous empty cell walls were dispersed in the matrix (Fig. 1). Sometimes, they clearly originated from microcolonies. These bacterial lysis might be due to cell death and lysis or to specific infectious agents.
Careful examination of empty cell walls of filamentous bacteria allowed identification of the lysed organisms. Regularly arranged subunits in the sheath, spacer-plugs between empty cells were typical of Methanothrix sp. as previously described (Beveridge et al., 1986a, 1986b, Debeire et al., 1987). In addition, specific polyclonal antibodies reacted in immunogold labelling with these empty cell, walls (Prensier et al., this book). In these zones, numerous electron dense particles were seen at low magnification (Fig. 2 ) . Higher resolution microscopic examination allowed the identification of two types of particles easily distinguished by their size.
Empty capsidic enveloppes, characterized by a translucent central core and complete hexagonal particles of a 100 nm-virus were often present within bacterial ghosts together with very long tubular structures of 20 nm in diameter (Fig. 3)• N° peripheral appendage was observed around this hexagonal virus-like particle.
Also, smaller virus-like particles were observed in Methanothrix sp. cells in some granules as hexagonal heads of 50 nm with a tail. This tail apparently appeared as a sheath and fibers attached to a baseplate. These two viruses were both frequently observed within the same granules. They have been isolated and are currently under study (Roustan et al., I986). They were both lytic for Methanothrix concilii strain GP6, now classified as M. soehngenii (Touzel et al., I987) and also for M. soehngenii strains Opfikon and FE, strain GP6 being the more sensitive.
Besides viruses, some electron micrographs suggested bacterial infections by other agents. A free-living helical long bacteria was frequently observed in light microscopy and electron microscopy (Fig. 4 & 5 ) . Its morphological appearance and its ultrastructure allowed its classification in the family Spirochaetales. In thin section, these helical bacteria were frequently observed inside of empty bacterial ghosts, even in Methanosarcina cells (Fig. 6 ) . This peculiar localization might be due to migration of the spirochete after bacterial cell death and lysis. But infectivity of such helical organisms for other genera cannot be excluded since complex nutritional requirements including long chain fatty acids have been described for gome representative species of the Spirochaetales (Johnson, 1981).
97

••vt
' I
i*.*é' " • " • ^ # :
v ^
s^ ^*
Fig. 1. Empty cell walls within Fie: 2 ZonP nf i„.<„ „P M tu t u t r i x of granular methanogenic ^ s p ^ w u f e S t ^ d e S e ^ "
virus-like particles.
Fig. 3- Tubular structures associated with the 100 nm-virus within an empty cell of Methanothrix sp.
98
Fig. 4. The tailed 50 nm-virus within a ghost of Methanothrix sp. -

Fig. 5- Scanning electron microscopy (a) and thin section (b) of free-living spirochetes in a granule
Fig. 6. A spirochete within an empty cell of Methanosarcina sp.
Conclusion
In digesters, the importance and the ecological significance of bacterial predators remained poorly documented. In sewage, manure and sediments, many viral isolates morphologically similar to the "T" phages have been found (Bradley, 1967)• Spirochaetales are present in various habitats ranging from muds to mammalian cells (Johnson, 1981). Thus, this work extends the occurence of these organisms.
At the present time, the infectivity of spirochetes to methanogens remains unknown. However, many described genera have not yet been isolated and cultivated, probably due to specific growth requirement as described for other spirochetes. Highly bacterial cell enriched biotopes like granular sludge may . provide the adequate nutritional environment. In case of Methanosarcina cells, spirochetes may be provided with peculiar lipids or other compounds.
Viruses infecting Archaebacteria have been recently described (Janekovic et al., 1983, Schnabel et al., 1982, Martin et al., 1984). The only lytic phage of methanogenic bacteria was demonstrated in a
.Methanobrevibacter sp. strain (Baresi & Bertani, 1984). The role of viruses in granular sludge is still unclear. Possibly, infected digesters may be still operational without any trouble as long as the environmental parameters allow bacterial growth and sufficient turnover.
99
In these conditions, detection of viruses by conventional operating measurements such as digestion efficiency or gas productivity would be difficult. Evidence of viral infection could be obtained only by electron microscopic observations or by specific antisera against viral proteins. Adverse conditions such as substrate limitation, pH or temperature shocks may induce a generalized viral infection and create troubles in digester functioning. Luckily, such a phenomenon was not identified until present time. However, substrate depletion have been shown to induce lysis in lysogenic strains of Thermoproteus tenax (Janekovic et al., 1983)• A similar process can be involved in the viral infection observed within the granules where bacterial cells are in substrate-limited conditions. In addition, viral dissemination is probably limited to the inside of granules increasing the multiple-order infection and therefore the efficiency of the phage.
Presence of viruses in Methanothrix soehngenii affects the overall morphological properties of this dominant acetoclastic methanogen, no bundles being observed in the pure cultures. Since this bacteria forms normally networks, fragilization and subsequent fragmentation of the filament may affect the granule cohesion particularly in high rate digesters (Roustan et al., 1986).
Lastly, in such bacterial congglomerates, the viral particles and the bacterial ghosts remained in their original spatial location. Therefore, informations were easily obtained on the viruses and their hosts and thus, purification of the viruses was facilitated.
References
Baresi, L., G. Bertani, 1984. Isolation of a bacteriophage for methanogenic bacterium. ASM Meeting 17 + s 133•
Beveridge, T.J., G.B. Patel, J.B. Harris & G.D. Sprott, 1986a. The ultrastructure of Methanothrix concilii, a mesophilic aceticlastic methanogen. Can. J. Microbiol. 32:703~710.
Beveridge, T.J., B.J. Harris, G.B. ,Patel & G.D. Sprott, 1986b. Cell division and filament splitting in Methanothrix concilii. Can. J. Microbiol. 32:779-786. 4
Bradley, D.E., 1967- infrastructure of-bacteriophages and bacteriocins. Bacteriol. Rev. 31:230-314. *•.<*»•
Debeire, P., P. Pellerin, H.C. Dubourguier, B. Fournet, G. Prensier & G.' Albagnac, 1987- Ultrastructural and biochemical studies of the cell sheath of Methanothrix soehngenii.' .Und Workshpp on Crystalline Cell Enveloppe Layers in Microorganisms., Vienna, 31 August-04 September Springer Verlag (under press). • , • "
Dolfing, J., A. Griffioen, A.R.W. Van Neerven & L.P.T.M. Zevenhuizen, 1985. Chemical and ^bacteriological composition of granular methanogenic sludge. Can. J. Microbiol. 31:744-750.
Dubourguier, H . C , G. Prensier, E. Samain & G. Albagnac, 1985- Granular methanogenic sludge : microbial and structural analysis. In : W. Palz, J. Coombs & D.O. Hall (Ed.) : Energy from Biomass. Elsevier Applied Science Pub., London - New York p. 542-546.
Janekovic, D., S. Wunderl, I. Holz, W. Zillig, A. Gierl & H. Neumann, 1983. TTV1, TTV2 and TTV3, a family of viruses of the extremely thermophilic anaerobic sulfur reducing archaebacterium Thermoproteus tenax. Mol. Gen. Genet. 192:39-45.
Johnson, R., I98I. Introduction to the spirochetes. In : M.P. Starr, H. Stolp, H.G. Trüper, A. Balows & H.G. Schlegel (Ed.) : The Prokaryotes. Springer Verlag, Berlin. Heidelberg.New York p. 533-537.
00

Martin, A., S. Yeats, D. Janekovic, W.D. Reiter, W. Aicher & W. Zillig, 1984. SAV1, a temperature u.v.-inducible DNA virus-like particle from the archaebacterium Sulfolobus acidocaldarius isolate B12. EMBO J. 3: 2165-2168.
Roustan, J.L., J.P. Touzel, G. Prensier, H.C. Dubourguier & G. Albagnac, 1986. Evidence for a lytic bacteriophage for Methanothrix sp. In : H. C. Dubourguier et al. (Ed.) : Biology of anaerobic bacteria. Elsevier Science Publishers. B.V., Amsterdam, p. 200-205.
Schnabel, H., W. Zillig, M. Pfaffle, R. Schnabel, H. Michel & H. Delius, 1982. Halobacterium halobium phage $H. EMBO J. 1:87-92.
Touzel, J.P., G. Prensier, J.L. Roustan, I. Thomas, H.C. Dubourguier & G. Albagnac, 1987- Description of a new strain of Methanothrix soehngenii and rejection of M. concilii as a synonym of M. soehngenii. Int. J. Syst. Bacteriol. (under press).
10'

COLONY FORMATION AND LIFE CYCLES OF ANAEROBIC BACTERIA ATTACHED TO SURFACES
1 U. Szewzyk and B. Schink
Fakultät für Biologie, Universität Konstanz, Postfach 5560, D-7750 Konstanz, FRG
Indroduction
Bacteria living in environments with high amounts of particulate matter, like sand grains or detritus particles, must be adapted to the spatial heterogenity of these environments. It is of great interest, if and how bacteria shift from one microenvironment (liquid phase) to the other (solid/liquid interface). For the understanding of this system it is necessary to investigate all fluxes between the two microenvironments, like deposition of cells to the surface and detachment or release of cells from the surface. So far most research was focussed on the deposition of cells from the liquid phase to a surface. Only few informations are available about the longterm behavior of the cells at a surface, and the reasons and mechanisms for detachment of cells after the development of colonies or biofilms.
In this study anaerobic bacteria, isolated from environments with high amounts of particulate matter, such as anoxic freshwater and marine sediments, were used to study these processes (Szewzyk und Pfennig, 1986).
Results and discussion
The formation of microcolonies by arfaerobic bacteria, beginning with attachment of individual cells to the substratum,"" as well as the subsequent development of the microcolonies over long time periods was studied in a continuous flow microchambêï. Based on the observations in the microchamber complex life cycles could be-post*ölated for two strains of Pelobacter acidigallici-, a gallic acid degrading bacterium.
For P_. acidigallici strain WoGal a dependency of' the dynamics of, the formation and maintenance of colonies on the substrate concentration was found. At high substrate concentrations ( >>lmM) many cells were suspended in the liquid phase and deposited uniformly over the substratum. This high deposition rate led to a homogenous, thick biofilm and circumvented individual col'opy formation. By contrast, at gallic acid concentrations below 0.1 mM only very few suspended cells were present. Cells which attached to the surface, divided and formed individual microcolonies. After the colonies had reached a certain size, depending on the substrate concentration in the inflowing medium, peripheral cells were observed which extended radially from the colony and showed twiching motility. After several hours the motile cells detached and migrated into the liquid phase. These motile swarmer cells could reattach to the surface after different time periods and build up new colonies.
1. Present address: Lehrstuhl Mikrobiologie I, Universität Tübingen, Auf der Morgenstelle 28, D-7400 Tübingen, FRG
102

_P. acidigallici strain MaGal2 (Schink and Pfennig, 1982), like strain WoGal, formed homogeneous biofilms at high substrate concentrations. By contrast, at low substrate concentrations the behaviour was quite different since many attached cells of strain MaGal2 showed marked morphological differentiations. These originally short rods formed very long filaments which expressed a swinging movement. The filaments built up spongy colonies. Besides these colonies always some compact colonies consisting of short rods were observed. In the center of those colonies motile cells were formed after 1-2 days. These swarmer cells were released through one opening and migrated into the liquid phase. The swarmer cells could attach again to the surface and form colonies consisting either of long filaments or of short rods.
For both organisms life cycles could be postulated which included the attachment of cells to a surface as well as the formation of swarmer cells. It seems probable, that the cells of anaerobic bacteria in liquid cultures correspond to the swarmer cells. For experiments with this cultures one should keep in mind, that swarmer cells represent only a part of the life cycle of the bacteria and might differ from cells in the other parts of the life cycle. Consequently only a part of the potential of microbial cells can be studied when only the usual liquid culture methods are used.
References
Szewzyk, U. & N. Pfennig, 1986. A simple method for enrichment and cultivation of anaerobic, surface-colonizing bacteria. J. Microbiol. Meth. 5:289-294.
Schink, B. & N. Pfennig, 1982. Fermentation of trihydroxybenzenes by Pelobacter acidigallici gen. nov. sp. nov., a new strictly anaerobic, non-sporeforming bacterium. Arch. Microbiol. 133:195-201.
103

r
Evaluation report microbiological aspects
105

REPORT ON THE MICROBIOLOGICAL ASPECTS OF GRANULATION
D.B. Archer
A.F.R.C. Institute of Food Research, Colney Lane, Norwich NR4 7UA, United Kingdom.
Introduction
The upflow anaerobic sludge blanket (UASB) process has been successfully applied to the treatment of wastewaters from a variety of industries. The application of this technology continues to expand and its widespread use has not been dependent on understanding the microbiology of the process. Nonetheless, there remain certain limitations to the technology. For example, granular anaerobic sludge does not form with some wastewaters, problems have been encountered in the transition from one wastewater to another and toxic compounds in waste streams can be inhibitory. Seeding new UASB reactors with granular sludge developed on a wastewater similar to that requiring treatment may overcome some of the problems associated with granulation from a non-granular inoculum. However, unsuspected differences in the wastewaters can lead to déstabilisation of the granular sludge inoculum. Empirical rules for optimising granulation have been formulated by Gatze Lettinga and his collaborators but &• more rational approach based on improved understanding of granulation at the microbial level ought to offer better control. The operation of wastewater treatment systems must be reliable and, preferably, simple. In order to exert effective control and overcome some of the present limitations of the UASB process it will be necessary to develop control strategies based on the microbiology of granulation.
Investigations into the microbiology of non-granular methanogenic communities are technically simpler and, consequently, research into granules has hitherto received less attention. Research effort into the microbiology of granules is now increasing and eight speakers presented results at the Workshop. In addition, several authors presented results in posters. Some of their work is discussed below under the following headings:
Development of granules
Microbial structure of granules
Metabolism within granules
Development of granules
Papers were presented dealing with UASB granules and the floes which are produced in anaerobic gas lift (AGL) reactors. True granules contain inorganic material and, because wastewaters generally contain inorganic particulate matter, the initial events in granulation appear to involve attachment of cells to surfaces. Granulation is, however, undoubtedly a complex process which will include individually recognisable steps such as attachment to inert material, elaboration of structures which secure the granular integrity and floe formation. The microorganisms within a
107

granule grow (with repercussions on intra-granular s t ruc ture) , granules fragment and w i l l be subject to changes in microbial content enforced by a l terat ions in wastewater composition.
S tud ies of f l oe format ion in AGL reactors were reported by Mulder, Zoutberg and, under Technological Aspects, by Beeft ink. This reactor design c lear ly gives a rapid accumulation of f locculant biomass which can reach very high densi t ies. The system is amenable to study the factors which are important in f loe formation and the effects of f loe formation on metabolism. The events involved in f loe formation in AGL reactors are, however, probably not identical to the i n i t i a l stages of granulation where attachment of ce l ls to inorganic matter is probably most s ign i f i can t .
Systems are being developed to f a c i l i t a t e study of the i n i t i a l events in granulation and were discussed by Schink, Dubourguier, Grotenhuis, K i s s e l , Prensier and Gorr is. Factors under invest igat ion include the microbial species of par t icu lar importance, the nature of the inorganic mater ia l , granule-inducing substrates and the operating conditions of the reactors (discussed under Technological Aspects). There is considerable overlap in t h i s work with studies of b io f i lm formation and there is a substantial relevant l i t e ra tu re on attachment of ce l ls to surfaces. In wastewater t rea tment , s tud ies w i l l need to focus on the types of inorganic material present in a given waste, the major organic components and the most s ign i f i cant species involved in i n i t i a l attachment. There is unl ikely to be one set of rules for optimising granulation in the treatment of a l l wastewaters. Nonetheless, factors may well emerge which can be exploited in the control of granulat ion. Methods were presented in the Workshop for probing the inorganic content of developing granules, f o r l abe l l i ng par t icu lar species and for enabling the a c t i v i t i e s of individual t rophic groups to be estimated - a l l techniques which are necessary in the invest igat ion of granulat ion.
No conclus ions were reached on the nature o_r r o le of e x t r a c e l l u l a r polymers which may s tab i l i se developing granules. Th« level of ex t race l lu lar polysaccharide was, found to> be only 1-2% (by weigfit) in granules (Dubourguier) in contrast to approximately 30% in f loes of Clostr idium acetobutylicum (Zoutberg). The role of other polymers acting
"äs non-specific ' g l u e ' , or speci f ic interact ions between microbial species, remains to be' investigated althoi/ghj.some - in i t iè l studies of events in f loe formation were presented»by Mulder.
Selection for closely associating mutual ist ic cocultures may occur because of t he i r metabolje advantage pver f reely suspended, and therefore physical ly more d is tant , cocultures. This phenomenon, which i s discussed more f u l l y below, could provide a natura l mechanism for favour ing granulation of mutual ist ic cocultures. Selection on th is basis would be more pronounced in the degradation of the energet ical ly least favourable sustrates (e .g . propionate) and is a mechanism of granulation deserving de ta i l ed invest igat ion. Positive selection" for granulation by washing out f reely suspended ce l l s was discussed in the Technological Aspects of the Workshop.
Microbial s tructure of granules
Study of the microbial composition of granules has been made possible by improvements in the methods for preservation of the granular structure
108

for electron microscopy and in the a b i l i t y to label par t icu lar species of bacter ia . Papers were presented by Dubourguier and Prensier describing the electron microscopy of t h in sections of granules and immuno-gold l a b e l l i n g of bacter ia. The types of bacteria recognised are l imited by the range of avai lable antisera but they were able to recognise species of par t icu lar i n te res t : acetotrophic and hydrogenotrophic methanogens, Syntrophobacter and Syntrophomonas.
Microcolonies were detected wi th in the granules examined; e .g. microcolonies responsible for propionate degradation by mutual ist ic associations of Syntrophobacter and Methanobrevibacter. Syntrophomonas was also detected in microcolonies ei ther seemingly unassociated or in associat ion with Methanobrevibacter or Methanospi ri11 urn. Although Syntrophobacter wo l in i i was o r ig ina l l y isolated in coculture with Methanospiri 1 lum hungatei (Boone & Bryant, 1980) i t was la ter predicted tha t a Methanobrevibacter sp. might be a more favoured partner (Archer & Powell, 1985). Tri t ï ï i propionate-degrading enrichments described by Grotenhuis and Houwen the major hydrogenotrophic methanogen was Methanobrevibacter a rbor iph i lus.
The average ra t io of the number of hydrogenotrophic methanogens to the number of Syntrophobacter in microcolonies w i t h i n granules from an i n d u s t r i a l digester was reported by Dubourguier to be 2.3. In contrast, the equivalent ra t io of methanogens to Syntrophomonas was 0.5. According to the model of Powell (1985) such rat ios are character ist ic of the pa r t i cu la r cocultures and determined by the re la t ive growth and pYoduct y i e l d s of member species. That the ra t io with Syntrophobacter is higher than t h a t w i th Syntrophomonas is q u a l i t a t i v e l y in accord w i th the p red ic t ion of the model and i t is to be hoped that continued modelling and experimentation w i l l lead to the formulation of predict ive quant i ta t ive models of mutual ist ic interact ions and, indeed, granulat ion.
The average distance measured between Syntrophobacter and Methanobrevibacter was less than lOOnm. I f , as predicted from conventional thermodynamic considerations, a .concentration of hydrogen equivalent to a par t ia l pressure between 10" and 10" atmospheres is required for propionate degradation, an average of less than one molecule of dissolved hydrogen w i l l be present in the volume between the two mutual ist ic partners. Serious doubts must then be raised about the va l i d i t y of applying conventional gas laws and chemical k inet ics to the m u t u a l i s t i c i n t e r a c t i o n and i t must be concluded t ha t much less i s known, than was previously thought, about mutualism. Cer ta in ly , much of the hydrogen f lux may not be avai lable for measurement (Conrad et a l . , 1985). Hydrogen f lux and properties of the mutual ist ic partners at the enzymic level then become overidingly s i gn i f i can t , supporting the case f o r more fundamental biochemical studies. A potential re lat ionship between the e f f ic iency of propionate degradation and the average distance between the mutual ist ic partners was discussed by Schink and deserves further invest igat ion.
Lyt ic phage were detected by Prensier in microcolonies of Methanothrix in g ranules. I t is too early to predict any technological consequences of l y t i c phage although i t was the view of Zehnder that the implications could be serious i f a r t i f i c i a l l y - cons t ruc ted populations of bacter ia, .rather than the possibly more robust natural populations, were employed in wastewater treatment.
109

Metabolism wi th in granules
Methods for measurement of a c t i v i t i e s of individual trophic groups were discussed by Dubourguier. There is a need for development of simple and r e l i a b l e a c t i v i t y tests which are economical on labour. As discussed by Schink there is potent ial for anaerobic degradation of a wide range of organic compounds and the degradation of propionate, because of i t s importance in anaerobic digestion (Gujer & Zehnder, 1983), was discussed i n d e t a i l by Schink and Houwen. The bulk of the data concerning degradative mechanisms has, however, been obtained in non-granular systems and the potential for novel routes in granules has not yet been seriously addressed. Refinement of methods for invest igat ing metabolism wi th in granules w i l l be required. More fundamental studies are needed for measurement of specif ic a c t i v i t i e s , speci f ic growth rates, growth y ie lds and saturation constants (and, indeed, the meaning of saturation constants for mutual ist ic cocultures must be assessed"). Such information is requi red in the formulation of determinist ic models. Methods must be developed for i den t i f i ca t ion and quant i f icat ion of species (e .g . using serological probes) and probes developed for the measurement of metabolite fluxes wi th in granules. Not a l l the necessary tools for i nves t iga t ing metabolism wi th in granules are avai lable but i t is not sat is factory to make predictions from knowledge of non-granular systems.
Summary
Although the UASB process is already a technological success microbiological studies of granulation can be expected to be exploited in the wider application and control of the process. Further description of the microbiology of granules, e.g. in terms of species present, is required but as methods develop it will become more realistic to investigate organisation and interactions between species within granules. The organisational structure within granules may necessitate a réévaluation of present views on degradati ve-mechanisms and metabolic interactions between mutualistic organisms. Direct measurement .of the flux of metabolites between organisms fs necessary and fundamental studies of enzymes involved in hydrogen evolution ««d utilisation should be encouraged. Initiation and stabilisation of granules is an importait area for future research .effort. The role of inorganic material and cell attachment must be clearly establi shed. >• jjhe physical b^asis of interactions between organisms, . wtiich ., mjght include specific recognition sites on some species* also requires investigation. The information obtained must then be assessed and the means by which it can be exploited in the control °f tne UASB process determined. We must not lose sight, however, of the need for ä reliable, but preferably simple, wastewater treatment process.
Acknowledgements
I am grateful to all participants at the Workshop who contributed either by presenting papers or in discussions during and after the sessions. I would like to thank Alex Zehnder for his help in producing this report and to thank my colleague Godfrey Powell for many helpful discussions.
References
Archer, D.B. & G.E. Powell 1985. Dependence of the specif ic growth rate of methanogenic mutual ist ic cocultures on the methanogen. Archives of Microbiology 141, 133-137.
Boone, D.R. & M.P. Bryant 1980. Propionate-degrading bacterium, Syntrophobacter wo l in i i sp. nov. gen. nov., from methanogenic ecosystems. Applied and Environmental Microbiology 40, 626-632.
Conrad, R., T .J . Phelps & J.G. Zeikus 1985. Gas metabolism evidence in support of the juxtaposi t ion of hydrogen-producing and methanogenic bacter ia in sewage sludge and lake sediments. Applied and Environmental Microbiology 50, 595-601.
Gujer, W. and A.J.B. Zehnder 1983. Conversion processes in anaerobic d igest ion. Water Science and Technology 15, 127-167.
Powel l , G.E. 1985. Stable coexistence of syntrophic associations in continuous cu l ture. Journal of Chemical Technology and Biotechnology 35B, 46-50.

Technological aspects
113

IMMOBILIZATION OF ANAEROBIC BIOMASS
M.S. Switzenbaum, J.P. Robins, and R.F. Hickey
Environental Eng. Program, C E . Dept., UMASS/Amherst 01003 USA
Summary This paper reviews the applied aspects of startup of anaerobic fixed
film processes. This includes environmental and process conditions, inocula, support surface, support surface conditioning, and external factors . Keywords: methane fermentation, anaerobic digestion, biofilms, fixed films, wastewater treatment.
Introduction
A reasonable working hypothesis for the interactions between microorganisms and surfaces according to Atkinson & Davies (1972) suggests that any surface in contact with a nutrient medium which contains suspended microorganisms will in time become biologically active due to the adhesion of microorganisms. Sanitary Engineers have long made use of this r
principle for treating wastewater in fixed film reactors. As early as 1865 Dr. Alexander Mueller demonstrated that sewage could be purified by living organisms in a filtration column (Peters & Alleman, 1982).
There exists a large basis of scientific literature on the mechanisms of microbial attachment onto surfaces (Ho, 1986; Fletcher, 1987). In addition, the immobilization of specific whole cells to carriers is a well developed commercial process (Crueger & Crueger, 1984). For example the production of fructose from glucose is carried out using gluteraldehyde to cross-link cell suspensions of B. coagulans. However such technology is considered to be too expensive for most wastewater treatment applications, especially in light of the fact that bacteria will form biofilms and floc-culant pellets or granules, given time.
Most of the applied research which has taken place in the area of bacterial attachment has involved biofilm fouling and its prevention; places where biofilms cause more harm than good (i.e. heat exchangers, ship hulls, pathogenicity on tissues, teeth). Relatively little information exists for these mechanisms under anaerobic (wastewater treatment) conditions. There has been a resurgance of interest in anaerobic processes in the recent past, primarily related to the new generation of fixed-film processes (Speece, 1983; Switzenbaum, 1983). The status of our understanding of starting-up anaerobic fixed film reactors, however, remains experimental (empirical) rather than scientific (rational) as has been noted (Salkinoja-Salonen et al.,1983). In this paper the authors will review the applied aspects of start up of anaerobic fixed film reactors (mainly filters and expanded/fluidized beds) including some data based on their experiences. We shall deal mainly with the establishment of mature biofilms, which are necessary for wastewater treatment. The theoretical aspects of bacterial attachment will be covered in other papers of this conference, as will UASB reactor startup.
Fundamental Concepts
1 15

As was stated previously, there exits a large amount of scientific literature on the mechanisms of microbial attachment onto surfaces. This literature covers many disciplines including medicine, dental science, and marine science as well as environmental science and engineering. As this paper stresses the applied aspects of anaerobic fixed film reactor startup, this section will only highlight some fundamental information.
The Pattern of Biofilm Development
The development of biofilms has been reviewed by several authors( Characklis, 1982; Ellwood, 1979; Savage & Fletcher, 1985). Numerous processes are involved in the development of a mature biofilm on a support surface. These processes have been postulated to occur sequentially by Trulear & Characklis (1982):
1. Transport and adsorption of organic molecules to the surface 2. Transport of microbial cells to the surface 3. Microorganism attachment to the surface 1. Microbial transformations (growth and exopolymer production) at
the surface resulting in the production of biofilm, and 5. Partial detachment of biofilm, at a rate approximately equal to
growth and additional attachement (steady state). The first three processes listed above occur relatively quickly (hours). Unfortunately in anaerobic systems the fourth process, growth, occurs rather slowly.
Practically speaking, biofilm formation can be reduced to two key steps; 1) attachemnat of the microbes to the surface, and 2) the subsequent growth of the attached biota to a mature film.
Microorganisms are transported to the surface either by turbulent flow conditions, diffusion, or Chemotaxis . Once in close proximity to the surface, the organism will experience a net attractive force at a particular distance due to forces theorized in the VODL theory. The attractive force will tend to hold the organism cLose to the surface. In this location, the organism can then use its smaller diameter appendages, pili, flagella, fibriae, and most likely,£he glycocalyx polymers, to'stick to the surface. Bacteria that have attached successfjüly, produce additional exopolymers to strengthen their attachment and reproduce causing .* the biofilm to grow. In time a mature or steady-state biofilm is formed where the amount of biofilm lost is equal to th| amount produoted. The attachment of additional bacteria is most lively negligible by this point in time.
There are a number of causes for biofilm detachment: shear stress, nutrient or oxygen (in the case of aerob,ic systems) depletion, cell death or mechanical abrasion. .'v
Factors Affecting Biofilm Development
The attachment of microorganisms to a solid surface is a complex process and is influenced by many factors including those of the organism, support surface, and surrounding environment. Daniels (1980) listed the significant parameters affecting the adsorption of microorganisms to solid surfaces, as is shown in Table 1. Several of these parameters have been investigated for anaerobic systems and will be discussed in the next part of this paper.
16

Table 1. Parameters Affecting the Adsorption of Microoganisms to Solid Surfaces. (after Daniels, 1980)
1. Character of microorganism a) Species b) Cul ture Medium c) Cul ture Age d) Concentration
2. Character of 'adsorbent a) Type b) Ionic Form (ion exchange resin) c) Particle Size d) Cross-linkage (ion exchange resin) e) Concentration
3. Character of the environment a) Hydrogen Ion Concentration b) Inorganic Salt Concentration c) Organic Compounds d) Agitation e) Time of Contact f) Temperature
17

Applied Aspeets
Methods for the Reduction of Anaerobic Fixed Film Reactor Startup and the Enhancement of Anaerobic Microbial Attachment.
It has previously been discussed that the startup of anaerobic fixed film reactors may require a long and unpredictable period of time (Salkinoja-Salonen et al., 1983). In the recent past much research has been carried out to investigate various strategies to reduce anaerobic fixed film reactor startup time. These may be categorized into two broad areas (which are not mutually exclusive): 1) those means which optimize anaerobic growth and biofilm development through environmental controls (i.e., organic loading and inoculum, substrate and nutritional enrichment, temperature, and pH controls) and 2) those means which enhance anaerobic attachment and growth through process controls (i.e., support media variation and support media precoating). Some of these strategies are discussed below.
Anaerobic Environmental Control.
From the point of view of energy metabolism, optimum environmental conditions should be maintained in order to achieve rapid attachment and development of a stable, mature biofilm in anaerobic fixed film reactors. Recent advances in the fundamental aspects of methane fermentation processes (i.e. nutrition, toxics, etc.) have helped to better define appropriate startup and operating conditions. Examples include the importance of trace metals such as iron, nickel, cobalt, and the influence of sulfides (Barford, 1987).
In terms of optimum conditions, the temperature during the startup period should be kept constant. A temperature of 35 degrees C is approximately where maximum growth rates for mesophilic systems occur, but it is not always attainable or practical for full scale systems. The pH of the reactor medium should be maintained as close to neutrality as possible. The latter may require the addition of alkalinity to prevent significant pH depression due to th,e oven production of volatile organic acids by the acid-forming bacteria. Should a rçar.ticiAar waste be deficient in the nutrients required for anaerobic growth, it may be necessary^ to supplement the waste stream with those which are deficient. For example, Kelly and Switzenbaum (1984) were not ab'le^o establish a mature biofilm in an anaerobic fluidized bed reactor Creating whey until Ni, Co, and Fe salts were added to the feed. Although öür knowledge of nutritional requirements of methanogens is now better defined (Barford, 1987) it is still incomplete. . ,
Several methods to reduce startup times for anaerobic fixed film reactors through environmental means have been reported. Initial use of low organic reactor loading rates with gradual increases to the operating reactor loading was cited as beneficial for start-up (Bull et al•, 1983; De Zeeuw et al., 1982; and Kornegay, 1975). Quite likely this strategy maintained volatile acid production at a minimum and prevented pH depression even for poorly buffered systems. Others researchers have started with synthetic feeds and gradually replaced them with the waste to be treated (Dennis & Jennett, 1974; Lovan & Foree, 1971). Bull et al. (1983), Stephenson and Lester (1986), and Tait and Friedman (1980) reduced startup time by using methanol as initial substrate (then gradually changed to the influent to be treated). This strategy most likely selects for the growth of methanol utilizing methanogens , which may grow faster
118

than acetate utilizers. However it is not clear that these organisms remain after the actual wastes to be treated is introduced to the reactor-
Kennedy and Droste (1984) reported that methanogenic activity decreased with higher organic loading rates during the startup period Whether this is a temporary or permanent phenomenon is not certain.
Seeding of the reactor volume with a rich inoculum of active solids from a working reactor treating a similar waste is highly desirable when available. Such an inoculum offers the advantage of acclimation to components of the waste being treated and also to any toxic or inhibitory compounds which may be present.
Another aspect of seeding is the propensity of organisms for attachment. This is a relatively unknown area of research. Work with aerobic bacteria clearly indicates that some organisms have a greater tendency for attaching than others. Isa et al. (1986) studied the influence of sulfate reduction in anaerobic reactors and found that methane producing bacteria (MPB) were able to colonize and adhere to polyurethane carriers better than sulfate reducing bacteria (SRB) . Thus the MPB were able to outcompete the faster growing SRB by their propensity for attachment. This may be an important observation and reserach along these lines should be encouraged.
Experience has shown that during the startup, especially with unac-climated seeds (which is usually the case) the ratio of feed to seed
(biomass density kept over 20 kg VSS/m ), and the organic loading rate should be kept low (food to microorganism ratio kept less than 0.1 kg COD/kg VSS • d) (Henze & Harremoes, 1983; Salkinoja-Salonen et al •,/ 1983) (where VSS = volatile suspended solids). Salkinoja-Salonen et al_. (1983) suggest a seed inoculum of 30-50 percent of the reactor volume to speed the startup period. Henze and Harremoes (1983) concluded that organic loading rates should be increased by 50 percent per week to design operating levels on each observation of increased gas production.
More recent experimentation by Shapiro and Switzenbaum (1984a, 1984b) investigated the effects of organic space loading (that is mass of organic material applied per volume of reactor) of the reactor bulk liquid and reactor SRT on anaerobic biofilm development. Contrary to earlier research, Shapiro's results indicated that anaerobic biofilm (measured as COD) accumulation increased with increased organic space loading (in a well buffered system). These results are shown in Figures 1a and 1b. Biofilm accumulation rates were also strongly influenced by the VSS concentration of the bulk liquid. This data is shown in Figure 2. The design of this experiment does not allow one to separtate organic loading rate and bulk liquid VSS concentration. In addition, the higher substrate concentrations cause as increase in the growth rate of the organisms allready attached. However, this suggests that a reduction of startup time in anaerobic fixed film reactors might be achieved by maintaining a high organic space loading. High organic space loading provides a large VSS concentration in the bulk liquid during the start-up period and in general it has been shown that an increase in organism concentration results in an increase in the number of bacteria attaching to a surface (Fletcher,1977; Bryers & Characklis,1981 ) .
The physiological state of the organisms as well as their actual number may affect startup time. Data from several aerobic studies imply that log phase organisms attach faster than stationary phase organisms which attach faster than death phase organisms (Fletcher, 1977; Marshall et al., 1,971). Loosdrecht et al. (1987) observed that cell surface characteristics determining adhesion are influenced by growth conditions. They noted

5 DAY SRT (Bulk Liquid) 1 400 - i Blofllm Aooumulallon
Organic Spac* Loading
1 OO —i Blofllm Accumulation
TIME (doy>)
TIME (daya)
ZO 2 S
20 23
SRT (Bulk Liquid) -e— S DAY •M-- 1 S DAY
•0 8 0
0 6 0 U
"i T O 1.0 2.0
Organic Spac« Loading (kg C O D / m 3 /day)
r 3.0
T 4.0
Figure lb. Initial rates of anaerobic biofilm accumulation vs bulk organic space loading rate.
Figure la. Anaerobic biofilm accumulation at 5 day SRT (top) and 15 day * SRT (bottom) and four organic space loadings for a 25 day period.
100—1 Blofllm Accumulation
SRT (Bulk Liquid) -B— 5 DAY •K-- 15 DAY
1000 2000 VSS ( m g / l )
Figure 2. Initial rates of anaerobic biofilm accumulation vs bulk liquid volatile suspended solids concentration.
20

that bacteria become more hydrophobic during the exponential phase of growth.
A carefully controlled study by Robins and Switzenbaum (1987) found no significant difference in initial anaerobic bacterial counts on a glass slide surface between 8 and 20 day SRT inocula (Figures 3 and 4). Similar bacterial numbers and patterns have been reported by Verrier and Albagnac (1985). The data of Robins and Switzenbaum (1987) confirm that initial organism attachment can occur in a relatively short time. Therefore the slow accumulation of anaerobic biofilms which have been reported are most likely due to the slow growth rates of the methanogens.
The role of recirculation may be important as it relates to organic loading, VSS, volatile acid accumulation, and pH depression. However, Duff and Kennedy (1983) reported that recirculation ratio did not affect the startup period, although higher loading rates could be used at higher rates of effluent recycle.
Support Media Variation
The propensity of microorganisms to attach to solid surfaces may vary significantly depending on the type of material used. For this reason, the use of a material to which methanogenic and anaerobic bacteria have a high affinity for adsorption may prove favorable for the construction of fixed film reactors by significantly reducing the startup period. The cost and durability of the material however also needs to be considered.
Since the late 1940's, researchers have attempted to accurately quantify the effects of various support materials on biological attachment. Weiss and Blumenson (1967) were the first to introduce the concepts of wetability, contact angle, and critical surface tension to the field of bioadhesion . Critical surface tension is defined as the intercept of the extrapolated straight line plot (Figure 5 and 6) of cosine 0 versus the vapor/liquid surface tension. It is a characteristic of a solid surface which gives the maximum surface tension of a liquid that will spontaneously spread on the solid surface. Critical surface tension provides information on the nature of the solid itself, since it is a characteristic of the solid only. It is used as a means of empirically ranking solids by their relative surface energies.
The critical surface tension of a material is believed to play an important role on the adsorption of molecular organic films during the first stage of the attachment process (Baier, 1980; Dexter, 1979; Pringle & Fletcher, 1983). The adsorption of a molecular organic film happens nearly instantaneously and the layer which is created has been termed the "conditioning film" (Dexter,1979). It has been suggested that the role of the conditioning film is to make the surface more suitable for biological attachment, thus encouraging primary biofilm formation (Corpe, 1970; Dexter, 1979; Marshall, 1972). A dependence of primary biofilm formation rate on the original surface properties of a material has been demonstrated by others (Baier,1980; Dexter , 1976).
Values of critical surface tension are commonly expressed in terms of dynes per centimeter. Typical values range from 18 dynes/cm for a hydrophobic material such as polytetrafluorocthylene (teflon), to 46 dynes/em for glass which is considered hydrophilic (Dexter, 1979). Goupil et al. (1973) found that relatively strong adhesion and biofilm growth was
'exhibited by both very low and high critical surface tension support media, and that minimal bioadhesion was noted in a zone of intermediate
21
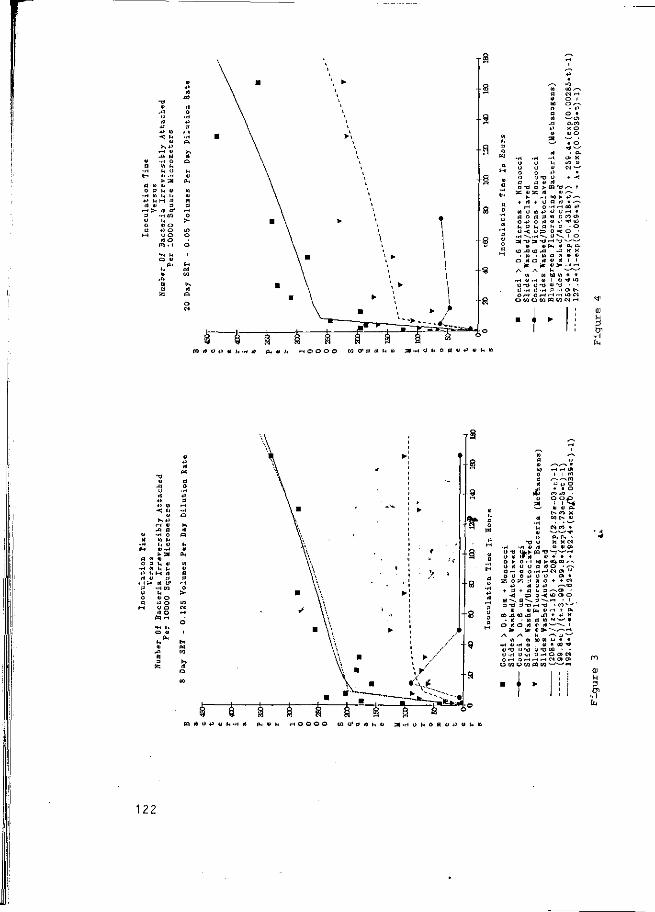
a a v ri OT3 o > m~x> s—* +
55 4i SC ri <u '—
+ rt+udrt«^ ,-1 O "H r-l 00 -P
M U W + i U O i - t « a o a 3 w o r o o > O -P O rt 4 1 - P ^ t Û u a u a u 0 • o U -< U 3 O -< O •
! m . m a m u « i i4 o ri u ri i i
j * j * a> * ^ H
C1J
u
0 fl •H « +> (, ri v
<-* > U 0 a
M
H ri 9
rt cr
I H
4) o •W o o o <fl O
M CO * 41 W N ~ - ^ f +i ft, a , •
- O U X K M • H -H 4> ri « « » u -a uw;» m • t f w - ' ' - « U 4) < l ri 4 1 « « + o >• o i-H M >• « t a s ^ u r t o u a r i O • *-> d «H a o . H H es a u
O U O + J Ü Ü a» * 55 O SC d » O + + W
•P ri u -p , - *<o + d + d u P ^ o •
•< O 0 -< *û OS O B - ^ , a - - ^ a *-~»-i • i 3 T Ï Ö T J H T ) • M w
V V pL| 1) rH + P. ( C 4 ( D J 1 J 3 + U X
• « • w d M « ^ « O ri O ri v ri w ' — i
m • * 4 ) ; * ^ - - ^ / \ / \ h • - * u w
W M bO W <-» » « • H 4) -H 4) 1 « * 00 * * Ü 1 J U t ) « T J » " • U -H U -H 3 'H O » M Oi-H O H H r l C S 0 ) 0 )
u v i u v i n m ^ w , _ ,
• ' i •
•»
m
<P M tn •H
m r t u + > t ) h - H r t O a 4) 43 4) I
122

VAPOR
Figure 5. Schematic diagram of a finite contact angle formed by a sesile drop resting on a solid surface (after Weiss and Blumenson, 1967) .
18 22 26 30
SURFACE TENSION (DYNES/CM)at20cC
.igure 6. Wettability of polytetrafluroethylene by the n-alkanes (after Weiss and Blumenson, 1967) .
123
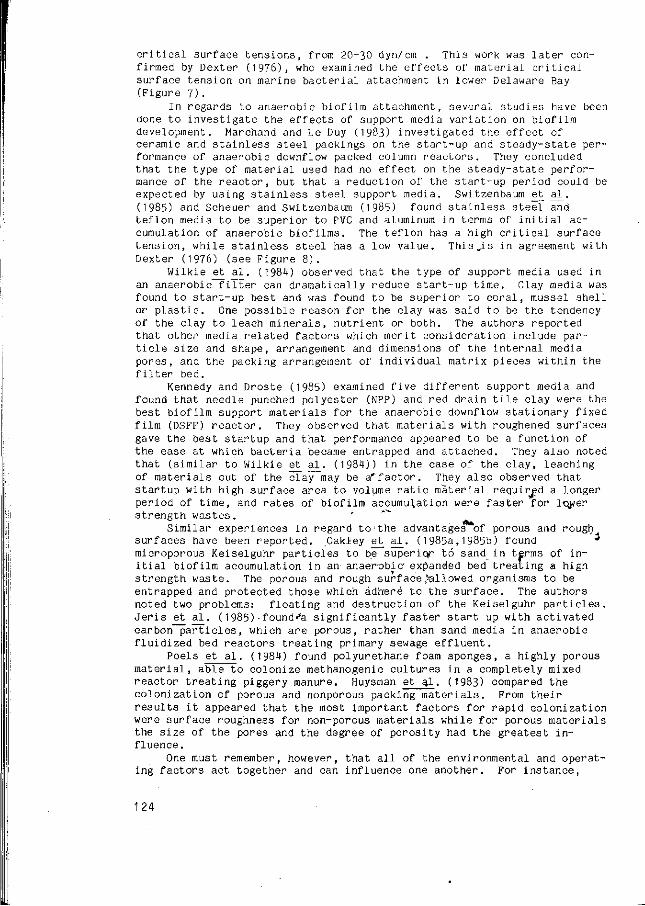
critical surface tensions, from 20~30 dyn/cm . This work was later confirmed by Dexter (1976), who examined the effects of material critical surface tension on marine bacterial attachment in lower Delaware Bay (Figure 7) .
In regards to anaerobic biofilm attachment, several studies have been done to investigate the effects of support media variation on biofilm development. Marchand and Le Duy (1983) investigated the effect of ceramic and stainless steel packings on the start-up and steady-state performance of anaerobic downflow packed column reactors. They concluded that the type of material used had no effect on the steady-state performance of the reactor, but that a reduction of the start-up period could be expected by using stainless steel support media. Switzenbaum et al. (1985) and Scheuer and Switzenbaum (1985) found stainless steel and teflon media to be superior to PVC and aluminum in terms of initial accumulation of anaerobic biofilms. The teflon has a high critical surface tension, while stainless steel has a low value. This „is in agreement with Dexter (1976) (see Figure 8).
Wilkie et al. (1984) observed that the type of support media used in an anaerobic filter can dramatically reduce start-up time. Clay media was found to start-up best and was found to be superior to coral, mussel shell or plastic. One possible reason for the clay was said to be the tendency of the clay to leach minerals, nutrient or both. The authors reported that other media related factors which merit consideration include particle size and shape, arrangement and dimensions of the internal media pores, and the packing arrangement of individual matrix pieces within the filter bed.
Kennedy and Droste (1985) examined five different support media and found that needle punched polyester (NPP) and red drain tile clay were the best biofilm support materials for the anaerobic downflow stationary fixed film (DSFF) reactor. They observed that materials with roughened surfaces gave the best startup and that performance appeared to be a function of the ease at which bacteria became entrapped and attached. They also noted that (similar to Wilkie et al. (1984)) in the case of the clay, leaching of materials out of the cTay~"may be a* factor. They also observed that startup with high surface area to volume ratio material required a longer period of time, and rates of biofilm accumulation were faster for loyer strength wastes.
Similar experiences in regard to1the advantages of porous and rough surfaces have been reported. Oakley et al_. ( 1985a, 1985b) found •* microporous Keiselguhr particles to be superior to sand in terms of initial biofilm accumulation in an anaerobic expanded bed treating a high strength waste. The porous and rough surface allowed organisms to be entrapped and protected those which adhere to the surface. The authors noted two problems: floating and destruction of the Keiselguhr particles. Jeris et al. (1985)-found^a significantly faster start up with activated carbon particles, which are porous, rather than sand media in anaerobic fluidized bed reactors treating primary sewage effluent.
Poels et al. (1984) found polyurethane foam sponges, a highly porous material, able to colonize methanogenic cultures in a completely mixed reactor treating piggery manure. Huysman et al. (1983) compared the colonization of porous and nonporous packing materials. From their results it appeared that the most important factors for rapid colonization were surface roughness for non-porous materials while for porous materials the size of the pores and the degree of porosity had the greatest influence.
One must remember, however, that all of the environmental and operating factors act together and can influence one another. For instance,
24

u
Z> Z
<
X
104
1000
100 -
z g U-
•
Z
o LL.
Q -
Ll_
• 1
Jg
LU
2
X
>3
O Û_
• 1
^>„iw«"---"
<
• 25 35 45
CRITICAL SURFACE TENSION, * L S
DYNES/CM
Figure 7. Number of attached bacteria vs media critical surface tension for exposure of 24 hours in lower Delaware Bay (after Dexter, 1976).
DAYS
Figure 8. Anaerobic biofilm accumulation on various support surfaces over a five day period.
25

there appears to be interaction between surfaces and reactor hydraulics. DeVocht et al. (1983) observed that different mechanistic influences selected"or-different methanogenic associations. Methanogenic rods were found dominating a sedimentation type system (granules), while methanogenic cocci dominated in an adhesion type system (fixed film). Switzenbaum's (1986) electron microscopy study comparing biofilm development in three reactor types found relatively more sarcina in the high shear anaerobic fluidized bed than the low shear anaerobic filter and anaerobic upflow sludge blanket reactor. In the latter two reactors, rod type organisms were more numerous than sarcina.
In general then, in terms of initial biofilm development, rough sut— face nonporous materials and porous materials are preferred. For the porous materials, the size of the pores and the degree of porosity are most important. Of course, the choice of support surface must also consider cost and durability of materials.
Support Media Precoating
Support media precoating is a novel, although not necessarily new, process control for enhancing microbial attachment in fixed film reactors. There has been no literature to date dealing with the subject of support media precoating in anaerobic processes, however several researchers have investigated this technique in aerobic systems (Corpe,1970; LaMotta & Hickey, 1982). It has been suggested that support media precoating may prove favorable in reducing anaerobic fixed film reactor start-up (Henze & Harremoes, 1983; LaMotta & Hickey, 1980) .
As stated previously, the second phase of the attachment process is characterized by the production of extracellular polysaccarides by the adsorbed bacteria. Corpe (1970), in his work with marine bacteria, was able to isolate and purify these polysaccharides. He smeared some of the recovered polymer on glass slides and allowed them to air dry. After three days he submerged them along with clear slides into both natural and artificial seawater. In both cases the presence^of polymer significantly enhanced attachment. ( * .
Torteson and Corpe (1975) repeatedr~*the 'same experiment for algal cells . The polymer of the marine pseudomonad causent'algal attachment. If the polymer was added to a suspended culture of algae, it caused the'3 cells to clump or aggregate. ; , ' . ' ' t
Since it is apparent that attachment is Controlled to a fairly large extent by surface properties of the support me#ia, it follows that the surface properties of the substratum 'surface may be altered via the application of a surface modifier such as chemical polymer. Because of the many adsorptive sites, polymers are virtually insensitive to variations on localized surface conditions. Polymers may extend adsorption sites out various distances from the substratum, thereby increasing the chance for bacterial attachment.
La Motta and Hickey (1982) investigated the effect of support surface precoating (with various water and wastewater treatment polymers) on the attachment of aerobic mixed and nitrifying bacterial cultures treating domestic wastewater. Precoating the support surfaces with synthetic cat-ionic polymers was found to significantly enhance the initial biofilm accumulation. In the case of nitrifying bacteria, no nitrification was observed during six days in the control chamber, while a low level of nitrification could be observed as early as one day in the precoated chamber. Switzenbaum et al. (1985) investigated the effect of six different polymers for precoating surface to reduce anaerobic reactor start up.
126

However, the various polymers tested did not appear to enhance the rate of initial biofilm accumulation.
Besides precoating support media with natural and synthetic polymers, precoating support media with aerobic or denitrifying biofilms may promote faster anaerobic biofilm attachment. This technique may in fact be preferable because of the possible toxic effect of synthetic polymers on anaerobic growth. It may also be difficult to keep water soluble polymers from dissolving into the bulk liquid after the support surface has been subjected to the anaerobic slurry. Since aerobic and denitrifying bacteria metabolize much faster than anaerobes, they can quickly produce a matrix of polymers which anaerobes may adhere to during the startup process. Aerobic and denitrifying fluidized beds have been reported to develop mature biofilms within days (Jeris et al. 1977) •
Anaerobic fixed film processes are amenable to precoating with denitrifying biofilms. Once treatment begins it is relatively easy to add nitrate salt and inoculum to the reactor. After a few days of operation in this denitrifying mode, the procedure can be halted and the reactor seeded with anaerobic culture.
This concept was tested (Scheuer & Switzenbaum,1985; Switzenbaum et_ al.1985) in lab seals batch fixed films reactors, but was not found to help enhance methanogenic biofilm development. However, Owens et al. (1980) found this strategy to be sucessful in starting up a full scale anaerobic fluidized bed treating a softdrink bottling wastewater. This was of course not a static reactor, but a continuous flow system with more shear. '
Ext ernal Factors
Much of the research on anaerobic reactor startup has been done on lab scale and pilot scale reactors as well as test tube experiments. Very little information is available on full scale startup. While the basic information learned from the lab and pilot studies is useful, care must be taken in using this knowledge for full scale systems.
Barford (1987) pointed out that it is somewhat difficult to generalize with respect to startup and stability of anaerobic digestion since a large number of external factor contribute to the final design of a reactor and its likelihood to result in a stable startup and operation. Lettinga et al. (1983) characterized some of these external factors such as characteristics of the wastewater, local factors, environmental restrictions, etc. Barford (1987) also noted sucessful startup and operation are integrated in overall reactor development including waste evaluation, laboratory and/or pilot scale assessment, and advanced engineering design (including a high level of instrumentation). Factors such as flow distribution, material characteristics and size, and waste strength, composition and variability will obviously influence startup.
Summary and Conclusion
Much progress has been made in the basic micrbiology and biochemistry of the anaerobic methane fermentation process over the recent past. This has helped practitioners to better startup of these reactor by allowing them to establish better environmental conditions. However, our knowledge o/ startup remains more empirical (experimental) than rational.
While there are different support surfaces and various loading, inocula and environmental strategies which may allow faster film development, the same feature that is one of the major attactive features
127

of methanagenic systems, the slow growth rate of the methanogenie organisms (which results in low cellular yields) will usually control and imit rapid startup. Nonetheless, when startup is done carefully, with a good inoculum, with proper environmental conditions, and as part of an integrated strategy of waste evaluation, laboratory and/or pilot scale assessment and good engineering design, it should not be a major problem. Startup should not be an obstacle to further implementation of anaerobic waste treatment technolgy. When one thinks of a typical 20 year life cycle for a facility, startup even if it takes 3~4 months is not a long time.
Acknowledgements The authors would like to thank students in University of
Massachusetts Environmental Engineering Program who haye worked on anaerobic attachment studies. They include Mike Shapiro, Kurt Kallmeyer, Kevin Scheuer, Kevin Sheehan, and Dan Wagner. Funding for these projects was provided by the US Department of Energy and the Massachusetts Division of Water Pollution Control.
The senior author would like to thank Dr. John Barford of the University of Sydney for his valuable insight while we were preparing this manuscript. Finally we would like to thank Ms. Jodi Tompkins for typing this manuscript.
References' 1. Atkinson, B. and Davies, I. J. (1972) The complete mixed microbial
film fermenter: A method of overcoming washout in continuous fermentation, Transactions Instn Chem. Engr. 50:208.
2. Baier, R. E. (1980) Substrate influences on adhesion of microorganisms and their resultant new surface properties. In: Adhesion of Microorganisms to Surfaces. Britton, G. and Marshall, K. C. (Eds) John Wiley and Sons, Inc. New York, N.Y. p. 59-101
3. Barford, J. P. (1987) Startup, dynamics and control of anaerobic digesters, In: Handbook of Anaerobic Fermentation, Eriickson, L. E. and Fung, D. Y. C. (Eds) Marcel, Dekker.
4. Bryers, J. P. and Characklis,' W. H".*(198l) Early fouling formation in a turbulent flow system: overall kinetics, Wa\er Research, 15:483-491. ' '4
5. Bull, M. A., Steritt; R. M., and. Lester', tJ.'W. (1983) AIJ, evaluation of four startup regimes for anaerobic flufdized bed reactor's, Biotechnology Letters, 5:333. ' ' ''• '
6. Characklis, W. G. (1982) Fouling b'iof'ilm development: A process analysis, Biotechnology Bioengineering, 23:1923-1960.
7. Corpe, W. A. (1970) A'n acidic polysaccharide produced by a primary film forming marine bacterium, Development Microbiology, 2:402.
8. Crueger, W. and Crueger, A (1984) Biotechnology: A textbook of Industrial Microbiology, Sinauer Associates, Sunderland, MA
9. Daniels, S. L. (1980) Mechanisms involved in sorption of microorganisms to solid surfaces, in Adsorption of microorganisms to Surfaces, Bitton, G. and Marshall, K. C. (Eds), John Wiley and Sons, Inc., N.Y., p. 7~58.
10. Dennis, N. D. and Jennett, J. C. (1974) Parmaceutical waste treatment with an anaerobic filter, Proceedings Purdue Industrial Waste Conf, 29:36, Ann Arbor Science, Ann Arbor, Michigan.
11. Dexter, S. C. (1976) In: Proceedings of the 4th International Congress on Marine Corrosion and Fouling, p. 137, Jaun-Les-Pais, Antibes, France.

12. Dexter, S. C. (1979) Influence of substratum critical surface tension on bacterial adhesion - in situ studies, Journal of Colloid and Interface Science, 70:2.
13- Duff, S. J. B. and Kennedy, K. J. (1983) Effect of effluent recirculation on start-up and steady state operation of the downflow stationary fixed-film (DSFF) reactor, Biotechnology Letters, 5:317-320.
14. Ellwood, D. C , Melling, J. and Rutter, p. (1979) Adhesion of Microorganisms to Surfaces, Academic Press, London.
15. Fletcher, M. (1977), The effects of culture concentration, age, time and temperature on bacterial attachment to polystyrine, Canadian Journal of Microbiology, 23:1-6.
16. Fletcher, M. (1987) How do bacteria attach to solid surfaces, Microbiolgical Sciences, 4:133.
17. Goupil, D. W., DePalma, V. A. and Baier, R. E. (1973) Prospects for nontoxic fouling resistance paints, In: Proceedings of the 9th Annual Conf. on Marine Tech. Soc., Washington, D.C., p. 445.
18. Henze, M. and Harremoes, P. L. (1983) Anaerobic treatment of wastewater in fixed-film reactors, Water Science and Technology, 15:No. 8/9, 1-101 .
19. Ho, C. S. (1986) An understanding of the forces in the adhesion of microorganisms to surfaces, Process Biochemistry, 21:148-152.
20. Huysman, P., Meenen, P. van, Assche, P. van, and Verstraete, W. (1983) Factors affecting the colonization of nonporous and porous packing materials in model upflow methane reactors, Biotechnplogy Letters, 5:643-648.
21. Isa, Z., Grusenmeyer, S. and Verstraete, W. (1986) Sulfate reduction relative to methane production in high rate anaerobic digestion: microbiological aspects, Applied and Environmental Microbiology, 51 :580-587.
22. Jeris, J. S. Ehlers, R. and Witkowski , P. (1985) Anaerobic treatment of municipal wastewater using the biological fluidized bed, paper presented at the Seminar/Workshop Anaerobic Treatment of Sewage, UMass/Amherst.
23. Jeris, J. S. Owens, R.W. andHickey, R. F. (1977) Biological fluidized bed treatment for BOD and nitrogen removal, Journal Water Pollution Control Federation, 49:816.
24. Kelly, C. R. and Switzenbaum, M. S (1984) Anaerobic treatment: temperature and nutrient effects, Agricultural Wastes, 10:135.
25. Kennedy, M. and Droste (1985) Startup of anaerobic downflow stationary fixed film (DSFF) reactor, Biotechnology and Bioengineering, 27:1152-1165.
26. Kornigay, B. H. (1975) Modelling and simulation of fixed-film biological reactors for carbonaceous waste treatment, In: Mathematical Modelling for Water Pollution Control Processes, T. M. Keinath and M. Wanielsta, (Eds.), Ann Arbor Science, Ann Arbor, Mich, 271 .
27. La Motta, E. J. and Hickey, R. F. (1980) Factors affecting attachment and development of biological films on solid media, In Proc. National Symposium on RBC Technology, Wu, Y.(Ed) University of Pittsburg p. 803-828.
28. La Motta, E. J. and Hickey, R. F. (1982) Effect of polyelectrolytes on biofilm growth, Journal of the Env. Eng. Div. Proc Am Soc. Civil Engineers, 108:1326-1341.
29. Lettinga, G., Hobma, S. W. Hulshoff Pol, L. W. Zeeuw, W. de, Jeng, P. de., Grin, P. and Roersma, R. (1983) Design, operation and economy
I29

of anaerobic treatment, Water Science and Technology, 15:No 8/9~ ,177-195.
30. Loosdrecht, M. C. M. van, Lyklema, J. Norde, W. Schraa, G. and Zehnder A. J. B. (1987) The role of bacterial cell wall hydrophobic!ty in adhesion, Applied and Environmental Microbiology, 53:1893.
31. Lovan, C. R. and Force, E. G. (1971) The anaerobic filter for the treatment of brewery press liquor waste, Proc. Purdue Industrial Waste Conf ., 20:1074.
32. Marchand, A. and Le Duy, A. (1983) Anaerobic digestion of Spirulina maxima algal biomass in packed columns: start up, paper presented at the 3rd Int. Symp. on Anaerobic Digestion, Boston, MA.
33. Marshall, K. C. (1972) Mechanism of adhesion of marine bacteria to surfaces, in Proc. of the 3rd International Congress on Marine Corrosion and Fouling, p. 625-632.
34. Marshall, K. C , Stout, R. and Mitchell, R. (197D Mechanism of the initial events in the sorption of marine bacteria to surfaces, Journal of General Microbiology, 68:337-318.
35. Oakley, D. L., Forster, C. F. and Wase, D. A. J. (1985a) Bacterial attachment in relation to the operation of an anaerobic expanded bed, Paper presented at Advances in Fermentation Conference, London.
36. Oakley, D. L., Wase, D. A. J. and Forster, C. F. (1985 b) Development of biofilm in an anaerobic expanded bed reactor, Paper presented at Trans. Inst. Chem Engineers Conference, London.
37. Owens, R. W. Hickey, R. F. Jeris, J. S. and Mascitelli, S. (1980) personal communication.
38. Peters, R. W. and Alleman, J. E. (1982) The history of fixed film wastewater treatment systems, Proceedings 1st International Conf. on Fixed Film Biological Processes, Wu, Y. C. et al. (Eds) University of Pittsburg.
39. Poels, J. and Assche, P. van, and" Verstraete, W. (1984) High rate anaerobic digestion of piggery manure with~polyurethane,sponges as a support material, Biotechnology Letters, 6:747-752.
40. Pringle, J. H. and Fletcher, M. (19B3) Influence of substratum wettability on attachment of freshwater bacteria*to solid surfaces, Applied and Environmental Microbiology, 45:811. '1
41. Robins, J. P. and Switzenbaum, M, S. (198?) Attachment and early biofilm development of methane forming microbial "cultures, , Massachusetts Division of Water-Pollution Control Report No. Env. E. 94-87-2, Dept. of Civil Engineering, UMass/Amherst.
42. Salkinoja-Salonen, M. Nyns, E. J., Sutton, P. M. and Berg, L. van and Wheatly, A. D. (198*5) Startup of .an anaerobic fixed film reactor, Water Science and Technology, 15:No.8/9, 305.
43. Savage, D. W. and Fletcher, M. (Eds) (1985) Bacterial Adhesion, Plenum Press, London.
44. Scheuer, K. C. and Switzenbaum, M. S. (1985) Effects of support media and media precoating on anaerobic blofil.m development, Massachusetts Division of Water Pollution Control, Report No. Env. E. 87-85-4, Dept. of Civil Engineering, UMass/Amherst.
45. Shapiro, M. and Switzenbaum, M. S. (1984 a) Initial anaerobic biofilm development, Argonne National Lab, Report No. Env. E. 83-84-1, Dept. of Civil Engineering, UMass/Amherst.
46. Shapiro, M. and Switzenbaum, M. S. (1984 b) Initial anaerobic biofilm development, Biotechnology Letters, 6:729-734.
130

47. Speece, R. E. (1983) Anaerobic biotechnology for industrial wastewater treatment, Environmental Science and Technology, 17:41 6A-427A.
48. Stephenson, T., and Lester, J. N. (1986) Evaluation of startup and operation of four anaerobic processes treating a synthetic meat waste, Biotechnology and 8'ioengineering, 28:372-380.
49. Switzenbaum, M. S. (1983) Anaerobic fixed film wastewater treatment, Enzyme and Microbial Technology, 5:242-250.
50. Switzenbaum, M. S. (1986) Comparison of attached films in several anaerobic reactor configurations: Final Report Argonne National Lab, Report No. Env. E. 90-86-1, Dept. of Civil Engineering, UMass/Amherst.
51. Switzenbaum, M. S., Scheuer, K. C. and Kallmeyer, K. E. (1985) Influence of materials and precoating on initial anaerobic biofilm development, Biotechnology Letters, 7:585-588.
52. Tait, S. J. and Friedman, A. A. (1980) Anaerobic rotating biological contactor for carbonaceous wastewaters, Journal Water Pollution Control Federation, 52:2257.
53. Tosteson, T. R. and Corpe, W. A. (1975) Enhancement of adhesion of the marine Chlorella vulgaris to glass, Can. J. of Microbiology, 21:1025.
54. Trulear, M. and Characklis, W. H. (1982) Dynamics of biofilm processes, Journal Water Pollution Control Federation, 54:1288-1301 .
55. Verrier, D. and Albagnac, G. (1985) Adhesion of anaerobic bacteria from methanogenic sludge on to inert solid surfaces, CEE Symposium, Venice.
56. Vocht, M. de, van Meenen, P., van Assche, P., and Verstraete, W. (1983) Influence of sedimentation and adhesion on selection of methanogenic associations, Process Biochemistry, 18 No. 5:31-34.
57. Weiss, L. and Blumenson, L. E. (1967) Dynamic adhesion and separation of cells in vitro, II, Interactions of cells with hydrophilic and hydrophobic surfaces, Journal of Cellular Physiology, 70:23.
58. Wilkie, A., Reynolds, P. J., 0'Kelly, N. andColleran, E. (1985) Support matric and packing effects on anaerobic filters, Proc. 2nd Int. Conf. on Fixed Film Biological Processes, Bandy, J. T. et al. (Eds) University of Pittsburg.
59. Zeeuw, W. de, Pol, L. H., Boon, J. and Le Minga (1982) Use of Factor 420 analysis in anaerobic digestion, In: Anaerobic Digestion 1981, Hughes et al. (Eds) Elsevier Biomedical Press, Amsterdam.

GRANULAR SLUDGE IN UASB REACTORS
Willem de Zeeuw
AVEBE, P.O. Box 15, 9640 AA Veendam
Summary
In 1971 the first laboratory UASB reactors were built and operated at the Agricultural University of Wageningen. In this paper a brief history is presented of the UASB concept with special emphasis on sludge granulation. Different types of granular sludge occur in the laboratory and to a lesser degree in practice. The development of each type of granular sludge can be explained on the basis of seed sludge selection and sludge bed erosion and expansion, resulting in differences in selection pressure and mean sludge residence time. More or less spherical pellets showing an inert carreler particle and mainly consisting of filamentous, Methanothrix like bacteria will preferentially develop when a relatively short sludge residence time, due to severe wash-out of sludge, does not allow for purely bacterial aggregates to grow out to a sufficient magnitude to settle and remain in the reactor. Spherical , granules without a carrier particle occur in two formes. One mainly consists of Methanosarcina like bacteria and develops when the acetate concentration in the reactor is maintained on a high level for a prolonged period of time. The other form mainly contains Methanothrix like single cells or short chains. The development of these Methanothrix granules, which are in fact the most abundant type in full scale UASB reactors, is subject to some controversy. Based on laboratory observations it is believed, that Methanothrix, having a lower Ks value for acetate, colonizes the cavities of Methanosarcina clumps, eventually resulting in the loss or the o uter layer of Methanosarcina. ' ** Another explanation can be found in aging of Methanouîrix pellets, during which the loose spaghetti like structure fills up with more bacteria to-
yield a compact Methanothrix granule. » ' *, Keywords: UASB reactor, granular sludge', start-up J' >
History of the UASB process
In 1971 the first- laboratory Upflow> Anaerobic Sludge Blanket (UASB) reactors were built and operated at the Acricultural University of Wageningen. This process resembles upflow sludge blanket processes such as the reversed-flow modified Dorr'Oliver Clarigester described in the literature (Cillie et al. 1969, Pretorius 1971), except that in the UASB process sludge recirculation and mechanical agitation are omitted and that the reactor is equipped in the upper part with a proper system for gas-solids separation. The UASB concept aimed at treating low and medium strength wastewater at high volumetric loading rates and thus at short hydraulic retention times. Sludge retention therefore is of paramount importance. The first laboratory UASB reactors were operated with well settling flocculent sludge (approximately 15 kgVSS/m3) treating sugar beet sap solutions at volumetric loading rates barely reaching 10 kgC0f)/(m3 .d)
132

(Lettinga et al. 1980). It came as a very pleasant surprise that during scale up experiments at the CSM sugar factory in 1974-1976 granular sludge developed in a 6 m pilot plant seeded initially with digested sewage sludge. The superior settling characteristics of the sludge granules allowed for much higher sludge concentrations and consequently much higher loading rates, e.g. 30 kgC0D/(m3.d) with sugar beet factory wastewater. The implementation from' 1977 onward of anaerobic wastewater treatment in the sugar industry using the UASB process was very successful. Later the development of granular sludge from digested sewage sludge was also observed in treating other types of wastewater (Versprille 1978, van der Vlugt 1980, van Bellegem 1980). Similar sludge granules were reported to occur in the interstices of highly loaded anaerobic filters (Young and Dahab 1983).
In the meantime research efforts had broadened to include the Technical University of Delft, the University of Amsterdam, as well as some research institutes (e.g. IBVL, NIKO). The start-up of UASB reactors with special emphasis on the sludge granulation process (including the microbiological aspects) was studied at the Wageningen University (de Zeeuw 1984, Hulshoff Pol et al. 1983, Dolfing 1987). The Delft group specialized in the modelling of liquid flows in the different reactor sections (van der Meer 1979, van den Heuvel and Zoetemeyer 1982). In Amsterdam emphasis was placed on the anaerobic acidification process producing acidifying granular sludge (Zoetemeyer 1982) and the two step treatment of carbohydrate solutions (Cohen 1982).
Table 1. Early research in pilot scale sludge.
UASB reactors using granular
type of wastewater maximum COD loading rate reduction (kgC0D/(m3.d) (%)
reference
sugar beet factory 30 - 32 potato processing 40 potato starch prod. 30 vegetable canning 10 - 20 yeast factory 14 dairy factory 15 slaughterhouse 10 rendering plant 60
75 84 75
60 - 80 70 80 55 63
Lettinga a.o. (1980) Versprille (1978) van Bellegem (1980) Maenhout a.o. (1982) Mulder (1982) Nieuwenhof (1982) Sayed (1982) de Zeeuw (1982)
The applicability of the system for a great variety of industrial wastewaters was studied in universities and research institutes, by consulting companies and by R&D departments of industrial firms. Apart from those mentioned in Table 1 research was done on wastewater from among others soft drinks manufacturing, wool washing, mussel canning, fibre board manufacturing, a glucose factory, a chemical factory (containing formaldehyde), paper processing and recycling, fish processing, beer manufacturing and landfill leachate.
As the UASB reactor was commercialized by at least six competing Dutch consulting companies the open exchange of data and experiences rapidly diminished. From the early eighties onward the circle of those involved in research on the application of the UASB reactor widened even more and began to
133

include a growing number of researchers from outside the Netherlands (Hall and Jovanovic 1982). The UASB concept was for instance well accepted in many latin american countries (especially Brazil and Colombia), but met with little enthousiasm in the USA, presumably partly because of its relative low-tech nature. There is little hardware in it to sell and anyone who has seen an UASB reactor can build one. Although in doing so mistakes can be and have been made. The concept itself has not been patented. The patents mentioned in some companies' advertising only apply to details of the gas-solids separator in particular, which are dealt with in different ways by others. Of course some improvements have been made over the years in the design of UASB reactors.
The relative simplicity of the UASB design does not imply that operating it is always easy. Apart from some general guidelines that should be followed to obtain and preserve the proper sludge quality and quantity (de Zeeuw 1984, Lettinga et al. 1987) every type of wastewater asks for specific know-how. Pilot scale research will provide such know-how.
The impact of pilot scale research reactors is reflected in Table 2.
the realisation of full scale
Table 2. Types of industries employing full scale UASB reactors.
type of industry
beet sugar potato processing potato starch corn starch wheat/barley starch paper brewery alcohol confectionery dairy (cheese, whey) yeast vegetable canning shell fish coffee flax landfill leachate chemicals
slaughterhouse pig manure domestic wastewater
methane reactor volumes (m )
200 200
1000 800 410
70 800 120 50
400 1800 300
2
'l
600 2
- 3040 - 2200 - 5500 - 900 - 4200 - 3000 - 4600 - 3000 - 400 '
?
- 4400' - 500 x 50 450 350 50
250
- 900 x 2750 ?
number of reactors
17 12 4 2 4 8 4
• IL 4 2 2 2' ' '.
, 1 . . 1 ' '
1 1
' 1
3 1 1
design capacity (kgC0D/(ra3
8 -5 -S -
10 -7 -4 -6 -9 -
a*. 7.5-6 -
, . 9 -10- -
10 6
30 ?
7
4 -4 ?
17 12 15 12 11 15 14 16
-13 8
12 111'
6
• d))
I
The UASB process has been developed as a high rate anaerobic treatment system based on immobilisation of the biomass in the form of well settling sludge granules. About one hundred full scale reactors are now in operation. More than half of them are found outside the Netherlands (see Figure 1 ) . Alternative modes of application of the UASB reactor have also been investigated, particularly its use in the one step anaerobic treatment at
134

ambient temperatures of wastewaters containing a high concentration of suspended solids, viz. domestic wastewater (Grin et al. 1983), slaughterhouse wastewater (Sayed 1987) and dilute manure (van Velsen et al. 1979). Instead of granular sludge a flocculent sludge blanket is required to capture the solids and loading rates will be lower. Some full scale UASB reactors for these types of wastewater are already functioning (Table 2 ) .
ïoïal
83 85 87 year
Fig. 1. Approximate number of full scale UASB reactors, which have been built until 1987.
UASB reactor start-up and sludge granulation
The first start-up of UASB reactors using digested sewage sludge as seed may last several months (Versprille 1978, Pette et al. 1979, Frostell 1979). To exemplify the course of UASB reactor start-up and the process of sludge granulation results will be used from laboratory experiments, in which different types of digested sewage sludge were used as seed material. Details of these experiments and of the materials and methods used have been published previously (de Zeeuw and Lettinga 1980, de Zeeuw and Lettinga 1983, de Zeeuw 1984). The start-up procedure consisted of a step-wise increase of the loading rate whenever the COD removal efficiency surpassed 80 to 90 %. The COD removal efficiency never dropped below 50 %. The effluent volatile fatty acids (VFA) concentration was maintained generally below 1 to 1.5 kgVFA-COD/m3 for the 3 to 5 kgCOD/m3
substrate concentration range. The substrates used in the experiments were acetate and propionate in a molar ratio of 1.5 : 1. In some experiments acetate was used as sole substrate. All experiments were conducted at 30 °C.
Sludge pellets and granules
Three different types of sludge pellets developed in laboratory UASB reactor start-up experiments from digested sewage sludge as seed material
35

and volatile fatty acids as substrate (Table 3 ) . The first macroscopic pellets were usually observed 30 to 45 days after the start of the experiments. Two types consisted entirely of bacterial matter, whereas the third type contained an inert particle as a nucleus on which the bacteria attached.
Microscopic observation of sludge samples during the start-up experiments revealed the predominant proliferation of Methanothrix and Methanosarcina type bacteria, as may be expected in the digestion of volatile fatty acids.
Table 3. Description of the different macroscopic sludge pellets formed in UASB reactor start-up experiments.
A: Compact spherical granules mainly composed of rod-shaped bacteria resembling Methanothrix soehngenii. Also called rod-granules.
B: More or less spherical pellets mainly consisting of loosely intertwined filamentous bacteria attached to an inert particle. Also called filamentous granules. The prevailing bacteria resemble Methanothrix soehngenii.
C: Compact spherical granules composed predominantly of Methanosarcina-type bacteria.
The general course of start-up
The sludge bed and sludge blanket behaviour during start-up is reflected in the sludge VSS (Volatile Suspended Solids) profiles over the reactor height as shown for a characteris'tic experiment in Figure 2. The gas production rates of example A in Figur.e 3 belong to the same experiment. At day 8 the sludge bed had only expanded from 0.37 to 0.42 m (o"£ the total height of 1 m ) , because of tiïe still low hydraulic loading and gas production rate. The sludge bed concentration amounted to 22 and the., sludge blanket concentration to only 0.7 kgVSS/m3.^ However, at higher loading' and gas .production ; rates . the ƒ sludge bed expanded to 80 % of the reactor height,, resulting in an average* sludge bed concentration of 7 kgVSS/m3 and a sludge blanket concentration of 1.85 lcgVSS/m3 at day 53. Around day 40 the first sludge granules were detected. These compact spherical grey-white particles at that .time were approximately 0.5 mm in diameter and showed a very low ash content of only 10 % of the dry matter. They were more or less uniformly dispersed over the sludge bed at day 53, but in the course of the next 4 weeks they gradually concentrated in the lower part of the reactor constituting there a 'granular sludge' bed with a sludge concentration of 17.5 kgVSS/m3 at day 80. The sludge blanket concentration at that time was approximately 4 kgVSS/m3 (Figure 2 ) .
The total amount of sludge retained in the reactor decreased slowly until
day 50, beyond which day the amount started to increase. The specific activity of the retained sludge increased in the course of the start-up from 0.03 to 1.8 kgCH/-C0D/(kgVSS.d). As a result the gas production rate reached 11.5 kgCH,-C0D/(m3.d) at day 75. • • * .
136

100-
-50-
100-
50-
100-
5 0 -
100-
50-
-
o—osludge-VSS • -
I O
I V
f: X • ' 1 • I X •
1 1 X •
I 1
]l 1 XO«
X • i 1 x •
|x[«
x •_
X i J ! \ ! X o •
\ N x 1 = _
•
Î o 1 1 0
--•
1
w •
-o -
acetate
•
9
X —
XI
jx X\ \
^ O
-x propionate
day 8
day 30
day 53
day 8 0
Fig. 2. Sludge concentration and VFA concentration profiles at different moments during UASB-reactor start-up.
10 15 20 25 sludge concentration (gVSS/1 )
200 600 1000 VFA concentration (mg/l)
Type of seed sludge and sludge wash-out
Seeding the reactor with a highly concentrated digested sewage sludge, leads to a substantial loss of sludge during the first days of the start-up due to the wash-out of 'non-settleable' or 'colloidal' solids. With it a considerable part of the methanogenic activity is lost as well. The remaining sludge exhibits a fairly good settleability combined with a relatively low specific methanogenic activity. This is reflected in the moderate expansion of the sludge bed during the first weeks in the experiment of Figure 2.
In contrast, less concentrated types of digested sewage sludge (as used in experiment B of Figure 3) are much more homogeneous regarding their settling characteristics. Little sludge wash-out occurs during the first days of operation and little methanogenic activity is lost (see Figure 3 ) . The overall inferior settleability and the comparatively high methanogenic activity of the retained sludge in the latter ease, cause a r^pid expansion of the sludge bed into the settler, and consequently a wash-out of part of the sludge (Figure 3; experiment B from day 11 onwards). The latter mechanism of sludge wash-out is called here 'expansion
137

wash-out', because it is brought about by expansion of the sludge bed out of the reactor. The former type is named 'erosion wash-out', because it refers to the wash-out of sludge particles originating from the sludge bed, provided that the top of the sludge bed is still well below the settling compartment.
3^-1 , gas production rate(kgCH4-C0D.m d Fig. 3. The gas production rate and the effluent sludge concentration during start-up of UASB reactors seeded with different types of digested sewage sludge. (A): seeded with 11.5 kgVSS.m-3 of concentrated sludge (original cone: 79 kgDSS.m~3). Feed: mixture of acetate and propionate (3 kgVFA-COD.m-3). (B): seeded with 10 kgVSS.m 3 of dilute sludge type (original-cone: 43.5 kgDSS.m 3 ) . Arrows indicate the appearance of macroscopic granules.
40 60 time (days)
Expansion wash-out will, of course, occur witlVall types of t seed' sludge when too much seed is used reducing thç seed sludge hold-up in the reactor to its maximum value under the .prevailing conditions.
Expansion wash-out primarily reduces t,he average sludge retention time and causes only little selection between different sludge particles. If a reactor is completely filled with sludge, as is the case when sludge bed expansion wash-out occurs, there is no settling zone left in the reactor and sludge particles which might otherwise have been retained, are also wasted. Only very coarse particles are retained selectively. The latter will be used as carrier material for the development of type B pellets (Table 3 ) .
The other type of sludge wash-out, i.e. sludge bed erosion wash-out, is very selective. It only removes the lightest particles from the system in accordance with the basic concept of the UASB-reactor. A situation should be pursued in which sludge bed expansion wash-out is limited and sludge wash-out predominantly takes place in the form of sludge bed erosion wash-out. Therefore, a concentrated digested sewage sludge type is recommended as seed for the start-up of reactors treating a medium
strength wastewater.
Digested cow manure (7.1 % total solids, A.8 % volatile solids) has also been used as UASB-reactor seed sludge in the treatment of a YFA-solution (2.7 kgCOD/m3). The reactor was seeded with 15 kgVS/m3. A distinct sludge bed was formed. After 26 days of operation about 60 % of the VSS had been washed out as a result of sludge bed erosion and severe wash-out was still going on. At that time 4 times the reactors' volume of wastewater had been treated. The specific activity of the retained sludge had increased from 0.01 at the start to 0.05 kgCH,-C0D/(kgVSS.d) . The gas production rate amounted to 0.3 kgCH,-C0D/(m .d).
From these results it appears that digested cow manure behaves in a way similar to concentrated digested sewage sludge, and that it can be used as UASB-reactor seed sludge, as is well established in case of thermophilic treatment (see Wiegant et al. 1983). However, the start-up with digested cow manure will take longer than with digested sewage sludge.
Recently Wu et al. (1987) reported the successful use of activated sludge from aerobic treatment plants as seed material for the start-up of UASB reactors. The activated sludge should be incubated and batch-fed for a fortnight to enhance the number of methanogens prior to starting continuous feed.
Sludge pelletization theory /
In the treatment of VFA substrates, two bacterial genera seem of predominant importance with respect to UASB-reactor start-up and the development of granular sludge; i.e. Methanothrix and Methanosarcina. This is not surprising, because acetate is the precursor of 70 to 75 % of all methane, and both Methanothrix and Methanosarcina are acetate converting methanogens. Of these two, Methanothrix occurs most frequently. Usually it represents the bulk of bacteria present in UAS3 reactor sludges. Of course, in the treatment of more complex substrates acidogenic bacteria - many of which exhibit good floc-forming properties - may predominate.
Methanothrix has a high substrate affinity. Therefore UASB reactors in which a high removal efficiency is pursued, provide an excellent environment for their growth.
These bacteria form filaments. During the initial stages of UASB-reactor start-up - under conditions of a low selection pressure - Methanothrix filaments grow in and on floes and in this way are responsible for the development of a bulking anaerobic sludge.
Methanothrix very easily attaches to all kinds of surfaces, as has been demonstrated in fixed film reactors (van den Berg and Kennedy 1981, Heynen 1983). When a high selection pressure is exerted on the sludge particles during start-up of UASB reactors they attach to carrier particles originating from the seed sludge. In this way type B granules develop (Table 3 ) . In contrast to type B granules, which are composed of loosely intertwined filaments, type A granules predominantly consist of Methanothrix bacteria, which are packed densely together.
139

Methanosarcina is well known for its ability to produce clumps of bacteria (Zhilina 1976). The tendency of Methanosarcina to cluster is independent of the selection pressure put on the system and also occurs in batch reactors with complete sludge retention. The clumps can reach macroscopic dimensions (type C granules; Table 3 ) , and show cavities, which can be inhabited by other species (Zhilina 1976, Bochem et al. 1982).
Presumably type A granules (see Table 3) develop from Methanosarcina clumps of which the hollow centre becomes inhabited by Methanothrix bacteria. Their respective substrate affinity factors would favour such a spatial distribution. In fact large numbers of Methanosarcina bacteria were observed in the surrounding solution of young type A granules. Ultra-microtomic slices of these granules revealed the presence of clusters of embedded Methanosarcinas close to the periphery, whereas no Methanosarcinas were observed in the central part. Obviously the outer layer of Methanosarcina is easily lost once the granules attain macroscopic dimensions. In later stages of the growth and multiplication of type A granules Methanosarcina apparently is no longer involved. •
Table 5. Sludge behaviour during UAS3-reactor start-up using different seed sludge types
CONCENTRATED SEED SLUDGE TYPE
high initial erosion wash-out
DILUTE SEED SLUDGE TYPE
low initial erosion wash-out
low residual methanogenic activity
slow initial rate of start-up
well settleable sludge / dense sludge bed
fast growth of Methanothrix
limited sludge bed expansion / no expansion wash-out
long biomass retention time
many Methanosarcina bacteria
colonization of Methanosarcina clusters by Methanothrix
development of type A granules
high residual methanogenic activity
fast initial rate of start-up
poorly settleable sludge{/ thjji sludge bed "»
a». fast growth of Methanothrix
excessive* sludge bed expansion / expansion wash-out
short biomass retention time
only few Methanosarcina bacteria
colonization of inert fluidised particles by Methanothrix
development of type B pellets
Methanosarcina is not known to attach easily to alien surfaces. Therefore its retention in upflow reactors depends upon the settleability of the clumps, or - as long as Methanosarcina still occurs as clusters of only a few cells - upon the dilution rate, which should be smaller than the growth rate. The maximum growth rate is approximately 1.0 d . However, the acetate concentration in the reactor during start-up normally will
140

not exceed 1.0 kg/m3, and mostly be far lower when treating low and medium strength wastewaters at an acceptable removal efficiency. As the K value of Methanosarcina is high,(i.e. 0.3 kg/m3) the actual growth rate will be much lower than 1.0 d .In UASB-reactors during start-up the dilution rate will initially be less than 0.5 d . When the loading rate of the reactor is increased,, the dilution rate also increases and will soon become more than 1.0 d depending on the strength of the wastewater. Only Methanosarcina clumps that have grown large enough to settle will be retained. Single cells or small clusters of Methanosarcina bacteria will then be washed out of the reactor.
Table 5 shows how the two types of digested sewage sludge distinguished before behave differently when used as seed in the treatment of a medium strength wastewater. Two (A and B) of the three types of granules developing in UASB-reactor start-up experiments can be cultivated on the same substrate; a mixture of acetate and propionate. The granules consisting of Methanosarcina-type bacteria (type C) were found exclusively in experiments in which the reactor concentration of acetate as single substrate was maintained above 1 kgC0D/m . In that case Methanosarcina obviously outcompetes Methanothrix.
The development of type A or type B granules is apparently related to the reactor start-up pattern (Figure 3 ) . In turn, differences in the start-up pattern are mainly dictated by the characteristics of the seed 'sludge used, The explanation for the development of particular types of sludge granules related to a particular start-up pattern can be found by comparing the average biomass retention times in the respective start-up experiments. For this purpose, the amount of active biomass present in the reactor was calculated from the methane production rate. Based on results of VFA-fed batch experiments the maximum specific activity of pure active biomass was estimated at 2.85 kgCH/-C0D/(kgVSS.d) (de Zeeuw 1984). This value is in accordance with literature data for Methanothrix (Huser 1981), which is the prevailing species in the granules, and it can be used, because during UASB-reactor start-up the substrate concentration is always vieil above the K level.
In combination with the biomass growth figures as calculated from the yield factor of 0.024 g biomass-VSS/gCH^-COD (de Zeeuw 1984), a biomass balance calculation can be made from which the biomass retention time is estimated.
Figure 4 shows the average biomass retention time corresponding to the start-up patterns A and B of Figure 3. In each pattern a period occurs with an average biomass retention time of only 20 days. During this specific period wash-out of flocculent sludge takes place. This is due to either excessive expansion of the sludge bed, or to sludge bed erosion caused by high hydraulic and gas loading rates. This period is followed by a period of increasing biomass retention times as a result of the development of a granular sludge bed. As most experiments were terminated after the appearance of the first granules, this is only shown for one experiment (B).
Preceding the period of heavy wash-out of flocculent sludge the average biomass retention time exceeds 100 days. During this latter period the sludge bed still has room to expand in the reactor, and the loading rates are still too low to cause excessive wash-out of sludge through erosion
141

of the sludge bed. The length of this initial period with an average biomass retention time of more than 100 days is about 40 days for start-up pattern A, compared to only 10 to 15 days for start-up pattern B.
In UASB-reactors bacterial sludge growth can take place in 3 different modes, i.e. 1) as sludge floes, 2) as sludge granules without carrier material, and 3) as sludge pellets attached to supporting particles. These supporting particles may originate from the seed sludge, or may be present in the wastewater as coarse suspended solids.
JT140-
i 100-
60
20
>200
w w
w
>200 >200
V •"vJl-
20 40 60 100 time (days)
Fig. 4. Average biomass retention time during UASB-reactor start-up with different types of seed sludge (see Table 17). For calculation see text. Seed concentration: approx. 10 kgVSS.m 3. i'eed: .mixture of acetate and propionate (3-t?-kgCOD.m 3 ) . (A): seed sludge type A yielding type A granular sludge, (B) : seed sludge type B -yielding type B granular sludge. •*
It is inherent to the low selection pfessure at 'the modest loading rates prevailing during the initial phase" of UASB^-râactor start-up that small floes present in the seed sludge will ' grow rapidly and produce a so called 'bulking' anaerobic sludge. When a reactor has been seeded with much active flocculent sludge, as is the case when a relatively active digested sewage sludge type is used (start-up pattern B of Figure 3 ) , little time is required for the sludge bed to expand out of the reactor at a gas production rate equivalent to about 2 kgCH,-C0D./(m3,d). Once heavy wash-out of flocculent sludge has started (beyond day 10 to 15), the average biomass retention time becomes too short to allow for macroscopic bacterial granules to develop. Large conglomerates of bacteria can then be formed only through attachment to inert support particles, which are heavy enough to be retained longer (type B granules).
Only in the case of start-up pattern A the initial period, with an average biomass retention time of more than 100 days, is evidently long enough (about 40 days) to allow for the development of compact sludge
142

granules which consist exclusively of bacterial matter.
Table 6. Relation between the duration of the initial period with an average biomass retention time exceeding 100 days, and the type of macroscopic sludge granules formed.
initial period with an average biomass type of granules formed retention time exceeding 100 days after 30-45 days of start-up
(days) . (1)
40 A 37 A
30 C 26 C
14 B 11 B 10 B
(1) Codes refer to Table 3.
Sludge granules of type A, B and C first appear in a macroscopic form (diameter 0.5 mm) after 30 to 45 days of reactor start-up treating a VFA feed.
Type C granules consist almost exclusively of bacteria resembling Methanosarcina. From.the reported growth rate of this organism on 1 % acetate of 1.0 d (Mali 1980), one can calculate, that at an average acetate concentration of 1.0 kg/.m3 it will indeed take roughly one month to form a macroscopic granule when starting from a single bacterium. However the bulk of the bacteria constituting the granules of type A and type B resemble Methanothrix sohngenii. The growth rate of a pure culture of .iethanothrix sohngenii at 30 °C is reported to be 0.14 d (Muser et al. 1982); being about one seventh of that of Methanosarcina. The tiiae needed to form a macroscopic granule starting from a single bacterium would then be in the order of 180 days. However, compact macroscopic granules - mainly consisting of Methanothrix like bacteria - appear after 30 to 45 days of start-up. This may imply either, that the growth rate of Methanothrix sohngenii in mixed cultures is much higher than in pure culture or, that a different species is involved or, that microscopic granules (consisting of up to 500.000 bacteria) are already present in the seed sludge. The latter, however, has never been observed.
Hulshoff Pol et al. (1983c) have found that the addition of a small amount of ground type A granules to a digested sewage seed sludge, which normally yields a sludge bed of type B granules invariably leads to the development of a sludge bed of type A granules without altering the start-up pattern as far as sludge wash-out is concerned. By adding fragments of granules, which still consist of fairly large conglomerates of bacteria, the initial period with a high biomass retention time required for the development of macroscopic type A granules is obviously reduced from about 40 to 10-15 days.
The results discussed here apply primarily to the treatment of VFA substrates; i.e. completely acidified wastewaters. In the case of a one step anaerobic treatment of largely unacidified wastewaters the acid
143

forming bacteria may also contribute to the formation of granular sludge (Hulshoff Pol et al. 1983b). In view of their far higher growth rates they may enhance the development of type A granular sludge even at low initial biomass retention times.
References
Bochem, H.P., S.M. Schoberth, B. Sprey, and P. Wengler (1982) Thermophilic biomethanation of acetic acid: morphology and ultrastructure of a granular consortium. Can.J.Microbiol. _28, 500-510.
Gillie, G.C., M.R. Henzen, G.J. Stander, and 5.0. Baillie (1969) Water Research _3, 623.
Cohen, A. (1982) Optimization of anaerobic digestion of soluble carbohydrate containing wastewaters by phase separation. Ph.D. thesis, Univ. of Amsterdam.
de Zeeuw, W., and G. Lettinga (1980) Acclimation of digested sewage sludge during start-up of an upflow anaerobic sludge blanket (JASB) reactor. Proc.35th Ind.Waste Conf., Purdue Univ., pp. 39-47.
de Zeeuw, W.J. (1982) Development of granular sludge in the anaerobic treatment of rendering wastewater (in Dutch). Report Dept. of Water Pollution Control, Agricultural Univ., Wageningen, the Netherlands.
de Zeeuw, W., and G. Lettinga (1983) Start-up of UASB-reactors. Proc.Eur. Symp. Anaerobic Waste Water Treatment, Nov. 1983, Nbordwijkerhout, Neth., pp, 348-363.
de Zeeuw, W.J. (1984) Acclimatization of anaerobic sludge for UASB reactor start-up. Ph.D. thesis, Agricultural University, Wageningen.
Dolfing, J. (1987) Microbial aspects of granular methanogenic sludge. Ph.D. thesis, Agricultural University, Wageningen.
Frosteil, B. (1979) Anaerobic wastewater treatment with emphasis on sludge retention. Ph.D. thesis, Royal Inst, of Technol. Stockholm. Grin, P.C., R.E. Roersma, and G. Lettinga (1983) Anaerobic treatment of raw sewage at lower temperatures. P,roc. Eur . Symp . Anaerobic Waste Water Treatment, Nov. 1983, Noordwijkerhout, Neth.,-pp 335-347.
Hall, E.R. and Jovanovic (1982) Anaerobic treatment of thermal^sludge conditioning liquor with fixed-film -«nd 'suspended growth processes. Proc. 37th Ind. Waste Conf. Purdue Univ., pp..719*~
Heijnen, J.J. (1983) Development of a high-rate fluidized bed biog'aè reactor. Proc.Eur.Symp., Anaerobic Waste Water 'Treatment, Nov. 1933, Moordwijkerhout, Neth., pp 283-291.'' ' <.- * ,
Hulshof f Pol, L.W., W.J. de Zeeuw, ' C.T.HJ. >Velzeboer and G. Lettinga (1983a) Granulation in UASB-reactors. Wat.Sei.Tech. 15., 291-304.
Hulshoff Pol, L.W., J. Dolfing, K. van Straten, W.J. de Zeeuw and G. Lettinga (1983b), Pelle£ization of anaerobic sludge in UASB-reactors on sucrose containing substrates. Paper' presented at 3rd Int.Symp. on Microbial Ecology, August 7-12, East Lansing, Michigan, USA.
Hulshoff Pol, L.W., H.A.A.M. Webers, and G. Lettinga (1983c) The effect, , of the addition of small amounts of granular sludge to the seed sludge
on the start-up of UASB-reactors. Proc.Eur .Symp. Anaerobic 'Waste Water Treatment, Nov. 1983, Noordwijkerhout, Neth', pp 383-391.
Huser, B.A. (1981) Methanbildung aus Acetat. Ph.D. thesis, ETH Zurich, IIQ^-6750.
Huser, B.^., K. Wuhrraann and A.J.B. Zehnder (1982) Methanothrix soehngenii gen.nov.sp.nov., a new acetotrophic non-hydrogen oxidizing raethanobacterium. Arch.Microbiol. 132, 1-9.
Lettinga, G., A.F.M, van Velsen, S.W. Hobma, W. de Zeeuw, and A. Klapwijk (1980) Use of the Upflow Sludge Blanket (USB) reactor concept for
144

biological wastewater treatment, especially for anaerobic treatment. Biotechnol.Bioeng. 22, 699-734.
Lettinga, G., W. de Zeeuw, W. Wiegant, and L. Hulshof f Pol (1987) High-rate anaerobic granular UASB reactors for wastewater treatment. In: Bioenvironraental Systems Vol. I, pp. 131-159. Ed. D.L. Wise, CRC-Press, Boca Raton, Florida, USA.
Maenhout, A.M.A.T., G.J.M. Goedvriend, P.H. Sybring, and P.S. Hak (1902) Anaerobic treatment of vegetable canning wastewater (in Dutch). Report nr. 370, IGVL, P.O..Box 13, Wageningen, the Netherlands.
Mah, R.A. (1980) Isolation and characterization of Methanococcus nazei. Current Microbiol. 3_, 321-326.
Mulder, A. (1982) Anaerobic treatment of sulphate containing wastewater (in Dutch). Report Gist-Brocades/Agricultural University 'Wageningen.
Nieuwenhof, P.F.J. (1982) NIZO, Ede, the Netherlands. Personal co.ra.iunication.
Pette, K.C., R. de Vletter, E. Wind, and W. van Gils (1979) Development of an industrial anaerobic treatment plant for beet sugar wastewater (in Dutch). Report Min. of Public Health and Environmental Protection, no. 33.
Pretorius, W.A. (1971) Water Res. 5, 681. Sayed, S.K.I. ( 198.2) Anaerobic treatment of slaughterhouse wastewater (in
Dutch). Report Dept. of Water Pollution Control, Agr.Univ. Wageningen. Sayed, S.K.I. (1987) Anaerobic treatment of slaughterhouse wastewater
using the UASB process. Ph.D. thesis, .Agricultural University, Wageningen, the Netherlands,
van Bellegera, T.M. (1930) Methane production from the effluent of the potato starch industry. Biotechnol. Letters _2, 219-224.
van den Berg, L., and 'v.J. Kennedy (1981) Support materials for stationary fixed film reactors for high-rate methanogenic fermentations. Biotechnol. Letters ^3, 165-170.
van den Heuvel, J.C., and R.J. Zoetemeyer (1982) Stability of the methane reactor: A simple model including substrate inhibition and cell recycle. Process Biochem. 1_7_ (3), 14-19.
van der Meer, R.R. (1979) Anaerobic treatment of wastewater containing fatty acids in upflow reactors. Ph.D. thesis. Delft Univ. of Techn.
van der Vlugt, A.J. (1930) Anaerobic treatment of vinasse condensate. Personal communication,
van Velsen, A.F.M., E. van 't Oever, and G. Lettinga (1979a) Application of an upflow reactor in the anaerobic treatment of liquid calf manure (in Dutch). TNO 12, 59-63.
Versprille, A.I. (1973) Anaerobic treatment of potato-processing wastewater (in Dutch). Report no. ...16, IBVL, Wageningen, Neth.
Wiegant, W.M., J.A. Ciaassen, A.J.M.L. Borghans and G. Lettinga (1933) High rate thermophilic anaerobic digestion for the generation of methane from organic wastes. Proc.Eur.Symp. Anaerobic Waste Water Treatment, Nov. 1983, Noordwijkerhout, Meth., pp. 392-410.
Wu Weimin, Hu Jicui, Gu Xiasheng, Zhao Yizhang, Zhang Hui (1987) Cultivation of anaerobic granular sludge in UASB reactors with aerobic activated sludge as seed. Water Res. _2J_, 789-799.
Young, J.C. and M.F. Dahab (1983) Effect of media design on the performance of fixed-bed anaerobic reactors. Wat.Sei.Tech. 15, Copenhagen, 369-383.
Zhilina, T.N. (1976) Biotypes of Methanosarcina. Mikrobiologiya 45,
< 481-489. Zoetemeyer, R.J. (1982) Acidogenesis of soluble carbohydrate-
containing wastewaters. Ph.D. thesis, Univ. of Amsterdam.
145
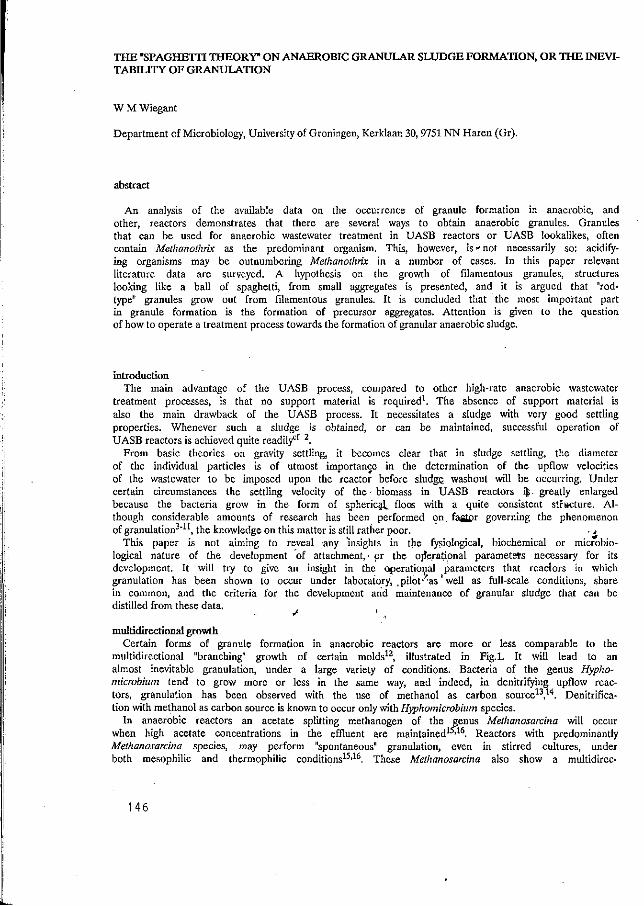
THE "SPAGHETTI THEORY" ON ANAEROBIC GRANULAR SLUDGE FORMATION, OR THE INEVITABILITY OF GRANULATION
W M Wiegant
Department of Microbiology, University of Groningen, Kerklaan 30, 9751 NN Haren (Gr).
abstract
An analysis of the available data on the occurrence of granule formation in anaerobic, and other, reactors demonstrates that there are several ways to obtain anaerobic granules. Granules that can be used for anaerobic wastewater treatment in UASB reactors or UASB lookalikes, often contain Methanothrix as the predominant organism. This, however, is " not necessarily so: acidifying organisms may be outnumbering Methanothrix in a number of cases. In this paper relevant literature data are surveyed. A hypothesis on the growth of filamentous granules, structures looking like a ball of spaghetti, from small aggregates is presented, and it is argued that "rod-type" granules grow out from filamentous granules. It is concluded that the most important part in granule formation is the formation of precursor aggregates. Attention is given to the question of how to operate a treatment process towards the formation of granular anaerobic sludge.
introduction The main advantage of the UASB process, compared to other high-rate anaerobic wastewater
treatment processes, is that no support material is required1. The absence of support material is also the main drawback of the UASB process. It necessitates a sludge with very good settling properties. Whenever such a sludge is obtained, or can be maintained, successful operation of UASB reactors is achieved quite readily^ 2.
From basic theories on gravity settling, it becomes clear that in sludge settling, the diameter of the individual particles is of utmost importance in the determination of the upflow velocities of the wastewater to be imposed upon the reactor before sludge, washout will be occurring. Under certain circumstances the settling velocity of the • biomass in UASB reactors iji - greatly enlarged because the bacteria grow in the form of spherical., floes with a quite consistent structure. Although considerable amounts of research has been performed on. fagtpr governing the phenomenon of granulation3"11, the knowledge on this matter is still rather poor. ..,
This paper is not aiming to reveal any insights in the fysiological, biochemical or microbiological nature of the development of attachment,- or the operational parameters necessary for its development. It will try to give an insight in the operational parameters that reactors in which granulation has been shown to occur under laboratory, .pilot''as well as full-scale conditions, share in common, and the criteria for the development and maintenance of granular sludge that can be distilled from these data.
multidirectional growth Certain forms of granule formation in anaerobic reactors are more or less comparable to the
multidirectional "branching" growth of certain molds12, illustrated in Fig.1. It will lead to an almost inevitable granulation, under a large variety of conditions. Bacteria of the genus Hypho-microbium tend to grow more or less in the same way, and indeed, in denitrifying upflow reactors, granulation has been observed with the use of methanol as carbon source13,14. Denitrifica-tion with methanol as carbon source is known to occur only with Hyphomicrobhim species.
In anaerobic reactors an acetate splitting methanogen of the genus Methanosarcina will occur when high acetate concentrations in the effluent are maintained15,16. Reactors with predominantly Methanosarcina species, may perform "spontaneous" granulation, even in stirred cultures, under both mesophilic and thermophilic conditions15,16. These Methanosarcina also show a multidirec-
146

tional growth mode, yielding granules which will eventually develop diameters of up to 3 mm15,16. These granules may have less practical significance in the use of UASB reactors. Although having a high maximum specific activity, they have been shown to give operational problems .
UASB related granules For rod-shaped organisms, the mechanism of the formation of granules as outlined above is
impossible. These bacteria either have to develop some kind of attachment by the use of special polymers, or the bacteria have to grow in filaments, which may or may not be attached to some kind of surface. Bacteria lacking these two kind of methods will not reach a cell residence time high enough to sustain their existence in reactors with a moderately high upflow velocity^ 17. The formation of these bacterial granules has so far been observed nearly only in UASB reactors, although in has been shown to occur in the interstitial cavities in upflow anaerobic filters18.
granules consisting of filamentous bacteria Under the conditions which prevail in most anaerobic reactors for the treatment of wastewater,
the predominant acetate splitting methanogen belongs to the genus Methanothrix. This is a rod shaped organism, which tends to grow in filaments19'20. The granules found in reactors treating acidified wastewaters, or solutions of volatile fatty acids, when the reactors are operated at low effluent acetate concentrations, are consisting predominantly of Methanothrix bacteria ' .
In mesophilic UASB systems, two types of granules have been described, both containing Methanothrix as the predominant bacterium. The first type consists of very long Methanothrix filaments, of up to 1000 units long. These granules have so far only been found in laboratory UASB reactors. They generally consist nearly exclusively of Methanothrix and are white or light grey. They are referred to as "filamentous" granules. The second type shows much shorter filaments, of only 5-10 units long. These granules are observed in a number of full-scale installations, and are generally referred to as "rod-type" granules. As yet, it is still «nclear what factors govern the mode of growth of the Methanothrix bacteria.
For the bacteria themselves the difference between the two growth modes may not be important. The settling velocity of both types of granules, per unit of biomass, is not very different, as can be calculated from their densities, which are 1033 and 1054 for filamentous and rod-type granules, respectively21, and the density of Methanothrix bacteria, which is 109022. This is illustrated in Fig. 2.
granules with predominant acidificrs Granules formed during the acidification and mcthanogenesis from sugar solutions often consist
for a large part of Methanothrix bacteria, which may contribute significantly to the consistence of the granules. The acidifying bacteria, however, seem to be the bacteria governing the granulation process, as the granules are macroscopically are strikingly similar to those obtained in experiments with the acidification of sugar solutions. As is shown in Table I, the
SETTLING VELOCITV (em's)
BIOMASS tagTSS)
Fig. 1. Schematic representation of "branching" growth.
Fig. 2. Settling velocity as a function of the amount of biomass for filamentous ( ) and rod-type ( ) Methanothrix granules.
147

Table I. A number of parameters in different reactors at the approximate time granulation is apparent.
concentration
kg COD/m3
0.10-0.15 2.25
14 12-15
9.7 48.5
3.0 5-7b
3.0 2.4 3.0
volumetric loading rate
kg COD/m3day
6.0
5.5-6.8
193 233
4.0 19
2-5 1.6
4.4-11.8
liquid upflow velocity
m/day
24 3.6
-
6.2 1.1
1.3 0.54
3.0-7.4 7.1
4.0-10.7
biogas upflow velocity
m/day
1.3-1.7 1.3
11.3 6.9
10.5 10.0
2.0-8.0
1.6-3.9
process
.
denitrification denitrification
methanogenesis methanogenesis
acidification acidification
methanogenesis methanogenesis
mcthanogenesis methanogenesis methanogenesis
granule type
_
unknown Hyphomicrobiuma
sarcina sarcina
unknown unknown
unknown unknown
filamentous filamentous filamerttous
reference
.
23 14
15,16 9
24 24
4 5
Hulshoff Pola
7 9
a: personal communication b: increasing influent concentrations
biogas upflow velocities at the approximate moment of the first occurrence of the granules is quite comparable in various experiments concerning acidification and combined acidification and methanogenesis. -
For a sludge converting sugars to methane at a "high" SRT, the bacterial yield at high growth rates is estimated to be Y = 0.08-0.12 kg VSS/kg COD4'25. With a Y of 0.025-0.040 for methanogenic and acetogenic bacteria3, it may be concluded that in methanogenic granules growing on sugars, the majority of the bacteria (expressed in cell mass), is non-methanogenic, even though it is generally assumed that the decay rate for acidifiers is much higher than of Methanothrix bacteria. This can also be concluded from the resemblance between acidifying and methanogenic granules growing with sugars as substrates. Both have a yellowish colour and a gleamy macroscopic appearance4,8,24, suggesting some kind of ^polysaccharide occurring in the granules. • I
Acidifying granules can also be grown at a very-Jiigh ' growth rate27. It has been postulated that a hydraulic retention time, lower than the reciprocal of the maximum growth rate of the bacteria involved has to be applied, for the_ granulation of acidifying bacteria. In this way^a selection pressure is imposed for _ bacteria which perform attached growthcf 27. This would imply high effluent concentrations, at least during, startup. Of course, -this routine ' cannot be applied in the granulation of biomass converting non-acidified wastewaters, because the selection for Methanothrix demands for very low reactor substrate concentrations.
granulation of rod-shaped organisms ^ , For the operation of UÀSB reactors, only the granules with Methanothrix as the predom
inant organism seem to have practical significance. Therefore, it is important to give attention to the mechanism of granule formation in the treatment of acidified wastewaters, or solutions of acetate, or mixtures of volatile fatty acids. Two major topics can be distinguished in this type of granule formation: the formation of precursors, and the actual growth of the granules from these precursors. ' selection
In the initial phase of reactor startup, it is important that there is a selection for the bacteria one wants to form granules! In this case, a strong selection for Methanothrix has to be imposed. This can be carried out by making use of the high substrate affinity for acetate of Methanothrix, as opposed to Methanosarcina. This means that the acetate concentration has to be low during the startup phase, for otherwise growth of Methanosarcina is promoted. Although
14c

Methanosarcina clumps have been observed as a "condensation particles" in Methanothrix granules3, there is no reason to believe that^ney functioning as anything else than inert material.
If the selection pressure is not directed towards Methanothrix, granulation can only occur with Methanosarcina, which will eventually lead to inferior process operation.
collection There is some circumstantial evidence that Methanothrix bacteria will move around in the
sludge bed, by the turbulence generated by the gas evolution, to become collected in very small aggregates. Support for this hypothesis found in the fact that in a number of experiments3,5 it has been shown that granulation of Methanothrix can occur extremely rapidly. Within one month of operation, the first granules with a diameter of c 1 mm generally are observed. Assuming no diffusion limitation, and a maximum specific growth rate of the Methanothrix species involved, c 0.10 day , then still particles with a volume of 5 % of the volume of a 1 mm granule, thus having a diameter of 0.37 mm, should be present in the seed material. This seed material generally is digested sewage sludge, and purely methanogenic particles of this size can hardly be expected to be present in this sludge. Apparently this "collection" happens with a higher rate than the actual growth rate of the bacteria.
The actual rate of increase of the methane production rate in mesophilic and thermophilic experiments is much lower than the maximum growth rate of the bacteria involved. The increase rates are c. 0.03 and 0.07 day , respectively, for UASB experiments3,9, and 0.10 and 0.40 day" for the bacteria ° . These observations imply that during the startup phase a large part of the growing methanogenic population is washed out of the reactor.
The fact that each increase in the loading rate will coincide with an increased washout of aggregates, too small to withstand the higher upflow velocity, has been demonstrated with thermophilic Methanosarcina granules9, in which an increase in the loading rate by 30 % led to an initial strong increase of the methane production of the reactor followed by a decrease due to washout.
There can be no doubt that concentration of particles on which the Methanothrix bacteria can grow - either particles consisting of these bacteria themselves, or inert particles - may not be too high, because otherwise the increase in the size of the aggregates will be too slow to allow for a reassonable rate in the stepup regime. For this reason granulation cannot be expected to occur when treating wastewaters with a high concentration of suspended solids. It should be noted that the highest rate of increase of the methane production rate in thermophilic experiments was observed with a seed material which consisted of the contents of a CSTR fed with acetate and butyrate, containing thermophilic Methanothrix as the only acetate consuming methanogen, with a concentration of only 0.025 kg VSS/m .
the growth of small aggregates to full blown granules Once the precursors are formed, the growth of the actual granules in the laboratory seems
to be a mere matter of time, if a regular stepup routine in the loading rate is followed. The precursor particles will grow out to granules by the combined growth of the individual bacteria, as well as the entrapment of non-attached bacteria. It is not hard to imagine that the growth of filamentous organisms will yield aggregates of a spherical shape in an environment in which constant moderate sheer forces are supplied by the biogas evolution. For instance, the biogas upflow velocity at the approximate moment granulation becomes apparent is pretty comparable in experiments on both the acidification and the complete digestion of sugar solutions, as shown in Table I. On the other hand, the difference between these biogas upflow velocities in experiments with sugars as substrates on one hand and with volatile fatty acids as substrates on the other, may reflect differences in the nature of acidifying bacteria and Methanothrix (see Table I).
The granules grown in this way are generally of the filamentous type. Under a microscope, they strongly resemble a huge ball of badly prepared spaghetti, of which part is pretty loose, and part is still in bundles.
149

rod-type granules Granules, consisting for a large part of short filaments of Methanothrix bacteria are ob
served in a number of cases. These granules are the ones most often found in full-scale installations5. They may be grown when a high biomass retention time is used during the startup3. When granular sludge, obtained from full-scale installations, is crushed into small aggregates, an identical type of rod-shaped granules is obtained when a mixture of volatile fatty acids is used ,10. There is some reason to believe that the difference between filamentous and rod-type granules is much less than previously supposed. In thermophilic experiments another type of Methanothrix granules, macroscopically strongly resembling rod-type granules, but apparently still consisting of long filaments, apparently developed from the first type, as was indicated by the presence of intermediate forms . Although photographs of thermophilic granules grown on acetate strongly resemble rod-type granules, even on the microscopic level, they actually existed of long filaments. It seems highly likely that the formation of rod-type granules is the result of an increase in the density of the bacterial growth, which may be generated by either a high sludge age of the seed material3, the use of a seed material wjth a very dense bacterial density already, like crushed granular sludge ' , or an increasing age of a filamentous granule, as outlined above. Apparently, the growth from dense granules, either rod-type or filamentous, from filamentous granules has never been observed under mesophilic conditions because it takes a lot of time. It already took half a year under thermophilic conditions!
in summary: the "Spaghetti Theory" The granulation in UASB reactors with predominant Methanothrix bacteria, thus appears to
proceed via the following stages. Initially there is a seed material with more or less filamentous Methanothrix in it. When their relative concentration is not high enough, a strong selection towards Methanothrix has to be imposed. The concentration of inert material may not be too high, so that individual Methanothrix bacteria, present or grown in the sludge can become entangled in small microscopic knots, as observed in thermophilic experiments (personal observation), or attached to finely dispersed matter. In the initial phase, the upflow velocity is zero or very low, so that there will be no selection pressure towards growth in aggregates. Selection for aggregates is exhibited by imposing an increasing upflow velocity. The low increase rate of the methane production rate indicates, that apparently the larger part of the methanogenic biomass in the initial phase does not grow in aggregates. Thereafter, when a proper stepup routine is followed, the development of Methanothrix granules will be inevitable.
The ultimate development of rod-type granules seems a matter of (much) time after the first filamentous granules are observed.
> % consequences for startup **"
The apparent occurrence of a "collection", phenomenon in the startup phase of a UÂéB reactor, implicates that one has to- give the filamentous methanogenic bacteria the _ opportunity to grow in such concentrations that they can collect ! This 'implies à negative selection for Methanosarcina-bacttiia which compete with Methanolhrix f£r »acetate, as shown in Fig. 3. Once the selection pressure towards Methanothrix • has yielded sufficient amounts of these bacteria, a stepup regime can be started. In practice, the occurrence of Methanothrix and Methanosarcina bacteria in the sludge can be checked quite simply with the use of a light microscope. Of course the selection for Methanothrix has to be continued, until one is sure that Methanosarcina cannot "take over".
This may mean that dilution of the wastewater to a low concentration, or even effluent recirculation, should be preferred above the application of a low loading rate with a high concentration. As long as selection has to be carried out, there can be no underloading !
consequences for stepup The application of selection implies that an absolute value for the effluent acetate con
centration has to be the ultimate criterion on which to decide for an increase in the loading rate, rather than a relative (contra 1). The use of a absolute criterium for the stepup of the loading rate of 200 mg/L of acetate has been shown to lead to granulation with various seed materials in experiments on the thermophilic operation of UASB reactors9.
50

Fig. 3. Specific growth rates of acetate utilizing methanogens as a function of the acetate concentration for mesophilic Methanothrix (A) and Methanosarcina (B), and for thermophilic Methanothrix (D, data from 26 and 28), and Methanosarcina (E & C), with Ks-values of 5 (29), or 15.9 (15) mM of acetate, respectively.
Although is has never been shown in the laboratory, it seems that the most important ingredient in the formation of rod-type granules is patience! Eventually, when a high enough biomass retention t ime is reached, the aged filamentous granules will become rod-type granules.
references
Lettinga G, A F M van Velsen, S W Hobma, W de Zeeuw & A Klapwijk 1980. Use of the upflow sludge blanket (USB) reactor concept for biological wastewater treatment, especially for anaerobic treatment. Biotech Biocng 22:699-734. Lettinga G, L W Hulshoff Pol, I W Koster, W M Wiegant, W J de Zeeuw, A Rinzema, R E Rocrsma & S W Hobma 1984. High -ra te anaerobic waste-water treatment using the UASB reactor under a wide range of temperature conditions. In: Biotechnology and Genetic Engineering Reviews vol II (G E Russell, cd), Intercept, Newcastle upon Tync, England, 1984, pp 253-284. Zeeuw W J de 1983. Start-up of UASB-reactors. Ph D Thesis, Agric Univ, Wageningen, Holland. Hulshoff Pol L W, J Dolfing, K van Straten, W J de Zeeuw & G Letlinga 1983. Peptization of anaerobic sludge in upflow anaerobic sludge bed reactor on sucrose containing substrates. In: Current perspectives in microbial ecology (M J Klug & C A Reddy, eds), Am Soc Microbiol, Washington DC, pp 636-642. Hulshoff Pol L W, W J de Zeeuw, C T M Velzeboer & G Lettinga 1983. Granulation in UASB reactors. Water Sei Technol 15 (8/9): 291-304 Hulshoff Pol L W, H A A M Webers & G Lettinga 1983. The effect of the addition of small amounts of granular sludge to the seed sludge of UASB-reactors. In: Proc European Symposium on Anaerobic Wastewater Treatment, TNO Corporate Communication Department, The Hague, Holland pp 383-391. Ross W R 1984. The phenomenon of sludge pelletization in the anaerobic treatment of a maize processing waste. Water SA 10: 197-204. Wiegant W M & G Lettinga 1985. Thermophilic anaerobic digestion of sugars in upflow anaerobic sludge blanket reactors. Biotech Bioeng27:1603-1607. Wiegant W M & A W A dc Man 1986. Granulation of biomass in Upflow Anaerobic Sludge Blanket reactors treating acidified wastewaters. Biotechnol Bioeng 28: 718-727 Dolfing J 1987. Ph D Thesis, Agricultural University, Wageningen, Holland. Wu W, J Hu, X Gu, Y Zhao, H Zhang & G Gu 1987. Cultivation of anaerobic granular sludge in UASB reactors with aerobic granular sludge as seed. Water Research 21: 789-799. Metz B & N W F Kossen 1977. The growht of molds in the form of pellets. Biotech Bioeng 19:781-799. Klapwijk A, J C M van der Hoeven & G Lettinga 1981. Biological denitrification in an upflow sludge blanket reactor. Water Research 15:1-6. I lock J P van der 1987. Granulation of denitrifying sludge. This conference. Bochem II P, S M Schoberth, B Sprey & P Wengler 1982. Thermophilic biomethanation of acetic acid: morphology and ultrastructure of a granular consortium. Can J Microbiol 28:500-510. Brune G, S M Schoberth & H Sahm 1982. Anaerobic treatment of an industrial wastewater containing acetic acid, furfural and sulphite. Process Biochem 17:(3):20-24. Isa Z, S Grusenmeyer & W Verstraete 1986. Sulfate reduction relative to methane production in high-rate anaerobic digestion: microbiological aspects. Appl Environ Microbiol 51: 580-587. Young J C & P L McCarty 1969. The anaerobic filter for waste treatment. J Wat Poll Contr Fed 41: R160-R170. Huser B A, K Wuhrmann & A J B Zehnder 1982. Methanothrix soehngenii gen nov sp nov. A new acetotrophic non-hydrogen-oxidtzing methane bacterium. Arch Microbiol 132:1-9. Nozhevnikova A N & V I Chudina 1984. Morphology of the thermophilic acetate methane bacterium Methanothrix thermoacetophila sp nov. Microbiology 53: 618-624.
151
21. Tramper J, J W van Groenestijn, K Ch A M Luyben & L W Hulshoff Pol 1984. Some physical and kinetic properties of granular anaerobic sludge. In: Innovations in Biotechnology (E H Houwink & R R van der Meer, eds) Elsevier Science Publ, pp. 145-155.
22. Scherer P 1983. Separation of bacteria from a methanogenic wastewater population by utilizing a self-generating Percoll gradient. J Appl Bacteriol 55:481486.
23. Klapwijk A, H Smit & A Moore 1981. Denitrification of domestic wastewater in an upfiow sludge blanket reactor without carrier material for the biomass. In: Biological Fluidised Bed Treatment of water and wastewater (P F Cooper & B Atkinson, eds), Ellis Honvood Publ 1981, pp 205-216.
24. Zoetemeyer R J, A C J M Mathijsen, J C van den Heuvel, A Cohen & C Boelhouwer 1981. Anaerobic acidification of glucose in an upfiow reactor. Trib Cebedeau 34:444-465.
25. Cohen 1982. Optimization of anaerobic digestion of soluble carbohydrate containing wastewaters by phase separation. Ph D Thesis, Univ of Amsterdam.
26. Zinder S H, T Anguish & S C Cardwell 1984. Effect of temperature on methanogenesis in a thermophilic (58 °C) anaerobic digestor. Appl Environ Microbiol 47: 808-813.
27. Beeftink H H 1987. Anaerobic bacterial aggregates, variety and variation. Ph D Thesis, University of Amsterdam, Holland.
28. Zinder S H, S C Cardwell, T Anguish, M Lee & M Koch 1984. Methanogenesis in a thermophilic (58 °C) anaerobic digestor: Methanothrix sp as an important aceticlastic methanogen. Appl Environ Microbiol 47:796-807.
29. Zinder S H & R A Man 1979. Isolation and characterization of a thermophilic strain of Methanosarcina unable to use H2-CO2 for methanogenesis. Appl Environ Microbiol 38: 996-1008. "
152
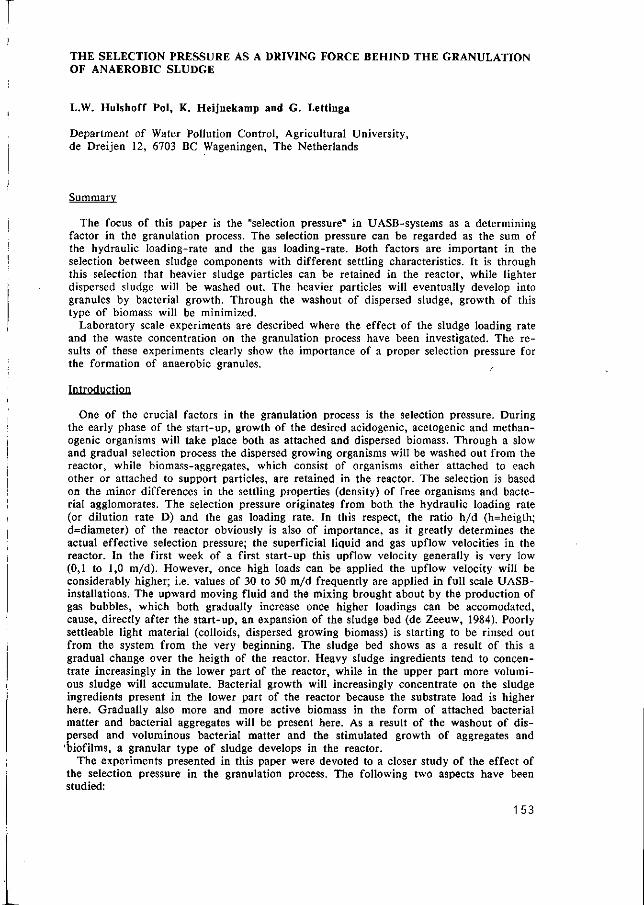
THE SELECTION PRESSURE AS A DRIVING FORCE BEHIND THE GRANULATION OF ANAEROBIC SLUDGE
L.W. Hulshoff Pol, K. Heijnekamp and G. Lettinga
Department of Water Pollution Control, Agricultural University, de Dreijen 12, 6703 BC Wageningen, The Netherlands
Summary
The focus of this paper is the "selection pressure" in UASB-systems as a determining factor in the granulation process. The selection pressure can be regarded as the sum of the hydraulic loading-rate and the gas loading-rate. Both factors are important in the selection between sludge components with different settling characteristics. It is through this selection that heavier sludge particles can be retained in the reactor, while lighter dispersed sludge will be washed out. The heavier particles will eventually develop into granules by bacterial growth. Through the washout of dispersed sludge, growth of this type of biomass will be minimized.
Laboratory scale experiments are described where the effect of the sludge loading rate and the waste concentration on the granulation process have been investigated. The results of these experiments clearly show the importance of a proper selection pressure for the formation of anaerobic granules.
Introduction
One of the crucial factors in the granulation process is the selection pressure. During the early phase of the start-up, growth of the desired acidogenic, acetogenic and methan-ogenic organisms will take place both as attached and dispersed biomass. Through a slow and gradual selection process the dispersed growing organisms will be washed out from the reactor, while biomass-aggregates, which consist of organisms either attached to each other or attached to support particles, are retained in the reactor. The selection is based on the minor differences in the settling properties (density) of free organisms and bacterial agglomorates. The selection pressure originates from both the hydraulic loading rate (or dilution rate D) and the gas loading rate. In this respect, the ratio h/d (h=heigth; d=diameter) of the reactor obviously is also of importance, as it greatly determines the actual effective selection pressure; the superficial liquid and gas upflow velocities in the reactor. In the first week of a first start-up this upflow velocity generally is very low (0,1 to 1,0 m/d). However, once high loads can be applied the upflow velocity will be considerably higher; i.e. values of 30 to 50 m/d frequently are applied in full scale UASB-installations. The upward moving fluid and the mixing brought about by the production of gas bubbles, which both gradually increase once higher loadings can be accomodated, cause, directly after the start-up, an expansion of the sludge bed (de Zeeuw, 1984). Poorly settleable light material (colloids, dispersed growing biomass) is starting to be rinsed out from the system from the very beginning. The sludge bed shows as a result of this a gradual change over the heigth of the reactor. Heavy sludge ingredients tend to concentrate increasingly in the lower part of the reactor, while in the upper part more volumi-ous sludge will accumulate. Bacterial growth will increasingly concentrate on the sludge ingredients present in the lower part of the reactor because the substrate load is higher here. Gradually also more and more active biomass in the form of attached bacterial matter and bacterial aggregates will be present here. As a result of the washout of dispersed and voluminous bacterial matter and the stimulated growth of aggregates and 'biofilms, a granular type of sludge develops in the reactor.
The experiments presented in this paper were devoted to a closer study of the effect of the selection pressure in the granulation process. The following two aspects have been studied:
153

1. The effect of the sludge loading rate. In one reactor the sludge loading rate was maintained at a low level (0.3 kg COD/kg VSS.d), while in the other reactor the imposed sludge loading rate was increased to 0.9 kg COD/kg VSS.d. 2. The effect of the substrate (waste) concentration. By operating the experimental UASB's at the same sludge loading rates at different waste concentrations, differences will be obtained in the hydraulic loading rate (or superficial upflow velocity).
Materials and methods
The parameters that were used for the control of the process were the volatile fatty acids (VFA) concentration in the effluent, the amount of dry suspended solids (DSS) and volatile suspended solids (VSS) in the reactor, the methane production and the specific metha-nogenic activity of the sludge. VFA concentrations were determined gaschromatographically using a Packard Becker 417 with a 2 m glass column filled with 60-80 mesh chromosorb 101, and formic acid saturated nitrogen-gas as carrier gas. The operating temperatures for the injection block, the oven and the FID detector were resp.: 180, 190 and 200 °C. The gaschromatograph was equipped with a HP 7672 A automatic sampler and a SP 4100 computing integrator. The DSS and VSS determinations were carried out according to standard methods (American Public Health Organization, 1975). The gasproduction was measured with a wet type gas flow meter (Meterfabriek Schlumber-gen, Dordrecht, The Netherlands). The specific methanogenic activities were determined in 2.5 1 batch digestors. These digestors were intermittently stirred (15 seconds at 140 rpm every 10 min) and fed with a VFA-mixture of acetate, propionate and butyrate up to a concentration of 600 mg/1 for each component. The VFA-mixture was neutralized with NaOH. To each batch digestor 1 ml of nutrient solution containing 174 g NH4CI, 36 g K2HPO4 and 265 g Na2SO4.10H2O per liter and 2.5 ml of a trace element solution according to Zehnder et al (1980) was added. The 10 and 30 1 experimental UASB-reactors that were used were identical to those previously described (Hulshoff Pol et al, 1983). Table 1 presents the operating conditions of the experiments.
Table 1. Experimental conditions of the study on the effect of the sludge loading rate and the substrate concentration. I
experiment volume UASB-reactor substrate cone. specific procescondition 3 (liter) (mg/1): . • •
I-a
I-b
Il-a
Il-b
30
/
30
10
10
r >
acetate: 4400 sludge loading rate is propionate: 3520 kept at:
± 0.3 kg COD/kg VSS.d
acetate: 4400 sludge loading rate is propionate: 3520 0.9 kg COD/kg VSS.d
acetate: 208 influent-COD = 500 mg/1 propionate:'162
acetate: 4160 influent-COD = 10.000 mg/1 propionate: 3330
The acetate and propionate solutions were neutralized up to a pH of 6.5 with NaOH and to the feed solution 0.1 ml/1 influent of the already mentioned trace element solution was
154
added, while also yeast extract was added to obtain a concentration of 100 mg/1 in the influent. The start-up procedure followed comprised always in a 50% increment once a removal efficiency of 80% was reached. The loading rate in experiment I-b was only increased up to a sludge loading rate of 0.3 kg COD/kg VSS.d. and then kept at this level. The experiments I-a and I-b conducted with an influent waste concentration of 10,000 mg COD/1 in order to minimize the so called expansion wash-out, as observed by de Zeeuw (1984), who worked with COD-concen-trations of 3,000 mg/1.
Results
1. The effect of the sludge loading rate (exp. I-a and I-b).
Fig. 1 and 2 show the imposed space loading rates and sludge loading rates, the removal efficiencies, the concentration of acetate and propionate in the effluent, the total amount of biomass in the reactor, the amount of sludge wash-out and the calculated sludge yield. The yield factor was calculated on the basis of a sludge balance.
space loading rate (g COD/1.d) sludge loading rate (g COD/g/VSS.d)
4':
T
U-
l.a
—rr~r"
reinoculation
i
....j-n. , : , - v atile
2000
1000'
Fatty acids (m
">V^ ^
g/0'
J \ ,
l.b
F 1
removal (%) /
~"\ L80 U
40
0
VSS (g)
Fig. 1. Operation and results of reactor I-a, started up under a continuous low organic organic loading rate of + 0.3 kg COD/kg VSS.d. (The lines represent: space loading rate and sludge loading rate for l.a; removal effiency, effluent-acetate cone, and effluent propionate cone, for l.b; total amount of VSS, sludge washout as g VSS and growth as g VSS for l.c)
55

The reactors were started very carefully with initial sludge loading rates of 0.03-0.04 kg COD/kg VSS.d. At these low loading rates it was possible to achieve a good removal of the influent-COD in 2 weeks. These initial low loading rates obviously implicate very low upflow velocities (+ 0.03 m/d) and extremely high hydraulic retention times (HRT's of ± 40 days) and consequently a low selection pressure. However as shown in the figures 1 and 2 after 2 weeks the loading rates could be increased up to the desired sludge loading rates with a good degredation of the volatile fatty acids from the influent. In experiment I-a the space loading rate was increased up to a value of 2.7 kg COD/m3.d and a sludge loading rate of ± 0.3 kg COD/kg VSS.d. The corresponding upflow velocity was at that moment: 0.29 m/d. From this moment onwards the space loading rate was remained unchanged. In the other reactor (exp. I-b) the space loading rate was increased further up to values of 4 - 6 kg COD/m3.d within 3 weeks, which corresponds to upflow velocities of 0.42-0.63 m/d. and HRT's of 1.7 and 2.5 days. The sludge loading rate in this experiment
space loading rate (g COD/1.d) sludge loading rate (g COD/g VSS.d)
4
2
r _JLJ7^ 2.a j
1 ,-v-''
f=F^*--r"
[ — i
1000
2.b volatile fatty acids (mg/1)
2000-/ 1 ' , / " / ' \/- \rfV\ ,\.
removal (%)
VSS (g)
300
2UU
100-
2.c
. _-v f
^ . . ] - \ ^ r "
_...
8 io i2 vr~ time (weeks)
Fig. 2. Operation and results of reactor I-b, started up *under at a organi« loading rate of 0.9 kg COD/kg VSS.d. (The lines represent:-. -?/>açé loading rate a n d -
sludge loading rate for 2.a; removal effiency,-^—— effluent-acetate cone, and • effluent propionate cone, for 2-ty
* - > , total amount of VSS, sludge washout as
g VSS and growth as g / S S for l.c) ,
increased drastically to almost 2.0 kg COD/Kg VSS.d., mainly as a result of sludge washout. As the acetate and propionate concentration in the effluent increased at this high sludge loading rate, we decided to lower the space loading rate. The slow increase of the total amount of biomass in the reactor beyond week 15 resulted in a gradual further decrease of the sludge loading rateto 1.0 kg COD/kg VSS.d at the termination of the experiment (week 15). The sludge washout from reactor I-a was relatively insignificant. Only during the period in which the loading rate was increased a considerable washout (0.35 kg VSS/m3.d) occurred during a few days. Once the desired sludge loading rate of 0.3 kg COD/kg VSS.d. was reached, the washout rate became insignificant. This situation remained unchanged until a massive flotation of the sludge suddenly occured in week 18 and the sludge started to washout again at a high rate (0.26 kg VSS/m3.d). The washed-out sludge was collected in a settling tank and brought back into the reactor. However, the same phenomenon occured again directly after the sludge had been returned to the reactor. The distribution of the sludge over the height of the reactor from exp. I-a was very unfavorable:
156

The applied loading rates regimes together with the results of the experiments Il-a and and II-c are presented in the figures 3 and 4. Experiment Il-a showed a quick expansion of the sludge-bed right after the start and sludge started to washout almost immediately at a washout-rate of 0.4 kg VSS/d. After the first week the washout-rate decreased to a value of 0.03 kg VSS/d. At day 69 a minimum of the total retained amount of sludge was found (6.8 kg VSS/m3, i.e. 46.6% of the sludge amount at the start) was found. The granules, formed in the reactor, were of the filamentous type. In most cases these organisms were attached to inert support particles.
The reactor operated with an influent-COD of 10 kg COD/m3 showed a very slow startup. After day 30 the rare situation existed that a better degradation of propionic acid occurred than of acetic acid. For 50 days an acetate concentration of 2 g/1 was present in
volatile fatty acids (g/D ,
» 1
. removal - acetic acid ' propionic acid
removal (%)
space loading rate
(g COD/l.d)
30
10
. space loading rate sludge loading rate
sludge loading rate (g COD/g VSS.d)
5
3
1
VSS (g) amount of sludge in the reactor wash out sludge yield
150
100'
50
40 80 120 time (days)
Fig. 4. Operating conditions and results of the UASB-reactor started up with a influent-COD of 10.000 mg/1.
the reactor. Only after day 80 this situation came to an end when the effluent acetate concentration suddenly dropped to a value below 1 g/1. Next the loading rate could continuously be increased to ultimately a value of 50 kg COD/m3.d. without further problems with acetate build-up. The sludge loss through washout due to the sludge bed expansion was very limited during the first 80 days of the experiment. The minimum sludge hold-up in this experiment was reached after 115 days of operation when 68% of the initial quantity was still present. Granulation was observed around day 50 as a result of the growth of very small Sarcina-aggregates.
157

almost all the sludge was accumulated in the settler. This shows the strong tendency of the sludge to flotate and it is clear that under these conditions it is not possible to achieve an effective sludge retention in the system. Microscopic examination of the sludge revealed that the major part of the biomass in reactor I-a consisted of long filaments, presumably Methanothrix soehneenii. The filaments form loose floe structures. These floes start floating very easily by the attachment of gasbubbles. On the other hand in reactor I-b a sludge bed developed with an gradual increasing bed thickness. Microscopic examination learned that also here filamentous granules were present in the sludge bed and that the major part of the sludge was still flocculant in nature after 15 weeks of operation. In order to be able to make a better comparison between the two experiments with respect to the sludge quality and loading potentials, the objective was to continu the operation of reactor I-b until the same quantity of COD had been converted as in exp. I-a after its termination. This ment another 16 weeks of feeding of reactor I-b at a space loading of 3 kg COD/m^.d.. This goal could not be achieved through the massive sludge flotation.
2. The effect of the substrate concentration (exp. Il-a and Il-b).
removal (%) volatile fatty acids
(mg/D
.removal -acetic acid
300
100
••;••"• propionic acid
1 Ü it y
I I I I 1 1 1
1 I I
»A
Kt i / > >. /V - l / J I II, i i
' , J , " , V ,1 !
' 4
MA.O^M^N
80»
60
40
space loading rate
(g COD/l .d) - s p ace loading rate
- s ludge loading r a t e s ] u ( j g e loading r^te
• .*. (g COD/g VSS.d)
VSS (g)
150
amount,of sludge in the reactor wash out'
'sludge yield
40 80
time (days)
Fig. 3. Operating conditions and results of the UASB-reactor started up with a influent-COD of 500 mg/1.
1 5£

Discussion
1. The effect of the sludge loading rate.
Exp. I-a shows that under conditions of low selection pressures (= the sum of the hydraulic and the gas loading rate) growth will take place mainly as dispersed (filamentous) biomass. Growth of attached biomass will be limited if ocurring at all, because the major part of the substrate will be degraded by the voluminous sludge. Microscopic investigation of the sludge- showed no granules nor even denser floes. The filamentous biomass in fact gives rise to the formation of a bulking type of sludge. Obviously the problem of bulking sludge is not limited to aerobic wastewater treatment. However, there is a major difference in the cause of the bulking sludge problem in aerobic systems (Carousel, Pasveer-ditch) and the UASB-reactor. In aerobic systems bulking sludge is reported to be caused by deficiency of nitrogen and/or phosphorus and the feed pattern of most aerobic activated sludge systems (Rensink et al, 1982). Completely mixing of aerobic systems tends to promote the formation of bulking sludge, whereas high loaded plug flow systems have little problems. In UASB-reactors it appears to be the result of a lack of selection pressure on the system, which of course may also play a role in the occurence of bulking sludge in aerobic activated sludge systems. According to our insights the selection pressure in these systems is small if existing at all. Both in aerobic and anaerobic systems we are dealing with a predominance of filamentous organisms. In aerobic systems is frequently Sphaerotilus natans and Microthrix parvicella is found, while in anaerobic reactors the predominant organism is Methanothrix in the filamentous form. Methanothrix filaments can become very long (200 - 300 m). When these organisms grow without attachment to a solid support particle a loosely intertwined structure of filaments will be obtained. A sludge with very poor settling properties will be the result. Through the attachment of gas-bubbles to these loosely intertwined filaments the sludge even has a tendency to flotate. Exp. I-a shows that this is a gradual process in which an increasing part of the original seed sludge (partially consisting of heavier ingredients) is being incorporated in the voluminous structures. Exp. I-a also shows that it makes no sense to return the sludge back into the reactor, in the light of the above this is quite obvious. These results therefore indicate that once this type of sludge has been obtained the best thing to do, is to discharge this sludge and to re-inoculate the reactor with new sludge. The importance of a selective washout of dispersed sludge during the start-up cannot be illustrated better. The lack of selection pressure in exp. I-a is clearly reflected in the low average wash-out value during the experiment, which was Xe = 0.022 kg VSS/m3. From this value the mean sludge residence time can be calculated: SRTm = 1515 days, a value which can be considered extremely high. However, as soon as the voluminous sludge expands until the settler this value will drop sharply The values for exp. I-b were: Xe = 0.120 kg VSS/m3 and SRTm = 67.4 days.
The start-up of reactor I-b showed that after 7 weeks the sludge bed was expanded into the settling compartment. When comparing these results with those of start-up experiments using lower influent-COD levels (Hulshoff Pol et al, 1983; ten Brummeier et al, 1985), it is clear that sludge bed expansion and consequently expansion washout (de Zeeuw, 1984) is significantly delayed at high influent COD levels. This is the result of the lower superficial velocities under those conditions. Liquid surface loading rates play an important role in the selection process. The expansion wash-out became effective at a surface loading rate of 0.02 m/h (at a HRT of 2.2 days) and at a gas loading rate of 1.6 m/day. Experiments with a low influent-COD (see exp. Il-a) show however that this effect is less important. With low influent-COD levels, which means relative high surface loads and low gas loads, washout by sludge bed expansion starts almost immediately. In exp. I-b there was a short period (2 weeks) with a high washout during which the first granules became macroscopic visible. The last month of this experiment a gradual increase of the total amount of sludge occurred. However, there was at the termination of the experiment riet a clear seperation between the granules and the reamaining flocculent sludge. The granules, which consisted predominately out of filaments of the Methanothrix-like organism, were entrapped in the flocculent sludge bed. As a result of this, the granules did not settle well down to the bottom of the reactor.
159

2. The effect of the substrate concentration.
The substrate concentration determines directly the hydraulic loading rate at a given space loading rate. Therefore the selection pressure is strongly depending on the concentration of the wastewater. It is obvious that a low waste concentration will result in a high selection pressure. An important question in this respect is what will be the lower limit. Generally domestic sewage is regarded as a wastewater on which granular sludge can not be cultivated, although there is one case where it is claimed that granulation actually was obtained (Vieira, 1984). The reason for this idea is that sewage is considered as being too dilute, while it also contains a too high concentration of dispersed inert solids to which bacteria may attach. A lot of surface area is continuously offered to a relatively small amount of bacteria, so that concentrated growth will be limited. Furthermore, the acetate concentration will have such low values that the growth rate of the most important organism in the methanogenic granules (Methanothrix soehngenii) is reduced to very low values according to Monod kinetics. As granulation is strongly determined by bacterial growth the reduced growth will concomittantly lead to a slow down in the granulation process. Another detrimental effect of low concentrations can be that the hydraulic loading rates will lead to drastic washout of the potential granule precursors in addition to the light dispersed sludge fraction. In the treatment of domestic sewage granulation is therefore not foreseen: the loading rate of the process is primarely determined by the lowest possible hydraulic retention time at which there is no net loss of active biomass through washout. The results of experiment Il-a show that with a VFA-mixture of 500 mg COD/1 the formation of granular sludge indeed still is possible. Under these low influent conditions is the sludge starting to wash out right from the beginning of the experiment, but the minimum in the sludge amount remains well above 5 kg VSS/m3. A possible serious problem with low influent concentrations is the introduction of oxygen in the system with the influent. Generally wastewater may contain some dissolved oxygen, depending on the nature of the pre-treatment and the turbulence in the inlet-system. At high waste concentrations the amount of oxygen introduced in the system at a specific organic loading rate will be relatively small and the oxygen will be consumed by facultative organisms present in the anaerobic reactor. At low concentrations however, more oxygen will be introduced and it may not be removed sufficiently fast as a result of this the anaerobic reactor will not be fully anoxic. At the end of exp. II«-a at higher loading rates problems of this nature occurred, while also in the full scale application- (brewery wastewater) similar problems have been obtained with low concentrated wastewaters. *•
The start-up of reactor II-c (influent-GOD =-i0.000 mg/1) was very slow. There "Was no expansion washout from the system during the first 80 days W the start-up. Although generally overloading is reflected by elevated concentrations of propionic acid in tue reactor, in this case acetic acid accumulation occurred. fThere is no clear explanation for this phenomenon. Since there is a abundant'growth of Mêthanosarcina in this Reactor, it should be expected that there would be acetate* consumption. However, apparantly the acetoclastic biomass did not developed sufficiently fast enough. As there were no toxicants present in the feed, while also the reactor pH was around 7.0 no other inhibitory factors were causing this acetate accunjoilation. •
During the start-up of reactor Il-b gradually small granules, with diameters up to ± 0.5 mm were formed. These granules contained Methanosarcina's as the main organisms. Considering the high acetate concentrations in the reactor this is not surprising. The Sarcina-eranules were however too small to be retained in the reactor at higher hydraulic loading rates. It is therefore a bad strategy to select for Mêthanosarcina during a UASB-start up: Methanothrix-granules will become 4 to 6 times as big as Sarcina-granules and will therefore much easier be retained in the reactor at high selection pressures.
From the above it will be clear, that granulation in UASB-reactors mainly originates from the fact that bacterial growth in these reactors is deligated to a limited number of (growth-)nuclei. These nuclei can consist, to our opinion, of both inert organic and inorganic carrier materials as well as small bacterial aggregates present in the seed sludge. As finely dispersed bacterial matter has little if any chance to be retained in the reactor
160

(of course depending on the conditions imposed on the system), film and aggregate formation is greatly enhanced. As the dimensions of aggregates and the thickness are limited (i.e. dictated by internal binding forces and the degree of intertwinement) at due time a new generation of growth nuclei (secundary nuclei) will be generated from deattached films and fragments of disrupted granules. These growth nuclei will grow in size and eventually they will produce a third generation etc.. The first generation consists of relatively voluminous aggregates, but gradually they also will become dense, as bacterial growth will not only be limited to the outside of the granule, but definetely also inside the aggregates. This particularly will be the case for the voluminous aggregates because:
- substrate diffusion limitation will be less than with dense bacterial aggregates - substrate can penetrate deeper in the aggregates in view of the lower volumetric
bacterial activity inside the granule. The decrease of substrate concentration in the ganule (or biofilm) with the distance will be related to the density of the aggregates. The denser the sharper the drop.
Aging is therefore to our opinion on of the reasons of the disappearance of "filamentous granules", which predominate during the initial stages of the granulation process.
References
American Public Health Association, 1975. Standard Methods for the examination of waste and wastewater. APHA, New York.
Brummeler, E. ten, L.W. Hulshoff Pol, J. Dolfing, G. Lettinga and A.J.B. Zehnder, 1985. Methanogenesis in a UASB-reactor at pH 6.0 on an acetate plus propionate mixture. Applied and Environmental Microbiology, Vol. 49, No. 6, pp. 1472-1477. ,,
Hulshoff Pol, L.W., J. Dolfing, W.J. de Zeeuw, C.T.M. Velzeboer and G. Lettinga, 1983. Granulation in UASB-reactors. Water Science and Technology, Vol 15, 291-304.
Rensink, J.H., H.J. Donker and T.S.J. Uwema, 1982. The influence of the feed pattern on sludge bulking. Bulking of activated sludge, preventive and remedial methods. Vieira, S.M.M., 1984. Tratamento de esgotos por digestores anaeróbios fluxo ascendente.
Revista do Dae, 44,139, 322-328. (In Portugese) Zeeuw, W.J. de, 1984. Acclimatization of anaerobic sludge for UASB-reactor start-up.
PhD-thesis Agricultural University, Wageningen, The Netherlands. Zehnder, A.J.B., B.A. Huser, T.D. Brock and K. Wuhrmann, 1980. Characterization of an
acetate decarboxylating, non-hydrogen-oxidizing methane bacterium. Arch.Microbiol., 124. 1-11.

PHYSICAL PROPERTIES OF BACTERIAL AGGREGATES IN A CONTINUOUS -FLOW REACTOR WITH BIOMASS RETENTION
H. H. Beeftink1 and J. C. van den Heuvel
Department of Chemical Technology and Biotechnological Centre, University of Amsterdam, Nieuwe Achtergracht 166, 1018 WV Amsterdam, The Netherlands
SUMMARY
An anaerobic gas —lift reactor in which bacterial aggregates were formed and retained was operated at a high dilution rate for prolonged periods of time to study its operational stability. A true steady state was not established readily, once aggregates were formed: a gradual shift was observed from a low specific growth rate and a high biomass retention to a more rapid growth at reduced biomass hold —up. To explain this phenomenon, physical characteristics of the aggregates were studied. A novel method is described that allows the simultaneous determination of diameter and settling velocity of a large number of individual aggregates. With isopycnic density —gradient centrifugation, also the specific density of aggregates could be measured directly. It was shown to decrease with the aggregate diameter. The decrease in density is attributed to substrate insufficiency in large aggregates and the subsequent autolysis. The lesser densities are inferred to explain the relatively low settling velocities that were observed for large aggregates. Such aggregates, being inefficiently retained and susceptible to shear stress, disappear with time from the reactor. The remaining aggregates are small, and this consequently facilitates the higher specific growth rates observed.
INTRODUCTION
Practical operation of various types of continuous —flow bioreactors (e.g. upflow and fluid —bed reactors) heavily relies on the presence of suspended bacterial aggregates, which are formed either with or without the» aid of inert carrier particles. Such a mode of bacterial growth facilitates high —rate reactor performance, since the good settling properties of these aggregates may prevent biomass wash —out from the reactor to some extent, provided a settler is present. , ' . * . * *
Previously (Beeftink & Van den Heuvel, . 1987), doubts hSrve been expressed as to whether a true steady state would become established in such bioreactors retain'iög aggregates, once bacterial aggregates have been formed from individual cells in the inoculum. In a more general sense also, it has been stressed (Atkinson \ Dapud, 1976; Atkinson & Mavituna, 1983) that data on. physical ^characteristics of aggregates are wanting or simply absent. This lack is a major bottleneck in the rational operation of continuous — flow reactors retaining biomass aggregates.
Therefore, the present contribution reports on the overall characteristics during prolonged operation of such a reactor, the anaerobic gas —lift reactor (AGLR; Beeftink & Van den Heuvel, 1987). For this purpose, an extended run exceeding 400 liquid residence times was performed under constant operating conditions; it started with the formation of aggregates from freely suspended cells. In view of the importance of the settling properties of aggregates, their number, diameter, specific density, and settling velocity were investigated at various stages of reactor operation.
Two techniques were used to measure these aggregate characteristics. On the one hand, results are presented on the relation between diameter and settling velocity of a large number of individual aggregates. Data were obtained from the projection of photographic negatives on which sedimenting aggregates were recorded.
1. Present adress: Department of Biochemical Engineering, Delft University of Technology, Julianalaan 67, 2628 BC Delft, The Netherlands
162

On the other hand, simultaneous measurements on the specific density and the diameter of individual bacterial aggregates are presented. Data were obtained from isopycnic density —gradient centrifugation with Percoll, a colloidal suspension of coated 20 — nm silica particles. The technique represents a novel application of Percoll gradients, which hitherto have been employed only to measure densities of cells or subcellular particles. Literature provides only indirect data on specific density of aggregates, as, invariably, these densities were calculated from settling velocities (Magara et al., 1976; Tambo & Watanabe, 1979; Shieh el al., 1981; Brohan & McLaughlin, 1984; Timmermans & Van Haute, 1984).
MATERIALS AND METHODS
Reactor, medium, growth conditions, and analytical determinations. Aggregates to be analyzed were sampled from an anaerobic gas —lift reactor (AGLR), in which glucose was fermented to short —chain fatty acids by a natural mixed population. Details on growth and operating conditions, on medium composition (glucose limitation), on reactor start —up, and on analytical determinations are given elsewhere (Beeftink & Van den Heuvel, 1987). The reactor contents were considered to be well —mixed; sampled aggregates, therefore, were taken to represent the whole aggregate population in the reactor. Specific growth rate calculations. With data on reactor and effluent dry—weight biomass concentrations (xr and *e , respectively; g/1) and on dilution rate (D, h — ' ) , values for a population —averaged specific growth rate (ft, h— 1) during transient conditions may be obtained from a biomass balance (Beeftink & Van den Heuvel, 1987). As an approximation, however, ji—values between subsequent data points were calculated as:
M ^•(xr2-xr,)/(xr,+xr2)it2-t,) + D(xty+x&2)l(xty+xt2)
with subscripts 1 and 2 indicating two subsequent samples at times r, and t2 (h). Sampling procedure. A wide sample port (8 mm ©) allowed unobstructed sampling from the AGLR. Settling —velocity/diameter measurements were combined with counting numbers of aggregates. To normalise numbers in subsequent samples, the sample volume (ca. 10 ml) was determined gravimetrically (assuming 1000 kg/m3). Errors in sample volume were considered negligible, since specific weight of biomass in general only slightly exceeds 1000 kg/m3 (e.g. Woldringh et al., 1981). Settling experiments: simultaneous measurement of velocity and diameter of individual aggregates. Aggregate —containing samples (ca. 10 ml) were collected in small wide-— mouthed vials. Subsequently, the sample was brought on the top of a water column (perspex container; 0.07x0.07x2 m; Fig. 1), a chronometer was started, and all particular material was allowed to sediment undisturbed. A 35 —mm camera with a bellows and a 400 —mm lens was placed at a distance of 2 m from the perspex column,
Fig. 1 : Schematic set —up for diameter/ settling —velocity measurements (not drawn to scale). 1: sample vial; 2: perspex chamber with settling swarm of aggregates; 3: 35 —mm camera; 4: field of view of camera with chronometer and scale.
SI
• 1 •
F * *
1 •
2
0 J4
163

and viewed a 0.07x0.10 —m section (including the chronometer) of the column at 1.5 m from the top (Fig. 1). Aggregates that passed the field of view of the camera were recorded in a series of 24x36 mm negatives (linear magnification 0.35; illumination with two electronic flashes). Settling velocities vœ (m/s) were calculated for each negative (and thus for the aggregates on it). Each negative represented a velocity class; the mean of this class was used as v^—estimate for the aggregates in it. Negatives were projected on a transparent tablet digitizer screen (Summagraphics, Fairfield, USA; final linear magnification ca. 3.5), connected to a HP 9825A calculator. With a computer —connected marker, the largest and smallest diameter (length /, and width w, respectively) of each aggregate were marked on the screen and recorded. In general, these were the horizontal and vertical diameters, respectively, as would be expected for such somewhat irregular bodies at intermediate Reynolds —values (Becker, 1959; Clift et al., 1978). The aggregate diameter d (m) was defined as d — (l + w)/2. The total number of aggregates analysed per sample was between 200 and 1400. All diameters measured were attributed to diameter classes, while numbers- in each class were normalized with respect to sample volume. According to Shieh et al. (1981), such size distributions were characterized by their Sauter mean diameter ds (mm):
ds = I^id^VIinHd)2
with: (': indication of diameter class; n1: number of aggregates in class i (1—1); dl: mean diameter of class (' (mm). Theoretical settling velocities of aggregates. Assuming sphericity and specific density pa, theoretical settling velocities were calculated (Lapple & Shepperd, 1940):'
Voo = [4-(pa-p)-«-d3/3-p-CD]i
with: vœ: terminal settling velocity (mm/s); p: density of water (g/ml); g: acceleration due to gravity (mm/s2); Cr>' drag coefficient ( - ) . The expression 18.5/(Re)0-6 was used as an estimate for the drag coefficient Crj (Re: sphere Reynolds number, —). Diameter-— dependent pa —values were substituted from experimental observations (cf. Fig. 4). Percoll gradients: simultaneous measurement of density and diameter of individual aggregates. Specific densities of bacterial aggregates were measured by centrifugation in isopycnic density —gradients of Percoll (Pharmacia, Uppsala). Gradients were prepared from suspensions of Percoll (Anonymus, 1980). To allow internal calibration, a mixture of density marker beads was added (DMB, Pharmacia, Uppsala; Anonymes, 1980). A 0.25 ml sample from the reactor (with 35 — 55^ aggregates) was placed directly bji top of the gradient and centrifuged for 5 min (700xg), whereafter aggregates had equilibrated at their buoyancy position. Subsequently, gradients were photographed (35 —mm camera« 135 —mm lens; linear magnification ca. 0.5). To minimize refraction, the centrifuge tube* was placed in a transparent 'square container with water. After projection' of the negatives (final linear magnification ca. 10), length and width of each aggregate were measured, and a diameter was established as defined êfbove. According to its vertical position in the tube, each aggregate was attributed to a density class. Appropriate density classes were chosen from the positions of the respective DMB —bands.
RESULTS
Fig. 2 shows the time courses of the concentrations of biomass, glucose, and of various metabolic products after after the dilution —rate shift —up that induced aggregate formation from freely suspended cells. Subsequently, operating conditions (D = 0.6 h— ' ) were prolonged until r = 400 (r = D-t, — ; D:'dilution rate, h _ 1 ; (; time, h). After a transient maximum in glucose concentration, a peak value in reactor biomass concentration xT of 15 g/1 (dry weight) was observed to coincide with complete substrate conversion at T = 60 (Fig. 2^). The production of large amounts of propionate from glucose fermentation (Fig. 2a) is characteristic for so —called HPr —aggregates (propionate-forming aggregates; Beeftink & Van den Heuvel, 1987).
After the initial maximum, xr — values were seen to fluctuate; over prolonged periods of time, however, xr decreased. Accordingly, biomass retention (R = xr/xt, — ; xe: effluent dry—weight biomass concentration, g/1) decreased from R = 11 to R = 3 (at
164

Fig. 2 : AGLR characteristics after dilution —rate shift —up at r = 0 from D = 0.2 to 0.6 h~>. Numbers indicate aggregate samples at T = 32, 44, 60, and 100. Fig. 2 a : Concentrations of volatile fatty acids; C2 : acetic acid; C3 : propionic acid; C4: butyric acid; C5 : valeric acid; Fig. 2" : Glucose concentration (Glc); reactor and effluent biomass concentrations (xr and xe, respectively); Fig. 2C : Specific growth rate (ß).
T i
CO
>> rt V
« p
C) W>
^ G
rt C
a o
O e?
• a l W5 * - •
se
IC «
200 -* time T ( — )
T = 60 and T = 400, respectively). Fluctuations were observed also in the concentrations of volatile fatty acids, but the
general pattern did not change once retention had been established (propionate in excess of acetate and butyrate). The only exception was found with valerate, which was formed at increasingly higher rates with progress of time (Fig. 2a). , From the biomass data in Fig. 2^, specific growth rates were calculated (Fig. 2C). 'Due to very low concentrations, biomass data between T = 0 and T = 20 were not considered for calculation. From 20 to 60 T, /X decreased to reach a minimum (0.06 h— ' ) . In agreement with the subsequent decline in R, fi— values were then
165

Fig. 3
0.4 1.0 2.0
-» aggregate diameter d (mm)
Fig. 3 : Percoll density gradient, containing large aggregates at the top (low specific weight) and small aggregates near the bottom (high specific weight). Fig. 4 : Relation between specific density pa and diameter d of bacterial aggregates at various stages after reactor start—up (sample numbers 1 to 4 correspond to T = 32, 44, 60, and 100, respectively; cf. Fig. 2).
increasing again. This increase was first very pronounced, but more gradual later on. Ultimately, fi-= 0.25 h — ' was attained between T = 300 and 400.
At different instants during reactor operation, samples were withdrawn from the AGLR for density/diameter analysis on aggregates with the aid of Percoll gradients. Fig. 3 presents a typical result. Apparently, smaller aggregates had found their buoyancy position in the lower parts of the density gradient, i.e. had a high specific density p a ; larger aggregates had lesser specific densities and were seen at higher positions in the gradients. Fig. 4 gives data on the relation between d and p a for four such samples (sampling times indicated in Fig. 2). In each case, an apparently linear negative relation between pa and log (d) was found. Howevfer, whereas aggregates from the earliest sample (no. 1, T = 32) were relatively heavy at all diarneters, a general decrease in density with time was observed with later samples.
At the same four instants as above (no.s T—4; cf. Fig. 2), aggregate —containing reactor samples were subjected to a settling —velocity/diameter (vjd) analysis on individual aggregates; the results are given in Figs. 5 a to 5e*. The earliest sample (Fig.* 5a) represents the onset of aggregate formation, wh^n glucose conversion ,was still incomplete (cf. Fig. 2^). Low numbers of aggregates were observed with diameters ranging from 0.25 to 2 mm. As would be expected, t.he »larger aggregates had higher settling velocities.
The next sample (Fig. S*7) showed a considerable increase in the maximum diameter (up to 3.5 mm), as well-as in tne total number" of aggregates.
Subsequently (Fig. 5C), glucose conversion was complete and biomass hold —up R was at its maximum. Comparison with the previous sample does not reveal significant changes in numbers or maximum diameters. Strikingly, however, a general decrease in settling velocity was observed. For large aggregates, this decrease was particularly prominent. Apparently, settling velocity was almost diameter—independent for d > 2 mm.
Finally (Fig. 5e1), the reactor biomass concentration and hold —up had decreased again after their initial maxima, and the specific growth rate had increased. The most significant difference with the preceding sample is the complete dissappearance of aggregates with diameters exceeding 2.5 mm.
The trend in aggregate diameters in these samples 1 — 4 may be judged more quantitatively from Figs. 6a — 6". Size distributions for all four samples are shown, which were normalized with respect to sample volume. Characterization of all four
66

Fig. 5 : Relation between settling velocity v^ and diameter d for individual aggregates at four stages after shift-up. Fig. 5 a : Sample 1, r = 32. Fig. 5 b : Sample 2, T = 44. Fig. 5C : Sample 3, T = 60. Fig. 5 d : Sample 4, T = 100. Drawn lines: theoretical velocities (see text). Fig. 6 : Histograms of diameters at four stages during aggregate development (cf. captions Fig. 5); arrows: Sauter mean diameters rf§.
Fig. 5 Fig. 6
diameter d (mm) diameter d (mm)
distributions by their Sauter mean diameter ds reveals a sharp increase between T = 32 and T — 44, and a decrease again from r = 60 to T = 100.
Several samples were analysed after r = 100, but although some fluctuation in biomass and fatty—acid concentrations was persistent, the general picture for vjd relations as represented in Fig. 5^ remained unchanged (data not shown).
Occasionally, very small aggregates with high settling velocities were observed (d = 0.4 mm, vœ = 30 mm/s). Such aggregates were encountered in particular shortly after start —up. From the combination of their size and settling velocity, it is concluded that 'these aggregates contain sand (bare sand grains were found to have a settling velocity of 35 - 40 mm/s).
Theoretical settling velocities (Figs. 5 a - 5d) were calculated from d and and from
167

experimentally determined pa — values. A comparison with experimental data shows a qualitative agreement. A constant, diameter —independent density would have resulted in a slightly upward curvature for vjd relations, but the present expression predicts the decreasing slopes that were observed experimentally. However, predicted values for vx
were consistently too high.
DISCUSSION
From the data obtained on prolonged AG LR operation, it is apparent that a true steady state did not become established readily upon formation of aggregates. Reactor biomass concentration xr and biomass hold —up R gradually decline after initial peak values, and ultimately levelled off at r = 100, thus allowing continued reactor operation at elevated D — values. In fact, the experimental run shown in Fig. 2 was continued until T = 600, maintaining complete substrate conversion all the time.
From data on biomass concentrations xr and xe on the one hand, and from the physical characteristics of the aggregates on the other, a scenario -may be constructed for the events between the onset of aggregate formation (r = 20) and the stabilization of reactor performance around r = 100. Specific growth rates showed a sharp decline upon aggregate formation, while at the same time glucose conversion was almost complete (Table 1; cf. Fig. 2). Such a decrease in \i was observed before (Beeftink & Van den Heuvel, 1987) and is attributed to increasing transport limitations for substrate.
Surprisingly, however, an increase in ft—values was observed when the growth — — limiting substrate glucose was already fully depleted. An explanation for this phenomenon is obtained from the size distributions of aggregates. Table 1 shows the increase in /t to coincide with a decrease in aggregate diameter as represented by their Sauter mean diameter ds. When bulk—liquid glucose concentrations are assumed to remain constant and negligibly low from r = 60 onwards, the general decrease in aggregate diameter ds would relieve limitations in glucose transport. As a consequence, the average substrate concentrations within aggregates would be higher, thus facilitating more rapid growth. The data obtained on dimensions of aggregates do support for this conclusion.
From data on specific density and settling velocity of aggregates, an explanation for the disappearance of large aggregates (d > 2.5 mm) between r = 60 and T = 100 can be inferred. Direct measurements of specific density showed a negative relationship with aggregate diameter, which was the rnost prominent when bulk—liquid glucose concentrations became vanishingly low. At later stages, therefore, large aggregates lose in settling velocity to such an extent, that v^ becomes jalmost diameter —independent,for d > 2 mm. Likely, the efficiency with which such aggregates are^retained deteriorated due to their worsened settling characteristics. , A
The specific aggregate density pa was shown experimentally to decrease with time an3 with aggregate diameter. Simultaneously, an . increasing » production, of valeric acid was observed. These data are in good agreement ' with the previously stated hypothesis on lysis within large aggregates due to substrate insufficiency fBeeftink & Van den Heuvel, 1987). Microscopic evidence for "hollowing" of large aggregates by autolysis has been presented before (Beeftink & Staugaard, 1986), and was reported for mold pellets also
Table 1 : Comparison of specific growth rate [i (h~ ' ) , Sauter mean diameter ds (mm), and glucose concentration glc (g/1) at subsequent times r (—) during reactor start—up; nd : not detectable.
T
32 44 60
100
M
0.22 0.07 0.06 0.18
ds
1.31 1.83 1.78 1.11
glc
2.9 0.3 nd nd
168
(Clark, 1962). Conceivably, such "hollow" structures are more susceptible to shear stress from the reactor liquid. In addition to the abovementioned wash —out therefore, disappearance of large aggregates may have resulted from their désintégration also.
Changes in microbial population composition could contribute to time spans required to establish stable conditions. Characteristic times would depend on differences in specific growth rates of the various population components. Due to biomass hold —up, specific growth rates are low; consequently, relaxation times greatly exceeding the mean liquid residence time might be involved. However, population changes were not immediately obvious from the mean metabolic products, with the possible exception of valerate production by e.g. Clostridium kluyveri (Bornstein & Barker, 1948).
In summary, the stabilization of reactor performance depended on changes in aggregate properties. Depletion of the growth —limiting substrate after a transient glucose peak triggers a rearrangement of aggregate characteristics; the time span required for its completion presumably will reflect the relaxation times of the processes involved (in particular autolysis). Subsequent reactor operation was highly stable in terms of substrate conversion, although the establishment of formal steady —state conditions remains uncertain, as some fluctuations in metabolic products were persistent. Even so, the general metabolic pattern remained unchanged.
The present report employs Percoll density gradients to measure the specific mass of bacterial aggregates in a direct experimental way. The diameter —dependend specific density established this way was used to calculate settling velocities as a function of aggregate diameter. These calculated velocities were consistently higher than experimental data on settling velocity, i.e. specific densities as measured with Percoll were seemingly too high. This discrepancy may be explained on the basis of shape factors: bacterial aggregates are not perfect spheres, and may contain pockets of liquid at their jjerifery. Such pockets may be taken as part of either an aggregate or of the bulk liquid, depending on the experimental determination employed.
REFERENCES
Anonymus (1980). Percoll® , methodology and applications; density marker beads for calibration of gradients of Percoll®. Pharmacia Fine Chemicals, Uppsala.
Becker, H. A. (1959). Effects of shape and Reynolds number on drag in the motion of a freely oriented body in an infinite fluid. Can. J. Chem. Eng. 37:85 — 91.
Beeftink, H. H., and P. Staugaard (1986). Structure and dynamics of anaerobic bacterial aggregates in a gas—lift reactor. Appl. Environm. Microbiol. 52:1139—1146.
Beeftink, H. H., and J. C. van den Heuvel (1987). Novel anaerobic gas-lift reactor (AGLR) with retention of biomass: start —up routine and establishment of hold —up. Biotechnol. Bioeng., 30:233-238.
Bornstein, B. T., and H. A. Barker (1948). The energy metabolism of Clostridium kluyveri and the synthesis of fatty acids. J. Biol. Chem. 172:659—669.
Brohan, B., and A. J. McLaughlin (1984). Characterization of the physical properties of yeast floes. Appl. Microbiol. Biotechnol. 20:16 — 22.
Clift, R., J. R. Grace, and M. E. Weber (1978). Bubbles, drops, and particles. Academic Press, New York.
Lapple, C. E., and C. B. Shepherd (1940). Calculation of particle trajectories. Ind. Eng. Chem. 32:605-617.
Magara, Y., S. Nambu, and K. Utosawa (1976). Biochemical and physical properties of an activated sludge on settling characteristics. Water Res. 10:71—77.
Shieh, W. K., P. M. Sutton, and P. Kos (1981). Predicting reactor biomass concentration in a fluidized—bed system. J. Water Poll. Contr. Fed. 53:1574—1584.
Tambo, N., and Y. Watanabe (1979). Physical characteristics of floes - I. The floe density function and aluminium floe. Water Res. 13:409—419.
Timmermans, P., and A. van Haute (1984). Influence of the type of organisms on the „ biomass hold—up in a fluidized—bed reactor. Appl. Microbiol. Biotechnol. 19:36—43.
169

LIGHT AND SCANNING ELECTRON MICROSCOPE OBSERVATIONS ON THE GRANULAR BIOMASS OF EXPERIMENTAL SBAF AND HABR REACTORS
A. Tilche & X. Yang1
ENEA - Laboratório Intervent! Dimostrativi, Bologna, Italy
Summary
A 125 1 S ludge Bed Anaerob ic F i l t e r (SBAF) and a 150 1 Hyb r i d i z ed Anae r ob i c B a f f l e d R e a c t o r (HABR) were u t i l i z e d t o t r e a t m o l a s s e s s t i l l ä g e e v a p o r a t o r c ondensa t e s i n me soph i l i c c o n d i t i o n s . Us ing l i g h t and s c a n n i n g e l e c t r o n m i c r o s c o p y , t h e p r e d o m i n a n t methanogens were ob se rved . The p r edominan t methanogen was Me t h ano t h r i x s p . i n b o t h r e a c t o r s . In t h e HABR r e a c t o r , however , g r a n u l e s and f l o e s c o n t a i n i n g two t y p e s of Me thanosa rc ina s p . c y s t s were a l s o ob se rved . A number of c u rved c e l l s , m o r p h o l o g i c a l l y s i m i l a r t o D e s u l f o v i b r i o s p . were obse rved i n t h e g r a nu l e s of t h e SBAF r e a c t o r . K eywo rd s : a n a e r o b i c d i g e s t i o n , g r a n u l a t i o n , M e t h a n o t h r i x , Me thanosa rc ina .
I n t r o d u c t i o n
I n m e t h a n o g e n e s i s , t h e r o l e of a c e t o c l a s t i c b a c t e r i a i s of t h e g r e a t e s t impo r t ance , b ecause i n t h e d i g e s t i o n of complex s u b s t r a t e s , more t h an 70% of methane d e r i v e s from a c e t a t e c l e a v a g e . Up t o now, o n l y two g ene r a - Me t h ano s a r c i n a and Me t h ano t h r i x - a r e known t o be a b l e t o p r oduce methane from a c e t a t e . M e t h a n o s a r c i n a shows a h i g h e r |Xmax (~ 0 .45 d '1) and h i g h e r Ks (~ 5 .5 mM a c e t a t e ) , wh i l e Me thano th r ix has a lower H ^ ^ ( 0 . 1 d"1) bu t shows a much h i ghe r a f f i n i t y f o r a c e t a t e , t h e r e f o r e a l ower ~~KS (~ 0 .7 mM a c e t a t e ) (Harper and Pohland , 1986) . Th is makes Me thano th r ix c o m p e t i t i v e wi th
Me thanosa rc ina a t low a c e t a t e c once r t f r a t i on s . The two g ene r a a l s o show d i f f e r e n t b ehav iou r as**far a s t h e a t t i t u d e t o form heavy g r a n u l e s i s c o n c e r n e d . In f u l l s c a l e UASB p l a n t » , M e t h a n o t h r i x i s d e s c r i b e d a lmos t a l w a y s , a s ' t h e s o l e + a c e t p c l a s t i c methanogen p r e s e n t , wh i l e M e t h a n o s a r c i n a g r a n u l e s (or a g g r e g a t e s ) a r e d e s c r i b e d on ly i n p u r e c u l t u r e o r un<£er> l a b o r a t o r y c o n d i t i o n s , w i t h low pH and c o n s t a n t v o l a t i l e ' f a t t y a c i d s o v e r l o a d ( L e t t i n g a e t a l . , 1983) . Th is f a c t i s p a r t i a l l y due t o t h e s t a r t - u p p r o c edu r e u s u a l l y adop ted f o r UASB p l a n t s , where t h e l o a d i n g r a t e i s i n c r e a s e d s t e p w i s e on ly when s t a b l e low c o n c e n t r a t i o n s of VFA a r e a c h i eved . Ano t h e r e x p l a n a t i o n can be t h e p r e s e n c e , i n t h e l i f e c y c l e of Me thanosa ro i n a , of a s i n g l e c e l l s t a g e (Wang e t a l . , 1 986 ) , d u r i n g which a washout i s ve ry e a sy . I t i s e v i d e n t t h a t i n UASB r e a c t o r s t h e s t r a t e g y i s t o o b t a i n M e t h a n o t . h r i x g r a n u l e s t h a t a r e more e f f e c t i v e i n a c h i e v i n g low e f f l u e n t COD c o n c e n t r a t i o n s , b e c a u s e of t h e i r h i g h e r s u b s t r a t e
1 . Dr . Yang has c a r r i e d ou t t h i s work w i th t h e s u ppo r t of ENEA and t h e I n t . Cen t r e f o r T h e o r e t i c a l P h y s i c s , T r i e s t e , I t a l y . P r e s e n t a d d r e s s : D e p t . of B i o l o g y , B e i j i n g T e a c h e r s C o l l e g e , B e i j i n g , China .
170
affinity. In plug-flow reactors or in phase reactors, like Anaerobic Baffled Reactors for example, the higher activity of Methanosarcina can be used in the early phases of the reactor, where high acetate concentration can be maintained. The possibility of obtaining granules enriched in Methanosarcina can make the biomass more active and more resistant to shock loadings. One of the aims of the experiments, carried out in a parallel fashion on two small pilot scale reactors - a Sludge Bed Anaerobic Filter (SBAF) and a Hybridized Anaerobic Baffled Reactor (HABR) -operating on molasses stilläge evaporator condensate, is to investigate the differences in floe or granule formation between the two reactors and their different behaviour under increasing loading rates.
Materials and Methods
A Sludge Bed Anaerobic Filter (SBAF) and a Hybridized Anaerobic Baffled Reactor (HABR) have been used. The SBAF (Fig. 1) had a working volume of 125 1; it was a plexiglass® column of 28.4 cm internal diameter and 2.03 m height, with the liquid level at 1.90 m from the bottom. The upper third of the reactor was filled with a plastic media (Pall Rings 0 38 mm) presenting 94% void spaces and a specific surface of 143 m2/m3. The HABR (Fig. 2) had three chambers and a final settler. The working volume of the three chambers was 150 1. The settler volume (10.5 1) is not considered as an active volume because any sludge present was always recycled to the first chamber. The dimensions of the chambers were 20 cm L, 25 cm W,100 cm H.
The first two chambers presented, close to the surface level, a 10 cm layer of plastic media (Pall rings the same as before), while the third chamber had the upper half filled with a modular corrugated block (ECO-TRICK® 200 m2/m3, 98.5% void space). Each chamber gas phase was separated from the others, in order to measure gas production and composition separately. TS, VS, TSS, VSS and COD were determined according to Standard Methods (APHA, 1980) . Volatile fatty acids were determined using a DANI 8510 gas Chromatograph equipped with a 2 m glass column (6x2 ID, filled with 1-1965 GP 10% SP1200/1% H3PO4 on 80/100 CHROMOSORB W AW) and a flame ionization detector. Total Carbon (TC) and Total Inorganic Carbon (TIC) were determined using a Dohrmann DC 80 high temperature reaction module coupled to a Horiba IR detector. TOC was calculated from TC and TIC values. Gas production was measured with a Elster Handel G.00 wet test gas meter. Methane and carbon dioxide in the gas were determined using a Leybold Heraeus BINOS 1 infrared analyzer. Hydrogen in the gas was analyzed with a GCI Hydrogen Exhaled Monitor after having removed the hydrogen sulfide by means of passing the gas through a 1.5 M zinc acetate solution. Several sampling ports were distributed along the reactors; samples were taken anaerobically by means of a piston-like sampler. Light microscope observations were made using a JENALUMAR A/D CONTRAST microscope in epifluorescence or in epifluorescence coupled with positive phase contrast or with Nomarsky interferential contrast for wet mounts, and in bright field stained (crystal violet) mounts.
71

©
©
© T T -
% rïïn -•
Effluent How Meter
Fig. 2. Schematic of the f ^ Hybridized Anaerobic Baffled Nutrients R e a c t o r
Table 1. Nutrients added to the feed expressed as concentration in the influent.
In the first three weeks From the fourth week
F ig . 1. Schematic of Bed Anaerobic F i l t e r
Peristaltic Pump I
the Sludge
CONSTITUENT Sugar Sodium Acetate Yeast Extract NH4CI
MgS0„-7H20 "FeCI3
KH2P04
K2HP04
CaCI2 '
CoCI2-6H20
NiC]2-6H26 '
MnCI2-4H20 H3B04
2nCI2
NaMoO„-2H20 NH4V03
mg/l 4000
625 1000 1000
400 300
250
250
100 .
10
10
0.8
0.5 0.5
0.5 0.5
CONSTITUENT NH2CONH2
(NH4)2HP04
Yeast Extract KCl |
MgS04
CaCI2
FeCI2-4H20
CoCI2-6H20
MrCI2-4H^O
(NaP03)6 '
NiCI26H20
ZnCI2
NaMo04-2H20 NH4V03
H3B03
mg/l 200 100 100 25
10 10
.2. 2*
0.5
0.1
0.05
0.05
0.05 0.05
0.05
For scanning e l e c t r on microscopy, a PHILIPS SEM 505 was used. Samples were f i x ed i n phospha t e b u f f e r c o n t a i n i n g 2.5% glutaraldehyde for 30 min. The osmolal i ty of the f ix ing so lu t ion was t he same as the one of t h e sample, measured with a Hermann Roebl ing Automatic Micro-Osmometer. After washing in t h e same buffer and r i n s i n g , samples were dehydrated in graded e thanol s e r i e s and d r i ed a t the c r i t i c a l po in t with l i q u i d CO2, us ing a CPD 020 BLAZERS UNION. F ina l ly , samples were sput te r coated with gold.
72

The wastewater used was molasses stilläge evaporator condensate taken continuously from a distillery. Its average composition was, as percentage of total COD, -55% Acetate, -25% Ethanol, -10% Butyrate, -3% Propionate, and the remaining -7% higher alcohols and higher VFA. COD varied from 5000 ppm to 10000 ppm depending on the degree of cleaning of the evaporator. COD/TOC ratio of the influent was around 3.5. pH was about 3.5. Being almost absent, nutrients and micronutrients were added to the influent. During the first three weeks, a start-up solution was added containing sugar and sodium acetate. From the fourth week, a different nutrient and trace elements solution was added. Final nutrients concentration in the wastewater are reported in Tab.1. pH was corrected to 5.0+5.2 by adding 1.5 M NaOH to the influent with a metering pump. The seed material for the two reactors was obtained from a digester treating municipal sewage sludge. Moreover, an enriched culture obtained in the laboratory using methanol as the sole carbon and energy source was added. The initial biomass contents were 7.3 g VSS-1"1 and 5.3 g VSS-1-1 in SBAF and HABR respectively. Both reactors operated at the same temperature (37 ± 0.5 °C) . Recycling of the sludge from the settler of HABR to the bottom of the first chamber was done only periodically, when some sediment layer of biomass was present. Overall loading rates have been gradually increased up to a maximum of 10.5 g COD-l-M"1 and to 5.5 g COD-l^-d"1 for SBAF and for' HABR respectively. Unfortunately, it was not possible to increase the loading over these figures, because the experiment was forced to stop due to the unexpected closing down of the factory.
Results
In steady state conditions, 110 days after the start-up, the analysis of the profile of the two reactors showed that in the SBAF, 95% of the total soluble COD destruction was due to the 15 cm layer of sludge on the bottom of the reactor which had a density of 21.8 g VSS-1"1 and represented around 67% of the reactor biomass; the upper part of the reactor can be assimilated to a completely mixed reactor. Otherwise in the HABR the first chamber produced around 70% of the overall methane production, with a biomass amounting to only 10% of the total VSS accumulated in the reactor. In both cases, overall soluble COD destruction was around 98%. The sludge load calculated only in the most active areas of the reactors, in the first chamber of HABR was 4+5 g COD-g-1 VSS-d"1, while in the sludge of the SBAF only -1.9 g COD-g-1 VSS-d"1. Granulation occurred in the HABR one month after the start-up, but a predominant flocculated biomass was always present. Granules were very small, 0.3+1.5 mm in diameter, and of weak consistence. In the SBAF, granulation occurred later, but in the third month after the start-up, the granulated population became predominant. Granules were bigger and resistant, 0.5+3 mm in diameter; the majority of the granules were dark, but part of them showed a light grey colour, without showing in the microscope observations any significant difference in bacterial composition. In Scanning Electron Microscope observations, the low magnification micrograph shows a regular surface for SBAF granules (Fig. 3a) . At higher magnification (Fig. 3b), the surface of SBAF granules seems
173

to be composed mainly of Methanot.hrix-like organisms. Bulges and septa between individual cells and the flat ends of the filaments can be distinguished. Moreover (Fig. 3c) curved cells with a polar flagellum, morphologically similar to Desulfovibrio sp. , are frequently observed. In HABR, the surface of fIocs/granules is highly irregular, showing the presence of Methanosarcina cysts (or clumps). In samples taken from chamber 1, two types of cysts were observed; one was very large (Fig. 3d), up to 50 |lm in diameter, the second smaller, composed of only few cells (Fig. 4a). Some bigger cysts were found linked together by a filamentous matrix of Methanothrix-like organisms (Fig. 4b). In samples taken from the bottom of chamber 2, cysts up to 10 |Im in diameter were observed, (Fig. 4c) and smaller cysts were mainly found at the top of chamber 2 (Fig. 4d). In chamber 3, floes were composed predominantly by short filaments of Methanothrix-like organism and by organic matrix. The observations with the light microscope gave few different results. When wet mounts of crushed dispersed granules were observed in epifluorescence or in epifluorescence coupled with positive phase contrast or with Normarsky interferential contrast, a number of fluorescent organism were observed. In HABR samples from chamber 1 and 2, filamentous Methanothrix-like bacteria were almost non-fluorescent, while big and small Methanosarcina-like organisms showed a blue-green fluorescence, and short rods, probably Methanobacterium. showed a bright-blue fluorescence. In SBAF samples, contrary to SEM observations, some Methanosarcina cysts and some single cells were observed, probably present inside the granules.Stained samples showed a number of morphologically different bacteria in samples from both reactors, although HABR samples showed a higher variability. SBAF samples had Methanothrix as the predominant bacterium, but showejd, also in the light microscope observations, the presence of curved cells,{-resembling Desulfovibrio sp. , ' . < * * '-
w Discussion ,„
The predominance of acetoclastic bacterid both in SBAf and in HABR depended firstly on the waste composition; stechiometric accounts demonstrated that, with the wastewater described, more than 90% of methane resulted from acetate cleavage. In fact, when hydrogen was analyzed, it never exceeded 4-10-4 atm even under overloading conditions. The highest hydrogen concentrations were found in the gas of the first chamber of HABR, but the calculated hydrogen turnover rates were only as low as 6 sec-1 for SBAF and 15 sec-1 for HABR 1st ch. An explanation of the presence of Methanosarcina sp. in HABR and of its almost total absence in SBAF can be attempted. The sludge from the first HABR chamber received a higher acetate loading than the one from the SBAF bottom. In fact, in the bottom of the first HABR chamber, acetate concentration was around 1000 ppm COD, while in the bottom of the SBAF the concentration was ten times lower; the acetate concentration approached the saturation concentration for Methanosarcina in the first case, and for Methanothrix in the second case. However, the apparent sludge
74

Fig. 3. a) low magnification of a granule from the SBAF; b) close view of the surface of the same granule; c) high magnification micrograph of the curved cells with polar flagellum, morphologically similar to Desulfovibrio sp.; d) big Methanosarcina cyst from the first HABR chamber.
75

Fig. 4. a) low magnification micrograph of a floe from the first HABR chamber, showing Methanosarcina clumps linked together by filamentous bacteria; b) small Methanosarcina cysts from the top of the first HABR chamber; c) some bigger Methanosarcina cysts from the bottom of the second HABR chamber; d) smaller clumps from the top of the second HABR chamber.
176

activity was higher in the HABR, around 4-gC0D-g-1VSS-d~1, while in the SBAF it was ~ 1. g-gCOD-g-iVSS-d"1. After accidental loading stops due to electricity breakdowns, gas production in the SBAF stopped almost immediately, reaching 100% again only 2 h after the new start. The HABR, in the same situation, showed a very long (up to 24 h to steady state) and smooth decrease in gas production, and restarting was very long as well, around 6-10 h to get a stable 100% gas production again. This shows that the HABR has a plug-flow pattern and the SBAF a CSTR pattern. Moreover, if this observation is related to the profile, it is evident that in HABR, after a feeding stop, still a considerable amount of substrate remains in the first chamber to be metabolized. At the new start, it is necessary to build up the substrate concentration before obtaining conditions for high substrate removal rate for Methanosarcina. In any case, the activity measured on HABR sludge is high enough to justify the interest in obtaining granules containing Methanosarcina as the dominant acetoclastic organism for phase reactors, like the HABR. Another explanation of the presence of Methanosarcina in the HABR can be the lower turbulence due to gas evolution. Superficial gas loading rates reached maximum values of 5 m-d"1 for the 1s t HABR chamber compared to 9 m-d-1 in the SBAF. These figures, which are low as absolute values, in shallow laboratory reactors give rise to considerable differences in the turbulence. Under these conditions, Methanosarcina was washed out early from the SBAF reactor, but was retained in the HABR, even though periodic recycling of the sludge from the settler is necessary to maintain it in the system. The presence of Desulfovibrio sp • in anaerobic communities of reactors treating low sulphate-containing wastewaters has already been described by Zeikus et al. (1985). They recognized the ability of the Dfisulfovibrio to act as a syntrophic acetogen in the conversion of ethanol to acetate.
If the observations are confirmed by isolation work, it may be possible, as Chartrain et al. (1987) have already claimed, using whey as substrate, to design a 4+5 species population able to treat the wastewater used in the experiment.
Conclusions
Poor attention was given to the conditions of development of Methanosarcina sp • aggregates or granules, because in the UASB reactors low acetate concentrations, close to Kg values for Methanothrix , are necessary in order to obtain low COD concentrations in the effluent. In baffled reactors, however, like the HABR described, it is of greatest interest to obtain, in the early phases of the reactor, a granulated biomass containing Methanosarcina that shows higher activity on acetate. More research is needed to identify more precisely the described species and to study the best ecological conditions for stable Methanosarcina aggregate formation.
References
American Public Health Association, 1980. Standard Methods for the Examination of Water and Wastewater. 15*-*1 edition, Washington D.C. .
177

Chartrain, L., L. Bhatnagar and J.G. Zeikus, 1987. Microbial Ecophisiology of Whey Biomethanation : Comparison of Carbon Transformation Parameters, Species Composition, and Starter Culture Performance in Continuous Culture. Applied and Environmental Microbiology, 53:1147-1156.
Lettinga, G., L.W. Hulshof f Pol, W. Wiegant, W. de Zeeuw, S.W. Hobma, P. Grin, R. Roersma, S. Sayed & A.F.M. van Velsen, 1983. Upflow Sludge Blanket Processes. In: Proceedings of the Third International Symposium on Anaerobic Digestion. 14-19 August, Boston, Massachusetts, p. 139-158.
Harper, S.R. and F.G. Pohland, 1986. Recent Developments in Hydrogen Management During Anaerobic Biological Wastewater Treatment. Biotechnology and Bioengineering,28 : 586-602.
Wang, S.C., I.C. Tseng and L.C. Wang, 1986. The Characteristics of Methanosarcina and Methanothrix in Anaerobic Digester. In: Proceedings of the Water Treatment Conference. Amsterdam, the Netherlands, 15-19 September, p. 29-38.
Zeikus, J.G., M. Chartrain and J. Thieles, 1985. Microbial Physiology in Anaerobic Digestion. In: Proceedings of the Fourth International Symposium on Anaerobic Digestion. Guangzhou, China, 11-15 November, p. 453-475
175

STABILITY AND CONTROL OF UASB REACTORS TREATING POTATO-STARCH WASTEWATER: COMPARISON OF LABORATORY AND FULL-SCALE RESULTS
J. M. Paris; T. Vicent; M. D. Balaguer; C.Cassu; J. Cairo and J. Canals*
Universität Autönoma de Barcelona, Bellaterra, Barcelona, Spain *CIDA-Hidroquïmica, S.A., Barcelona, Spain
Summary
There is a lack of s to get on-plant info of UASB reactors. Sin used in wastewater appropiate for anaerob acids (VFA) by gas ch specific electrodes determination. Howev application in full-expensive equipment. been proposed in the 1 of anaerobic digester start-up and operation potato-starch wastewa simultaneously used wi and presents reactor Sludge granulation and also reported. Fina 800-cubic meter indus suitability of the discussed.
uitable, inexpen rmation about th ce pH and other treatment proce ic reactors, ana romatography or
are being er, such metho scale reactors A two end-point
iterature for th s. This paper d
of a 5,6-1, ter, where such th gas-chromato
performance f distribution w
lly, firts resu trial reactor above-mentioned
sive analytical methods e stability of operation
conventional controls sses are not normally lysis of volatile fatty hydrogen monitoring with used for instability ds are normally not of
due to the need of alkalimetric method has
e follow-up and control eals with results of the UASB reactor treating alkalimetric method was
graphy VFA monitoring, or HRT up to 12 hours. ithin the reactor are Its of the start-up of a are presented and the
alkalimetric method is
Introduction
It is well-known that two of the main drawbacks of the application of anaerobic digestion to wastewater treatment are the duration and characteristics of the start-up period, which often determines the feasibility of its application and the ultimate steady-state performance of the process, and the need of simple and accurate on~plant control systems for a rapid detection of instability.
So far, VFA G-C determination and hydrogen monitoring are not of application to full-scale plants because of investment and maintenance costs of the equipment which is needed for such controls. However, a simple, two end-point alkalimetric method has been recently reported (Ripley et al., 1986) for the follow-up and control of anaerobic reactors.
This paper reports laboratory results of the start-up of an UASB reactor treating potato-starch wastewater, concerning the maximum organic load applied, sludge granulation and distribution along the reactor and the application of that
79

alkalimetric method. First results of the start-up of a full-scale reactor agreed with laboratory figures. The feasibility of application to industrial reactor control of that alkalimetric method is discussed.
Materials and methods
Wastewater characteristics
The wastewater studied was the effluent of a potato-starch factory. Its main characteristics ranged as follows (in kg/m3): COD, 7,6-16,0; soluble COD, 5,9-15,2; pH, 5,2-6,0; ammonia nitrogen, 0,3-0,7; acetic acid, 1,4-2,6; propionic acid, 0,6-2,3; n-butyric acid, 0,2-2,9; and protein, 1,9-2,6.
Analytical methods
Total and soluble COD, and total and volatile suspended solids (TSS, VSS) were determined according to Standard Methods (APHA, 1981). Gas chromatography was used for VFA and biogas analysis.
Alkalimetric determination
Alkalimetric determinations were performed according to Ripley et al. (1986). Sulfuric acid 0,6 N was added to centrifugated samples supernatant to drop pH to 5,75 (partial alkalinity, PA, related to bicarbonate) and, then, to 4,3 (intermediate alkalinity, IA, related to VFA). The above-mentioned authors claimed that IA/PA ratio can be directly related to VFA accumulation.
Standard alkalimetric determination (APHA, 1981) was also done in full-scale follow-up. t
Scanning electron microscopy w
Samples were filtered on a 0,22-micrqns Nucleopore membrane and then fixed with glutaraldehydl, .and dehycfrated by air-drying. Afterwards, they were suppoçted on aluminium' and gold metallized for 3 minutes .at '1,4 kV and 20 mA. Observation was done with a scanning electron microscope ISI SuperIII-A. ^ ,
Laboratory experimental set-up
The UASB laboratory reactor had a total volume of 5,6 liters. It was kept in a thermostatised chamber at 30 C. Feed was heated to the operating temperature by flowing through a coil immersed in a thermostatic bath. Several sample ports were disposed along the digester. Gas production was measured by means of an electronic gas counter.
Full-scale plant
It consisted of two parallel UASB reactors of 800 cubic meters each. Pretreatment of the wastewater was done by
180

Screening, clarification and homogeneization.
Results and discussion
Laboratory reactor start-up
The inoculum source was anaerobically digested sewage sludge, with a volatile suspended solids concentration of 18,2 kg/m3. The reactor was filled to the 50% of the working volume with such sludge, the rest being tap water, thereby yielding a final VSS concentration of c.a. 9 kg/m3. An initial organic load of 0,05 kg COD/kg VSS.d was applied, by diluting the wastewater in order to reach a hydraulic retention time of 5,6 days. Recycling of effluent was done as necessary to expand the sludge bed.
Increasing organic loads were applied up to 3,56 kg COD/m3.d with the same HRT and decreasing feed dilutions. Figure 1 shows the organic load, COD removal and VFA concentration within this period. The initial, high VFA figures related to inoculum characteristics. When that concentration was considered low, the organic load was gradually increased up to its final value. Then, a significant acidification appeared. However, the reactor recovered and COD removal increased rapidly to 80% and remained constant until the end of/ this period.
Steady state performance
Table 1 shows the performance of the lab reactor, which was controlled by using the above-mentioned alkalimetric method.
Table 1. Performance of laboratory UASB reactor.
HRT (d)
5,6 4,0 3,0 2,0 1,0 0,5
Loading rate (kg COD/m3
3,5 4,0 2,8 5,9 9,8
17,5
d) COD removal
(%)
78,9 82,6 91,5 92,3 93,7 85,0
VS removal (%)
93,5 93,8 73,5 73,0 72,3 73,1
biogas prod. (m3/m3.d)
1,07 1,52 1,09 2,50 5,00 8,04
These figures permit to conclude that a rather high organic load can be applied with such wastewater when using that start-up procedure, the process yielding biogas production rates as high as 8,04 m3/m3.d with removal efficencies as high as 85% (as total COD).
Alkalimetric follow-up
Figure 2 shows the VFA concentration, the intermediate alkalinity and the IA/PA ratio during the start-up period. It can be observed that such that ratio is more sensitive than the VFA alkalinity (IA) and can be better used for a quick
181

a — s i
s 3 T> O
U_J fl D
• -J <1
O j J O ft
OJ3 Ö.S
* > X +
01
10 E
3-^
S I
.a Co N
3
"l S"I 8*1 C-p 9"0 I'D 0-
(,.1°6) VdA OTI 08 0* 0
(2) 1M0MJ Q03
i 1 1 1 1 -O"» 8"S r-8 9M 3"0 0-0
182

g
3
S
8
8
S
T ï
o is 4 -J
•o o U _ J a -u U U U t. _» d
- . u C « - ) o o > L . .^~> 1 >-OiJ O i j a * » 3 k. O
•J.Ö O.CÏ
Ä>X +
0"I S"I t'\ C"P 9*0 £"0 0"0 ( , . 1 "0 ) VdA
-i r 9"! «"I 8"0 r«o O'O
Vd/VI 0 « " 0 80"0 00"0
(,.1°b8) VI
183

detection of reactor souring. From these figures it can be concluded that a stable operation of the reactor can be assured if that parameter is kept below 0,4.
Sludge granulation and distribution
Flocculant sludge appeared to be uniformly distributed along the reactor. According to Table 2, a highly inorganic sludge accumulated at the bottom of the reactor. It agreed with electron micrographs (Figure 3), which showed abundant mineralized granuls.
Fig. 3. Mineralised granuls found at reactor (long bar représents 100 microns*).
On the other hand, after the settl'i contained a low suspended solids cone percentage of organic matter mainly compo Most of the reactor was occupied by fl granuls of some milimeters were found partial aspect of one of such granu concerns a magnification of that zone Methanotrix is the predominant microor act as the matrix support of the whod granul.
the bottom of the
ng device, effluent entration with a high sed of Methanotrix. occulant sludge where
Figure 4A shows a Is, whereas Figure 4B
It appears that ganism which seems to e structure of the
Full-scale start-up
The start-up procedure tested at laboratory scale was used to start-up a full-scale plant. The inoculum source was anaerobic sewage sludge which yielded an initial concentration within the digester of 6,5 kg VSS/m3. Performance agreed with
184

Fig. 4. Micrograph of granular sludge (4A, long bar equals 10 microns; 4B, long bar equals 1 micron).
185

Table 2. Distribution of suspended solids along the reactor.
Level
1 2 3 4 5 6
1 : top ;
TSS (g/D
1,10 7,34 8,51 8,30 9,16
56,54
6: bottom
VSS (g/D
0,78 4,51 5,19 5,25 5,75
31,15
VSS/TSS (%)
71 61 61 63 63 55
that obtained at laboratory for the same loads and influent concentrations.
Both standard (APHA, 1981) and new alkalimetric methods were used in the reactor follow-up during this period. However, results of such analysis showed that the IA/PA ratio does not present a univocal relationship with the volatile fatty acids concentration, but resulted a function of total alkalinity. Therefore, it can be concluded that in despite of the goodness of that alkalimetric method for steady state control of UASB reactors, a more accurate follow-up, e.g. G-C VFA determination, must be undertaken for an optimal ultimate reactor performance.
References
Ripley, L. E., W. C. Boyle . & J. C. Converse^ 1986. Improved alkalimetric monitoring fox anaerobic digestion, of high-strength wastes. J.' Water Pollu^.. Control Fed., 58(5): 406-411.
APHA, 1981. Standard methods for the examination of water anc? wastewater. APHA-AWWA-WPCF, Washington. . *
186

METAL EFFECT ON MICROBIAL AGGREGATION DURING UPFLOW ANAEROBIC SLUDGE BED-FILTER (UBF) REACTOR START-UP
S.R. Guiot*, S.S. Gorur**, D. Bourque* and R. Samson*
National Research Council Canada *Biotechnology Research Institute, Montréal, Québec H4P 2R2 **Division of Biological Sciences, Ottawa, Ontario K1A 0R6
Summary
Metal based variables have been tested for their effect on anaerobic sludge granulation in a series of upflow anaerobic sludge bed reactors. The calcium ions had no effect on granulation induction at low levels of activity. The granulation process correlated with the increase in specific acetoclastic methanogen activity and in propionoclastic activity of the biomass when trace metals were supplemented.
Introduction
The common drawback to all UASB-like systems, whether'hybrid or not, regardless of design, is the initiation of dense and highly active granules. This is especially true for digested sewage sludge, which has poor viability and specific activity, and which is commonly used for inoculation of pilot- or scaled-up anaerobic systems.
Environmental, biological, and engineering factors have all been implicated in contributing to the granulation process. Since most bacteria have negatively charged surfaces (carboxyl and phosphate groups), it is expected that bivalent cations, namely Ca2 , could bridge charged groups on the bacterial surfaces. Concentrations of calcium ion in the range of 25-100 mg L - 1 increased the flocculation ability of anaerobic sludge and enhanced the rate of sludge granulation (Mahonney 1984, Hulshoff Pol et al. 1982). There is no evidence, however, that calcium can induce granulation of freely suspended and poorly active sludge.
The accumulation of extracellular polymeric substances (EPS) as capsular material as well as peripheral slime has been widely correlated with adhesion and aggregation processes (Costerton et al. 1981). It is suggested that EPS provides a matrix for formation of permanent bonds between juxtaposed cells, like specific link protein-sugar unit, hydrogen bond, polar bond. EPS synthesis is usually associated with carbon-limited growth conditions. However in some cases EPS production is dependent on relatively high growth rates and/or high specific metabolic activity of viable bacteria (Harris and Mdtchel 1973).
Hulshoff Pol et al. (1982) reported that a specific activity above 0.6 g COD g-^ VSS d-1 is a prerequisite for granulation process. The satisfaction of factors for optimal growth of

methanogens, like some trace metals (Murray and van den Berg 1981), could thus promote granulation.
In an effort to sort out the positive factors for granulation initiation, several variables have been tested in a series of reactors, inoculated with non-granulated sludge from a municipal anaerobic sewage digester and started up in parallel to a control run: presence of calcium ions (2 and 4 mM), with and without the presence of sodium ions; supplementation with trace metals (about 30 jiM on the whole) .
Material and methods
This comparative study was conducted with two sets of three upflow anaerobic sludge bed-filter (UBF) reaetors of similar size and configuration. Details of a UBF reactor have been given in previous papers (Guiot and van den Berg 1984, 1985). The design is similar here, but smaller in size. Briefly, reactors consisted of a cylindrical glass tube' (3.2 cm i;d. x 60 cm liquid height). The top quarter of the reactor was packed with polyethylene rings (Flexiring, Koch Inc.) floating against a screen. The liquid volume was 0.45 L. The effluent recirculation to feed ratio was 4:1.
All reactors were fed a synthetic sugar medium. In the first experiment, the medium contained (g L ): sucrose, 5 ; (NH4)HC03, l; NaHC03, 3.66; KHCO3, 4.36; (NH4)2S04, 0.25; K2HP04, 0.14; KH2P04, 0.1; yeast extract. 0.05. The Ca-positive fed reactor contained 2.35 g L - 1 CaCl2.2H20. Reactors supplemented with trace metals (TM) contained 0.2 % (v/v) of the TM solution. The TM solution contained (g L ): FeCl2.4H20, 2; H3BO.,, 0.05; ZnCl2, 0.05; CuCl2.2H20, 0.04; MnCl2.4H20, 0.5; (NH4)6Mo7024.4H20, 0.05; AlCIo, 0.03; CoCl2.6H20, 0.15; NiCl2.6H26, 0.1; Na-EDTA, 0.5; concentrated HCl, 0.1 % (v/v). In the second^experiment, the medium", contained (g L-1) : sucrose, 0.8; NH^-aceta-bg, 0.19; KH2P04, 0.09; yeast extract, 0.02; TM solution, 0.2 % (v/v); ,A tris[hydroxymethyl]-aminomethane, 12; HCl 1 N, 0.3 % (v/v)."* The medium of the two' Ca-positive reàcJtors contained 0.59 g L_ 1
CaCl2.2H20; that of the control and of one Ca-positive' reactor contained 4.7 g L - 1 NaCl. , , ^ '
In the first experiment, the inoculum was a municipal anaerobic sewage sludge acclimated for several months to sucrose (0.5 %) feed. In the second one, the inoculum was a degranulated sludge acclimated for 6 weeks to sucrose in a completely stirred reactor. An equivalent portion of sludge was used to seed all reactor (10 g VSS L - 1 of reactor space volume, in both experiments). The reactors were operated in a temperature controlled room kept at 27-29°C. Organic loading rates (OLR) were increased in steps by increasing the flow rates, while maintaining the VFA under 200 mg L~ .
Reactor performance was assessed on a daily basis (influent feed rate, gas production, effluent VFA content, pH) or on a frequency depending on the experimental requirement (feed COD, effluent total and soluble COD, alkalinity). Detailed

procedures for parameter monitoring have been presented elsewhere (Guiot et al. 1986) .
Biomass activities were determined by following the disappearance of a definite substrate (sucrose, acetate, or propionate), while ensuring their concentrations were not limiting. Tests were conducted in serum bottles under anaerobic conditions at 35°C (Guiot et al. 1986). Specific activity was estimated by reporting the uptake rate versus the VSS concentration in the serum bottle.
During the first experiment, the proportion of dispersed sludge versus granular sludge (size > 0.8 mm) was determined by screening sludge samples through a sieve of 3 0 mesh and measuring the dry solids weight of the portion retained on the sieve relative to total solids. A photograph of a dispersed aliquot of the sieve-retained granules permitted a size classification. The size was converted into mass by considering the granules as spheres of equivalent density. During the second experiment, the particle size distribution was assessed using a Coulter counter (model T A H ) . Particles are first suspended in an electrolyte solution. The measurements obtained are differential percent values versus volumetric size. The active measuring range was between 1 and 800 urn.
/ Results and discussion
Calcium effect on granulation
Reactor operations were conducted independently according to their response to increases in OLR. For the first three reactors, stepwise increases in the OLR started atabout 1 g COD L _ 1 d-1, to reach between 6 and 34 g COD L *• d , depending on reactor feeding and time of operation. Soluble substrate COD removal efficiencies were kept over 94 % throughout the reactors' operation. The control reactor reached an OLR of 11 g COD L d after 146 days, and the TM-supplemented reactor reached 34 g COD L _ 1 d-1 after 144 days. The Ca-positive reactor attained an OLR of 6.5 g COD L - 1 d-1 after 103 days. When shifted to TM supplementation, it quickly reached an OLR of 14 g COD L - 1 d_ 1 by the 144th day.
Changes in the specific substrate-COD removal rates (r„ S r) as a function of the operational time are presented in Fig. 1 for the first three reactors. These plots depict the evolution of the biomass maximal specific activity, since the reactors were at or near maximum loading. At day # 103, the Ca-positive reactor had reached a rx S r of 0.5 g COD g-?- VSS d , while in the control reactor, rx g was 0.8 g COD g- 1 VSS d_1. At that time, 94 % (dry mass) of the Ca-positive biomass aggregates had a size < 0.8 mm and 6 %, comprised between 0.8 and 2 mm. At that time, the granule size distribution was similar in the control reactor: 95 and 5 %, respectively. This indicated that, at low levels of specific activity, Ca cations could not speed up the granulation process. Two factors may impair the Ca+ + action. First, in bicarbonate-buffered systems, calcium partially precipitates. In such cases, the precipitated CaC03 eventually entrapped in sludge, would not be effective
189
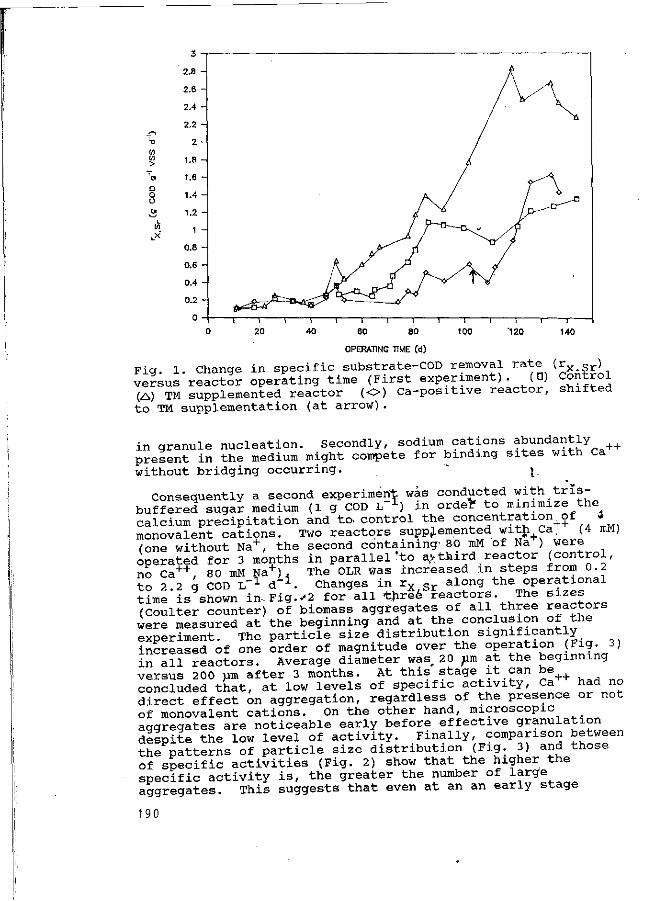
2.8
2.6 -
'-o
ui > 'o» o o o 0»
L.X
2.4 -
2.2 -
2 -
1.8 -
1.6 -
1.4 -
1.2 -
1 -
0.8 -
0.6 -
0.4 -
0.2 -
'120 140
J OPERATING TIME (d)
Fiq. 1. Change in specific substrate-COD removal rate (rx cr' versus reactor operating time (First experiment). (Q) Control (A) TM supplemented reactor (O) Ca-posxtive reactor, shifted to TM supplementation (at arrow).
in granule nucleation. Secondly, sodium cations abundantly present in the medium might compete for binding sites with Ca without bridging occurring. ~ j
Consequently a second experiment was conducted with_trïs-buffered sugar medium (1 g COD L"1) in orde* to minimize the^ calcium precipitation and to. control the concentration+of -monovalent cations. Two reactors supplemented with Ca, (4 mM) (one without Na+, the second containing- 80 mM of Na ) were operated for 3 months in parallel*to a*third reactor (control, no Ca++, 80 mM Na + ), The OLR was increased in steps from 0.2 to 2.2 g COD IT1 d"1. Changes in rx S r along the operational time is shown in-Fig./2 for all three reactors The sizes (Coulter counter) of biomass aggregates of all three reactors were measured at the beginning and at the conclusion of the experiment. The particle size distribution significantly increased of one order of magnitude over the operation (Fig. 3) in all reactors. Average diameter was, 20 pi at the beginning versus 200 um after 3 months. At this stage it can be + + concluded that, at low levels of specific activity, Ca had no direct effect on aggregation, regardless of the presence or not of monovalent cations. On the other hand, microscopic aggregates are noticeable early before effective granulation despite the low level of activity. Finally, comparison between the patterns of particle size distribution (Fig. 3) and those of specific activities (Fig. 2) show that the higher the specific activity is, the greater the number of large aggregates. This suggests that even at an an early stage
190

Oper sUcxul Um* ( day» I
Fig. 2. Change in specific substrate-COD removal rate (r^ ^r\ versus reactor operating time (Second run). ( Q) Control '(<>) Ca-positive reactor, with Na (+) Ca-positive reactor, without Na.
MOO 300.0 •4000
Dtemetar ( t
Fig. 3. Particle size distribution (% volume) within the second run's three reactors. ( ) Day #1, all reactors (inoculum). ( D, 0, -f ) After 3 months, same keys as in Fig.
19'

of the aggregation the particle size correlates with the magnitude of the activity.
Granulation process relative to sludge activity
As afore-mentioned, trace metal supplementation caused a drastic improvement in the specific performance of biomass (rx s , Fig. 1). For example, after a lag period of 40 days, the'ry s increased from 0.3 to 2.6 g COD g- 1 VSS d x at the end of'the experiment. During the same time lapse, the control reactor reached only 1.3 g COD g VSS d . As expected, this was associated with a similar increase in the specific acetoclastic activity (SACA). Furthermore, TM supplementation had a similar effect on propionoclastic activity on a longer term: 1.1 g COD g- 1 VSS d ^- versus 0.3 in the control reactor, at the end of the experiment. Even acid forming bacteria profited by the presence of TM, although less data on specific acidogenic activity was available to be conclusive. The various specific activities of the biomass (acidogenic, propionoclastic, acetoclastic) reflect the relative abundance of the fermentative bacteria, the obligate H2-producer acetogens, and the acetoclastic methanogens, respectively, in the biomass consortia. A comparative analysis of the diverse activity values suggest that the ratio of methanogen to fermentative» populations and the ratio of acetogen to methanogen populations have increased at the end of TM-supplemented experiment.
The granulometry of the biomass is sketched in Fig. 4 (bottom), i.e. the size distribution (% of dry solids) subdivided into 4 classes: < 0.8 mm, 0.8 to 2 mm, 2 to 3 mm and > 3 mm. The control reactor diji not show any effective granulation, until the end of the experiment (i.e. at 168 days, not shown on the Fig. 4), while- the rx S r and SACA fere around 1 g COD g- 1 VSS d . In the, TM supplemented reactor, th*a granulation process (Fig. 4, bottom right) «learly correlated with improvements in specific methanogenic and acetogenic ,A activities (Fig. 4, top right). Effect of TM on activity of" the sludge and subseguently on t;he granulation process has been confirmed in the afore-mentionned«Ca-ppsitive reactor.' Two months after Ca+ + supplementation was 'changed to TM addition, the SACA rose from 0.8 to 1.7 g COD g_ 1 VSS d~ , correlating with effective granulation. ,
The granulation process can thus be associated with both an increase in the concentration of viable cells per mass unit of all populations and an increase in the activity of the enzymic activity per cell. One explanation is that the increase in concentration of viable or active cell-s per mass unit resulted in a higher freguency of cell interaction and conseguently of cell aggregation. Secondly, intense metabolic activity (larger energy budget) might have generated or improved the EPS synthesis, resulting in the induction of aggregation and granulation process (Costerton et al. 1981). Thirdly, the granules proliferated from acidogen-dominant granule precursors, which were colonized by inter-twisting populations of methanogens, mostly Methanothrix-like. since reactor medium was acetate limited. Methanogens were found in granules in
192

Operational time (days) S/J\ <0.8mm 1X5 0.8-2mm JM 2-3mm >3mm
Fig. 4. (Top) Specific activities of biomass versus the operating time, in control and TM supplemented reactors. (Bottom) Granule size distribution versus the operating time, in control and TM supplemented reactors.
higher proportion than in free suspension and small floes, in contrast to acidogens (Dolfing et al. 1985, Guiot et al. 1986) . This is in agreement with the granulation model based on transmission electron microscopy, proposed by Dubourguier (1987, this conference).
Conclusions
1. The calcium ions do not seem to be a key-factor for inducing the granulation. 2. The granule proliferation seems to be due to colonization by the acetoclastic methanogens of aggregate precursors dominated by acidogens. 3. The granulation process results in an improved balance between acetogen and methanogen activities, possibly due to a better interspecies transfer of metabolites (namely H 2 ) .
193

Nomenclature
COD Chemical oxygen demand EPS Extracellular polymeric substance OLR Organic loading rate (g COD L _ 1 d- 1) r X Sr Specific substrate removal rate (g COD g VSS d ) SGCA Specific açidogenic (glucoclastic) activity (g COD
g _ 1 VSS d _ 1 ) SACA Specific acetoclastic activity (g COD g _ 1 VSS d 1 ) _ SPCA Specific propionoclastic activity (g COD g - 1 VSS d- 1) TM Trace metal UBF Upflow anaerobic sludge bed-filter VFA Volatile fatty acid VSS Volatile suspended solids
References
Costerton, J.W., R.T. Irvin & K.J. Cheng, 1981.. The bacterial glycocalyx in nature and disease. Ann. Rev. Microbiol., 35:299-324.
Dolfing, J., A. Griffioen, A.R.W, van Neerven & L.P.T.M. Zevenhuizen, 1985. Chemical and bacteriological, composition of granular methanogenic sludge. Can. J. Microbiol., 31:744-750.
Guiot, S.R. & L. van den Berg, 1984. Performance and biomass retention of an upflow anaerobic reactor combining a sludge blanket and a filter. Biotech. Lett., 6:161-164.
Guiot, S.R. & L. van den Berg, 1985. Performance of an upflow anaerobic reactor combining a sludge blanket and a filter treating sugar waste. Biotech. Bioeng., 27:800-806.
Guiot, S.R., K.J. Kennedy & L. van den Berg, 1986. Comparison of the upflow anaerobic sludge blanket and sludge bed-filter concepts. Proc. EWPCA Conf. on Anaerobic Treatment, A Grownup Technology, Aquatech' 86, Amsterdam, The Netherlands, 533-54 6. ,
Harris, R.H. & R. Mitchell, 1973. The role *f polymers in microbial aggregation, Ann, Rev. Microbiol., 27:27-50. \J
Hulshoff Pol, L., J. Dolfing, W. de Zeeuw -& G. Lettinga, 1982. Cultivation of well adapted pëlletized methanogenic kludge. Biotech. Lett., 4:329-332. . ' ., ,
Mahonney, E.M. (1984). Examination of surface properties and aggregation phenomena in anaerobic sewage cells. M. Eng. Thesis, University o;f Western Ontario, London Ont. , Canada.
Murray, W.D. & L. van den Berg, 1981. Effect of nickel, cobalt and molybdenum on performance of methanogenic fixed-film reactors. Appl. Environ. Microbiol., 42:502-505.
194

GRANULATION RESULTS IN ANAEROBIC FLUIDIZED BED REACTORS
J . I z a ; P.A. G a r c i a ; I . Sanz; F. Fdz-Polanco
D e p a r t a m e n t o d e I n g e n i e r i a Qu im i c a , U n i v e r s i d a d de V a l l a d o l i d , Spain
Summary
Experimental results obtained with laboratory and pilot scale fluidized bed reactors treating different wastewater are presented. In a lab scale reactor working with beet sugar wastewater at organic loading rates (Ry) greater than 100 g COD/1.d. biomass granules with 100 g VSS/1 were formed in the upper part of the reactor. Treating domestic sewage at low temperature (10 °C) , accumulation of suspended solids in the top of the reactor was observed, the concentration of attached biomass was 30 g VS/1. In a pilot reactor, filled up with natural and calcinated sepiolite a different behaviour of the support material was observed. Time evolution of the reactor performance and TS and VS profiles are presented.
Keywords: anaerobic fluidized bed reactor, biomass attachment, domestic sewage, sugar wastewater.
Introduction
Microorganisms can attach to surfaces submerged in an aqueous environment. The immobilized cells grow, reproduce and produce exopolymers wich extend from the cell forming a tangled matrix of fibers wich provides the basis of the biofilm. (Characklis, 1984)
In order to supply useful surface for the biofilm development inert particles (diameter Dp < 1 mm) are fluidized in the anaerobic fluidized bed reactor. As a result of the biofilm formation this technology seems to offer the advantage of providing a higher concentration of microorganisms than in systems with suspended biomass.
A biofilm can consist of a monolayer of cells or it can be as much as 3 0-4 0 cm thick as observed in algal mats. The development of biofilms may be considered from an ecological point of view. With constant environmental conditions the ecological succession on the colonized surface leads to the formation of a mature community. As the rate and extent of processes influencing biofilm development are time-dependent, we can expect an evolution of the biofilm characteristics.
Dealing with anaerobic reactors which are fed at increasing organic loading rates, changes in the physico-chemical properties of the biofilms can modify the behaviour of the reactors.
95

Results and discussion
1. Laboratory scale experiments
1.1. Beet sugar wastewater
These experiments were carried out in an anaerobic fluidized bed reactor with an effective volume of 500 ml constructed on plexiglass. Reactor features have been shown elsewhere. (Garcia, 1986). Support matrix consist in PVC particles with a diameter Dp < 0.6 mm and a density of 1.19 g/ml. The bed porosity is 43% and the expansion of the bed during operation is 2 0%.
The reactor was fed with beet sugar wastewater with a COD ranging from 4000 to 10000 mg/1 and an average value of 6500 mg/1 and it was an acidified wastewater. Temperature was maintained with a thermostatic bath at 33 ± 1 °C. Superficial velocity through the bed was around 0.1 cm/s. During 3 years the reactor worked continuously reaching By = 100 g COD/1.d. with COD reductions of 90% under stable conditions. At the end of the operation period, this organic loading rate was surpassed reaching Bv=150 g COD/1.d. (hydraulic retention time = 1 h) with COD reduction near to 90%.
With high organic loading rates, biomass formation gave rise to a rapid accumulation and two different types of particles could be observed in the bed. At the top of the bed, there were biomass granules with a diameter of 2-3 mm. The shape of the granules aproximated an ellipsoid and they differed in size and shape from the inital solid particles. It was verified, that about 4 0%,of these granules had no PVC support and that some of them had- a CaC03 support (dissolvable in nitric acid). Volatile solids concentrations higher than 100 g/1 were, determined in these biomass granules. v
96

This behaviour seems to show that at high organic loading rates, an important part of the biomass growth takes place on small particles of PVC or lime forming granules. The low density of these granules allows their placement in the upper part of the bed. The high biomass concentration of the granules made it possible to reach organic loading rates as high as indicated before.
In Photograph 1, biomass granules recovered at the end of the study period are shown, from the upper part of the bed (right), and PVC particles covered with biomass from the lower part of the reactor (left). The relative quantity of each type was approx. 40% and 60%, respectively, biomass granules and PVC particles.
The reactor was stopped for 7 months, and it was started-up and operated for two months reaching By = 145 g COD/1.d., with a soluble COD removal of 80%. During this period a COD removal of 90% was reached with a By = 85 g COD/1.d.
During non-operating periods we could observe a decrease in biomass volume, but once the reactor was started-up and reached By > 30 g COD/1.d. a rapid increase in biomass volume was noted. In Photograph 2 a biomass covered PVC particle can be seen (found at the bottom of the reactor).
In this case the granule size was larger than at the end of the continuous operation and they had a more spherical shape. This can be due to a continued biomass growth over the initial granules, causing a larger size. In this period, the recirculation system utilized a centrifuge pump, whereas in the initial period a membrane pump was used with a very strong pulsation. This fact could have affected the granule's shape because with the non-pulsating pump, a more uniform growth could occur due to a smooth fluidization.
97

1.2. Domestic sewage
Two 250 ml fluidized bed reactors filled with different support particles, Arlita^ and red brick, were used. (Garcia, 1985). Operating at room temperature, average temperature 20 °C and daily fluctuations ±7 °C, 70% COD and 85% TSS removal were reached when operation conditions were HRT = 3 h and By = 4 g COD/1.d. For both reactors the concentration of attached biomass was 20 g VS/1.
After a shut-down of 4 months the temperature was gradually decreased to 10 'C, achieving similar COD and TSS removal rates as at room temperature. Accumulation of non-supported solids in the top of the reactors was observed, this accumulation of solids was not observed whe"n the reactors worked at room temperature.
After a shut-down of 2 months the reactors were re-started at 10 °C. 75% COD and TSS removal rates were achieved continuously. After 230 days of operation, the concentration of attached biomass was 31 g VS/1 in reactor 1 and was 37 g VS/1 in reactor 2. The accumulation of solids in the top of the reactors was greater than in the previous period. Elementary analysis of several samples of the accumulated solids gave a formula C^4H25NOx. This is different from C5H7NO2 known to be the formula for the bacterial cell. Due to the low temperature and slow hydrolysis, suspended solids remain entrapped in the top of the reactors.
2. Pilot scale experiments
2.1. Reactor layout and carrier material
The pilot scale fluidized bed reactor has an effective volume of 1.3 m3, 6 m high, 0.~5 nt wide. The reactor' is cilindrical and has a flow distributor composed by a tapered zone with an inlet in a downward-and-then-upward fashion, a^ UASB-like gas-liquid-solid separator (1 m wide) and four sampling ports. ', *, - * 't
* The carrier material was sepiolite, which is a clay with a
needle-like structure. It was obtained in an agglomerated bundled form. Its specific surface is around 280 m'yg, using the BET adsorption isotherm method. This sepiolite, when in water, disagglomerates and the needle-like fibers form a randomly bound tridimensional network, enclosing solvent molecules and producing suspensions of high viscosity. Micropore (diameter < 20 jitm) contribution to the material specific surface is more than 60-70%. '(Alvarez, 1984). When sepiolite is heated over 300 °C, it suffers a structural collapse with a loss of of micropores. Over 600 "C another structural change produce a more dense material, called clino-ensteatite. Its low roughness reduces the colonization chance due to a lack of anchor-points for the microorganisms. When comparing with other carrier materiales, sepiolite has shown to have the highest colonization velocity, this effect is not due to its specific surface
198

(lesser than activated carbon) nor to its cationic exchange capacity (very low in comparison with zeolite). (Huysman, 1983) . In some cases, it has been found that the carrier material breaks down by chemical or biological degradation, weakening the material structure by internal build-up of biomass or by chemical or biological attack ( material used as a substrate). (Oakley, 1985).
2.2. Semibatch operation
The reactor was filled-up with 600 kg of natural sepiolite (1 m 3 ) , inoculated with anaerobic sludge from an industrial UASB reactor and operated in semi-batch mode. Due to material dissolution and gel formation, it was necessary to wash-out the fines, resulting in a severe loss of the bed material nearly 50%.
Treating beet sugar molasses distillery wastewater, the process was unstable due to a lack of influent alkalinity. Formation of foam was also a problem. At the end of a four months period of operation the bed showed a constant TS concentration (550 kg TS/m3) and a very uniform colonization with 25 kg VS/m3 of attached biomass.
2.3. Continuous operation
After a three month interruption, 500 1 of calcined sepiolite was added. Operating expansion was 2 0%. With dilute wastewater, organic loading rates of 15 kg/m3.d. and 5 h hydraulic retention times were very rapidly achieved. Two months later, organic loading rates jumped up to Bv = 35 kg C0D/m3.d., with hydraulic retention time near 2 h. Following wastewater variations, organic loading rates of 60 kg/m3.d. were reached. The behaviour of this plant follows two points, (Grady, 1985)
1) Efficiency is lower in pilot plant than in lab-scale 2) A load/efficiency correlation does not exist, as is the
case in laboratory-scale experiments.
Figures 1 and 2 show the evolution of total and volatile solids in sampling ports LI (0.75 m) and L7 (5.25 m ) .
At the LI sampling port, total solids concentration remained relatively constant during operation. At the L7 sampling port, total solids concentration diminished progressively, from 480 to 300 kg/m3, due to a high biomass build-up and reduction of carrier material size (due especially to dissolution of natural sepiolite). Volatile solids concentration showed a normal growth on the particles at the bottom of the reactor, whereas at the top of the reactor the attached biomass accumulation was very high, and higher when higher organic loading rates were applied, as can be seen in Figure 3, where the relationship between VS/TS ratio and accumulated load (kg COD) is plotted.
199

l oct. 86
Figure 1. Evolution of TS.
(d )
M ^
£
-
40 ~
-
30 -
_
?,0 •
.* 91
' 1 1 1 1 —
*
LI /
" T ? •**
t 0 So 100 1 Oct . 86 VTime (d)
F i gu r e 2.. Evo lu t i on of VS.
15
10 _
IÄ
co
>
0
3000 > o o P
r1
o P-
o o ö
0
1 Oct. 86 T i m e (d)
Figure 3. Evolution of VS/TS ratio and accumulated load.
200

When the sugar campaign finished, the reactor was not fed but recirculation was maintained for 6 weeks. Figure 4 shows TS, VS and VS/TS ratio profiles. There was a clear distinction between the lower part of the bed (TS = 63 0 kg/m3) compared to the upper part (TS = 32 0 kg/m3), and a high variation of the VS concentration, 72 kg VS/m3 in the upper part.
J3
300 400 soo 600 TS (kg/m3)
Figure 4. TS, VS, and VS/TS profiles.
15 VS/TS (%)
,' The kind of sepiolite present in this particles was determined by picnometry. In figure 5 it can be noted that sepiolite from the lower part of the bed was calcined sepiolite, and the natural sepiolite was placed separately in the upper part.
20'

1650 1950 • Density (kg/m'-')
Figure 5. Profile of particle density..
ACKNOWLEDGEMENTS. We are very grateful to: ACOR Sugar Factory, Spanish
National Board for Scientific and Technical Research (CAICYT, Project AG 37/82) and TOLSA, S.A. We are also grateful to Jim Field, for his valuable comments about this manuscript.
References
Alvarez, A., 1984. Sepiolite.Properties and uses. Singer Editor. Palygorskite-sepiolite. Ocurrences, genesis and uses. Elsevier. Amsterdam. .
Characklis, W.G., 1984. Biofilm^development: A process analysis. Marshall Editor: Microbial Adhésion and Aggregation. Springer Verlag, Berlin, 137-157. '*
Garcia, P., Redondo, -J. , Sanz, I., Fdz,-Polanco, F v 19.85 Performance of anaerobic expanded bed reactors treating municipal sewage. Palz Editor: Energy >from Biomass. Elsevier. London.
Garcia, P., Fdz-Polanco, F., 1986. Epuration des eaux resi-duaires de sucrerie* en reacteurs anaerobies a lit expanse. Sucrerie Française No.107, 251-255.
Grady, C.P.L., 1985. Conference Summary. Proc. Seminar/ Workshop "Anaerobic Treatment of Sewage", Amherst, Massachusetts, U.S.A.
Huysman, P. et al., 1983. Factors affecting the colonization of non-porous and porous packing materials in model upflow methane reactors. Proc. Eur. Symp. on Anaerobic Waste Water Treatment, Noordwijkerhout, The Netherlands.
Oakley, D.L., et al., 1985. Bacterial attachment in relation to the operation of an anaerobic expanded bed reactor. Proc. Conf. "Advances in Fermentation II", London.
202
GRANULATION OF DENITRIFYING SLUDGE
J.P. van der Hoek
Wageningen Agricultural University, Department of Water Pollution Control, De Dreyen 12, 6703 BC Wageningen, The Netherlands
Summary
Granulation of denitrifying sludge was observed in an upflow sludge blanket (USB) denitrification reactor fed with methanol as carbon source. The use of activated sludge as seed material resulted in pelletization of the sludge within 60 days of operation. Granulation coincided with an increase of the non-volatile fraction of the sludge, which consisted mainly of calcium precipitates. When the carbon source was changed from methanol to glucose or ethanol the granular structure of the sludge vanished and deterioration of sludge characteristics resulted in a decline of set-tleability. Expansion of the sludge bed caused an important decrease of volumetric capacity of the USB denitrification reactor. Key words: denitrification, granulation, methanol, carbon source, USB reactor.
Introduction
Nitrate removal from ground water is necessary for several water supply companies in the near future. Often ion exchange and biological denitrification are mentioned as the most appropriate techniques, but both have serious disadvantages (Van der Hoek & Klapwijk, 1987). For this reason a new process has been developed at the Wageningen Agricultural University. It consists of nitrate removal from ground water by ion exchange and regeneration of the resins in a closed system by way of a biological denitrification reactor. In this process regeneration salt requirements are minimized and brine disposal problems are avoided.
The denitrification reactor used in this process is the upflow sludge blanket (USB) reactor (Klapwijk et al., 1979; Klapwijk et al., 1981a). Methanol is added as carbon and energy source for the denitrifying bacteria (Van der Hoek et al., 1987). In all experiments so far the sludge in this reactor became granular in appearance (granules 0.5-2 mm) and sludge concentrations reached extremely high values up to 175-200 g TSS/1. At the same time the non-volatile fraction of the sludge was very high (53-63%) and most of it consisted of calcium precipitates (Van der Hoek et al., 1988).
Granulation of anaerobic sludge has been examined extensively (De Zeeuw, 1984; Wiegant & de Man, 1986) but granulation of denitrifying sludge is not well understood. Although not a major research item in the project "Nitrate removal from ground water" some experiments were performed to examine the granulation of denitrifying sludge. Especially the start-up of a USB denitrification reactor seeded with activated sludge from an aerobic industrial wastewater treatment plant was studied with emphasis on changes of sludge characteristics. Also the effect of a change of carbon source from methanol to glucose and from methanol to ethanol on sludge characteristics was studied.
Materials and methods
USB denitrification reactor start-up
The reactor used in this experiment had a volume of 0.5 1 and 4.3 cm internal diameter. The flow rate was gradually increased during the start-up, and the influent nitrate concentration was adjusted to avoid nitrate limitations. Methanol was always dosed in a ratio of 3:1 (w/w) to nitrate-nitrogen to avoid carbon limitations.
203

Other nutrients were also dosed in relation to nitrate: 33.2 mg Na2HP04.2H20/g NO3--N, 196.8 mg NH4Cl/g NO3--N, 4.2 mg MgCl2.6H20/g NO3--N, 7.0 mg FeCl3.6H20/g NO3--N and 11.3 mg MnCl2.4H20/g NO3--N. The denitrification activity of the seed material was determined in 0.5 1 batch reactors equipped with a magnetic stirrer.
Change of carbon source from methanol to glucose
The effect of change of carbon source from methanol to glucose was studied in a 0.125 1 USB denitrification reactor, internal diameter 3.4 cm. The hydraulic surface load was 0.39 m/h. The influent contained 116.1 ± 7.8 mg NO3--N/I and the COD: NÛ3"-N ratio was kept at 5.5 ± 0.6 during the gradual shift from methanol to glucose. Other nutrients were dosed equal to the concentrations used in the USB reactor start-up experiment. The experiment was started with granular denitrifying sludge cultivated on methanol.
Change of carbon source from methanol to ethanol
This experiment was conducted in a 2.5 1 USB denitrification reactor, internal diameter 9 cm. The hydraulic surface load was 0.54 m/h. The granular denitrifying sludge used in this experiment was obtained from a USB denitrification reactor which had been operated for 1.5 year with methanol as carbon source. The influent nitrate concentration was 316.3 ± 31.9 mg N03~-N/l, and methanol and ethanol were dosed in a ratio of 3:1 and 2.2:1 (w/w) to nitrate-nitrogen respectively, both resulting in a COD:N03~-N ratio of 4.5:1. Other nutrients were dosed equal to concentrations used in the USB reactor start-up experiment.
Analyses
Nitrate was analyzed either by the salicylate method according to the Dutch Normalised Standard Methods or by liquid chromatography with a Chrompack HPLC column, packing material Ionospher tmA (dim: 250x4.6) and u.v. detection at 205 nm (Spectroflow 773 u.v. absorbance detector). Nitrite was analyzed either using the reagent of Gries Romyn Van Eck according to the, Dutch Normalised Standard. Methods or by liquid chromatography as describerT'above. Methanol and ethanol were analyzed by gas chromatography using a Packard Becker model 417 equipped with a 2 m (2 mm x 2 mm) glass column and a flame ionization detector. The glass column» was packed with 10% Fluorad 431 on 100-200 mesh $upelco-port. The^flow .rate of the carrier gas, nitrogen saturated with formic acid, was 30 ml/min. Column- temperature was 90 °C, detector temperature 180 °C and injtection port temperature 190 °C. Chemical oxygen demand (COD), total 'suspended solids (TSS) and volatile suspended solids (VSS) were determined according to Standard Methods (American Public Health Association, 1980). Calcium content of the sludge was determined by dissolving the calcium precipitates with hydrochloric acid after calcination of the sludge at 600 °C. After filtration calcium was measured by means of an atomic absorbance spectrometer.
Results
Start-up of the USB denitrification reactor
The USB denitrification reactor was seeded with aerobic activated sludge from an industrial wastewater treatment plant (Avebe, de Krim, the Netherlands). The characteristics of this sludge are summarized in Table 1. The denitrification activity of the seed sludge was 1.8 mg N03~-N/(g VSS.h) with methanol and 15.6 mg N03"-N/ (g VSS.h) with ethanol as carbon source. Although the activity with ethanol appeared to be much higher as compared with methanol, it was decided to run the reactor with methanol as carbon source.
204
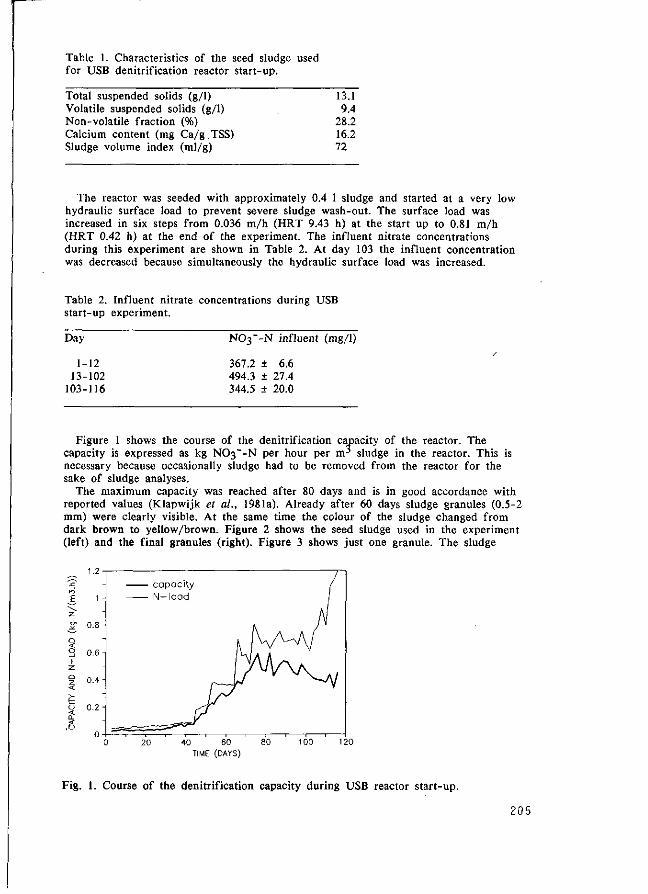
Table 1. Characteristics of the seed sludge used for USB denitrification reactor start-up.
Total suspended solids (g/1) 13.1 Volatile suspended solids (g/1) 9.4 Non-volatile fraction (%) 28.2 Calcium content (nig Ca/g.TSS) 16.2 Sludge volume index (ml/g) 72
The reactor was seeded with approximately 0.4 1 sludge and started at a very low hydraulic surface load to prevent severe sludge wash-out. The surface load was increased in six steps from 0.036 m/h (HRT 9.43 h) at the start up to 0.81 m/h (HRT 0.42 h) at the end of the experiment. The influent nitrate concentrations during this experiment are shown in Table 2. At day 103 the influent concentration was decreased because simultaneously the hydraulic surface load was increased.
Table 2. Influent nitrate concentrations during USB start-up experiment.
Day
1-12 13-102
103-116
NO3--N influent (mg/1)
367.2 ± 6.6 494.3 ± 27.4 344.5 + 20.0
Figure 1 shows the course of the denitrification capacity of the reactor. The capacity is expressed as kg NO3--N per hour per m^ sludge in the reactor. This is necessary because occasionally sludge had to be removed from the reactor for the sake of sludge analyses.
The maximum capacity was reached after 80 days and is in good accordance with reported values (Klapwijk et al., 1981a). Already after 60 days sludge granules (0.5-2 mm) were clearly visible. At the same time the colour of the sludge changed from dark brown to yellow/brown. Figure 2 shows the seed sludge used in the experiment (left) and the final granules (right). Figure 3 shows just one granule. The sludge
40 60 80 TIME (DAYS)
Fig. 1. Course of the denitrification capacity during USB reactor start-up.
205

Fig. 2. Seed material of the USB denitrification reactor (left) and sludge granules cultivated on methanol (right).
Fig. 3. Sludge granule (approximately 2 mm) cultivated on methanol in a USB denitrification reactor.
concentration during the entire period increased'from ,J5.? g TSS/1 at the start up to 35.8 g TSS/1 at the end. During this period the non-volatile fraction and calcium content of the sludge increased, as shown in Figs. 4 and 5. At the end almost 80% of the non-volatile fraction of/ the sludge consisted of calcium carbonate, while at the start this was only 14%.
Change of carbon source from methanol to glucose
Figure 6 shows the changes of sludge characteristics during the gradual shift in the influent of a USB denitrification reactor from methanol to glucose. The reactor had been operated with methanol during the preceeding period of six months. The total influent COD was kept constant, but the glucose fraction was stepwise increased from 0 to 25, 75 and 100% of the influent COD with concomitant decrease of the methanol fraction. This resulted in a decrease of the total solids and volatile solids concentrations of the sludge, and also in a decrease of calcium content from 216 to 176 mg Ca/g TSS. The structure of the sludge changed from granular to filamentous, resulting in a deterioration of settleability. Because the reactor was operated nitrate limited, no decrease in reactor capacity was observed. During the entire period effluent nitrate concentrations ranged from 1.6 to 20.7 mg NOß'-N/l.
206

Change of carbon source from methanol to ethanol
After methanol had been changed for ethanol, no changes in sludge characteristics were observed for about one week, but then the total solids and volatile solids concentrations decreased very fast for the next 8 days, as shown in Fig. 7. The non-volatile fraction decreased from 68% to 21% and the calcium content from 278 mg Ca/g TSS to 77 mg Ca/g TSS. The compact granules (0.5-1 mm), cultivated on methanol, changed into flocculant, filamentous granules (3-5 mm) with concomitant expansion of the sludge bed. As a result of this the volumetric capacity of the reactor showed an important decrease with a built-up of high nitrite concentrations in the effluent. The volumetric capacity, expressed as electrons accepted per m3
sludge per hour, changed from 235 meq/(nAh) to 97 meq/(m3.h). However, related to the volatile solids concentration of the sludge, almost no decrease of capacity was observed. It changed from 6.7 meq/(kg VSS.h) with methanol to 6.4 meq/(kg VSS.h) with ethanol.
•!S -y u
< (Y U_
ÜJ _J 1—
n > n z.
33 -
-31 -
" 29 -
-27 -
25 -20 40 60
TIME (DAYS)
100 120
Fig. 4. Course of the non-volatile fraction of the sludge during USB denitrification reactor start-up.
100
40 60
TIME (DAYS)
120
Fig. 5. Course of the calcium content of the sludge during USB denitrification reactor start-up.
207

^ 150
40 60 80 RELATIVE GLUCOSE CONCENTRATION (% COD)
Fig. 6. Changes of sludge characteristics during the gradual shift from methanol to glucose as carbon source.
100-
-80 J
60-
40-
20-
0 -
-——~ "\
t \ change C —source
• TSS
* VSS
* ___!——~*
20 30 _ TIME (DAYS)
Fig. 7. Changes of sludge characteristics after changing methanol for ethanol as carbon source on day no. 9. • ' • '
? , ?. *
Discussion
Concerning denitrification with methanol, granulation of biomass has already been reported in literature before in USB denitrification reactors. Miyaji & Kato (1975) used activated sludge from a conventional activated sludge process as inoculum and part of the sludge began to form pellets in three days after the start. After one week all the sludge became pellets with a diameter of 1-2 mm. The sludge concentration increased from 11 g TSS/1 up to 25 g TSS/1 at the end of the operation of the upflow reactor (6 weeks). Klapwijk et al. (1981a) observed granulation in a denitrification reactor fed with fusel oil containing 61% (w/w) methanol. The reactor was started with activated sludge but in the course of the experiment the sludge became granular (pellets 1 mm) and sludge concentrations up to 61 g TSS/1 were reached with a non-volatile fraction of 30%. Lettinga et al. (1980) reported granulation of sludge (pellets 1-3 mm) in USB denitrification reactors fed with alcoholic waste after 6-8 weeks of operation, with a sludge concentration of 31-60 g TSS/1.
Also in other denitrification reactor types fed with methanol granulation has been observed (Jewell & Cummings, 1975). In reactors inoculated with activated sludge
208

from a domestic wastewater treatment plant, within 2 weeks the sludge became granular in appearance in complete mixed suspended growth reactors. The sludge concentration reached 15 g TSS/1. A similar granular sludge was formed in upflow submerged filter columns. In these reactors sludge concentrations above 300 g TSS/1 were observed. In both reactors the non-volatile fraction of the sludge was 70-80%.
In our USB denitrification reactor start-up experiment granulation of the sludge started after 60 days and during the start-up the non-volatile fraction and calcium content of the sludge increased. These facts are in accordance with the above described researches.
Granulation of denitrifying sludge, fed with methanol, is clearly influenced by precipitation of calcium salts at high pH levels reached by denitrification (Table 3). In our experiments the influent contained 29 mg Ca2+/'- At high pH levels this is precipitated as CaCC>3, resulting in an increase of calcium content of the sludge (Fig. 5) and this might create a matrix for granulation of the sludge.
Table 3. Effect of carbon source on maximum pH values that can be reached during denitrification. Calculated from H2CO3/HCO3VCO32" equilibrium at 25 °C, pKj = 6.38, pK2 = 10.32 (Chang, 1981).
C-source Reaction (dissimilation) pH
Methanol 5CH3OH + 6NO3- - -> 3N2 + 4HCO3- + C0 32 " + 8H20 9.7
Ethanol 5C2H5OH + I2NO3" — > 6N2 + 8HCO3- + 2C032~ + 11H20 , 9.7
Glucose 5C 6H 1 20 6 + 24NO3- ---> 12N2 + 24HCO3- + 6H2C03 + 12H20 7.0
Also Klapwijk et al. (1981b) observed an increase of calcium content of the sludge in USB denitrification reactors. In experiments in which denitrifying upflow reactors were fed with calcium nitrate and settled sewage, within 96 days the calcium content increased from 12 mg Ca/g TSS up to 170 mg Ca/g TSS and sludge granules were observed. However, decrease of the calcium dosage resulted in a deterioration of the sludge which became filamentous. This coincided with an effluent pH of 7 and it might have been possible that fewer salts were precipitated and perhaps some of the non-volatile solids went into solution.
In the experiment in which the granular structure of the sludge disappeared when the carbon source was changed from methanol to glucose, the relation between pH, calcium precipitation and structure of the sludge might be helpful to explain the deterioration of sludge characteristics. Denitrification with glucose results in a lower pH as compared with methanol (Table 3), and at this relatively low pH calcium salts dissolve. The granular structure, caused by calcium precipitates, then will disappear.
In the experiment in which the carbon source was changed from methanol to ethanol one would have expected that the granular structure was maintained when the supposed theory holds true, since denitrification with methanol and ethanol both result in very high pHs (Table 3). However, the sludge became rather flocculant with a decrease of the non-volatile fraction and calcium content. A possible explanation might be that the denitrifying population changed as a result of change of carbon source. Denitrification with methanol results in a selective enrichment for bacteria belonging to the genus Hyphomicrobium (Claus & Kutzner, 1985; Nurse, 1980; Timmermans & Van Haute, 1983). The shift from methanol to ethanol might have caused the development of other bacteria, and subsequently disappearance of Hyphomicrobium spp. In that case microbiological aspects rather than physico-chemical aspects decide whether granulation of denitrifying sludge occurs.
In a next experiment the start-up of a USB denitrification reactor with ethanol as C-source from the beginning will be studied to determine whether granulation will occur.
209

Conclusions
Denitrifying sludge in USB denitrification reactors, fed with methanol, shows a tendency to form granules. The non-volatile fraction and calcium content of these granules are rather high, and possibly precipitation of calcium salts promotes p ep t ization of the sludge. With ethanol and glucose the granular structure disappears, resulting in very low sludge concentrations. This implies that USB denitrification reactors have to be run with methanol as carbon source to reach high volumetric capacities.
Acknowledgements
These investigations were supported by the Netherlands Technology Foundation (STW), Rossmark-Van Wijk & Boerma Water Treatment Ltd., the Ministry of Housing, Physical Planning and the Environment, the Ministry of Economic Affairs and the Water Supply Company "Oostelijk Gelderland".
References
American Public Health Association, 1980. Standard methods for the examination of waste and wastewater. 15th edn. APHA, New York.
Chang, R., 1981. Physical chemistry with applications to biological systems. 2nd edn. Macmillan Publishing Co., Inc., New York.
Claus, G. & H.J. Kutzner, 1985. Denitrification of nitrate and nitric acid with methanol as carbon source. Appl. Microbiol. Biotechnol. 22:378-381.
Hoek, J.P. van der & A. Klapwijk, 1987. Nitrate removal from ground water. Wat. Res. 21:989-997.
Hoek, J.P. van der, P.J.M. Latour & A. Klapwijk, 1987. Denitrification with methanol in the presence of high salt concentrations and at high pH levels. Appl. Microbiol. Biotechnol. (in press).
Hoek, J.P. van der, P.J.M, van der Ven & A. Klapwijk, 1988. Combined ion exchange/biological denitrification for nitrate removal from ground water under different process conditions. Wat. Res. (submitted).
Jewell, W.J. & R.J. Cummings, 1975. Denitrification of concentrated nitrate wastewaters. J. Wat. Poll. Contr. Fed. 47:2281-229T.
Klapwijk, A., C. Jol & H.J.G.W. Donker, 1979. The application of an upflow reactor in the denitrification step of biological sewage purification. Wat. Res. 13:1009- 'i 1015.
Klapwijk, A., J.C.M. van der Hoeven & G. Lettinga, 1981a. Biological denitrification in an upflow sludge blanket reactor. Wat. Res! 15:l-!é. >
Klapwijk, A., H. Smit & A. Moore, 1981b.'Denifrification of domestic wastewater in an upflow sludge-blanket reactor without carrier material for the biomass. In: P.F. Cooper & B. Atkinson (Ed.y Biological fluidized bed treatment of water and wastewater. Ellis Horwood Publishers Ltd., Chichester, p. 205-220.
Lettinga, G., A.F.M, van Velsen, S.W. Hobma, W. de Zeeuw and A. Klapwijk, 1980. Use of the upflow sludge blanket (USB) reactor concept for biological wastewater treatment, especially for anaerobic treatment. Biotechnol. Bioengng 22:699-734.
Miyaji, Y. & K. Kato, 1975. Biological treatment of industrial wastes water by using nitrate as an oxygen source. Wat. Res. 9:95-101.
Nurse, G.R., 1980. Denitrification with methanol: microbiology and biotechnology. Wat. Res. 14:531-537.
Timmermans, P. & A. Van Haute, 1983. Denitrification with methanol. Wat. Res. 17:1249-1255.
Wiegant, W.M. & A.W.A. de Man, 1986. Granulation of biomass in thermophilic upflow anaerobic sludge blanket reactors treating acidified wastewaters. Biotechnol. Bioengng 28:718-727.
Zeeuw, W.J. de, 1984. Acclimatization of anaerobic sludge for UASB-denitrification reactor start-up. PhD Thesis, Wageningen Agricultural University, The Netherlands.
2 1 0

GROWTH OF GRANULAR SLUDGE IN THE BIOPAQ IC-REACTOR
Authors: Ir. P.J.F.M. Hack; S.H.J. Vellinga; Ir. L.H.A. Habets
PAQUES B.V. Postbus 52 8560 AB BALK The Netherlands Phone: (0)5140 - 3441 Telex: 46417 Fax: (0)5140-3342
Introduction
Anaerobic treatment of industrial effluents has become a 'grown up' and accepted technology. This is continuously proven by many full-scale applications. To make anaerobic wastewater treatment even more feasible economically, currently research is carried out all over the world to optimalize process-design and to reduce the reactor volumes required.
At the moment, the UASB-system is among those with the highest applicable loading rates. For a good performance of suspended growth anaerobic systems the separation between biomass and effluent is very important. A prerequisite for separation is a final sedimentation zone, free of turbulence. Especially in high loaded systems (for example UASB) the turbulence in the settling-zone may become too great due to the very high gasproduction rates, and so limit higher loading rates. In order to make an optimal use of the high methanogenic activity of anaerobic sludge (more than 1 kg C0D/kg VSS.day) and of the high concentrations that can be achieved in anaerobic systems (p.e. 60 - 70 kg SS/m , based on total reactor volume) a new type of reactor has been developed and tested (Vellinga et al, 1).
2. Principle of the IC-reactor
The new reactor type, called the "Internal Circulation" or " I C -reactor is based on the collection and handling of the produced biogas in 2 phases. The gas collected in the first phase is used to generate a gaslift and internal circulation. Figure 1 is a schematic presentation of the IC-reactor and will be referred to in the explanation of its functioning.
The influent is pumped in and distributed evenly over the bottom area by pumps (1). The main reaction column (2) contains a high concentration of sludge.
The biogas produced in the reactor column (2) is collected by the first layer of gashoods (3) (first phase) and is used to generate a gaslift by which water and sludge are flowing via pipe (4) to a separation unit (5). In this unit the biogas is separated from the water and sludge and leaves the system via the gaspipe (6).

FIG. 1 SCHEMATIC PRESENTATION OF THE IC-REACTOR
777$.-77777Ssy-,
212

The water/sludge mixture reactor via pipe 7 (downer).
is directed down to the bottom of the
By this powerful gaslift/circulation, the sludge/water mixture and the influent are completely mixed. Because of the intensive mixing, no dead spaces, floating particles or froth will occur and no external circulation of final effluent is necessary.
Because most of the produced biogas is collected by the first (lower) layer of gashoods (3), the second (upper) layer of gashoods (8) receives a much lower gasload.
The second reaction column (9) is hydraulically low-loaded because only the final effluent flows through to the effluent collecting system (10) and because the second layer of gashoods receives only a low gasflow, a very efficient separation of effluent and sludge can be established.
3. Semi-technical plant
The first semi-technical IC-reactor was erected at the site of a potato-processing plant in the beginning of 1985. The most important wastewater characteristics are presented in table 1:
Table 1. Wastewater characteristics.
COD (total) COD (filtered) BOD Kjeldahl-N Temperature Wastewater discharge
3500 to 9000 mg/1 3000 to 8000 mg/1 2000 to 5500 rag/1 100 to 200 mg/1 30 to 35 °C 8 to 12 hours/day; 5 days/week
The entire treatment plant exists of the following items:
* Settling tank. * Pumps. * Hydraulic buffer and equalization tank. * pH-control and lime-dosing unit. * Reactor feedpump with flow-control * IC-reactor. * Gasmeter, gasholder, flare.
The IC-reactor has a height of 16.6 m and a total reactor volume of 17 m \
The reactor was seeded with granular sludge from an UASB-reactor, treating papermill effluent.
213
4. Results
4.1. Loading and efficiency
After some modifications in flow diagram and operation, a very stable performance of the plant was proven.
During this long-term operation the following results were achieved :
Volumetric loading Efficiency on COD (kg COD/m3.d) (%)
20 - 35 80 - 95 35 - 50 75 - 90
The efficiency is calculated on mixed samples.
The volumetric loading is calculated on total reactor volume.
4.2. Sludge
The plant was seeded with granular sludge from a full-scale UASB-reactor treating papermill effluent.
During the operation of the plant, a significant growth of the sludge occured;
The settling characteristics of the sludge are determined according to Hulshoff Poll (2) and are presented in table 2.
I
Table 2. Settling velocities of the sludge. ^
Percentage of the sludge 'Settling velocity (m/h) ' . * ._ *
20 . ' .•> 'loi' 30 2 93 40 , 2 86 50 " .' ? 76 60 ^ 61 60 ^ 32
100 £ . 3 . 6
The activity of the sludge was between 0.5-0.6 kg C0D/kg SS.d or 0.75-0.90 kg C0D/kg VSS.d at 30°C.
The ash-content of the sludge was between 30 and 40%.
214

During normal operation, the sludge-concentration in the lowest part of the reactor (main reaction column, no. 2 in figure 1) varied between 140 and 200 gr SS/l, or 90 and 130 gr VSS/1.
5. Discussions
The long-term stable operation of the pilot-plant demonstrated that high volumetric loading rates and high treatment efficiencies can be reached, and that the gaslift and internal circulation principle is reliable in practice.
The system reacts quickly, when restarted after weekend-stops.
6. Future developments
The experiments at the potato-processing factory are now finalized and before the end of 1987 a full-scale BIOPAQ-IC-system, with 100 m3
of reactor volume will be started up.
In the meantime a pilot-plant with a reactor volume of 70 m3 is operating on brewery effluent.
The first results indicate a good performance at a hydraulic retention time of only 2 hours and less. More results will be published later. /
Literature
Vellinga, S.H.J. , Hack, P.J.F.M. and Van der Vlugt, A.J. New type "High rate" reactor. Proceedings of NVA-EWPCA conference 15-19 Sept. 1986, Amsterdam - Netherlands.
Hulshoff Pol, L.W., Van de Worp, J.J.M., Lettinga, G. and Beverloo, W.A. Physical Characterization of anaerobic granular sludge. Proceedings of NVA-EWPCA conference 15-19 Sept. 1986, Amsterdam -Netherlands.
215

SODIUM INHIBITION OF ACETOCLASTIC METHANOGENS IN GRANULAR SLUDGE FROM A UASB REACTOR
Arjen Rinzema, Jules van Lier and Gatze Lettinga
Department of Water Pollution Control, Wageningen Agricultural University De Dreijen 12, 6703 BC Wageningen, The Netherlands
ABSTRACT
The effect of sodium on the formation of methane from acetate in granular sludge from a UASB reactor has been determined at various acetate concentrations. At neutral pH sodium concentrations of 5, 10 and 14 g Na+ /1 caused 10, 50 and 100% inhibition respectively, relative to the maximum specific acetoclastic methanogenic activity of the granular sludge. These values reflect the sensitivity of Methanothrix sp. towards sodium, as this is the predominant acetoclastic methanogen in the granular sludge used in this study. At acetate concentrations below 500 mg/1 diffusion limitation partly masked the influence of sodium on the specific activity of the granular sludge.
No adaptation of Methanothrix sp. to high sodium concentrations could be obtained in a period of 12 weeks. Net growth of Methanothrix sp. could be obtained at sodium concentrations of approx. 10 g/1.
The results obtained with short term activity measurements can reliably be used for predictions of the effect of sodium salts on continuously fed UASB reactors.
INTRODUCTION
During the last decade, the application of anaerobic wastewater treatment under suboptimal conditions has received increasing interest, mainly as a result of the development of several new reactor types with immobilized biomass, i.e. the Upflow Anaerobic Sludge Bed (UASB) reactor, the Fluidized Bed reactor and Stationary Fixed Film reactors l i 2 '3 . With these systems a very good sludge retention can be achieved. Generally the 's ludge residence time can be one to two orders of magnitude higher than the hydraulic residence time. Therefore these systems tolerate higher concentrations of irfkibitory compounds than conventional completely mixed reactor systems 4. j}
Research on anaerobic treatment of wastes with a high sodium content dates back to the late twenties 7. Since then many studies on the effect of sodium saltf on methano-genesis have been reported 8 i9 .1 5 .1 6 . There seems ' to be <p. general consensus concerning the relative importance of cations and anions in salt toxicity : the inhibitory effect of salts on microorganisms is mainly related to the cation 17. This was confirmed for sewage sludge digestion by McCarty an4 McKinney s \
Many conflicting results have been published however regarding the maximum allowable sodium concentration in anaerobic digesters. The differences can be attributed to several factors : Antagonistic and synergistic effects, differences in sensitivity between microorganisms, and - quite important - differences in the test method. The presence of other cations may cause antagonism or synergism, resulting in differences in the tolerable sodium concentration of at least one order of magnitude 6 '9 . Different species of methanogenic bacteria probably have a different sensitivity for sodium 15. Furthermore it seems that the sensitivity of bacteria can change as a result of adaptation 16. Last but not least differences in the test method and the definition of the reference point may strongly affect the interpretation of the results. Model calculations based upon the results of Kugelman and Chin 6 clearly show that the residual methane production at increasing sodium concentration, measured in continuously fed systems, is very sensitive to the cell residence time and the influent concentration. A direct comparison between batch activity
216

measurements and continuous experiments will not be allowed, unless a sufficiently high substrate concentration is maintained in the continuous digester.
In this paper we describe the influence of sodium sulfate on the acetoclastic methano-genic activity of granular sludge from an industrial UASB reactor. The results of the short-term activity measurements were checked in experiments with UASB reactors. The possibility of adaptation to high sodium levels was investigated.
MATERIALS AND METHODS
The biomass originated from the UASB reactor of the Aviko potato processing factory at Steenderen, The Netherlands.
Medium A defined medium containing nutrients, trace elements and buffer, and acetate as sole electrondonor was used '
Analysis VFA were determined by G.C.fSupelcoport, 100-120 mesh), sulfate by HPLC (Chrompack Ionosphere). 18 Other analyses were performed according to Standard Methods .
Batch toxicity assay Specific methanogenic activity measurements were performed in 1.16 1 glass serum
bottles sealed with a 4 mm rubber septum kept in place with a screw-cap. Each serum bottle contained 500 ml of the basal medium and substrate plus a known amount of active granular sludge in the range of 135-2595 mg per bottle. The amount of sludge was chosen carefully to ensure that a measurable amount of methane would be produced within 2-4 hours, without changing the acetate concentration and the pH in the medium too much 5,19
The specific acetoclastic methanogenic activity was calculated from the slope of the measured progress line (relative methane concentration vs. time) and the amount of VSS. Except where indicated otherwise, percen-tually remaining activities have been calculated relative to the average value of the two blanks in the same series.
Prolonged exposure to sodium Granular sludge was exposed to sodium sulfate (10 g Na /l) during 12 weeks, in a 5 1 batch reactor at 30 C. This reactor was fed semi-continuously with acetate, using an automatic feeding system coupled to a wet gas meter, to ensure a relatively constant substrate level of 500 mg/1. Sludge samples for activity tests were taken from this batch reactor after 6 and 12 weeks.
UASB experiments Continuous experiments were performed in 0.2 1 glass reactors of 35 mm internal diameter, as described by Rinzema et.al. . AH reactors were inoculated with a known amount of granular sludge, and were initially fed with a neutralized acetate solution containing nutrients and trace elements. After determination of the maximum specific activity of each reactor, the sodium concentration was increased to the desired level (5 - 14 g/l Na ), and the maximum specific activity under inhibition was measured. One reactor served as a control. Thereafter the reactors were operated at lower space loads. At the end of the experiment the maximum uninhibited specific activity and the amount of biomass was determined in all reactors. All activities were calculated using an estimate of the amount of biomass based on a constant yield (g VSS/g COD-removed) calculated from the cumulative methane production and the cumulative increase in the amount of biomass.
RESULTS
Influence of the substrate concentration Previous work indicated that - for the granular sludge used - an acetate concentration
of 500 mg/1 was sufficient to avoid a rate limitation caused by diffusion of the substrate into the granules 44. Most tests described in this paper were directed at the determination of the maximum specific methanogenic activity, and were therefore performed at acetate concentrations above 600 mg/1. In two series of tests, the substrate concentration was significantly lower than 500 mg/1. Figure 1 shows the specific methanogenic activity as a function of the sodium concentration at 120, 300 and >600 mg/1 of acetate.
217

Acetoclastic methanogenic activity Acetoclastic methanogenic activity
k 8 12 16
Sodium (g.r')
20
100
80-
60-
40
20-
0-
» - • •
\ \ o
V
v \° • V . —, •
12
Sodium (g.r'1
20
Figure 1. (Left) The specific acetoclastic methanogenic activity of granular sludge as a function of the sodium concentration at pH 6.5-7.0, determined at three acetate concentrations (• above 600 mg/1,A--- 300 mg/l, o — 120 mg/1 acetate). The activities are shown both as absolute values and as a percentage of the average blank activity at acetate concentrations above 600 mg/1.
Figure 2. (Right) The maximum specific acetoclastic methanogenic activity of granular sludge as a function of the sodium concentration at pH 6.5-7.2, determined after 0 (• —) , 6 (A -•-) and 12 weeks (o—) of exposure to *10 g/1 Na+. The remaining activity is shown as a percentage of the mean uninhibited activity after the concomitant exposure period.
' • • * • ' ' "
v Influence of prolonged exposure . %
Granular sludge was exposed to sodium sulfate (10 g/1 Na+) during 12 weeks. The irr1
fluence of sodium sulfate on the specific methanogeni* activity w.as determined after 6 and 12 weeks. Figure 2 shows the remaining activity as a percentage of the average blank activity for each exposure time. Microscopical exammafions after 9 weeks exposure revealed that the dominant methanogen in the granules was still a Methanothrix sp., indicating no shift in the population.
Continuous experiments Four UASB reactors were operated at different sodium sulfate levels (approx. 0.8, 5.6,
9.7 and 13.7 g/1 Na+). Figure 3 gives a comparison between the maximum activities found in the batch activity measurements and the UASB reactors. Table 1 summarizes the results obtained in the UASB experiments. Microscopical examinations showed that no important shift in the methanogenic population occurred in these experiments.
In all experiments described above, the sulfide concentration in the liquid phase ranged from 30-50 mg S/l. No indications were found for significant sulfate reduction with concomitant acetate oxidation.
218

Acetoclastic methanogenic activity Specific activity, specific growth rate
12 16 20
Sodium (g.r1)
200 400 600 800 1000
Acetate (mgi
Figure 3. (Left) The maximum specific activity found in the UASB reactors (• —) compared with that found in the batch experiments (D — ) (in both experiments acetate concentrations exceeded 600 mg/1).
Figure 4. (Right) A comparison between the calculated growth rate of Methanothrix soehn-genii (—, \i 0.1 d"1, Ks 30 mg/l C2 21) and the measured uninhibited specific activity of the granular sludge ( , • blanks from toxicity assays maintained at a constant acetate concentration, o additional experiments with variable acetate concentration), as a function of the acetate concentration, both expressed as a fraction of their value at 850 mg/1 acetate.
DISCUSSION
The results of the short-term activity tests show that sodium sulfate hardly affects the maximum specific acetoclastic methanogenic activity of the granular sludge used in this study, at concentrations below 5 g/1 Na+ (10% inhibition), whereas the activity is practically reduced to zero at 14 g/1 Na+ (figure 1). The UASB experiments indicate slightly more favorable figures, i.e. 10% and 100% inhibition at 5.5 and 15 g/1 Na+ respectively. The differences are however relatively small (figure 3). The main difference between the batch activity tests and the UASB experiments was the abruptness of the exposure to high sodium levels : In the batch tests the biomass was instantly subjected to the concentration to be tested, while in the UASB reactors this concentration was more gradually approached, i.e. within 5-10 hours (the hydraulic residence time was 5 hours). Possibly the extremely rapid increase in the salt concentration during the batch tests caused a larger part of the bacteria to die.
Because of the lack of knowledge about the mixing characteristics of the UASB reactors used in this study, a meaningful comparison between the activities measured in batch and UASB experiments is only possible at (effluent) acetate concentrations high enough to guarantee maximum metabolic activity of the entire amount of biomass, viz. concentrations over 500 mg/1. This also implies that the results of our UASB experiments at acetate concentrations below 600 mg/1, cannot be used to predict the performance of any UASB reactor, irrespective of its scale and mode of operation.
219

Table 1 Summary of results obtained with UASB reactors
#1 #2 # 3 #4
sodium concentration (g Na+/1) b 0.76 (.19,15) 6.64 (.19,15) 9.68 (.24,15) 13.71 (.72,15)
sludge quantity (g VSS) start end a
max. uninhibited spec, activity (g C2-COD/g VSS/d)
start end a
max. spec, activity under inhibition (g C2-COD/g VSS/d) (% of uninhibited activity) c
2.8
5.6
1.57 2.37
1.57
100
(.08,4)
( - .1)
(.08,4)
2.8
4.4
1.51 2.35
1.40 92
(.01,2) (.11,2)
.03,2)
2.8
3.7
1.54 1.88
1.10 71
("07,2) (.01,2)
(.06,3)
2.8
3.4
1.59 1.65
0.36 (
22
(.06,2) (.08,2)
.05,4)
the uninhibited activity was determined after 17 days exposure to sodium sulfate, the sludge quantity was determined aftjer another two days of operation without sodium addition determined at effluent acetate concentrations above 600 mg/1, between brackets the standard deviation and the number of measurements expressed as % of the max. uninhibited spec, activity measured in the same reactor
Regarding the small differences between the effect on the maximum specific activity found in batch tests and UASB experiments (figure 3), it can be concluded that the short term activity tests predict the effect of high salt levels on the maximum activity of methanogenic bacteria with sufficient accuracy. The measured values reflect the sensitivity of Methanothrix sp. towards sodium, as these are the predominant acetoclbstic methano-gens in the granular sludge used in this, study-.» ' *»
The inhibitory effect of sodium seems to be affected byvthe acetate concentration (figure 1). A comparison of the measured uninhibited specific activity of the granular sludge at various acetate levels, (figure 1 and two additional experiments) with the growth rate of Methanothrix sp. (figure 4), indicates' that the sâbstrate conversion* capacity of the granular sludge drops off relatively fast at decreasing .acejate concentrations, t h e reason for this discrepancy is that below approx. -500 mg/1 C2 the capacity of the granules is limited by the diffusion rate of substrate into the granules, a phenomenon that is also described by others 20^ As a result of this limitation insufficient acetate penetrates to the centre of the uninhibited granules. Consequently the inhibitory effect of sodium at low substrate levels is masked by a partial removal of this physical rate limitation. Obviously substrate diffusion limitation can have important implications for toxicity experiments. For instance data from underloaded continuous reactor systems with immobilized biomass should be employed carefully, because a serious underestimation of the degree of inhibition can be made.
Actvity measurements at several pH-levels demonstrated that the pH does not significantly affect the inhibitory action of sodium in the range 6.5-7.2, but at pH-levels near 8 the inhibitory effect is more pronounced (data not shown).
No clear adaptation of Methanothrix sp. to high sodium concentrations could be demonstrated after 12 weeks of continuous exposure (figure 2). Earlier investigations suggest adaptation of methanogens to sodium 12>13.16. We have reasons to believe however that the word 'adaptation' is inappropriately used in these earlier publications. Kugelman and McCarty 16 conclude that methanogens can be adapted to sodium chloride, but their
2 2 0

Continuously Stirred Tank Reactors (CSTR) were clearly not in a steady state. Results of comparable experiments performed by Kugelman and Chin 6 also indicate that no increase in the tolerance towards sodium is obtained after prolonged exposure. Yang et.al. 12
suggest that the 'adaptation potential' - defined as the ratio between the concentrations causing 50% inhibition in an anaerobic filter, and in batch experiments - for sodium is 1.5. The comparison between batch and continuous experiments, as made by Yang et.al. 12, is very dubious however, because it is not certain that the same microorganisms dominated in both systems, and the filters were probably severely underloaded. De Baere et.al. l s come to the conclusion that adaptation is possible by comparing two reactors containing a clearly different microflora, due to a pH-drop occurring in one reactor after a shock load with sodium chloride. Consequently to our opinion their conclusion is not justified.
A very significant net growth of Methanothrix sp. at high sodium concentrations is clearly demonstrated by the increase in the specific activity of the granules (of almost a factor two) during prolonged exposure to 10 g Na+/1 in a batch reactor, as well as in a UASB-reactor (table 1). Calculation of specific growth rates is impossible due to variations in the effluent acetate concentration.
The results from our activity measurements compare well with those reported by other authors, as far as comparable methods (i.e. activity measurements) have been employed 6,io-u_ A][ comparable studies used Methanothrix sp. (this can be deduced from the experimental conditions applied in the chemostat for cultivation of the enrichment culture used by Van den Berg et.al. 11, and by Yang et.al. 12, and from the origin of the granular sludge used by Dolfing and Bloemen 14). The results of Kugelman and Chin 6 indicate that the maximum specific acetoclastic activity of Methanosarcina sp. is only slightly affected (approx. 10% decrease) at a sodium concentration of 8 g/1.
A comparison with results obtained in continuous reactors with immobilized/biomass shows extremely large differences 6'10-14. Besides the uncertainties concerning the applied sludge loading rate and the maximum capacity of the biomass in these systems, the possibility of antagonistic and synergistic effects must be taken into account when evaluating these results.
CONCLUSIONS
At neutral pH, sodium concentrations of 5, 10 and 14 g Na+/1 cause 10, 50 and 100% inhibition respectively, relative to the maximum specific acetoclastic methanogenic activity of the granular sludge used in this study. These values reflect the sensitivity of Methanothrix sp. towards sodium, as this is the predominant acetoclastic methanogen in the granular sludge used in this study. No adaptation of Methanothrix sp. to high sodium concentrations can be obtained in a period of 12 weeks. Net growth of Methanothrix sp. can be obtained at sodium concentrations of approx. 10 g/1.
At acetate concentrations below 500 mg/1 diffusion limitation partly masks the influence of sodium on the specific activity of the granular sludge used in this study.
The results obtained with short term activity measurements can reliably be used for predictions of the effect of sodium salts on continuously fed UASB reactors.
ACKNOWLEDGEMENTS
This work was financially supported by the Dutch Government, Clean Technology Program grant no. (F.41)LH511 and the Dutch Seed Crushers and Oil Processors Association (VERNOF).
REFERENCES
1. Callander, I.J. and Barford, J.P. Process Biochem. 1983, 18(4), 24-30/3V 2. Van den Berg, L. Can. J. Microbiol. 1984, 30, 975-990
,• 3. Lettinga, G., Hulshoff Pol, L.W., Koster, I.W., Wiegant, W.M., De Zeeuw, W.J., Rinzema, A., Grin, P.C., Roersma, R.E. and Hobma, S.W. Biotechnol. Genetic Eng. Rev. 1984, 2, 253-284
4. Parkin, G.F. and Speece, R.E. Wat. Sei. Technol. 1983, 15(8/9), 261-290
221

5. Rinzema, A., Paardekooper, A., De Vegt, A. and Lettinga, G. in : Proc. EVVPCA Conf. on Anaerobic Waste Water Treatment. September 15-19 1986, Amsterdam, The Netherlands, Industrial Presentations (Europe) B.V., Schiedam, The Netherlands, 1986, 205-218
6. Kugelman, I.J. and Chin, K.K. Adv. Chem. Ser. 1971, 105, 55-90 7. Rudolfs, W. and Zeller, P.J.A. Ind. Eng. Chem. 1928, 20, 48-50 8. McCarty, P.L. and McKinney, R.E. J. Wat. Pollut. Control Fed. 1961, 33(3), 223-232 9. McCarty, P.L. and McKinney, R.E. J. Wat. Pollut. Control Fed. 1961, 33(4), 399-415
10. Kugelman, I.J. and McCarty, P.L. J. Wat. Pollut. Control Fed. 1964, 37(1), 97-116 11. Van den Berg L., Patel G.B., Clark D.S. and Lenti C.P. Can. J. Microbiol. 1976, 22, 1312-1319 12. Yang J., Parkin G.F. and Speece R.E. Recovery of anaerobic digestion after exposure to toxicants (Final
report), Drexel University, Philadelphia, Pa., USA, 1979, US Dept. of Energy Contract No. EC-77-S-02-4391
13. De Baere, L.A., Devocht, M., Van Assche, P. and Verstraete, W. Wat. Res. 1984, 18(5), 543-548 14. Dolfing, J. and Bloemen, W.G.B.M. J. Microbiol. Methods 1985, 4, 1-12 15. Liu Xiao-Sha et.al. in : Proc. Fourth Int. Svmp. Anaerobic Digestion. November 11-15 1985, Guangzhou,
China, China State Biogas Association, 1985, 551 16. Kugelman, I.J. and McCarty, P.L. in : Proc. 19th Ind. Waste Conf.. Purdue Univ., Lafayette, Indiana,
USA, 1965, 667-686 17. Falk, I.S. Abstr. Bacteriol. 1923, 7(2), 33-50 18. ALPH (1975) Standard Methods for the Examination of water and Wastewater. 14th edn., American
Public Health Association, Washington, D.C., USA 19. Koster, I.W., Rinzema, A., De Vegt, A.L. and Lettinga, G. Wat. Res. 1986, 20(12)', 1561-1567 20. Dolfing, J. Appl. Microbiol. Biotechnol. 1985, 22(1), 77-81 21. Gujer, W. and Zehnder, A.J.B. Wat. Sei. Technol. 1983, 15(8/9), 127-167
222

START-UP OF A UASB REACTOR ON A CARBOHYDRATE SUBSTRATE
R. Sierra-Alvarez, L.W. Hulshoff Pol, G. Lettinga
Department of Water Pollution Control, Wageningen, The Netherlands
Abstract
Sludge flotation problems resulted in high biomass wash-out during the first start-up of a laboratory scale UASB reactor fed on a chiefly carbohydrate solution (95% sucrose-COD). As reported earlier (1) this was thought to be due to the poor sludge selection pressure exerted under the conditions applied in the start-up. Light flocculant sludge accumulated in the reactor. The cultivated granular sludge was incorporated in a filamentous matrix. At increasing superficial upflow liquid and gas velocities, gas entrapment led to sludge flotation.
The experiment was continued, in an attempt to enhance the selective wash-out of the voluminous sludge, by applying intermittent stirring and increasing superficial upflow liquid velocities. A dense granular sludge with good settling properties developed in the reactor, but it was fairly weak (strength as resistance against compression forces= 0.36*105
N.m-2). This sludge had a maximum specific methanogenic activity of 0.99 g CH4-C0D/g VSS.day at 30°C which demonstrates that on sucrose good quality sludge can be cultivated. The laboratory one-phase UASB reactor used in this experiment treated a medium strength (3 g COD/L) sucrose waste with 95% soluble COD removal efficiency at loadings up to 20 g COD/L.day. From these results, it appears that the condition set for formation an maintenance of biofilms in fluidised bed reactors (2) (D > /imax) may not be required for granulation in UASB reactors fed on a sucrose waste.
Introduction
Anaerobic treatment of unacidified carbohydrate wastes can be carried out satisfactorily in a one-stage UASB reactors. High loading rates can be accommodated under stable process conditions. Special attention must be paid to the operating conditions. Sludge selection pressure should be provided in order to avoid the development of voluminous poor settling sludge in the reactor.
This paper reports the results on the start-up of a UASB reactor fed on a sucrose waste.
Materials and Methods
Reactor,seed sludge and experimental conditions. The experiment was carried out in a 23.5 L UASB reactor, as described previously (3), at a temperature of 3Oil °C. The reactor was inoculated with 10 L of digested sewage sludge
223

obtained from the municipal sewage sludge digester in Ede, The Netherlands, The volatile suspended solids (VSS) concentration of the sludge was 30.5 g VSS/L, and the maximum specific methanogenic activity, as determined in a batch-fed experiment, amounted to 0.12 C0D-CH4/g VSS.day. The starting sludge concentration in the reactor was 13 g VSS/L.
The reactor was fed on a solution containing 95% sucrose-COD and 5% (acetate (C2) + propionate (C3))-C0D. The concentration of the influent was 1500 or 3000 mg COD/L, depending on the period of operation. Trace elements were supplied according to Zehnder (4) . The addition of other nutrients (N,P and S) was based on an assumed growth yield of 20%, eexpressed as sludge-COD. 1 g NaHC03 for each g COD was added to ensure sufficient alkalinity.
The operation criteria applied in the first start-up (period a) were described earlier (1). Essentially the same operation procedure was followed when the reactor had to be started-up again on day 85 as a consequence of the reactor failure. However, they differed because intermittent stirring and higher superficial liquid upflow velocities (the feed was diluted to 1500 mg COD/L) were applied (period b). In period c (day 127 to 150) the original conditions were restored (influent COD = 3 000 mg/L).
Activity tests. The maximum specific methanogenic activity of the sludge was measured in batch tests (viz. 2 g sludge VSS/L fed on a mixture of C2, C3 and C4 containing 600 mg/L of each one).
Granular size distribution and settling properties. These properties were determined with a modified sedimentation balance (5).
Granular strength. The strength of the granular sludge was measured as resistance against* compression forces according to Hulshoff Pol (5) . - .
Analysis. Volatile fatty acids (yFA) from C2 to Cg.^were analyzed by gas-liquid chromatography. All the other analysis were performed according to Standard Methods.
Results and discussion * ^
The reactor operation during the fi£sfc start-up (period a) was discussed earlier (1). Sludge flotation problems resulted in severe biomass wash-out. The experiment was continued in an attempt to improve the sludge quality by promoting the selection between sludge components with different settling properties.
The results presented in Fig.1 show that a COD-removal efficiency of over 90% could be achieved at a loading rate of 20 g COD/L.day within 35 days after „the second start-up of the experiment (period b).
The sludge settleability improved after imposing intermittent stirring of the reactor content and increasing the superficial flow rate. Biogas entrapped in the sludge could be released effectively. Loosely attached filamentous
aggregates were selectively washed-out from the reactor by the higher hydraulic loading-rate prevailing in the system.
224

K
e en c "B J3 o y
O Cl_ i/>
>-. > n o o
c Ol Z)
CD
c
c o
-C >
1
1 a o
\ o o ( . j
o»
-~ o
\ o co
:c' O l
1 1
X
o
E'
—
2t
20
1b
12
8
^ 0
1000
800
600
'»00
200
0
p e r i o d b p e r i o d c
r^oN
1"
i
• • - <
\
a o
80 g 3 t j o 3 LJ 60 -n
10
a Ä-08
-06
-04 I o
•02 b
8 |
0 20 '.0 60 80 ' 100 ' 120 ' K0 day number
Fig. 1. The process performance of a UASB reactor fed 95% sucrose-COD + 5% VFA-COD solution, (g) indicates the appeareance of macroscopic granules, (f) sludge flotation.
2 500
2000
1500
un S e " S ï 1000 - " rj ,_
500
Ó 20 1,0 60 80 100 120 11,0 day number
Fig. 2. Sludge production during the course of the reactor operation.
225

At day 102 stirring was not necessary and was stopped. After this time the growth of the biomass exceeded the
wash-out. As a result the sludge concentration in the reactor gradually increased from the initial level of 14.3 g VSS/L at day 85 to 39.6 g VSS/L at day 127.
The sludge production during the course of the reactor operation is illustrated in Fig.2.
Representative sludge profiles at different stages of the experiment are shown in Fig.3.
The sludge yield was 0.13 g VSS-COD/g COD r e m o v e d , estimated from the sludge measured in the reactor and from the washed-out sludge recovered in a effluent settler. The high sludge yield obtained on unacidified solutions had a positive effect on the granulation process by accelerating the formation of new granular sludge.
Sludge granules were first observed on day 109 when the space loading, the dilution rate (D) and the sludge loading were 13.6 g COD/L.day, 9.1 day-1 and 0.64 COD/g VSS.day, respectively. The granules formed were pale yellow in color, irregular in shape, with an average diameter of 1 mm. They were smaller than the granules cultivated in the first startup. This could be attributed to the increased granular erosion resulting from the higher sludge bed mixing.
The particle size distribution and characteristics of the sludge during the experiment are given in Fig. 4 and Table. 1, respectively.
Table 1.Characteristics of the sludge cultivated in a UASB reactor fed on a sucrose waste at different moments of the experiment.
DAY^ 0 • 75 126 15q
. , j B —
Ash content (%) 29.'5 "*15.1 8 7 8.8 Strength (10=.N.m2) — — — 0.36 Max. Meth. Activity 0'. 12 0.67 0.60 0.99 * (g CH4-C0D/g VSS.day)' » . •*
Table. 1 shows that the maximum specific methanogenic activity of sludge cultivated , on a carbohydrate waste is satisfactory. The strength of the sludge is rather poor. Hulshoff Pol (5) found a similar strength for a granular sludge fed on sucrose. The strength of granules obtained on partly acidified wastewaters is from 3 to 6 times higher. The growth of acidogenic organisms on the granules seems to diminish strength.
According to Heijnen (2) a D > ßmax (where ßmax is taken for the fastest growing population in the reactor) is necessary condition for proper biofilm formation and maintenance in fluidized bed reactors. From his experiments with unacidified waste water it appears that in the presence of suspended microorganisms (inoculum) D > 14.5 days-1 is required for the attachment of anaerobic biomass.
226

VSS ( g / l )
Fig S. Sludge Profiles at Different stages of the experiment.
05
04
03
02
*. 01
S 03
I °2' S. oi-
03-
02-
0 1 -
0
day 0
>
4
1 I I I — .
day 131
—|
J day 150
r~ —
~\
h— 0 4 0 8 12 16 20
Dp 110 m|
Fig. 4. Particle size distribution of the sludge at several moments of the experiment. The weight fraction is presented as a function of the particle diameter (Dp).
Ill

In the present experiment (period c) the dilution rate (6.6 days-1) was lower than the ßmax of the acidifying population (7.2-12.0 days-1). The stability and development of the granular sludge bed under the conditions imposed on the system indicates that a condition of D > ^tmax is not required for granulation in UASB reactors fed on a sucrose waste.
References
1. Mendez-Pampin R.J., Sierra-Alvarez R., Hulshoff Pol L.W., Lettinga G.(198 6). Start-up of a one phase UASB reactor on a sucrose waste. Paper presented to the EWPCA water treatment c o n f e r e n c e "Anaerobic T r e a t m e n t __ a G r o w n - u p Technology".Amsterdam, The Netherlands. 2. Heijnen J.J. (1984) Biological industrial waste water treatment minimizing biomass production and maximizing biomass concentration. Ph.D. Thesis. Technical University of Delf. The Netherlands. 3. Hulshoff Pol L.W., Dolfing J., de Zeeuw W.J., Velzeboer C.T.M, and Lettinga G. (1983). Granulation in UASB reactors. Water, Science and Technology. 15 291-304. 4. Zehnder A.J.B., Huser B.A., Brock T.D., and Wuhrmann H. (1980). Characterization of an acetate-decarboxilativy non-hydrogen-oxidizing methane bacterium. Arch. Microbiol. 124 1-11. 5. Hulshoff Pol L.W. , van den Worp J.J.M. , Lettinga G. and Beverloo W.A.(1986).Paper presented to the EWPCA water treatment conference "Anaerobic Treatment a Grown-up Technology".Amsterdam, The Netherlands.
228

PHYSICAL AND BIOLOGICAL FACTORS INFLUENCING THE GROWTH OF ANAEROBIC GRANULAR SLUDGE
D.J. Wijbenga and H.Th.P. Bos
Netherlands Institute for Carbohydrate Research, Groningen, The Netherlands
Summary
Granulation of flocculent sludge was stimulated by Nitrogen-flushing during start-up in UASB-reactors with potato-starch factory effluent as a substrate. However, the composition of the seed-sludge, the concentration of the wastewater and the applied hydraulic retention time are also factors of major importance for growth and maintenance of granular sludge.
Introduction
In high rate anaerobic treatment, the sludge retention time should be considerably higher than the hydraulic retention time. In UASB-reaçtors this can be achieved by aggregation of microorganisms into granules with much increased settleability (Hulshoff Pol et al., 1982). The development of granular sludge is, amongst others, dependent of seed-sludge characteristics such as the methanogenic activity, the sludge concentration and the settleability (De Zeeuw & Lettinga, 1983). It has been shown that the start-up of an UASB-reactor, inoculated with digested sewage sludge is a rather slow process, due to the low growth rate of methanogenic bacteria and the selective wash-out of part of the seed-sludge (Hulshoff Pol et al., 1982). To accelerate the start-up of UASB-reactors some factors influencing the outgrowth and maintenance of granular sludge were studied. This paper will discuss the effects of different mixtures of granular and flocculent sludge as an inoculum and the effect of N gas-flushing on granulation with potato-starch factory effluent (pre-acidified potato juice) as a substrate.
Results and discussion
In a first series of experiments start-up with flocculent sludge from a full-scale UASB-reactor was studied in a 11.6L laboratory-reactor and in a 1.8 m pilot-plant reactor. The pilot-plant reactor was irregularly gassed with N . The results obtained after 58 days purification in the 11.6 L reactor (A) (table 1) seemed to indicate rather favourable conditions for granulation, such as a short HRT and a high sludge load. However, wash-out continued untill the end of the experiment at 72 days without any visible granulation and finally we had to increase the HRT. In the 1.8 m pilot-plant reactor granulation was completed already after 29 days at a HRT of 33.2 h and a considerable initial (flocculent) sludge wash-out was observed. An important difference between the laboratory-end the pilot-plant reactor was the gas-surface load (GSL), which was at least 6.9 m/day caused by methanogenesis and even more by some N -gassing in the 1.8 m reactor. At about the same volumetric loading rate (VLR) a
229

value of only 1.6 m/day was possible in the laboratory reactor, due to the different surface/volume ratio.
3 Table 1. Start-up results in a laboratory reactor (A) and a 1.8 m pilot-plant.
Seed-sludge N -flushing
Time (days)
11.61, Reactor (A)
7.0 g/L VSS; 30%ash no
58 72
3 1.8m Reactor
11.2g/L VSS; 30%ash yes
29
COD. (rngO /L) 3000 3800 ^ 8800
COD^" (mgO /L) 900 2000 1800
VFA-COD ^ ImgO /L) 200 1000 270
VLR (kgO /m .day) 6.5 2.0 6.4
HRT (h) 11.1 46.4 33.2
3000
900 200
6.5 11.1
3.2;20
2.0 2.4 1.6
no
3800
2000
1000
2.0 46.4
2.4;20
0.8 0.5 0.4
no
Sludge (g/L VSS;%ash) 3.2;20 2.4;20 6.7; 27 Sludge-load
(kgO /kgVSS.day) 2.0 0.8 1.0
HSL (m/day) 2.4 0.5 1.9 GSL (m/day) 1.6 0.4 >6.9 Granulation no no complet«
VLR = volumetric loading rate; HRT = hydraulic retention time; HSL = hydraulic surface load; GSL = gas surface load.
In a second laboratory reactor (B) the inoculum consisted of 95% (of DSS) flocculent sludge and 5% granular sludge from an UASB-reaator treating sugar beet wastewater. The ash-content of this granular sludge was 68%. After 116 days the system stilt"suffered from sludge wash-out without any visible granulation, so it was decided td^apply N -flushing. After 31 days granulation was completed and the VSS-content of the reactor was increasing. The results of this experiment are summarized in table 2. ' ' , ., •
230

Table 2. Start-up results in a laboratory-reactor (B) seeded with 5% (of
DSS) granular sludge before and after N -flushing.
N_-flushing: 17L/day in 18 pulses/day with 30 seconds/pulse. 2
Reactor surface: 1.6x10 Seed-sludge: 7 g/L VSS; 30% ash.
Time (days) 116 147
N.-flushing no yes
COD. c (mgO /L)
COD (mgO /L)
VFA-CÖD TmgO /L)
VLR (kgO 7m .day)
HRT (h) Sludge (g/L VSS; % ash) Sludge-load (kgO /kgVSS.day)
HSL (m/day) GSL (m/day) GSL during N -pulse (m/day)
Granulation
4500
1720
515
4.
22.3 .0,-18
1.2
0.7 1.1
4600
1560
410
5.6
19.9
5.0 ; 9
1.1
1.0 2.5
170.6
complete
If the final outgrowth of granular sludge in the reactor (B) has been a consequence of the presence of some granular sludge in the seed material one should expect a faster complete granulation starting with a higher amount (50% of DSS) of this sludge in the inoculum with N -flushing right from the start (reactor ( O ) . For reasons of comparison another reactor (D) was also seeded with flocculent sludge, however, already adapted granular sludge with a lower ash content from a pilot plant treating pre-acidified potato juice was used as a second inoculum (50% of DSS) . Results of these experiments are shown in table 3.
Table 3. Performance of laboratory-reactors (C) and (D) seeded with different mixtures of sludges (see text). N„ flushing: 15 L/day in 96 pulses/day with 20 seconds/pulse.
2
Reactor
Seed sludge N -flushing
2
(g/L VSS; % ash)
(C)
6.1,-39 yes
(D)
7.5,-25 no
Time (days) COD. c (mgO /L)
inf , 2 , v COD (mgO /L)
VFA-COD TmgO /L)
VLR (kg8 /m .day)
HRT (h) Sludge (g/L VSS; % ash) Sludge-load (kgO /kgVSS.day)
HSL (m/day) GSL (m/day) GSL during N„
granulation
-pulse (m/day)
102
4740
1450
650
5.0
22.9
5.3;27
0.9
0.8
2.2
44.5
no
102
5600
810
250
9.8
13.8 11.4;5
0.9 1.3 3.1
complete
23'

The results in table 3 clearly show the better performance of the reactor (D) seeded with (50% of DSS) adapted granular sludge. N -flushing wasn't applied in this reactor. Similar results were obtained with N -flushing (reactor (E), results not shown).
In the same way as in reactor (C) no substantial granulation was observed in a reactor without K -flushing seeded with the same sludge-mixture as reactor (C) (reactor (F) , results not shown).
Thus, the composition of the seed sludge is important for granule-development. Starting with a relative large amount of unadapted granules, probably immobilized in an inorganic matrix, in view of the high ash content, resulted in wash-out of inorganic material and outgrowth of only flocculent sludge. On the contrary, a sludge mixture consisting of adapted granules with a lower ash-content and flocculent sludge completely developed into distinct granules. In this case (reactors D and E) we could not notice any positive effect of N -flushing: Start-up progressed fast enough to enable good mixing conditions by biogasproduction itself without any necessity for extra N -flushing. Besides, the lower settleability (table 4) of the adapted granular sludge will provide for better mixing conditions at a low gas-and liguid-upward velocity.
Table 4. Settleability of sludges (expressed as the sedimentation velocity at which 50% of the DSS settles faster).
Sludge Sedimentation velocity (mm/sec)
Flocculent Granular; 68% ash Granular; adapted; 20% ash Inoculum reactors (C) and (F) (mixture! Produced in reactor (C) (flocculent) Produced in reactor (F) (flocculent) Inoculum reactors (D) and (E) (mixture) Produced in reactors (D) and (E) (granular)
0.6 3.4 1.5
As can be seen from table 4 the granular sludge 'from the UASB-reactor treating sugar beet wastewater has superior' settling characteristics. The settleability of the produced granular sludges in reactors (D) and (E) is comparable with the value obtained for the adapted granular sludge. A marked difference in sedimentation was established between the contents of reactors (C) and (F
be responsible for the
of the sludge in reactor (C)
A selective pressure caused by N -flushing could
be responsible for the better sedimentation without any granulation event
Anaerobic digestion on a practical scale in the potato-starch industry will take place at COD-levels of ca. 10,000 mgO /L. So, in a next series of experiments start-up was studied with more concentrated wastewaters. Inocula composed of 50% (of DSS) flocculent sludge and 50% granular sludge (unadapted, 68% ash) with 10 g/L DSS showed no granulation, independent of N -flushing (reactors (G) and (H), results not shown). When the adapted granular sludge was used together with flocculent sludge
232
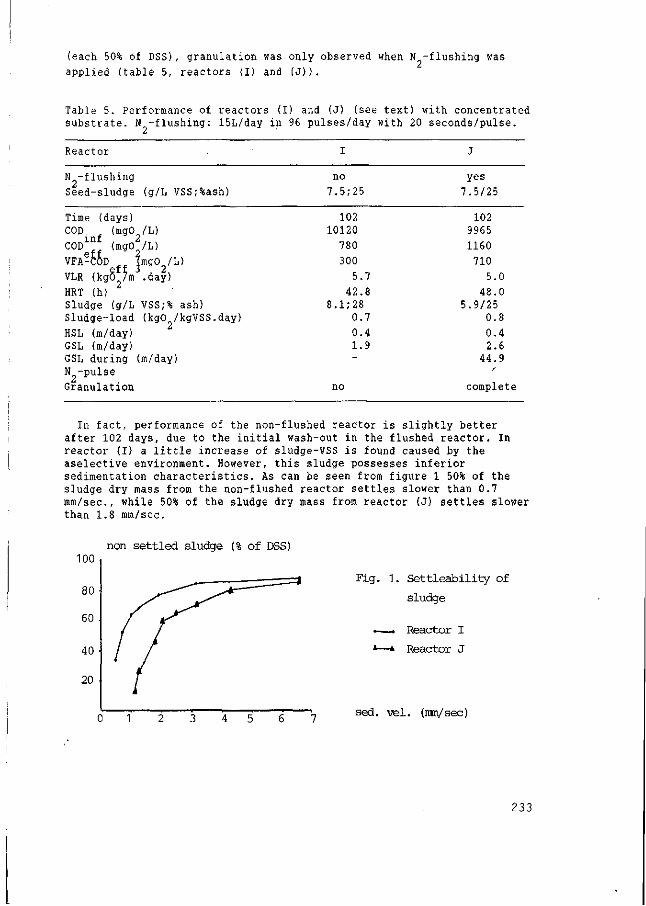
(each 50% of DSS)
applied (table 5,
, granulation was only observed when N -flushing was
reactors (I) and (J)).
Table 5. Performance of reactors (I) and (J) (see text) with concentrated substrate. N -flushing: 15L/day in 96 pulses/day with 20 seconds/pulse.
Reactor
N -flushing
Seed-sludge (g/Ii VSS;%ash)
I
no
7.5;25
J
yes
7.5/25
Time COD.
(days)
'inf ( m g 0 2 / L )
COD1" (mgO /L)
VFA-COD ImgO /L)
VLR (kgO 7m .day)
HRT (h) Sludge (g/L VSS;% ash) Sludge-load (kgO /kgVSS.day)
HSL (m/day) GSL (m/day) GSL during (m/day) N -pulse
Granulation
102
10120
780
300
5.7
42.8
8.1;28
0.7
0.4
1.9
0
102
9965
1160
710
5
48.0 j.9/25
0.8
0.4 2.6
44.9
complete
In fact, performance of the non-flushed reactor is slightly better after 102 days, due to the initial wash-out in the flushed reactor. In reactor (I) a little increase of sludge-VSS is found caused by the aselective environment. However, this sludge possesses inferior sedimentation characteristics. As can be seen from figure 1 50% of the sludge dry mass from the non-flushed reactor settles slower than 0.7 mm/sec, while 50% of the sludge dry mass from reactor (J) settles slower than 1.8 mm/sec.
100
80
60
40
20
non settled sludge (% of DSS)
Fig. 1. Settleability of
sludge
——. Reactor I
*—* Reactor J
sed. vel. (mm/sec)
233

It is concluded that physical and biological factors affect the granulation process. Starting with an inoculum consisting (mainly) of flocculent sludge (1.8 m pilot plant, laboratory reactor (B)) granulation took place after increasing the gas surface load. A similar effect was observed with an inoculum consisting of (each 50% of DSS) flocculent and adapted granular sludge under conditions where no other selective pressure was present (table 5, figure 1). The same seed-sludge showed spontaneous granulation at a lower influent-COD, under the selective forces of a shorter HRT, a higher HSL and higher GSL. However, none of the mentioned conditions favoured the outgrowth of granular sludge from a mixture of (each 50% of DSS) flocculent sludge and non-adapted granules with 68% ash, suggesting that the biomass present in these granules could only grow flocculent, gradually loosing its immobilization matrix by wash-out of inorganic material".
References
De Zeeuw, W. & G. Lettinga, 1983; Start-up of UASB-reactors. In: Proceedings Anaerobic Waste Water Treatment, 23-25 nov. Noordwijkerhout, The Netherlands, pp. 348-369
Hulshoff Pol, L.W., W.J. de Zeeuw, C.T.M. Velzeboer & G. Lettinga, 1982; Granulation in UASB-reactors. Paper presented at the I.A.W.P.R. specialized seminar on anaerobic treatment of wastewater in fixed film reactors, 16-18 June, Copenhagen.
Hulshoff Pol, L.W., J. Dolf ing, W. de Zeeuw & G. Lettinga, 1982; Cultivation of well-adapted pelletized methanogenic sludge. Biotechn. Lett. 5, pp. 329-332.
234

Evaluation report technological aspects
235
REPORT ON THE TECHNOLOGICAL ASPECTS OF GRANULATION
Emer Colleran
Department of Microbiology, University College, Galway, Ireland
As pointed out by de Zeeuw, the phenonemon of anaerobic sludge granulation was discovered initially by observation rather than by a programme of purposeful development. Although very many full-scale UASB plants are now in operation (de Zeeuw), the growth of granular anaerobic sludge is still largely an empirical process and the mechanism of sludge pelletisation remains poorly understood. Even the nomenclature is confusing, with the distinction between granule and pellet or between floe and aggregate remaining unclear either in microbiological, physical or chemical terms.
It is clear that anaerobic sludge exhibits a tendency to adhere to support matrix surfaces giving rise to biofilm formation; to small inert particles present either in the seed sludge or feed (formation of B-type granules) or to purposefully introduced carrier nuclei as in fluidised or expanded bed systems. It is equally clear that self-aggregation also occurs resulting in non-matrix associated, compact spherical granules consisting predominantly of either Methanothrix soehngenii (Type A granules) or Methanosarcina-type acetoclasts (Type C granules). Since different advanced anaerobic reactor designs rely on the formation of one or other of the above sludge aggregate types, the priority from a technological viewpoint is the delineation of exact and reproducible protocols for the development of the particular type of sludge aggregate required for individual applications.
Various theories regarding the primary factors governing the formation of stable, well-settling granules have been advanced by de Zeeuw, Hulshoff-Pol and Wiegant and are summarised in Figure 1. The use of a low selection pressure (i.e. the sum of the hydraulic loading-rate and the gas loading rate), a high SRT and the "erosion type" of sludge wash-out, together with maintenance of low acetate concentrations (following reduction from the higher levels pertaining immediately after start-up) permits the most rapid development of stable, type A pellets. This is achievable using a variety of crude starting sludges but both the concentration of the sludge (de Zeeuw) and the COD content of the feed (Hulshoff Pol) are critical factors. De Zeeuw proposes that type A pellets arise through colonisation by Methanothrix of the central cavities of Methanosarcina clumps which are selected for in the initial stages by the high acetate concentrations. This is supported by the observation that small, young granules have centres composed exclusively of Methanothrix, with Methanosarcina on the outside. Subsequent growth, under the conditions applied, yields more dense Methanothrix-type granules and loss of the outer sarcinal layers.
Hulshoff Pol does not specifically suggest the involvement of Methanosarcina clumps in the initial stages of type A granule formation. Instead, he suggests that a variety of growth nuclei may be involved. These initially give rise to a rather voluminous aggregate which eventually becomes dense bacause of bacterial growth inside, as well as outside, the aggregates.
Application of the same start-up conditions but with maintenance of high acetate concentrations is agreed by all authors to result in the formation
237

150 DAYS
100 DAYS
40 DAYS
STABLE
LOW SELECTION PRESSURE
HIGH SRT
EROSION WASH-OUT
HIGH SELECTION PRESSURE
LOW SRT
EXPANSION WASH-OUT
HIGH »-LOW ACETATE CONC.
HIGH ACETATE CONC.
LOW ACETATE CONC.
ATTACHMENT NUCLEI
NO ATTACHMENT NUCLEI
Figure 1: Suggested factors governing the granulation of anaerobic sludge (courtesy of W. de Zeeuw,^L. Hulshoff Pol and W. Wiegant). . {
of Methanosarcina dominated granules (type C ) . t Since the tendency of Methanosarcina to clump is independent of the selection'pressure, the predominance of type C granules under these conditions arises from a negative (i.e. against other granule 'types') rather then from a positive selection pressure. The application of a start-up protocol which yields type C granules is not reotimmended since they are inherently unstable, apart altogether from the limitations imposed by the sarcina Ks values. It was pointed out, however, that Methanosarcina, unlike Methanothrix, has the capacity to use other methanogenic substrates and, consequently, conclusions as to its possible role in anaerobic reactors should not be based solely on acetate metabolism.
The application of a high selection pressure, low SRT, an"expansion type" of washout and either high or low acetate levels during start-up (Fig. 1) was concluded by all authors to result in the formation of B type granules, provided inert attachment nuclei were present in the seed sludge or in the
238
feed. The settling ability conferred on the young granule by the heavy carrier particle ensures its retention during the expansion washout phase. Sebsequent bacterial growth within and around the initial loosely intertwined filaments results in the development of stable and compact type B granules.
Wiegant proposes an alternative theory for formation of type A granules, based mainly on thermophilic studies. His thesis is that a strong selection for Methanothrix must be applied from the beginning by ensuring that the acetate concentration never exceeds 200mg.L~ . When sufficient growth of Methanothrix has occurred, inevitably small filaments meet and become entangled. This "collection" process provides the initial granule precursors. As the loading rate is progressively and carefully stepped up, growth occurs and the granules increase in size. The final stage is referred to by Wiegant as an "aging" process when growth of Methanothrix in rod-like form ensures the formation of the final dense compact granule.
The studies reported by de Zeeuw, Hulshoff Pol and Wiegant utilised volatile acid mixtures as feed and granule formation was interpreted almost exclusively in terms of the role played by acetoclastic methanogens -i.e. Methanothrix and Methanosarcina. Growth of granules on sugar-containing wastewaters implies the involvement also of a variety of acidogenic and acetogenic bacteria but the nature of their involvement in - and its importance to - the phenomenon of pelletisation remains unclear. According to de Zeeuw, granulation occurs more rapidly when glucose is present^ in the feed. The observation of Dubourguier that small, presumably young, granules have a higher ratio of acidogenic to acetoclastic activity then larger granules infers a possible role of acidogenic species in the early stages of granule formation. Guiot also reported complex changes in the ratios of acidogenic, propionotrophic and acetoclastic activity with increasing size of granules. Increase in size was associated with a large increase in both the acetoclastic and propionotrophic activity whereas the increase in acidogenic activity was significantly smaller.
Although studies on the effect of hydraulic loading rate; gas loading rate; seed sludge composition and concentration; feed strength and internal acetate concentration have allowed definition of start-up protocols which ensure formation of stable granules on certain clearly - defined wastewaters, it is evident that much remains to be understood. The importance of monitoring the specific activity of individual trophic groups throughout the granulation process was stressed by Guiot and other contributors - as a means of providing information on the role played by non-acetoclastic species in granule formation. The need to study different phases of the process -i.e. initiation, maturation, aging - was highlighted by Lettinga.
Detailed microbiological and biochemical research, involving application of new techniques such as the specific immunological probes described by Prensier or better procedures for specific activity measurement, is needed to complement the technological approach to the study of granulation. Ultimately, however, these studies must set down clear and unambiguous protocols which specify, for the engineer, the start-up conditions, in process engineering terms, which will ensure the development and stable maintenance of granules for individual wastewater applications. The use o£ granules developed, for example, on sugar-processing wastewater as seed sludge for reactors treating chemically different and possibly far more complex wastewaters also requires detailed study. Assumptions cannot be made, either, that the wastewater from a particular industry in one country is exactly the same in all countries, as evidenced by difficulties obtained initially in the start-up of UASB reactors treating sugar-processing waste-
239

water in Germany. Differences in the mineral content, particularly with respect to calcium, may have quite dramatic effects on both granule formation and performance. In this context, also, trace element supplementation, particularly during start-up, may be of particular importance with some wastewater types and requires investigation. Apart from the evident need for developing exact and reliable procedures for granule formation, the requirement also exists for the development of a range of on-line probes and sensors which will enable the operator to monitor the performance of a reactor in a more meaningful way.
The majority of full-scale anaerobic reactors constructed to date treat wastewaters that are more or less readily degradable - i.e. food processing, brewery, distillery effluents (de Zeeuw). There is a clear need to focus now on the potential application of the process to more recalcitrant wastewaters emanating from the pharmaceutical and fine chemicals industries. Research is needed on the anaerobic degradability of the chemical components of these wastewaters, on the toxicity of some of these components to, not only the methanogens, but to the acidogenic and acetogenic populations as well,and on the phenomenon of adaptation of anaerobic species to such toxicants. Given the complexity and variability of pharmaceutical wastewaters, the need was also expressed for on-line systems to monitor potential toxicity in full-scale installations. The feasibility of developing granular sludge on complex chemical wastewaters - or of adapting granules .developed on more readily - degradable substrates - requires investigation. The production of stable anaerobic aggregates from known microbial isolates capable of treating a range of recalcitrant organics is also an area worthy of investigation.
Research on alternative reactor designs is also needed. Biofilm reactors, such as the anaerobic filter or DSFF reactor, are currently in full-scale application and the factors governing.the formation, growth and maintenance of biofilms on support surfaces require investigation. In this context, it is worth noting that random-packed reactors, operated in upflow or in downflow mode, contain a high content of suspended biomass in, addition to the attached biofilm and studies on matrix effects require careful.and critical interpretation. The potential*of the hydrid sludge bed/anaerobic filter (SBAF) also requires detailed assessment (Guiot; Tilche). The use of a layer of support material in the upper section of the reactor to reta'jffi sludge aggregates may be particularly beneficial for wastewaters which do not readily promote the growth - or support the maintenance - of .dense, type A granules. Since upflow, random-packed,'-:filters rely, to a large extent, on the activity of suspended biomass' entrapped in the support matrix but are also, as a result, prone to clogging and channelling problems, the omission of the matrix from-the lower bed sections appears to confer a benefit on the SBAF over the fully-packed filter. An alternative reactor design, the hybrid anaerobic baffled reactor described by Tilche, is also of interest since its plug-flow mode of operation permits development of different sludge aggregate types in different areas of the reactor. Its study, at laboratory scale, may provide more insight on the chemic,al and physical factors which promote the formation of different granular or aggregate forms.
Anaerobic digestion is already a well-established process for wastewater treatment at full-scale. A combined microbiological, biochemical and technological approach to the phenomenon of sludge aggregation and biofilm formation will undoubtedly help to ensure reliability of start-up and performance and should also expand the application of the process to more recalcitrant wastewaters.
240

LIST OF PARTICIPANTS
Belgium
K. Verhaegen
Brasil
H. Moreira Soares
Canada
S.R. Guiot
China
i H. Yucai
Yang Xinshan
Denmark
B.K. Ahring
M. Winther-Nielsen
University of Gent Coupure Links 653 9000 Gent tel 091 - 236961
I PT Sao Paulo
N.R.C.C./Institut de Recherche en Biotechnologie 6100 Royalmount Avenue Montreal (Quibec) Tel. (514) 496 6181 Telex 4966233
Central & Southern China Institute of Municipal Engineering Liberation Street 1121 Wuhan City
c/o ENEA - Dip. FARE Via Mazzini 2 40138 Bologna Italy
Institute of Biotechnology Technical University of Denmark Block 223 2800 Lyngby Tel. (02) 884066, local 3552
Institute of Biotechnology Technical University of Denmark Block 223 2800 Lyngby Tel. (02) 884066, local 3552
241

Federal Republic of Germany
U. Austermann Institut für Siedlungwasserwirtschaft und Abfalltechnik Universität Hannover Weifengarten 1 D-3000 Hannover 1 Telex 9 23 868 unihn d
N. Berlenbach Passavant-Werke AG D-6209 Aarbergen 7 Tel. 06120/282194 Telex 4 186 596
M. Brunner Passavant-Werke AG D-6209 Aarbergen 7 Tel. 06120/282194 Telex 4 186 596
A. Carozzi
H. Diekmann
H.-D. Kruse
Wassergütewirtschaft u. Gesundheitsingenieurswesen Technische Universität München Am Coulombwall 8046 Garching
Institut für Mikrobiologie der Universität Hannover Schneiderberg 50 3 000 Hannover 1 Tel. 0511/762-4359
Institut für { Siedlungswasserwirtschaff. und Abfalltedjfrnik Universität Hannover . 4 Weifengarten 1 * D-3000 Hannover. 1 •* Telt.. (Oöilj 762 2898 .Telex 9>'23> 868 unihn d
B. Schink
U. Szewzyk
Fß Biologie-Mikrobiologie Philipps-Universität Marburg D-3550 Marburg/Lahn
University of Konstanz Fak. für Biologie D-7750 Konstanz Tel. 07531-882973
J. Verink Institut für Siedlungswasserwirtschaft Abfalltechnik Universität Hannover Weifengarten 1 D-3 000 Hannover 1
und
242

R. Wollersheim
France
H.C. Dubourguier
G. Prensier
Indonesia
S. Soehendro
E. Soetarto
Ireland
E. Colleran
Italy
A. Farnetti
A. Rozzi
A. Tilche
The Netherlands
A. Alphenaar
Institut für Mikrobiologie Schneiderberg 50 D-3000 Hannover 1 0511/7625247
I.N.R.A. Station de Technologie Alimentaire B.P. 39 59651 Villeneuve d'Ascq Cedex
98 Rue de Général Leclerc 59390 Lys-les-Lannoy
Faculty of Engineering Gadjah Mada University Sekip Unit IV Yogyakarta 55281
Laboratory of Microbiology Faculty of Biology Gadjah Mada University Yogyakarta 55281
University College Department of Microbiology Galway
Instituto Ingegneria Sanitaria Politecnico Piazza L. da Vinci 20133 Milano
ENEA Dip. FARE-CORLAB DIM2 Via Mazzini 2 40138 Bologna
Department of Water Pollution Control Agricultural University De Dreijen 12 6703 BC Wageningen
243
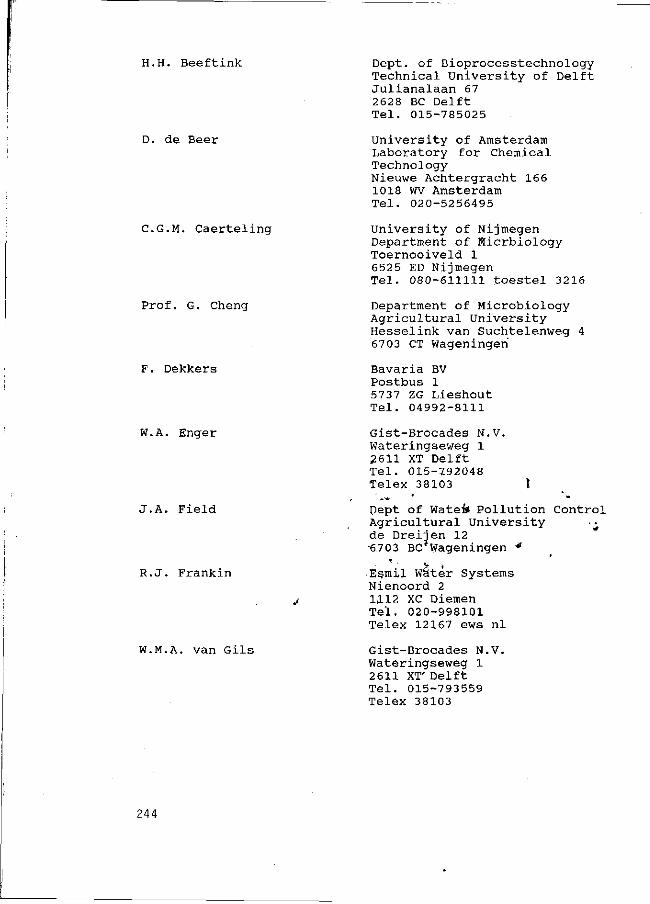
H.H. Beeftink Dept. of Bioprocesstechnology Technical University of Delft Julianalaan 67 2628 BC Delft Tel. 015-785025
D. de Beer University of Amsterdam Laboratory for Chemical Technology Nieuwe Achtergracht 166 1018 WV Amsterdam Tel. 020-5256495
C.G.M. Caerteling University of Nijmegen Department of Hicrbiology Toernooiveld 1 6525 ED Nijmegen Tel. 080-611111 toestel 3216
Prof. G. Cheng Department of Microbiology Agricultural University Hesselink van Suchtelenweg 4 6703 CT Wageningeri
F. Dekkers Bavaria BV Postbus 1 5737 ZG Lieshout Tel. 04992-8111
W.A. Enger Gist-Brocades N.V. Wateringseweg 1 2611 XT Delft Tel. 015-792048 Telex 38103 l
J.A. Field Dept of Watei* Pollution Control Agricultural University - de Dreijen 12 •6703 BC Wageningen "*
R.J. Frankin •Esmil Water Systems Nienoord 2 1,112 XC Diemen Tel. 020-998101 Telex 12167 ews nl
W.M.A. van Gils Gist-Brocades N.V. Wateringseweg 1 2611 XT' Delft Tel. 015-793559 Telex 38103
244

L.G.M. Gorris
J.T.C. Grotenhuis
L.H.A. Habets
University of Nijmegen Dept. of Microbiology Toernooiveld 1 6525 ED Nijmegen Tel. 080-611 111-2940
Department of Microbiology Agricultural University Hesselink van Suchtelenweg 4 6703 CT Wageningen
Pâques BV Postbus 52 8560 AB Balk Tel. 05140-3441 telex 46417
P.J.F.M. Hack
J.P. van der Hoek
C. Holliger
Pâques BV Postbus 52 8560 AB Balk Tel. 05140-3441 Telex 46417
Dept of Water Pollution Control Agricultural University /
De Dreijen 12 67 03 BC Wageningen
Dept. of Microbiology Agricultural University Hesselink van Suchtelenweg 4 67 03 CT Wageningen Tel. 08370-84099
F. Houwen
L.W. Hulshoff Pol
P.M. de Jong
T. Kalker
Department of Microbiology Agricultural University Hesselink van Suchtelenweg 4 6703 CT Wageningen
Dept of Water Pollution Control Agricultural University De Dreijen 12 67 03 BC Wageningen
Dept of Water Pollution Control Agricultural University de Dreijen 12 6703 BC Wageningen
Dept of Water Pollution Control Agricultural University de Dreijen 12 67 03 BC Wageningen
245

J. Koene
E. Koornneef
D. Koot
J.G. Kuenen
G. Lettinga
J. van Lier
A.W.A. de Man
A. Mulder
R. Mulder
C.M. Plugge
TNO-ILS Mr. van Coothstraat 55 5141 ER Waalwijk Tel. 04160-33255
Department of Microbiology Agricultural University Hesselink van Suchtelenweg 4 6703 CT Wageningen
Heineken Technisch Beheer BV Postbus 53 0 2380 BD Zoeterwoude
Microbiology-Enzymology Technical University Delft Center for Biotechnology Julianalaan 67 2628 BC Delft Tel. 015-785308
Dept of Water Pollution Control Agricultural University De Dreijen 12 6703 BC Wageningen
Dept of Water Pollution Control Agricultural University P.O.Box 8179 6700 EV Wageningen
Dept of Water Pollution Control Agricultural University P.O.Box 8179 ' 67 0T) EV Wageningen
Gist-Brocades N.V. 'i Wateringseweg 1 ^ 2611 XT Delft Tel.' 015>r793559 Telex 38103
Un'iversity of Amsterdam Nieuwe Achtergracht 127 1018 WS Amsterdam Tel. 020-522 4090
Departme/it of Microbiology Agricultural University Hesselink van Suchtelenweg 4 6703 CT Wageningen
246

H. Postma Grontmij NV Postbus 2 03 3730 A E de Bilt tel. 030-767480/767911 telex 70279
A. Rinzema Dept of Water Pollution Control Agricultural University De Dreijen 12 6703 BC Wageningen Tel. 08370-83447
G.J. Rijs DBWI RIZA Postbus 17 8200 AA Lelystad Tel. 03200-70481
R. Sierra
M. Smit
A.J.M. Stams
K.Th.M. Swinkels
Dept of Water Pollution Control Agricultural University de Dreijen 12 6703 BC Wageningen
Department of Microbiology Agricultural University Hesselink van Suchtelenweg 4 6703 CT Wageningen
Department of Microbiology Agricultural University Hesselink van Suchtelenweg 4 6703 CT Wageningen
Bavaria BV Postbus 1 5737 ZG Lieshout Tel. 04992-8111
T. Swinkels Bavaria BV Postbus 1 5737 ZG Lieshout Tel. 04992-8111
P. Staugaard Laboratory for Chemical Technology University of Amsterdam Nieuwe Achtergracht 166 1018 WV Amsterdam Tel. 020-5255165
M.J. Teixeira de Mattos University of Amsterdam Nieuwe Achtergracht 127 1018 WS Amsterdam Tel. 020-5224090
24 7

S. Vellinga
C.T.M. Velzeboer
Pâques BV Postbus 52 8560 AB Balk Tel: 05140-3441
Cargill BV Coenhavenweg 2 1013 BL Amsterdam Tel. 020-5801911 extension 53i
J. Voetberg IBVL Postbus 18 6700 AA Wageningen Tel. 08370-19043 Telex: 45371
W.M. Wiegant
J.J.M, van de Worp
Department of Microbiology University of Groningen Kerklaan 30 9751 NN Haren (Gr.)
Korte Raarberg 12 62 31 KR Meerssen
D.J. Wijbenga NIKO/TNO Rouaanstraat 27 9723 CC Groningen Tel. 050-130341
W.J. de Zeeuw
A.J.B. Zehnder
G.R. Zoutberg
AVEBE BA Postbus 15 9614 BA Veendam
Department of Microbiology ,Agricultural University Hesselink van %uchtelenweg 4 67 03 CT Wageningen
University(of Amsterdam Nieuwe Achtergracht 127 1018 WS Amsterdam Tel.' 020-522 4088
Spain
J. Canals Tuca CIDA Hidroquimica Gran Via 645 Barcelona 08010 Tel. 93-301 3016 Telex 50521
248

P. A. Garcia Encina
J. Iza
Department of Chemical Engineering University of Valladolid Facultad de Ciencias 47011 Valladolid Tel. 34 83 251316 Telex 26357 educi e
Universidad de Valladolid Dpto. Ingenieria Quimica Facultad Ciencias 47011 Valladolid Tel. 34 83 251316 Telex 26357 educi e
J.M. Paris Universität Autonoma Dept. Chemical Engineering 08193 Bellaterra Barcelona Tel. 34-3-6920200 ext 1809 Telex 52040 educi e
Sweden
B. Svensson
Switzerland
Mona Fahmi
United kingdom
X.A. Fernandes
D.B. Archer
Department of Microbiology Swedish University of Agricultural Sciences S-75007 Uppsala Tel. 09/46/18/171701
La Renaudière 1041 Bretigny Morrens
Water Research Centre Elder Way Stevenage Hertfordshire SGI 1TH Tel. Stevenage-312444 Telex 826168
Agricultural and Food Research Council Institute of Food Research Microbiology Division Colney Lane Norwich NR4 7UA
USA
J.C. Kissel S PEA Indiana University Bloomington, IN 47405
249

M. Switzenbaum Dept. of Civil Engineering University of Massachusetts Amherst MA 010 03
Yugoslavia
J. Hodalic
R. Marinsek-Logar
Zootechnical Department University Edvard Kardelj Ljubljana Groblje 3 61230 Domzale
Zootechnical Department University Edvard Kardelj Ljubljana Groblje 3 61230 Domzale
250