gabbroic xenoliths and host ferrobasalt from the...
TRANSCRIPT

JOURNAL OF GEOPHYSICAL RESEARCH, VOL. 91, NO. B3, PAGES 3795-3820, MARCH 10, 1986
- w ’G
I
Gabbroic Xenoliths and Host Ferrobasalt From the Southern Juan de Fuca Ridge
JACQUELINE EABY DIXON’ AND DAVID A. CLAGUE
US. Geological Survey, Menlo Park, California
JEAN-PHILIPPE EISSEN~
Uiiioersite Louis Pasteur, Laboratoire de Petrographie, Strasbourg, France
Rare isotropic gabbroic xenoliths occur in sheet and lobate flow fragments of nearly aphyric ferrobas- alt collected along a 12-km section of the southern Juan de Fuca Ridge. Xenoliths comprise c< 1% of the dredge contents and range in size from 1 cm3 (glomerocryst) to 240 cm3. The xenoliths have ophitic to intersertal texture with 5-500/; interstitial glass of ferrobasaltic composition more evolved than the host lava. On the basis of texture and mineralogy, the xenoliths have been subdivided into three types: type I. plagioclase +- olivine -i- glass; type II, plagioclase + augite + glass k olivine; and type III, plagioclase + augite -t olivine -t glass & pigeonite (partially inverted) + Fe-Ti oxides. Mineral and glass inclusion compositions suggest a sequence of evolution for the three xenolith types in which type I is the least evolved and type III is the most evolved. Application of a graphical pyroxene geothermometer to augite in xenolith types II and III yields crystallization temperatures of 1100”-1200’C and to host-lamellae pairs in inverted pigeonite yields subsolidus equilibrium temperatures of 1100’-1150”C. Coexisting titanomagnetite-ilmenite pairs in type III xenoliths yield temperature estimates of 1CK!W-1O7O0C and log fol = -9.7 to -10.8. We infer that the xenoliths represent the partially crystalline “mush” boundary zone of a magma chamber based on the abundance of interstitial glass, zonation of mineral grains in the most crystalline samples, and coherence of chemical trends between interstitial glass, glass inclusions, and mineral phases. The evolved composition of the xenoliths provides evidence for the presence of melts more fractionated than the host ferrobasalt in the magma chamber. The erupted ferrobasalt is a hybrid lava formed by mixing these highly evolved melts with more primitive melts.
INTRODUCTION Recent studies of oceanic crust suggest that size and lon-
gevity of axial magma chambers beneath oceanic spreading centers and the petrology of the erupted igneous rocks are largely a function of spreading rate. Magma chambers beneath slow spreading centers are thought to be small and in some places transitory [Stakes et al., 19841, while beneath inter- mediate to fast spreading centers they are steady state [Mac- donald, 19821. A natural consequence of steady state magma chambers undergoing continuous fractionation is mixing be- tween batches of primitive magma and residual differentiates. Mixing is now recognized as an important petrologic process in the generation of mid-oceanic ridge basalt (MQRB) and has been invoked by various authors to explain (1) the eruption of homogeneous basalt compositions over long time periods [Usselniait aiid Hodge, 19781, (2) the presence of anomalous phenocrysts and melt inclusions [Durigan and Rhodes, 19781, (3) the concentrations of incompatible elements in some mod- erately evolved compositions in excess of that predicted by simple fractional crystallization models [O’Hara, 1977; Bryan aiid Moore, 1977; Bryan et al., 1979; Stakes et al., 19841, (4) a reversal in mineral crystallization sequences [Walker et al., 19791, ( 5 ) magma with chemical and mass balance character- istics of plagioclase accumulation even though the lavas con- tain few or no plagioclase phenocrysts [Flower, 19821, and (6) the homogeneity of isotopic compositions along moderate to fast spreading centers [Coheiz and O’Nioiis, 1982; Allegre et al., 1983; Batiza, 19841.
The role of mixing in the production of ferrobasalt, how-
i *.f
dl
‘Now at Division of Geological and Planetary Sciences, California
’Now at Ofice de la Recherche Scientifique et Technique Outre-
Copyright 1986 by the American Geophysical Union.
Institute of Technology, Pasadena, California.
Mer, Noumea, New Caledonia.
Paper number 5B5733. O 148-0127/86!005B-5733$05.00
379
ever, is less certain. Clague aiid Burieh [1976] used linear least squares mixing models of major elements to show that ferro- basalt can be produced by shallow level fractionation of plagioclase, clinopyroxene, and minor olivine in the average proportions of 9.3: 7.7: 1 with up to 74% of the parental magma fractionally crystalbing. híat tey and Muir [1980], on the other hand, found that a model for mixing of periodically injected batches of primitive magma with residual differ- entiates could more closely predict variations in major and trace elements in ferrobasalt from Deep Sea Drilling Project (DSDP) sites 424 and 425 near the Galapagos spreading center 86”W.
Nutland Cl9831 found no geochemical evidence for mixing between olivine tholeiite and ferrobasalt at the East Pacific Rise near the Siqueiros Fracture Zone. He argued that ferro- basalt in this area formed due to crystal fractionation in small isolated magma bodies such as dikes or shallow intrusions above larger magma chambers. Siiitori et al. Cl9831 proposed that ferrobasalt is generated in small isolated magma bodies behind propagating rift tips. Farther behind the propagating rift tip, extreme differentiation becomes less likely as the steady state thermal configuration of a normal ridge is ap- proached. These studies suggest that the extent of differ- entiation of MORB may be controlled by a delicate balance between cooling and magma supply rates.
The effects of differentiation and mixing are recorded in oceanic plutonic rocks, but at the present time, sampling of the plutonic rocks is severely biased toward the Atlantic and Indian oceans, where slow spreading rates result ir! large dis- placements along transform faults and rift valley boundaries [Engel aizd Fisher, 1975; Hodges aiid Papike, 1976; CAY- T R O U G H , 1979; Fox und Stroup, 19811. Data for gabbros from intermediate to fast spreading centers are less abundant [Vunko aiid Batiza, 1981; Hebert et al., 19831. Moreover, in- terpretation of magmatic conditions is impeded by defor- mation, metamorphism, or brecciation of most oceanic gab- broic and ultramafic rocks. ORSTOM Fonds DQcumentaiire
IC

3796 DIXON ET AI.. : GABBRO ANO FERROBASALT. JUAN DE FUCA RIDGE
50'
48'
4 6'
4 4 =
42'
40'
132" 130" 128' 126' 124' 1
JUAN DE FUCA
{-Area of figure 2 ..
PACIFIC
PLATE Gorda // y.
FRACTURE ZONE\,.. I I I I ...
0
Fig. 1. Map showing location of mid-ocean ridge segments in the northeast Pacific. Location of U.S. Geological Survey study area is shoRn by the solid square.
Rare glass-bearing gabbroic xenoliths occur in nearly aphy- ric ferrobasalt collected from the southern Juan de Fuca Ridge. In this report we present major and trace element data for the host ferrobasalt and mineral phase chemistry for these unaltered gabbroic xenoliths. Detailed discussion of lava chemistry provides a frankwork for comparison with the gab- broic xenoliths. The data are used to evaluate the role of mixing in the formation of ferrobasalt and the longevity of subaxial magma chambeis át the Juan de Fuca Ridge.
GFOLOGIC SFTTINC The Juan de Fuca Ridge extends 500 km from the Blanco
Fracture Zone to the Sovanco Fracture Zone and is a moderate-rate spreading center (30 mm yr- half rate) separ- ating the Pacific and Juan de Fuca plates (Figure 1). Previous petrologic studies of basalt from the Juan de Fuca Ridge show that the southern two thirds of the ridge (south of the Cobb offset) is characterized by strongly fractionated mid-oceanic ridge basalt (MORB) with high Feo , Tio,, MnO, P,O,. Na,O, and K,O and low MgO. C a o , and Alzo, [ K a y er al., 1970: Srheideyger, 1973: Derrick and Lynn. 1975; Vogt and R y n I y , 1976: Waleham, 1977; llelancy et al., 19821. Ferrobas- alt (> 10",1 Feo*, total iron calculated as F e o ) is particularly abundant near the Juan de Fuca Ridge-Blanco Fracture Zone intersection and 20-30 km south of the Cobb orset. The maxi- mum iron and titanium enrichment in the l aws occurs behind zones identified as propagating rifts in both regions [Wilson ct al.. 19841.
High-amplitude magnetic anomalies (60C-1200 gammas) are spatially associated with ferrobasalt at the Juan de Fuca Ridge-Blanco Fracture Zone intersection [ k-ogt and Byerlp, 19761. Vogt and Byerly postulated that the iron and titanium enrichment could result from fractional crystallization in a
subaxial conduit transporting magma longitudinally away from the Cobb hotspot and damming of the flow at fracture zones.
Incompatible element ratios are highly variable, both along the ridge and within single dredge hauls: most are intermedi- ate between normal and enriched MORB [Liias and Rhodes, 19821. The rare earth element (REE) patterns range from light REE depleted to light REE enriched with a dominance of fairly flat REE patterns [Schilling et al., 19821. Sr isotopic ratios of basalt along the Juan de Fuca Ridge have a small range of values; the average *7Sr/s6Sr ratio is 0.70249 f. 0.00014. Though subtle variations exist along strike, the Sr isotopic data d o not show any systematic variation relative to the Cobb hotspot [Eahy er al., 19841.
Smnv AREA The study area is a 12-km segment of the axial valley ap-
proximately 15 km north of the Juan de Fuca Ridge-Blanco Fracture Zone intersection (Figure 1). This area was selected in part due to its relatively simple tectonic setting. The ridge segment has a linear symmetrical axial rift valley and is lo- cated away from hotspots and actively propagating rifts. Pre- liminary descriptions of dredged lavas, dredged sulfides, and the geologic setting of the ridge segment are published else- where [Eaby and Clague, 1982; Koski et al., 1982; Normark et u/., 1982; Morton et al., 19831. Dredge locations and bathy- metry of the study area are shown in Figure 2. The axial valley is extremely flat floored and approximately 1 km wide and 100 m deep.
Seismic reflection studies in the study area [Morton, 19841 show a weak reflector at approximately 2.3 km (0.8-1.0 s) depth interpreted as a shallow level magma reservoir. The low amplitude of the reflection suggests that the velocity contrast across the interface is small, gradational (i.e., partially crys- talline mush), or both.
Deep-tow photographic surveys of the study area [Normurk et al.. 1982; Lichrinan et al., 19831 indicate that lava in the axial valley is dominantly sheet and lobate flow forms, charac- teristic of high effusion rates (Figures 3a-3c). with rare pillows (Figure 34, characteristic of low effusion rates. Most lava dis- plays brilliant glassy reflections. The axial floor is smooth and unfissured outside a nearby continuous linear depression 5-25 m deep and 50-100 m wide that bisects the valley. Sediment cover within the axial valley is least ( <25ub) within the cen- tral zone of collapse features and increases toward the valley margin ( >25%). Zn-rich massive sulfide deposits are aligned along the central bathymetric depression. Valley walls are dominated by pillow flows lacking glassy reflections and having 40-80'!4, sediment cover. The inner valley walls, includ- ing a low terrace about 30 m above the valley floor, are formed by steep normal faults.
HOST LAVA
Petro~~ruphy and Distribution The recovered basalt samples from the axial rift valley are
nearly aphyric with << l o o phenocrysts; plagioclase (1-5 mm) >> augite (1-2 mm) > olivine (1-2 mm). The samples are all nonvesicular ( <O.SL1,,) glassy to microcrystalline basalt. Basalt morphology is dominantly sheet. lobate. and hollow lobate (blisters) flow fragments (90",1) with minor amounts of pillow fragments ( !O"< , ) . The sheet and lobate flow fragments are commonly 4-8 cm thick and have thick glassy selvages on upper and lower surfaces. The upper glassy selvages have a maximum thickness of 13 mm. Palagonite thicknesses range from 0 to 2 pm. suggesting an age of < 1000 years [Hekinian mid Hof l i r t , 19751.
..

DIXON ET AL.: GABBRO AND FERROBASALT, JUAN DE FUCA RIDGE
130°28' 130'24' 130°20' 13O016
3797
44 40
Fig. 2. Scientists aboard the U.S. Geological Survey research vessel S. P. Lee conducted acoustic transponder navi- gated dredging, deep-toward camera surveying, and water sampling during September 1981 (cruise L11-81-WF). Locations of dredge stations are shown with arrows indicating direction of movement of. the dredge. Dredges 3, 8, and 16 sampled older material from the axial walls. Contour interval is 25 m
Lava samples from the axial valley walls are dominantly pillow fragments texturally similar to samples from the axial valley. The outer glassy selvage has commonly spalled off leaving only a few millimeters of glass; palagonite thicknesses on original glass surfaces range from 5 to 16 pm, suggesting an age of 2000-5000 years. Three small porphyritic glass frag- ments recovered in dredge 8 are probably from the valley walls and are the only porphyritic samples collected in the study area. These flat glass chips contain 10% total pheno- crysts with plagioclase >> augite > olivine. The porphyritic glass chips have the thickest palagonite and Mn-oxide coat- ings of all the samples. Where the dredge path could have sampled both the walls and valley, our assignment of location of the samples is based on lava age and morphology of the sampled fragments.
Chemical Composition The host lavas for the xenoliths are mid-ocean ridge ferro-
basalt that exhibits a narrow range of compositional variation. P e rage microprobe analyses of glassy margins of samples from each dredge are listed in Table 1. A representative group of 16 X ray fluorescence whole-rock major and trace element analyses were selected from a larger set of 30 analyses and are listed in Table 2. The lavas from the axial valley are enriched in iron and titanium (Feo* = 11.6-12.2 wt %, Tio , = 1.8-1.9 wt %, Mg number = 52.5-54.7) compared to normal MORB (Feo* < 10.0 wt %, Tio, < 1.5 wt %). Basalt from the axial valley walls is also ferrobasalt but exhibits a slightly wider compositional range; the most (Mg number = 50.3) and least (Mg number = 60.4) differentiated lavas are from the valley walls.
Normative compositions of the nearly aphyric lavas range from slightly (up to 1.5%) olivine normative to slightly (up to 1.7%) quartz normative with the vast majority of the samples being slightly quartz normative. The porphyritic sample 8-2 is the least differentiated lava from the area and contains 3.7% normative olivine. There is a general trend of decreasing nor- mative olivine and increasing normative quartz with increas- ing FeO/MgO ratios, but higher Na,O values also force the norm toward higher normative olivine.
In general, increasing Feo*, Na,O, K,O, Tio,, P,O,, MnO, and SO, are coupled with decreasing MgO, A1,0,, and Cao. SiO, concentrations show no systematic variation with increasing Mg number. Plots of Tio , versus FeO*/MgO and C a 0 versus MgO illustrate these trends (Figures 4a and 4b); data from the Galapagos spreading center at approxiniate lon- gitudes of 85" and 95"W [Byerly et al., 1976; Clague et al., 1981; Fornari et al., 19831 are plotted for comparison. The most striking aspect of the data set is the chemical homoge- neity of samples from the axial valley. The 24 whole-rock X ray fluorescence analyses of lavas from the valley floor have an average analysis and standard deviation of SiO, = 49.89 3. 0.18, A1,0, = 13.65 0.08, Fe,O,* = 13.27 +. 0.19,
MgO = 6.87 & 0.11, Na,O = 2.53 +. 0.12, K,O = 0.18 +. 0.02, Tio , = 1.86 +. 0.04, P 2 0 5 = 0.18 - + 0.01, and MnO = 0.21 f 0.01, which is statistically identi-
cal to the analytical precision. Trace element abundances are listed with major element
analyses in Table 2 and shown on MgO variation diagrams in Figure 5. The range in trace element concentrations (V 308- 378, Cr 331-112, Ni 99.349.0, Zn 100-131, Ga 17.7-20.3, Rb 0.9-2.4, Sr 104.4-109.3, Y 32.1-53.3, Zr 96.9-187, Nb 2.9-6.4
C a 0 = 11.10 +. 0.10,

3798 DIXON ET AL.: GABBRO AND FERROBASALT. JUAN DE FUCA RIDGE
Fig. 3. Deep-tow photographs of typical basalt morphologies found in the axial valley. (a) Low-relief sheet flows with light sediment cover which forms the dominant basalt morphology in the axial valley. (b) Collapsed hollow lobate sheet flow. (c) Lobate basalt flow. (d ) Pillowed basalt flow.
ppm) are similar to those found in ferrobasalt with com- parable FeO*/MgO from the Galapagos spreading center [Perfit et u/., 19831. Increasing F e o * and Tio , are accompa- nied by increasing concentrations of incompatible elements (V, Zr. Y, Zn, Nb) and decreasing concentrations of compatible elements (Ni. Cr).
Ratios of Zr,Nb for the 24 samples from the \alley average 23.4 4 1.1 and are toward the less depleted range for normal- MORB (N-MORB). Similarly, the valley samples have an average Zr?'Y ratio of 3.24 & 0.07, an average Y,Nb ratio of 7.21 & 0.4, and an average P,O, K,O ratio of 1.02 & 0.05 (Figure 4c). These trace and minor element ratios are all within the ranges found for N-MORB elsewhere and are con- sistent with the low R7Sr'RhSr ratios (0.7026) reported for three samples from the valley floor of this segment of the Juan de Fuca Ridge [Euby et u/.. 19841. The sis analyzed samples from the valley walls, while more variable in major element compo- sition than the 24 valley floor samples. have consistently higher P,O, fK,O ratios (1.16 4 0.091, Zr? N b ratios (28.4 & 2.9). and YjNb ratio (8.9 -1- 1.3).
Phuiiocrgsts and h1icrcJphctiocr)Ists Plagioclase compositions are given in Tables 3u and 3h.
Plagioclase phenocrysts and microphenocrysts are weakly zoned. skeletal to euhedral laths in form, and up to 5 mm in length. Plagioclase phenocrysts in sample 8-2 range in compo- sition from An,, to An--. The average composition of 46 microphenocryst analyses is An-, with a range of An,, to An,,. Analyses with maximum and minimum An contents for several samples are listed in Table 3 ~ .
Olikine occurs as euhedral. hopper, and skeletal microphen- ocrysts. Representatile olivine microphenocryst compositions are given in Table 4u and shown in Figure h. Olivine micro- phenocryst compositions range from Fo,, to Fo,,. The most magnesian olivine (Fo,,) occurs in sample 8-2.
Representative pyroxene analyses are ghen in Table 5 and shonn on the pyroxene quadrilateral in Figure 6. Pyroxene compositions referenced in the text are expressed in terms of percent Wo. Fs. and En, where Wo is the atomic proportion 100CaJ(Ca + Fe + Mg). and En = 100MgJ(Ca f Fe + Mg). Quadrilateral components were calculated using the method of Linds/ey unii Andersen [I9831 for comparison to Linds/ey."s [ 19833 graphical pyrox- ene geothermometer and are listed in Table 5. Phenocrysts of augite in sample 8-2 range in composition from Wo,, ,Fs, lEn,, to Wo,, 4Fs1, oEn,, o. The Cr,O, con- tents range from 0.60 to 1.27 wt %, and are about a factor of 3 higher than Cr,O, contents of pyroxene in the xenoliths. The phenocrysts have the most refractory compositions of all ana- lyzed pyroxene. Composition of augite microphenocrysts in samples 22-34 and 26-13B range from Wo,, 5F~,, 4En,, to Wo,, ,Fs, ,En,, 5. Compositions of phenocrysts and micro- phenocrysts in the host lava are similar to phenocryst compo- sitions in Galapagos spreading center lavas [Perfir (2nd For- nari, 19831 and Nazca plate lavas [Xfaxullo und Bcncr, 19761.
Fractionution und Soirrce Charactcristics Variations in major and trace element composition of ferro-
basalt from the southern Juan de Fuca Ridge are similar to the variations in lavas with comparable Feo* h4gO ratic
Fs = 100Fe'(Ca + Fe + Mg),

TABLE 1. Averaged Major Element Microprobe Analyses of Basalt Glasses
Dredge
3-6 8 11 12 4 3 23 5 17 22 26 16 16-6 13
Number of (1) (1) (1) (1) (7) (3) (1) (7) (8) (8) (7) (3) (1) (1) samples
Location wall wall valley? valley valley wall valley valley valley valley valley valley wall? wall
50.8 14.4 11.6
11.9 7.41
2.53 0.09 1.78 0.14 0.17 0.14
50.6 14.3 11.3
12.4 7.19
2.58 0.10 1.77 0.17 0.17 0.14
50.8 50.8 14.1 14.3 12.1 12.1
11.4 11.7 7.10 6.98
2.61 2.45 0.15 0.14 1.92 1.90 0.18 0.16 0.19 0.18 0.16 0.16
50.6 f 0.1 14.2 f 0.2 12.1 f 0.2
11.3 f 0.3 6.95 & 0.08
2.59 4 0.08 0.15 f 0.01 1.88 * 0.05 0.17 f 0.01 0.18 f 0.01 0.15 & 0.01
50.7 f 0.6 14.1 f 0.2 12.0 f 0.1
11.8 f 0.3 6.85 t 0.06
2.48 & 0.11 0.16 f 0.01 1.89 & 0.04 0.18 f 0.01 0.18 f 0.01 0.15 & 0.01
51.2 14.1 11.9
11.1 6.78
2.71 0.18 1.88 0.22 0.18 0.14
50.5 f 0.2 14.1 & 0.2 12.1 f 0.2
11.3 f 0.3 6.81 f 0.16
2.64 & 0.08 0.15 t 0.01 1.89 f 0.05 0.18 f 0.01 0.18 f 0.01 0.15 f 0.01
50.5 f 0.3 14.1 f 0.2 12.2 & 0.1 6.84 f 0.10
2.58 f 0.07 0.16 f 0.01 1.90 f 0.02 0.17 & 0.01 0.18 f 0.01 0.15 & 0.01
11.2 f 0.3
50.7 + 0.4 14.0 f 0.1 12.3 If: 0.1
11.2 f 0.3 6.75 t 0.10
2.66 & 0.04 0.16 f 0.01 1.92 f 0.01 0.18 f 0.02 0.18 & 0.01 0.15 & 0.01
50.5 f 0.4 14.1 * 0.1 12.3 & 0.1
11.3 & 0.2 6.76 f 0.06
2.65 _+ 0.05 0.15 f 0.01 1.92 f 0.02 0.17 & 0.01 0.19 f 0.01 0.15 & 0.01
51.0 f 0.3 14.0 & 0.1 12.4 f 0.2
11.4 f 0.2 6.78 & 0.05
2.50 f 0.05 0.16 * 0.00 1.98 f 0.04 0.18 f 0.02 0.19 f 0.01 0.15 f 0.01
50.7 50.7 14.1 14.0 13.1 12.9
11.5 11.0 6.62 6.26
2.52 2.64 0.14 0.19 2.14 2.14 0.18 0.27 0.19 0.19 0.18 0.15
Total 101.0 100.7 100.7 100.9 100.2 100.5 100.4 100.0 100.0 100.2 100.2 100.7 101.4 100.4
Mg #i 55.90 55.67 53.86 53.37 53.25 53.05 52.96 52.66 52.70 52.11 52.08 52.10 50.02 49.07 FeO/MgO$ 1.40 1.42 1.53 1.56 1.57 1.58 1.58 1.60 1.60 1.64 1.64 1.64 1.78 1.85
Glasses were analyzed for major and minor elements with a three-channel ARL-EMX electron microprobe using US. Geological Survey standards of A-99 for Ti, Na, Si, and Fe; VG-2 and Indian Ocean glass 113716 for Al, Ca, and Mg; K-spar 2 for K; apatite for P; pyrrhotite for S; and fayalite for Mn. Sample current was 15 nA and counting time was 60 s. Six or more were analyzed and averaged to give a representative value for the sample. Matrix corrections were made using a Fram72 program [Beeson, 19671.
TMg # is the atomic proportion (Mg/Mg + Fe). $Fe0 = 0.9 x Feo*.

0 Ca O 3
TABLE 2. Representative XRF Major and Trace Element Analyses of Host Lava - .
Sample
8-2 3-6 12-3
Ihcation
Sia, AI,O Fe203 MgO Ca0 Na,O K,O TiOL PL05 MnO
TO t al
bfg # t calculated Feo$ FeOjMgO
V Cr Ni Zn Ga Rb Sr Y Zr Nh
Zr," Zr,' Y Y:Nb
wall
49.4 14.5 11.6
1 1 .Y 8.01
2.35 0.1 1 1 .50 0.13 0.21
99.7
60.4 9.36 1.17
308. 331. 99.
101). 17.7 0.9
104.4 32.1 %.Y 2.0
33
11.1 3.01
wall
19.5 13.9 12.5
11.7 7.45
2.3 1 0.12 1.69 0.15 0.20
99.5
56.7 10.2 1.37
345. N Y . 69.
117. 18.9
0 . X 87.4 36.5
4.1 111.
27 3.04 8.90
valley
49.5 13.7 12.9
11.3 7.09
2.38 0.17 1 .84 0.17 0.21
99.3
54.8 10.4 1.47
373. 169. 60.
115. 19.0 1.6
103.5 39.9 115.
5.9
21 3.13 6.76
4-28 11-0 3-3 4-23 16-8 5-7 17-1 26- 1 23-1 22-17 5-67 16-6 13-0
valley
49.9 13.7 12.9
11.2 7.00
2.50
1.79 0.18 0.2 1
0.17
99.6
54.5 10.4
I .49
368. 100. 57.
128. 18.4
1.7 112.4 38.6
123. 5.3
24 3.26 7.28
valley?
49.6 13.7 13.1
11.1 6.98
2.41 0.17 1.84 0.17 0.22
99.4
53.9 10.6
1.52
375. 97. 56.
119. 18.6 1.6
39.3
5.3
109.9
128.
24 3.26 7.42
wall
50.1 13.6 13.2
11.2 6.89
2.51 0.18 1 3 4 0.18 0.2 1
99.9
53.5 10.7 1.55
387. 124. 53.
132. 18.8 1.4
109.8 39.1
130. 5.0
26 3.32 7.82
valley
49.9 13.6 13.3
11.1 6.94
2.47 0.18 1.87 0.18 0.21
99.8
53.5 10.8 1.56
365. 94.8 56.
118. 18.4 2.0
109.8 40.6
133. 5.5
24 3.28 7.38
valley
49.7 13.5 13.3
11.1 6.80
2.36 0.18 1.92 0.18 0.20
99.2
53.0 10.8 1.59
399. 108. 54.
121. 18.8 1.9
114.0 40.8
134. 6.2
22 3.28 6.58
valley
50.1 13.6 13.5
11.0 6.81
2.71
1.88 0.18 0.22
o.in
100.2
52.9 10.9 1.59
361. 92.3 49.
119. 20.5
1.4 115.5 40.2
131. 5.5
24 3.26 7.31
valley
49.1 13.6 13.3
11.0 6.78
2.60 0.17 1.87 0.18 0.2 1
99.4
52.8 10.8 1.59
372. 90.1 52.
119. 18.6 1.8
114.1 39.3
128. 5.7
23 3.26 6.89
valley
13.7 13.4
11.0
50.0
6.78
2.53 0.18 1.88 0.17 0.2 1
99.9
52.7 10.8
1.59
369. 86.2 50.
18.5 1.4
113.7 393
130. 5.5
120.
24 3.21 7.24
valley
50.0 13.7 13.5
11.1 6.80
2.58 0.18 1.88 0.19 0.22
100.2
52.5 10.9 1.60
365. 88.5 54.
117. 19.5 1.2
114.4 39.9
128. 5.4
24 3.21 7.39
valley
50.0 13.6 13.4
11.0 6.77
2.57 0.18 1.88 0.19 0.21
99.8
52.7 10.9 1.61
364. 86.0 50.
119. 19.6 1.7
114.2 40.7
133. 5.2
26. 3.27 7.83
valley
49.7 13.7 13.4
11.0 6.74
2.69 0.18 1.89 0.18 0.21
99.7
52.5 10.9 1.62
368. 89.4 50.
121. 18.9 2.1
114.3
132. 40.8
5.5
24. 3.74 7.42
wall'?
49.7 13.4 14.0
11.1 6.58
2.44 0.17 2.06 0.20 0.22
99.9
50.8 11.4
1.73
398. 95.7 51.
127. 19.1
1.3 99.2 44.7
139. 4.8
29. 3.1 1 9.31
wall
49.9 13.5 13.8
10.7 6.32
2.56 0.2 1 2.1 1 0.26 0.23
99.6
50.3 11.2 1.77
318. 112. 49.
131. 20.3 2.4
109.3 53.3
187. 6.4
29. 3.51 8.33
Major element data of fresh niicrucrystalline samples were obtained by X ray fluorescence analysis (XRF) of fused glass discs, prepared by fusing the sample with a lanthdnUm-bedring lithium borate fusion mixture at the University of Massachusetts, Ronald B. Gilmore Memorial Laboratory. Trace elements (Tio,, V, Cr, Ni. Zn, Ga, Rb, Sr, Y, Zr, and Nb) were determined by XRF analyses on pressed powder pellets. Detection limits and precision (in ppm) for the trace element analyses are 0.7 and 0.5 for Nb, 0.7 and 1 for Zr, 0.5 and 2 for Sr, 3 and 1 for Zn, 3 and 3 for Ni, 3 and 5 for Cr, 4 and 5 for V, and 0.005 and 0.02 (wt Ou) for Tio,.
TMg # = atomic proportion Mgí(Mg 4- Fe). $Calculated F e 0 = (0.9 Feo*).

DIXON ET AL.: GABBRO AND FERROBASALT, JUAN DE FUCA RIDGE 3801
4
l?
3
v o" F
2
a
Q 86'W GalapagoslFornari et al.1983)
Juan de Fuca (This study)
A Juan de Fuca-average of 24 samples from axial valley (This study)
Q Q
' ANDESITE
Q 1 MORB RHYODACITE
I
l 2 1 10
JdF a GSC 95"W Q GSC 85OW
-
12 - /
10 -
3 - v
s 6 -
JdF A GSC 95"W Q GSC 85OW
4 -
I l I I I I I l I l I l I I I I I I I 4 8 12 16 20 O 2 4 6 8
Feo*/ MgO MgO Iwt %I Fig. 4a Fig. 4b
Fig. 4. Variation diagrams for major and minor element compositions of host lava from the southern Juan de Fuca Ridge. Data from the Galapagos spreading center (GSC) are included for comparison. (a) Plot of Tio, versus FeO*/MgO shows the narrow range in composition at the lower end of the ferrobasalt field of the Juan de Fuca Ridge basalt data from this study superposed on the wide range in compositions from the Galapagos spreading center differentiation suite [Byerly et al., 1976; Fornari et al., 19831. (b) Plot of Ca0 versus MgO shows the trend of decreasing C a 0 with decreasing MgO due to crystallization of olivine, clinopyroxene, and plagioclase. Juan de Fuca Ridge data from this study exhibit the same trends as the Galapagos spreading center data [Clague et al., 1981; Foritari et al., 19831 but are more limited in extent of differentiation. (c) Plot of P,O, versqs K,O for Juan de Fuca Ridge data from this study compared to Galapagos spreading cedter data [Clague et al., 19811. The ratio of two incompatible elements should be indicative of the source regions. Data from Galapagos spreading center at 85"W, Galapagos spreading center at 95"W, and Juan de Fuca Ridge (this study) define linear but distinct trends suggesting differences in the source regions. Data from the axial valley form a tight cluster in Figures 4b and 4c. Data from the valley walls are more scattered.
from the Galapagos spreading center. Galapagos spreading center lavas from near 95"W and 86"W exhibit decreasing P,05, Tio,, V, and Zn contents at very high FeO*/MgO ratios; these trends are consistent with late stage fractionation of apatite and titanomagnetite. Lavas from the southern Juan
0.4 GSC 85"W
Juan de Fuca Ridge 4 0.3
(FI
4 o" 0.2 a"
0.1
O O o. 1 0.2 0.3
K20 Fig. 4c
de Fuca Ridge are more fractionated than normal MORB but show a more restricted compositional range than lavas from the Galapagos spreading center and do not appear to have reached saturation with titanomagnetite or apatite.
These major element trends for the Juan de Fuca samples can be modeled by fractionation of plagioclase, clinopyroxene, and lesser olivine as described by Clague and Bunck [1976]. Fractionation, however, may not be a unique solution. Mixing of relatively primitive magmas with extremely evolved magmas residing in the subaxial chamber can produce nearly identical major element geochemical trends. The role of mixing will be developed later in the paper.
The Sr isotopic data [Eaby et al., 19841 and the trace and minor element ratios discussed above indicate that these lavas from the southern Juan de Fuca Ridge are derived from a relatively depleted source region. Several other samples from this section of the ridge have rare earth patterns that are depleted in light rare earth elements, as one might expect based on the other trace element and isotopic data. These samples have chondrite-normalized La/Sm of 0.674.75 [Sclzill- ing et al., 19821, similar to the 95"W Galapagos spreading center source which has chondrite-normalized La/Sm = 0.67 [Clagite et al., 19813 and 87Sr/86Sr ratios of approximately 0.7027-0.7028 [ Verma and Schilling, 19821. In contrast, the source region beneath 85"W on the Galapagos spreading center has chondrite-normalized La/Sm = 0.46 and s7Sr/86Sr = 0.7024-0.7025. We conclude that the source region beneath this section of the southern Juan de Fuca Ridge is comparably depleted to that at 95"W but is far less

3x02
200 -
150 -
I100 4 : z
50 -
c
DIXON ET AL.: G A R H R ~ AND FERRORASALT, JUAN DE FUCA RIDGE
JdF c. G s c - 9 s - w
o GSC-85-W
G
5. A
120
100
80 c
.d
L m
60
40
I A ' GSC-95-W JdF
A
0 /'
JdF JdF A GSC-95'W
400
- d
zoo
O O 2 4 6 8
5 GSC 85'W t
O 2 4 6 8 Mgo l w t % I MgO i w t 'XI
non
' \" 1 JdF 3 'Oo A GSC-95OW 'p" @Oar 400
JdF GSC-Y5'W
'? GSC-85"W
.? JdF
\ ~i GSC-95'W
\ o GSC-85'W \
150 i
200 - -L JdF
A GSC-95"W
o GSC-RS'W
Ê i150;-.\,* 2 100 a \ o
50 k2
-
O I I I I I I I ,
I 4 t P MiIQ 1*1 7 7 1
Fig. 5. Trace element content as a function of bfgo cnntent for lava from the southern Juan de Fuca Ridge compared to data from the Galapagos spreading center [Clayw ct d.. 1981; Perjir t't al.. 19831. Lines are drawn hy eye. Trace element contents of samples from the axial valley form a tight cluster. while trace element contents of samples from the axial walls define the extremes of the enclosed fields.
depleted than that a t 85'W on the Galapagos spreading center. The source regions underlying the Juan de Fuca Ridge and near 95"W on the Galapagos bpreading center. although comparably depleted ln terms of L q S m and "'sr, ?Sr. are not
identical ln that Juan de Fuca Ridge source has higher abun- dances of Sr and Na.
Differences ln trace element ratios [Clngrt. et C I / . , 1981; LeRncv er al.. 19831 for the axial \alley and axial \allei \\all

D R O N ET AL.: GABBRO AND FERROBASALT, JUAN DE FUCA RIDGE 3803
samples indicate that the older valley wall lavas were derived from a more depleted source than the younger valley floor lavas. This observation suggests that the source regions for Juan de Fuca MORB may be heterogeneous on a time scale of thousands to tens of thousands of years.
I? XENOLITHS
Xenoliths comprise <<l% of the dredge contents. They range in size from 1 cm3 (glomerocryst) to 240 cm3 (Figures 7a and 7b). Xenoliths commonly occur near the upper glassy sel- vage and along fractures of the sheet and lobate flow frag- ments. The common occurrence of xenoliths on fracture sur- faces suggests that a mechanism such as differential contrac- tion during cooling between the host lava and the xenolith created strain that induced fracturing.
On the basis of texture and mineralogy, xenoliths have been subdivided into three types : type I : medium-grained; plagio- clase + olivine + glass; type II: medium-grained; plagio- clase + augite * olivine + glass; and type III: medium- to coarse-grained; plagioclase + augite + olivine -1- inverted pigeonite & Fe-Ti oxides + glass. All xenoliths have small vol- umes (< 1%) of sulfide globules.
The following sections describe the textures and phase chemistry of each xenolith type. Compositions of plagioclase, olivine, pyroxene, oxides, and interstitial glass are given in Tables 3,4, 5, 6, and 7 and shown in Figure 6, 8, and 10. Glass inclusion data (Tables 8 and 9 and Figure 11) will be discussed separately. Modal compositions of xenoliths are shown in Table 10.
'4
'i
'h
*a
Type I Xenoliths Three small (< 1 cm3) olivine plus plagioclase xenoliths
were found. Xenoliths 5-17, 17-7, and 17-12 are open-textured, medium-grained hypidiomorphic interstitial gabbros. Type I xenoliths are a loose cluster of crystals with olivine (up to 3 mm in length) subophitically enclosing or interstitial to euhe- dral plagioclase (up to 3 mm). Mineral grains are fresh and have not reacted with the surrounding melt. A rim of variolitic cystallization formed upon quenching around plagioclase.
Plagioclase occurs as weakly zoned laths having the same compositional range as the microphenocrysts in the lavas. The compositional range in sample 17-12 is An,, to An,, and in sample 5-17 is An,, to An,,. The average composition of 24 analyses is An72.,, slightly more sodic than the average micro- phenocryst composition.
Olivine compositions within each sample are homogeneous; the range of olivine compositions in sample 17-7 is Fo,,., to Fo,,,, and in sample 17-12 is Fo,,,, to Fo,,.,. These compo- sitions are intermediate between compositions of micropheno- crysts and olivine in xenolith types II and III. The range of compositions in sample 5-17 is Fo,,., to Fo,,.,, which are more like those for olivine in type II xenoliths. N i 0 contents in type I olivine were not analyzed.
Interstitial glass (25-30 modal '%O) is compositionally similar to the surrounding host glass. FeO/MgO (using F e 0 = Feo* x 0.9) is 1.62 for the interstitial glass similar to 1.60 for the host lava. Interstitial glass contains 1.92 wt % Tio,, 2.58 wt Yn Na,O, and 0.18 wt YO P,O,.
Type I I Xenoliths Type II xenoliths are composed dominantly of plagioclase,
augite, and glass. Minor volumes of olivine are present. Sam- ples 17-1 and 5-0 (Figure 7a) are representative of type II xenoliths and are described in detail below.
Sample 17-1, the largest open-textured xenolith (240 cm3), forms a toe of a sheet flow fragment and is texturally similar
to glassy, highly porphyritic lava (Figure 74. Euhedral to sub- hedral augite, and rarely olivine, poikilitically enclose the plagioclase laths to form subophitic clusters. Abundant glass inclusions indicate rapid crystal growth. Glass adjacent to plagioclase and augite is opaque brown due to variolitic crys- tallization. Interstitial glass comprises 50 modal % of the xenolith and is pale translucent brown away from the crystal grain boundaries. Flow of melt around crystals is indicated by variations in color and incipient crystallization (Figure 7 4 . The absence of embayed crystals or mineral zonation suggests that glass and minerals have not reacted.
Sample 5-0 is a medium to coarse grained hypidiomorphic granular gabbro (Figure 7e). Euhedral plagioclase laths are similar in size and morphology to those in 17-1 but exhibit slight zoning. Augite oikocrysts are up to 1 cm across. Inter- stitial glass (22 modal %) is opaque due to incipient crys- tallization. There is no evidence of interaction between xeno- lith minerals and the surrounding lava; mineral-glass inter- faces are sharp with euhedral crystal forms.
The majority of the type II xcnoliths consist of subophitic to interstitial clusters of plagioclase + augite + glass, smaller than (< 1 cm3) but similar to xenolith 5-0. Rare inclusions of olivine in augite and vice versa occur, but generally these phases are not intergrown.
Plagioclase laths in type II xenoliths range in composition from An,.,, to An,,., and have an average composition of An,,,,. Plagioclase in open-textured xenoliths (i.e., 17-1) is weakly zoned and shows little variation within a single xeno- lith. Plagioclase compositions from more crystalline xenoliths have slight normal oscillatory zoning. Early formed plagio- clase laths, which are poikilitically enclosed by augite, tend to be more Ca-rich than small tabular grains growing adjacent to interstitital glass or at the xenolith-host lava boundary.
Olivine in type II xenoliths occurs as small discrete grains at the edge of the xenolith in samples 5-0 and 5-77 or as subhedral to anhedral grains subophitically enclosing small euhedral plagioclase laths in sample 5-1. These olivine grains are unzoned and range in composition from Fo,,,, to Fo,,.,.
Pyroxene in type II xenoliths occurs as homogeneous oi- kocrysts and more rarely as small discrete grains in the inter- stitital glass. The dominant compositional trend is one of de- creasing Mg, Ca, and Cr and increasing Ti with increas- ing Fe content. Oikocrysts range in composition from Wo41 .5F%. ,En,,. 7 (sample 4-71 to Wo40.0Fs12.3En47.7 (sample 17-65). Analyses 11 and 14 in Table 5 are typical of most of the oikocrysts. An Fe-enrichment trend is also ob- served between oikocrysts and small augite grains in the inter- stitial glass or near the xenolith-host lava boundary. Analyses of pyroxenes from sample 5-1 (analyses 12 and 13 in Table 5) show that the oikocryst has 100 x Fe/(Fe + Mg) ratio of 15.9, while a small grain in the interstitial glass has a ratio of 21.5. The more differentiated composition of late forming pyroxene is also observed in samples 5-0 and 5-13.
Interstitial glass compositions in type II xenoliths define Fe-enrichment trends with increased crystallinity of the xeno- liths. Compositions range from similar to the host lava (FeO/MgO (using F e 0 = Feo* x 0.9) ratio is 1.67) to more differentiated than the host lava (FeO/MgO ratio is 2.59). Tio, content ranges from 1.90 to 2.65 wt %. Na,O content ranges from 2.67 to 3.28 wt 'YO. P,O, content ranges from 0.20 to 0.33 wt 'Yo. K,O content ranges from 0.18 to 0.33 wt %. Chemical variation trends defined by the interstitial glass are similar to trends observed in the host glass but extend to more evolved compositions. Figures 8a and 8b show increasing Tio, with decreasing Mg number and increasing PzO, and K,O at essentially the same P 2 0 , / K , 0 ratio.

3804 DIXON ET AL.: GABBRO AND FERROBASALT, JUAN DE FUCA RIDGE
Type I I I Xenolith
Type III xenoliths are generally coarser-grained. more crys- talline, and mineralogically more evolved than types I and II. The most crystalline type II1 xenoliths are characterized by zoning in plagioclase and augite, a wide range of grain sizes, intricate intergrowth textures, and random mineral grain orientation. Type III xenoliths have reacted with the host melt more than the other xenolith types. Samples 26-1A, 5-7A, 5-7B, and 5-8B are typical of type III xenoliths (Figures 7h, 7f; 7g. and 711).
Sample 26- 1 A is a medium-grained hypidiomorphic granu- lar intersertal gabbro. Grain sizes range from 0.1 to 6 mm for plagioclase, 0.3 to 3 mm for olivine, and 0.2 to 5 mm for augite. The texture is more equigranular than other type III xenoliths. Mineral grains have no preferred orientation. Plagioclase is subhedral to euhedral. Larger grains exhibit slight optical zonation. Although normal zonation is most
common, rare oscillatory zonation is also present. Olivine and augite appear to have crystallized simujtaneously. Crystal- mesostasis interfaces are sharp.
Samples 5-7A and 5-8B are coarse-grained hypidiomorphic granular olivine gabbro. In sample 5-7A olivine is the main
continuous subhedral grains. Olivine and augite subophiti- cally enclose plagioclase but do not enclose each other. Larger plagioclase grains are subhedral because of impingement of cocrystallizing olivine. Only 1 modal "6 interstitial glass re- mains. In sample 5-8B, augite is the main oikocryst phase which subophitically encloses plagioclase (up to 1 cm in length). Augite and plagioclase exhibit intricate intergrowth textures (Figure 9a), indicating simultaneous growth. Normal and oscillatory zoning occurs in the larger plagioclase grains. In .5-7A and 5-8B the larger augite grains 'exhibit optical zoning. Interstitial glass comprises 3 modal O,,:Augite has no exsolution lamellae of orthopyroxene, but minute exsolution
oikocryst phase and occurs as large (5 mm across). optically I
TABLE 3u. Plagioclase Analyses
Microphenocrysts Type I Type II
7 1 I 3 4 5 6 7 8 9 10 11 12 13 14
Sample 4-35 Comment? max
4-35 8-2 8-2 5-7.4 17-12 17-12 5-0 5-0 min maa min max min core midway
5-0 rim
5-0 small in gm
51.5 30.4
13.6 0.54
3.91 0.03
100.0
5-0 small in aug
50.4 31.1
14.4 0.53
3.41 0.04
99.9
5-13 5-13 small small in gm in aug 49.4 50.2 30.7 30.5
14.5 13.9 0.75 0.61
3.24 3.40 0.02 0.04
98.6 98.6
SiO, 47.6 AI,O, 32.7 Fe0 0.38 Ca0 17.4 N a 0 1.79 K,O ... Tot al 100.9
51.0 49.4 51.9 50.0 47.4 51.1 50.8 50.8 30.6 31.6 29.0 31.3 32.8 30.4 31.1 30.9
14.7 16.0 14.5 14.9 17.9 13.9 14.2 14.0 0.51 0.13 0.48 0.52 0.44 0.49 0.41 0.52
3.177 2.57 3.43 3.11 1.60 3.68 3.55 3.66 ... 0.04 ." . ' . 0.03 0.02 ... ...
100.2 ino.0 100.3 99.9 100.2 99.6 100.1 99.9
51.0 31.2 0.65
3.56 0.04
14.3
100.8
Clirions per Æonnula Unit 2.290 2.180 2.340 2.316 1.687 1.779 1.639 1.670 0.020 0.017 0.019 0.016 0.731 O.XX2 0.682 0.691 0.276 0.144 0.324 0.313 0.002 " ' " 0.001
5.006 5.002 5.004 5.007 72.5 86.0 67.8 68.8
~ y p e ri
2.3 12 1.667 0.025 0.693 0.313 0.002 5.012 68.8
1.348 2.302 1.631 1.677 0.021 0.020 0.664 0.707 0.346 0.303 0.002 o.in2 5.012 5.011
65.6 69.9
2.293 2.322 1.679 1.661 0.039 0.024 0.719 0.687 0.292 0.305 0.001 0.002 5.013 5.001 71.0 69.1
Si 2.192 Al 1.777
2.316 1.644 0.019 0.718 0.290 ...
4.997 71.2
7.263 2.382 1.707 1.568
0.785 0.711 0.226 0.303
0.017 o.ni9
. . . ..
4.998 4.986 77.6 70.2
2.321 1.661 0.020
0.324 0.001 5.01 1
0.684
67.8
Fe 0.014 Ca 0.858 Na o. 1 60 K Total 5.001 An llo 84.3
...
15 16 17 18 19 20 21 LA 7 9 23 24 25 26 27 28
Sample 5-77 Comment? large
in gm
sio, 50.7
Fe0 0.60 C a 0 11.3
K 2 0 0.04 Totd 98.6
AI20 , 29.8
Na,O 3.25
5-77 small in gm
50.4 30.0
13.7 0.68
3.51 0.04
98.4
17-1 large in gl
50.6 29.9
13.4 0.58
3.67 0.07
98.2
17-1 small in gl
50. 1 32.1
14.6 0.60
3.19 0.03
100.6
17-1 large
in aug
50.4 30.2
13.7 0.62
3.65 0.02
98.6
17-1 Smdll in gl
49.9 30.4
14.1 0.53
3.38 0.03
98.4
17-4 core
in aug
50. I 30.9 0.55 14.1 3.3s 0.03
99.0
17-4 small in aug
49.5 30.7
14.9 n.60
2.98 0.03
98.7
17-4 small in aug
49.1 31.0
14.9 0.60
2.87 0.03
98.5
17-65 small in aug
51.3 29.6
13.0 0.56
3.95 0.05
98.5
17-65 small in gm
52.3 28.9 0.60
12.7 4.34 0.05
98.9
17-65 small in aug
51.5 29.5
12.9 0.57
4.14 0.05
98.6
17-66 small in gl
51.2 30.6
13.5 0.59
3.58 0.03
99.6
17-66 small in gl - 50.5 30.6 -,
b
0.56
3.30 0.04
14.3
99.3
Clition5 pcr Forniulu LinIr 2.332 2.316 2.307 2.294 1.647 1.662 1.679 1.678 0.024 0.020 0.021 0.023 0.677 0.701 0.696 0.738 (1.327 0.304 0.299 0.268 0.u01 0.002 0.002 0.002
5.008 5.00s 5.00~ 5.003
67.4 69.6 69.8 73.2
2.28 1 1.696 0.023 0.740 0.158 0.002
5.000
74.0
7.405 1.565 0.023 0.624 0.387 0.003
5.007
61.5
2.374 1.603 0.022 0.639 0.370 0.003
5.007
63.1
2.340 2.319 1.647 1.657 0.022 0.022 0.668 0.706 0.317 0.294 0.002 0.002
4.996 5.OOo 67.7 70.5
Si Al Fe Ca Na Ii
Total
An ' ' I t
2.344 2.338 1.622 1.639 0.023 0.027
0.291 0.320 0.ow o ou2
0.708 0.677
4 . 9 ~ 5.003
70.7 67.8
7.348 1.632 0.023 0.666 0.330 ï).O04
5.003
66.6
2.273 1.719 0.023 0.71 1 0.281 0.00'
5.(109
71.5
2.369 1.611 0.022 0.645 0.354 0.003 5.004
b4.4

DIXON ET AL.: GABBRO AND FERROBASALT, JUAN DE FUCA RIDGE
TABLE 3a. (continued)
3805
Type III
29 30 31 32 33 34 35 36 37 38 39 40 41
8 Sample Commen tt
r
17-66 11-69 small Ig in gl , in gm
51.1 50.5 30.5 30.2
13.9 13.9 0.57 0.54
3.48 3.53 0.04 0.05
99.6 98.7
17-69 small in gm
50.3 30.5 0.57
5-7A core large 50.8 30.9
14.3 0.63
3.53 0.03
100.2
5-IA 5-7A 5-7A 5-IA small small core core center edge edge center
50.5 52.9 49.7 49.9 31.2 28.1 30.6 30.4
14.4 11.8 14.1 14.0 0.43 0.67 0.62 0.64
3.51 4.62 3.27 3.46 0.03 0.17 0.06 0.04
100.1 98.3 98.4 98.4 Cations per Fornida Unit
2.303 2.441 2.307 2.317 1.679 1.531 1.675 1.658 0.016 0.026 0.024 0.024 0.702 0.585 0.701 0.699 0.311 0.413 0.295 0.312 0.002 0.010 0.003 0.002
5.013 5.006 5.005 5.012
69.2 58.0 70.2 69.0
5-8B 5-8B core rim
center center
51.1 52.9 30.8 29.1
13.9 11.9 0.60 0.68
3.61 4.60 0.04 0.09
100.0 99.3
16-7.4 small in gl
55.3 21.5
12.1 0.66
4.78 0.08
100.4
26-1A small in gl
50.4 29.9
13.2 0.66
3.93 0.05
98.1
26-1A small in aug
49.0 31.1
14.4 0.65
3.05 0.07
98.3
Ca0 Na,O K,O Total
14.2 3.21 0.04
98.9
Si Al Fe Ca Na K
Total An TO
2.337 2.332 1.644 1.645 0.022 0.021 0.683 0.688 0.308 0.316 0.002 0.003
4.996 5.005
68.8 68.3
2.322 1.658 0.022 0.700 0.293 0.002
4.997
70.5
2.317 1.658 0.024 0.699 0.312 0.002
5.012
69.0
2.328 2.416 1.655 1.568 0.023 0.026 0.679 0.583 0.319 0.408 0.002 0.005
5.006 5.006
67.9 58.5
2.495 1.461 0.025 0.583 0.418 0.005
4.987
58.0
2.341 1.639 0.025 0.655 0.354 0.003
5.017
64.7
2.280 1.706 0.025 0.716 0.275 0.004
5.006
72.0
tmax, min refer to maximum and minimum An content; core, rim refer to location within large zoned grains; center, edge refer to location within xenolith; gm = groundmass; aug = augite; gl = glass; large = >4 mm; small = <2 mm. Microprobe data for plagioclase were obtained using an ARL-EMX three-channel microprobe and reduced using the matrix correction program of Fram 72 [Beeson, 19671. U.S. Geological Survey standards used in analysis of plagioclase were Amelia Albite for Na; Crystal Bay Bytownite for AI, Si, Ca; K-spar 2 for K; and Fayalite for Fe. Sample current was 15 nA and counting time was 60 s.
Samples 5-7B and 16-7A consist dominantly of plagioclase and augite in a loose cluster of crystals. Pigeonite, found only during microprobe analysis, has not inverted and is optically continuous with adjacent augite. Minerals in these two sam- ples have moderately differentiated compositions and exhibit zoning and evidence for reaction with the host melt. Zones of abundant glass inclusions occur between augite with different extinction angles and were probably trapped between inter- growing crystals.
Olivine in type III xenoliths is coarser-grained and more iron-rich than microphenocrysts in the host lava and olivine in xenolith types I and II. The average composition is Fo,,.,. Olivine in samples 26-1A occurs as small (< 1 mm) discrete grains with an average composition of Fo,,.,. Olivine in sample 17-3 occurs as two small grains at the edge of the xenolith with composition of Fo,,,,. Olivine in sample 5-7A occurs as large (5 mm) optically continuous subhedral grains and has the widest range in composition. Compositions of the cores of the large olivine grains range from Fo,,., to Fo,,.,. One olivine has a slight zonation from core ( F O , ~ . ~ ) to rim (FO,,,~). The most iron-rich olivine (Fo,~,,) occurs in sample 16-7B, a xenolith similar to 5-7A. Cao-contents range from 0.23 to 0.33 wt % and are lower than C a 0 contents of micro- phenocrysts and olivine in type II xenoliths.
Plagioclase in type III xenoliths is coarser-grained and more complexly zoned than plagioclase in type I and II xeno- liths. There is broad compositional overlap between type II and III plagioclase. The average composition of 10 plagioclase analyses is An,,.,. In general, increasing iron enrichment in the interstitial glass is accompanied by decreasing An content in the plagioclase.
Plagioclase in sample 26-1A ranges in composition from An,,., to An,,,,. Two large plagioclase grains enclosed in olivine in sample 5-7A have An contents of 69.0 and 70.2%.
lamellae of oxides occur along grain boundaries. Partially in- verted pigeonite occurs as an interstitial phase; remnant cores of pigeonite are surrounded by coalesced blebs of augite in a host of orthopyroxene. Figures 9b, 9c, and 9d shows the blebby exsolution texture. Anhedral titanomagnetite and il- menite occur in the interstitial glass and as isolated interstitial phases (Figures 9e and 9f). Fe-Ti oxides do not show optical exsolution.
The presence of subtle planar extinction discontinuities in olivine and melt-filled fractures that crosscut mineral grains indicates that these xenoliths have been deformed (Figures 9g, 9h, and 99. The mesostasis-xenolith interface, along both the xenolith edge and melt-filled fractures, is more jagged indicat- ing reaction with the melt. Plagioclase appears to have reacted with the host melt more than augite or olivine and commonly has a sawtooth appearance caused by fingers of melt intruding
4 the plagioclase (Figure 9h). h
TABLE 3b. Summary of Plagioclase Compositions
b4 Xenoliths Micro-
phenocrysts I II III
Number
Sioz
Fe0 C a 0 Na,O K2O Total Average An TO Range An ‘YO
analyzed
ALO, 49.7 31.1
15.6 0.53
2.92 ...
99.9
74.5 70-84
50.0 30.9
15.0 0.55
3.10 ... 99.6
72.8 68-86
50.6 30.5
14.0 0.58
3.51 0.04
99.2
68.6 61-74
51.3 30.0
13.4 0.62
3.84 0.07
99.2
65.1 58-12

3806 DISON ET AL.: GARBRO AND FERROBASALT, JUAN DE FUCA RIDGE
TABLE 4a. Representative Olivine Analyses
Microphenocrysts Type I Type II Type III
1 2 3 4 5 6 7 8 9 10 11 12 13 14 15
Sample 5-7 Number (3)
SO, 39.5
analyzed?
Fe0 18.6 MnO 0.30 MgO 41.8 Ca0 0.44 N i 0 0.16
Total 100.8
Si 1.002 Fe 0.394 Mn O.UO6
g 1.580 Ca 0.0 12 Ni 0.003
Total 2.997
Fo"u 80.0
(hlgO FeOjL* 0.67 D 0.25 Fe0 Feo* 0.84
8-2 13)
39.8 15.7
43.6 0.26
0.46 0.16
100.0
1.005 0.33 1 0.006 1.638 0.0 1 3 0.003
2.996
83.2
0.83 0.25 0.76
17-1 26-1 5-17 17-7 17-12 5-1 5-77 5-0 (II I11 (4) (3) (2) (3) (2) (3)
40.1 39.7 39.8 39.3 40.3 37.2 37.0 36.5 17.5 17.5 24.5 19.8 19.2 24.9 24.9 24.5
42.0 41.6 35.3 40.4 39.8 37.3 37.5 31.6 0.29 0.28 0.37 0.30 0.28 0.39 0.39 0.38
0.55 0.52 ' . . ... ... 0.35 0.34 0.36 0.14 0.13 0.15 0.17 0.17
100.6 99.7 100.1 99.9 996 100.2 100.3 99.5
Cations per Forimila Unit 1.013 1.012 1.040 1.010 1.031 0.980 0.977 0.971 0.370 0.373 0.536 0.426 0.411 0.549 0.548 0.545 0.006 0.006 0.008 0.007 0.006 0.009 0.009 0.009 1.580 1.580 1.375 1.545 1.519 1.468 1.478 1.492
I1.010 0.010 0.010 0.015 0.014 ". 0.003 0.003 ' " ... ... 0.004 0.004 0.004
2.987 2.988 2.961 3.010 2.969 3.020 3.026 3.031
. . . ...
81.0 80.9 72.0 78.4 78.7 72.8 72.9 73.2 O/ii*ine-,Ve/t Equilihriu Calcidurions [Roedev. 19 74]$
0.72 0.71 0.43 0.61 0.62 0.45 ... 0.46 0.24 0.13 ... 0.27 0.26 0.27 . ' . 0.28 0.78 0.77 ' ' ' 0.90 0.89 0.89 " ' 0.93
S I A (1)
37.5 23.2
38.7 0.36
0.33 0.19
100.3
0.980 0.508 0.008 1.511 0.009 0.004
3.020
74.8
0.50 ... ...
S I A (1)
38.9 26.3
36.2 0.40
0.24 0.19
100.2
0.980 0.585 0.009 1.43.5 0.007 0.004
3.020
71.0
0.41 ... ...
17-3 (3)
36.7 27.4
35.5 0.44
0.33 0.18
100.6
0.978 0.608 0.0 1 0 1.413 0.009 0.004
3.022
69.9
0.39 0.26 0.87
1 26-1A 16-7B
(3) (3)
37.1 37.6 25.9 31.0 0.40 0.44
36.5 30.5 0.33 ... 0.19 0.08
100.4 99.6
0.981 1.023 0.571 0.704 0.w 0.010 1.446 1.237 0.009 ... 0.004 0.002
3.020 2.976
71.7 63.7
0.43 0.30 0.29 ... 0.98 ...
Microphenocrysts from host ]aba; Type I. 11. and III refer to xenoliths. Olivine data were obtained using an ARL-SEMQ automated nine-channel microprobe and reduced using the matrix correction program of Beiice arid .4lbet. C1968). Standards used in the analysis of olivine were San Carlos oliline for Mg and Si: fayalite for Fe and Mn: and a synthetic Ni-doped diopside. Sample current was 20 nA. Backgrounds for Ni0 were calculated by hand using a mean atomic number method based on synthetic Ni-free fayalite and Foq7,, from marble.
?Averaged analyses vary less than 0.5 Fop" (la). $Calculations use host glass compositions with microphenocrysts and intersertal glass compositions with xenoliths.
Plagioclase in sample 5-8B shows complex zoning: a large. normally zoned plagioclase has a core composition of An,,,, and rim composition of An,,,,. Small plagioclase grains in the interstitial glass in samples 5-7A and 16-7A have the most sodic compositions (An58.,l) and reflect the more differentiated composition of the residual liquid. Intergrowths of plagioclase grains commonly have zones of abundant glass inclusions at the grain boundaries.
Pyroxene in type III xenoliths occurs as augite, magnesian pigeonite. and orthopprosene. Sample 26-la contains only augite that is fairly equigranular and compositionally homo- geneous. Compositions range from W O , , ~ , F ~ , ~ , , , E ~ , , ~ ~ to Wo,,,,Fs, ].,En,, ... Large augite oikocrysts in samples 5-7A
TABLE 4h. Summary of Olivine Compositions
Xenoliths Micro-
phenocrjsts I I I 111
Num her analyzed
SiOL Fe0 hlnO
Ca0 N i 0
Total Arerage Fo Range Fo t ' r ,
MgO
117)
39 8 17.5 0 18
42.5 0.49 0.15
100.7
81.1 79-83
13)
39.8 21.2
38.5 0.32
. . .
99.8
76.4 72-79
36.9 37.3 24.8 27.2
37.5 35.0 0.39 0.42
0.35 0.31 0.16 0.19
1 CX,. 1 100.4
73.0 69.6 72-74 64-75
and 5-8B become more iron-rich toward the margins. Cores of augite oikocrysts have ;i compositional range of Wo,,,,Fs,> -En4q.i to Wo,,.,Fs, l,9En,q,c, with augite in 5-8B slightly more iron-rich than augite in 5-7A. Core compositions are similar to augite compositions in 26-1A. Points near the edge of an augite oikocryst in sample 5-7A are W O ~ ~ , ~ F S ~ ~ , ~ E ~ ~ ~ , ~ and in sample 5-8B are
Augite in sample 5-7B is iron-rich with a core composition of W O ~ ~ , ~ ~ F ~ , , , , E ~ , , , ~ and a margin composition of Wo,,,,Fs,-~,En,,~, (analysis 7 in Table S). A small grain of pigeonite in sample 5-7h has a composition of Wo,,5Fs2,,,,En,,5,5 and is optically continuous with the adja- cent augite. Augite and pigeonite compositions in sample 16-7'4 are similar to those in sample 5-7B. A similar oc- currence of augite and pigeonite as single crystals and as alter- nating sectors in complesly zoned phenocrysts has been re-
spreading center near 95-W. Primary pigeonite, partially inverted to host-lamellae pairs
of orthopyroxene and augite. occurs as an interstitial phase in 5-7A and 5-8B. Remnant cores of pigeonite have a compo- sitional range of W O , , , F ~ ~ , - E ~ - , , , ~ to Wo9,1F~25.2En65,,. These compositions are less iron-rich than pigeonite in sample 5-7B. Surrounding these cores of pigeonite are areas of host orthopyroxene with essolved augite forming blebs microns to tens of microns in aidth. Augite blebs have compositions of W O ~ ~ . ~ ~ F S , ~ , ~ E ~ ~ ~ , ~ to Wo,,,,Fs,,,,En,,~, in sample 5-7A and Wo,,,,Fs,,.,En,,,, to WO,~.,F~,,, ,E~,,, , (analysis 19 in Table 5) in saniple 5-8B. The exsolved augite has iron contents similar to the margins of the large, zoned augite oikocrysts.
Host orthopyroxene commonly has patchy extinction.
Wo38,5Fs l~ .4En44, 1.
ported by Byerly cl9801 in evolved basalt from the Galapagos d&

DIXON ET AL. : GABBRO AND FERROBASALT, JUAN DE FUCA RIDGE 3807
4
Phenocrysts
o Microphenocrysts
En 100 90 80 En 100 90 80 70 60 50
FO , m , I Phenocrysts
O Type I 1 O0 90 80 70 60 5 0
ed Type I I
Type Ill An %
1 O0 90 80 70 6 0 50
Fig. 6. Pyroxene quadrilaterial and histograms of Fo content in olivine and An content in plagioclase showing the sympathetic compositional variation of coexisting mineral phases in the host lava and xenoliths. The pyroxene quadrilat- eral on the left shows the large variation of Ca0 content at relatively constant FeO/MgO ratios for the phenocrysts (sample 8-2) and microphenocrysts related to rapid cooling. The pyroxene quadrilateral on the right shows the iron enrichment trend found in types II and III xenoliths. Magnesium pigeonite and orthopyroxene occur only in type III xenoliths. Tie lines connect pyroxene analyses from inverted pigeonite in samples 5-7A, 5-7B, and 5-SA. Histogram of Fo content in olivine shows the iron enrichment trend in olivine from host lava and xenoliths. Plagioclase compositions show much more overlap than pyroxene or olivine. In general, mineral compositions in types II and III xenoliths overlap, but minerals in type III xenoliths have a wider range in composition, extending to more differentiated compositions.
Ranges in composition in sample 5-7A are W O , . , F ~ ~ ~ ~ ~ E ~ , , . , (analysis 22 in Table 5) to WO,.~FS,,,,E~~,~, (analysis 24 in Table 5) and in sample 5-8B are W O ~ , ~ F S , , ~ , E ~ , , . ~ to Wo4,3Fs32,4En63.3 (analysis 26 in Table 5). One discrete grain of orthopyroxene (WO,~~FS,,,,E~~,,,) occurs in sample 5-7A. This orthopyroxene grain is adjacent to augite and probably represents complete migration of exsolved augite to the margin of an inverted pigeonite. Much of the scatter in the host-lamellae pair data occurs in the direction of the tie lines and probably reflects overlap of the electron beam on fine exsolution lamellae.
Minor element distribution in host-lamellae pairs are simi- lar to contents in other terrestrial and lunar inverted pigeon- ites [DeVore, 1955, 1957; Brown, 1957; Carstens, 1958; Ghose et al., 1973: Walker et al., 19731. Ti, Al, and Cr are partitioned into the high-Ca phase, while Mn is partitioned into the low-Ca phase (Figure 10).
Representative analyses of Fe-Ti oxides are given in Table 6. Table 6 includes calculation methods of Stormer [1983]. Andersoiz [1968], Carinichael [1967], and Lindsley and Spencer Cl9821 for ulvospinel and ilmenite components, temperature, and oxygen fugacity to allow direct comparison of these data to data from other studies. Due to the high minor element contents (Mn, Mg, Al, and V) in the xenolith oxides, the recal- culation method of Stormer is used in the text.
Irregular grains of Fe-Ti oxides occur within interstitial glass and in interstitial locations in samples 5-7A and 5-8B. Titanomagnetite and ilmenite occur as discrete or composite grains. Titanomagnetite compositions are fairly homogenous; ulvospinel component varies from 59.8 to 63.0%. Con-
’.
ri ,
J ?
centrations of minor elements (Alzo,, 2.51-3.36 wt % ; V,O,, 0.88-1.30 wt %; MnO, 0.38-0.47 wt %; MgO, 2.82-4.37 wt Yo) are similar to minor element contents in titanomagnetite phenocrysts in ferrobasalt and andesite from the Galapagos Rift [Perft and Fornari, 19833.
Ilmenite is more abundant than titanomagnetite and exhib- its a wider range in composition. MgO content in ilmenite is higher than in coexisting titanomagnetite. Ilmenite compo- sitions have been subdivided into ilmenite and high-Mg ilmen- ite. Ilmenite (< 7.0 wt % MgO) occurs as isolated grains or as composite grains with titanomagnetite. Ilmenite component varies from 87.8 to 89.4%, MgO contents range from 3.67 to 6.89 wt %, and Alzo, ranges from 0.32 to 0.56 wt %. These compositions are similar to, but with slightly higher MgO contents than, ilmenite from Galapagos Rift lavas [Perft and Fornari, 19831. High-Mg ilmenite has MgO contents of 7.82- 8.44 wt O h . High MgO content is accompanied by higher Tio, and lower Fe,O, and F e 0 contents. Ilmenite component ranges from 89.8 to 93.8% High-Mg ilmenite occurs only as isolated crystals, but there is no apparent correlation between size of grain; location of grain within the xenolith; sur- rounding silicate phases ; presence of adjacent vapor bubble, sulphide phase, or glass ; on ilmenite composition.
Interstitial glasses are more evolved and have a wider com- positional range than interstitial glasses in types I or II. FeO/MgO ratios (with F e 0 = Feo* x 0.9) range from 2.14 to 3.38 (see Table 7). Ranges in minor element contents are T ioz ~2.31-4.71 wt %, Na,O =2.9&3.91 wt %, K 2 0 = 0.21-0.69 wt YO, and P 2 0 , = 0.24-1.03 wt YO. CaO/Al,O, ratios vary from 0.62 to 0.76. Interstitial glass compositions

3808 DIXON ET AL.: GABBRO AND FERROBASALT, JUAN DE FUCA RIDGE
for sample 5-7A are not reported because of beam overlap on incipiently crystallizing titanomagnetite and apatite.
Glass Inclusions Glass inclusions are present in nearly every mineral phase
and range in size from less than a micron across to more than a hundred microns in length. They usually exhibit negative- crystal shapes relative to the host crystal showing that they represent small volumes of magma entrapped during the growth of the crystal soh holt^ lind Kostyuk, 1975 ; Roedder. 19791.
Compositions of glass inclusions are presented in Table 8 are plotted on Figure I l t i . The wide scatter in the glass in- clusion data is related to the type of xenolith, the composition of the host crystal, and the relative degree of crystallization of the inclusion. Glass inclusion compositions define a broad trend of increasing differentiation from type T to type III xeno- liths. Analyses of glass inclusions and interstitial glass in each xenolith type ha\e similar ranges in elemental ratios, with the exception of sample 5-1 7, which compositionally resembles t>pe II xenoliths. Figure 1 l h shows the parallel trends, on a plot of F e O * C a O and FeO*/MgO, of data from glass in- clusions, interstitial glass, and host lala. Superimposed on this trend is the effect of the growth of the host crystal. Crys- tallization results in a decrease of Ca0 when the inclusion is trapped in plagioclase. a decrease of MgO when trapped in
olivine, or a decrease in C a 0 and MgO when trapped in augite. The distance of the xenolith from the glassy rim of the host lava controls the degree of crystallization of the host crystal [Clocchiutti, 19801. Thus the xenoliths located farthest from the glassy rim have glass inclusion compositions most displaced from the MORB fractionation trend.
The composition of the original trapped liquid may be cal- culated, however, by the intersection of fractionation lines of the coexisting host minerals on a triangular oxide plot [Wutson, 1976; Clocchiutti, 19771. Each Juan de Fuca xeno- lith type contains a t least two different coexisting minerals; therefore glass inclusions can be used to estimate the magma composition. These estimated initial compositions are present- ed in Table 9.
Crjatullizurion Sequence In general, the crystallization sequence is coherent for the
entire xenolith suite. The presence of euhedral plagioclase grains and its occurrence as inclusions in olivine and augite indicate that plagioclase was the liquidus phase for liquids from which the xenoliths crystallized. Textural evidence sug- gests that olivine and augite began crystallizing essentially simultaneously; rare intergrowths of olivine in augite and vice versa occur. but olivine and augite more commonly are mu- tually exclusive. Compositional evidence suggests that olivine may have begun crystallizing slightly earlier than augite be-
TARLE 5. Representative Pyroxene Analyses
Phenocrysts hlicrophenocrysts Type II
1 - 3 4 5 6 7 8 9 10 11 12 13 14 1
Sample 8-2 S-2 8-2 8-2 8-2 22-34 26-13B 26-13B 26-13B 26-13B 5-0 5-1 5-1 17-1 Type aug aug aug aug aug aug aug aug aug aug aug aug aug aug
SIO, 41,O Feo* hIgO Ca0 Na,O Tioz C r 2 0 , hInO
Total
SI Al Fe hf E Ca Na Ti Cr hl n
Total
\v o En F b
Othcra Calculated k203
wo En Fc
51.6 3.63 5.63
16.4 21.1
0.25 0.79 1.15 0.17
100.7
1.880 0. 156 o. 172 0.89 1 0.824 0.018 0.022 0.033 0.005
4.00 1
38.3 53.0 s.7
12.9
0.90
43 7 47.2
9. 1
51.3 3.54 5 67
17.1 20.0 (1.23 0.68 1 .o0 0.20
9Y.7
1.882 O 153 o. 174 0.935 0.786 O.(ll6 0.019 0.029 O.OO6
4.000
50.5 6.45 5.75
16.0 19.3 0.24 0.72 1 .o; 0.21
100.2
1.342 0.277 0.175 0.870 (1.754 0.017 0.020 0.03 1 0.006
3.992
53.4 51.2 51.8 51.7 52.0 51.6 1.80 3.83 2.54 2.27 3.51 2.80 5.77 6.15 7.37 6.65 6.91 7.34
18.1 17.5 18.3 17.6 17.7 18.8 19.9 19.0 19.9 20.2 19.2 17.9
... ... ... 0.20 0.24 ‘.. 0.52 0.73 ” ’
0.60 0.96 ” ’
0.30 0.20 ’ . I
... ... ...
... . . . ...
... ... ... 100.5 99.8 99.9 98.3 99.2 98.4
Cations per Formula Unir 1.941 1.875 1.891 1.918 1.911 1.907 0.077 0.165 0.109 0.099 0.152 0.122 0.175 0.188 0.225 0.206 0.212 0.227 0.980 0.955 0.996 0.973 0.969 1.036 0.775 0.745 0.778 0.803 0.756 0.709 0.014 0.017 . . . . . . 0.014 0.020 . ‘. 0.017 0.028 ” ’
0.006 0.006 ’.’ I ’ .
3.Y9Y 3.999 3.999 3.9Y9 3.999 4.001
hf incral Norm LLindslev and .4ndersen. IY831
... ... ... ... ... ... ... ...
... ...
36.1 31.4 37.7 55.5 57.1 53.3 X.4 11.5 9.0
12.8 17.6 7.0
1.21 0.w 0.37
41.5 41.9 40.1 49 3 4R.h 50.8 9.2 9.5 9.1
33.9 56.9 9.2
13.5
1.24
39.4 50.6 10.0
52.7 1.29 7.45
19.0 18.1 ... . . . . . . . . .
98.5
1.949 0.056 0.230 1.047 0.717
...
...
...
. . .
3.999
33.5 36.1 33.3 30.8 33.3 59.5 55.5 56.0 59.8 56.7 7.0 8.1 10.7 9.4 10.0
10.9 8.2 9.0 9.3 5.1
3.94 2.31 0.97 2.31 1.65
Af invrul Norm* 39.0 40.5 39.11 36.0 36.0 50.0 49.1 50.0 523 52.5 11.0 10.4 10.9 11.5 11.5
52.5 51.9 2.40 3.08 6.09 5.99
17.4 17.4 20.3 20.4 0.23 0.25 0.53 0.55 0.26 0.41 0.20 0.23
99.9 100.2
1.927 1.901 0.104 0.133 0.187 0.183 0.951 0.952 0.798 0.798 0.016 0.018 0.015 0.015 0.008 0.012 0.006 0.007
4.012 4.019
38.1 ... 53.3 ” . 8.6 ’ . ’
9.1 12.2
1.25 2.19
41.2 41.3 49.1 49.2
9.7 9.5
52.3 53.2 2.02 2.49 8.56 6.19
17.2 17.9 18.9 20.2 0.25 0.24 0.65 0.51 0.04 0.31 0.31 0.23
100.4 101.2
1.927 1.925 0.088 0.106 0.264 0.187 0.946 0.964 0.748 0.783 0.018 0.017 0.018 0.014 0.001 0 .09 0.010 0.007
4.020 4.012
35.8 37.2 52.6 54.4 11.6 8.4 9.4 9.5
1.98 1.38
38.2 40.5 48.3 49.8 13.5 9.7

DIXON ET AL. : GARBRO AND FERROBASALT, JUAN DE FUCA RIDGE 3809
TABLE 5. (continued)
Type III
15 16 17 18 19 20 21 22 23 24 25 26
5 Sample 26-1A 5-7A 5-7B 5-7A 5-8B 5-7A 5-7B 5-7A 5-7A 5-7A 5-8B 5-8B Type aug aug auß aug-ex aug-ex pig Pig opx opx opx opx OPX
SiO, 52.5 2.18
L Feo* 6.69 MgO 17.5 Ca0 19.7
Tio, 0.51 Cr203 0.09 MnO 0.23
NazO 0.22
Total 99.7
Si 1.934 Al 0.094 Fe 0.206 Mg 0.959 Cd 0.779’ Na 0.016 Ti 0.014 Cr 0.003 Mn 0.007
Total 4.012
wo 37.3 En 53.2 Fs 9.5 Others 8.4
Calculated 1.26
wo 40.1 En 49.3 Fs 10.6
53.1 1.83 6.85
11.9 19.6 0.22 0.45 0.09 0.26
100.3
1.941 0.079 0.209 0.978 0.769 0.015 0.012 0.003 0.008
4.014
37.1 53.5 9.4 7.8
1.39
39.3 50.0 10.7
51.8 2.04
ii.1 17.3 16.7 0.29 0.78 0.09 0.38
100.5
1.918 0.089 0.345 0.954 0.662 0.021 0.022 0.003 0.012
4.026
...
...
... 10.4
2.29
33.8 48.6 17.6
. 51.9 51.8 53.6 2.16 2.02 1 .00 9.49 11.7 15.6
17.7 15.3 24.7 17.3 18.3 4.33 0.23 0.30 0.07 0.75 1.01 0.41 0.06 0.02 0.03 0.33 0.40 0.47
53.4
17.0 24.1
0.86
4.30 0.08 0.35 0.05 0.51
54.9 1.20
13.7 28.0 2.03 0.02 0.61 0.04 0.40
100.0 100.8 100.2 100.6 100.0
1.921 0.094 0.293 0.977 0.685 0.016 0.021 0.002 0.010
Cations per Formula Unit 1.925 1.954 1.953 0.089 0.043 0.037 0.363 0.474 0.519 0.845 1.343 1.311 0.729 0.169 0.168 0.022 0.005 0.006 0.028 0.011 0.010 0.001 0.001 0.002 0.012 0.015 0.016
1.943 0.051 0.412 1.500 0.078 0.001 0.016 0.001 0.012
4.019 4.014 4.015 4.022 4.014
Mineral Norm [Lindsley and Andersen, 19831 ... 36.0 9.8 9.0 4.0 ... 46.4 67.5 66.0 76.0 ... 17.6 22.7 25.0 20.0 10.0 9.7 5.0 4.6 5.0
2.07 1.51 0.90 0.80 0.67
Mineral Norm* 35.0 37.6 8.5 8.4 3.9 50.0 43.6 67.6 65.6 75.4 15.0 18.7 23.9 26.0 20.7
53.7
16.3 26.0
0.82
2.07 0.03 0.33 0.04 0.44
99.7
1.961 0.035 0.498 1.412 0.081 0.002 0.009 0.001 0.914
4.013
4.2 71.6 24.3 4.0
0.66
4.1 70.9 25.0
53.5
17.8 25.0
0.76
2.34 0.03 0.48 0.03 0.53
100.4
1.956 0.033 0.543 1.360 0.092 0.002 0.013 0.001 0.016
4.0 16
4.7 68.4 27.0 3.6
0.28
4.6 68.2 27.2
53.2
18.7 24.2
0.96
2.26 0.03 0.54 0.03 0.53
lW.5
1.95 1 0.042 0.574 1.323 0.089 0.002 0.015 0.001 0.016
4.013
4.6 67.0 28.0 4.4
0.47
4.5 66.6 28.9
53.0
20.8 22.8
0.88
2.16 0.02 0.50 0.03 0.57
100.9
1.955 0.038 0.642 1.256 0.085 0.001 O.Ò14 0.001 0.018
4.010
4.4 63.6 32.0 4.2
0.40
4.3 63.3 32.4
Analysis 12 from core or oikocryst; 13 from small grain at edge of xenolith; analyses 18,23 and 19,25 are host-lamellae pairs. Pyroxene data were obtained using a ARL-SEMQ automated nine-channel microprobe and reduced using the matrix correction program of Bence and Albee [1968]. Standards used in analysis of pyroxene were synthetic Di-Jd for Si, Ca, Mg, Na, and Al; Tio, for Ti; Cr,O, for Cr; Mn,O, for Mn; and fayalite for Fe. Sample current was 20 nA, and counting time was 60 s.
*Wo = Ca/(& + Mg + Fe); En = Mg/(Cd 1- Mg + Fe); Fs = Fe/(Ca + Mg + Fe). taug = augite; aug-ex = exsolved augite; pig = pigeonite; opx = orthopyroxene.
cause the least evolved compositions are from type I (oli- vine + plagioclase) xenoliths. Primary pigeonite occupies in- terstitial positions and is a late crystallizing phase. Fe-Ti oxides were the last phases to crystallize and occur in the interstitial glass or along grain boundaries.
These observations suggest the following paragenetic se- quence for the xenoliths : initial crystallization of plagioclase followed by plagioclase i- olivine + augite, plagioclase + olivine -Í- augite + pigeonite, and plagioclase -k olivine i- augite + inversion of pigeonite f Fe-Ti oxides. After crys- tallization of pigeonite and Fe-Ti oxides the xenoliths under- went ductile deformation, indicated by subtle kink banding in olivine, and brittle fracture, indicated by melt-filled fractures crosscutting the most crystalline xenoliths. Quenching of the xenoliths in the host lava preserved the different stages in the crystallization history.
The crystallization sequence defined by the xenoliths is similar to the sequence found in lavas from the Galapagos spreading center at approximately 85”W. Per5t and Fornari Cl9831 found the following crystallization sequence in Gala-
L
S C I
.?
pagos lavas : initial crystallization of plagioclase i- olivine followed by plagioclase + augite + olivine, plagioclase i- augite + pigeonite, and plagioclase + augite + pigeonite -t FeTi oxides. In the Galapagos lavas, oli- vine ceases to crystallize in ferrobasalt containing small micro- phenocrysts of pigeonite. The coexistence of olivine and pi- geonite in the most crystalline xenoliths reflects the metastable assemblage caused by continued differentiation of the residual melt during in situ crystallization. The crystallization sequence found in the Juan de Fuca Ridge xenoliths and Galapagos spreading center lavas differs from results of crystallization experiments done on a differentiated sample from the Ocean- ographer Fracture Zone [Walker e t al., 19791 in the lack of chromian spinel as a near-liquidus phase, the occurrence of olivine before augite, and the occurrence of magnetite.
General Mineral Trends
Figure 6 is a compilation of pyroxene, olivine, and plagio- clase data for phenocrysts, microphenocrysts, and xenoliths. Figure 8 shows the compositional trends of hot and interstitial

DIXON ET AL.: GABBRO AND FEKROBASALT, J L ~ A N DE FUCA RIDGE
A B
.-
Fig. 7. Photographs and photomicrographs of xenoliths in basalt from the Juan de Fuca Ridge. (u) Sample 5-0: medium-grained gahbroic xenolith enclosed in aphyric host lava. Black near end of scale har is interstitial glass. ( h ) Sample 5-7A; type III xenolith exposed on fracture surface of sheet flow fragment. Note sharp textural contrast between aphyric host lam and xenolith. (cl Sample 17-1'4: open textured, glassy xenolith. Plagioclase laths (white) are subophitically surrounded h> augite. Dark grey is glass. Augite and plagioclase contain ahundant glass inclusions. Plane light. (dl Sample 17-1.4; c lnwup of tlowzge texture in glass around augite crystal. Plane light. ( e ) Sample 5-0; photomicrograph of section cut through sample shown in Figure 7u. Ophitic texture xith augite (light grey with well-developed cleavage) surrounding plagiclabe laths (white). SprQJs of plagioclase laths extend into interstitial glass (black, center of photo). Crossed nicols. ( f l Sample 26-1.4: medium-grained. fairly equigranular xenolith. Black material in upper left of photo is host lava: black material within xenolith I S interstitial glass. 'Augite (grey) and plagioclase (white and light grel-) are dominant minerals. Crossed nicols. (y) Sample 5-7A; coarse-grained type III xenolith. Olivine (light grey with irregular fractures) and plagin- clase are the dominant minerals. Pyroxene is 3 darker grey. An inverted pigeonite can he seen just ahove the left end of the scale har: Figure 9h is a close-up of this pigeonite. Plane light. ( I I ) Sample 5-8B: coarsed-grained t)pe III xenolith. Large plagioclase in middle of photo. .Augite is medium gre) in Inwer half of xenolith. Olivine is light grey with irregular fractures in the central upper portion of the pholo. Close-up of plagioclaie and pSroxene intergrowth texture found in upper right edge of photo appears in Figure 90.

3811 DIXON ET AL.: GABBRO AND FERROBASALT, JUAN DE FUCA RIDGE
0.8
h
I:
3.0
o a? w
2 2.0
o N k
1 .o
e Host glass Intersertal glass 0 Type I
0.6
u)
o, a
0.4
0.2 Type I I TypeIII
1 1 1 1 1 , 1 1 1 1 , n
Host lava lntersertal glass
CI Type I Type I I TvDe 111
1.2 2.0 3.0 O 0.2 0.4 0.6 Feo*/ MgO K ;O
Fig. Xa Fig. 8b
Fig. 8. Major and minor element variation diagrams showing evolved interstitial glass compositions relative to host lava compositions. (a) Tio, versus FeO*/MgO plot shows the increasing Tio, and Feo* cofltents with increasing differentiation. (b) P,O, versus K,O plot shows enrichment of incompatible elements in the interstitial melts during differentiation.
glasses. The transition from type I to type III xenoliths is marked by sympathetic compositional variation af coexisting augite, plagioclase, olivine, and glass. Minerals in the xenoliths are more evolved than phenocrysts and microphenocrysts in the host lavas. The Fe-enrichment trends defined by analyses of mafic phases are similar to trends defined by phenocrysts in lavas from the Galsipagos spreading center [Byerly, 1980; Perj t and Fornari, 19831, oceanic gabbros [Miyashiro and Skido, 1980: Tiezzi and Scott, 1980; Vanko and Batiza, 1982; Hebert et al., 19831, and other tholeiitic intrusions such as the Skaergaard [Wager and Deer, 19391, the Stillwater Complex [Hess, 19601, and the Bushveld [Truter, 19551.
Plagioclase shows a less systematic variation between xeno- lith types. Plagioclase in type II and type III xenoliths show similar ranges in composition but are more sodic than those in type I xenoliths or the microphenocrysts.
Olivine analyses provide the most conclusive evidence that the xenoliths formed in equilibrium with melts more evolved than the host lavas because olivine-liquid Fe/Mg partitioning is independent of temperature [Roeder, 19741. Olivine-melt equilibrium calculations for microphenocrysts and host lava using = (MgO/FeO)Liq . (FeO/MgO),, [Roeder, 19741 indicate that the distribution coefficient (Dol-Liq) is approxi- mately 0.24 (assuming that all iron is Feo). An assumed distri- bution coefficient of 0.30 results in calculated FeO/FeO* ratios of 0.74-0.84. Per j t and Fornari Cl9831 arrived at a similar conclusion for olivine phenocrysts from the Galapagos spreading center.
Olivine shows and Fe-enrichment trend from type I to type III (Figure 12). In contrast to the host lava-microphenocryst equilibria, however, the xenolith olivine-interstitial glass equi- libria calculations are consistent with the melt having Feo/ Feo* ratio of 0.9 and olivine-melt distribution coefficient of approximately 0.30. The higher FeO/FeO* ratios imply that
the conditions of formation of the gabbros are more reduced than the conditions of foimation of the microphenocrysts.
Pyroxene shows a systematic decrease in Cr,O,, increase in Tio,, and slight decrease in Alzo, with increasing Fe/ (Fe -t Mg) ratio (Figure 10). These data suggest that the xeno- liths are comagmatic. Augite compositions of type II and type III xenoliths overlap, but the most Fe-enriched augite occurs in a type III xenolith with partially inverted pigeonite. Cdm- positions of augite phenocrysts and microphenocrysts do not follow the Fe-enrichment trend defined by the different xeno- lith types but instead are depleted in Ca WO^^-^,,) and en- riched in Al at relatively constant Fe/Mg ratios. Similar trends have been noted in Ca-pyroxenes from DSDP hole 425 [Mattey and Muir, 19801 and hole 319 [Mazzullo and Bence, 19761. The Ca depletion trend has been related to kinetic effects upon quenching [Natland, 19801.
Partitioning of Fe0 and MgO between coexking clinopy- roxene and glass is shown on Figure 13. Calculated K D = (FeO*/MgO)cpx/(FeO*MgO),,, are 0.21 for phenocrysts-host glass pairs and 0.15-0.20 for xenolith pyroxene-interstitial glass pairs. Lower KD calculated for the xenaliths imply that they formed under more reduced conditions than the pheno- crysts, consistent with the olivine data. These values sire lower than the 0.26 average value reported for the FAMOUS area [Bryan, 19791.
The occurrence of high Mg contents in ilmenite and the existence of such wide ranges of compositions within single xenoliths are unusual in an oceanic environment. MgO con- tents in oceanic samples rarely exceed 5.5 wt ?" [Hdggerty, 1976; Bq'erly, 1980; Perf2 and Fornari, 19831. The most influ- ential factor controlling ilmenite chemistry is the composition of the magma from which it crystallized. Magnesian ilmenite is characteristic of kimberlites, where it forms in equilibrium

3812 DIXON ET AL.: GABBRO AND FERRORASALT, JUAN DE FUCA RIDGE
'".
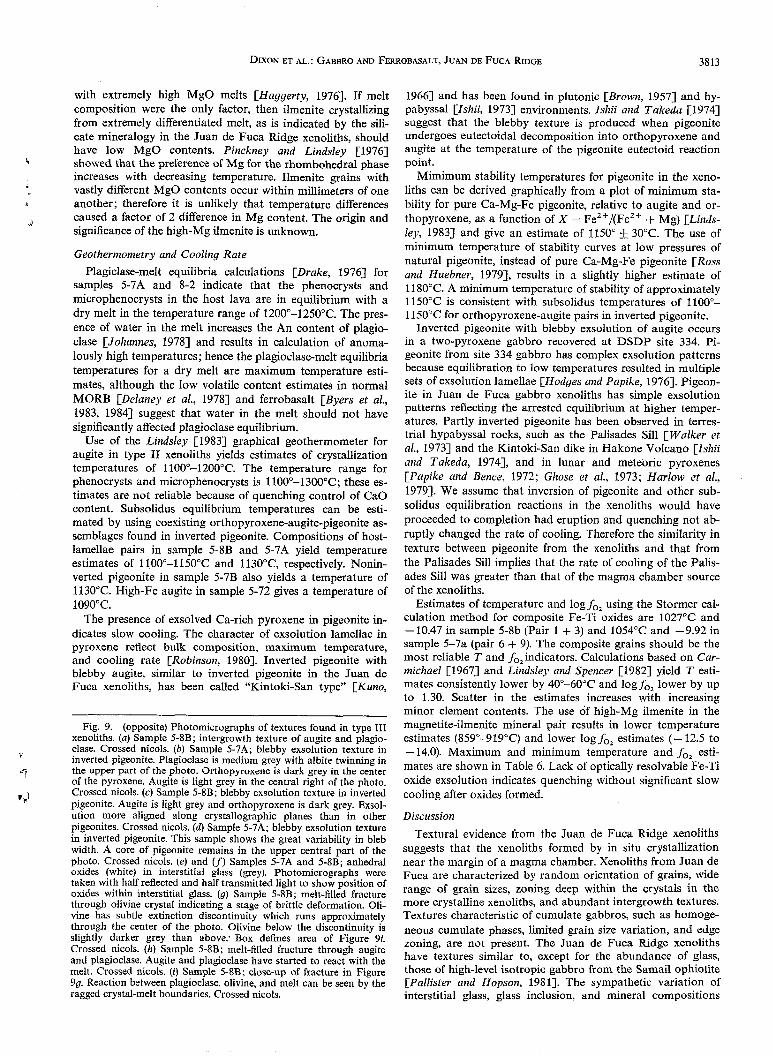
DIXON ET AL.: GABBRO AND FERROBASALT, JUAN DE FUCA RIDGE 3813
with extremely high MgO melts [Haggerty, 19763. If melt composition were the only factor, then ilmenite crystallizing from extremely differentiated melt, as is indicated by the sili- cate mineralogy in the Juan de Fuca Ridge xenoliths, should have low MgO contents. Pinckney and Lindsley [1976]
increases with decreasing temperature. Ilmenite grains with vastly different MgO contents occur within millimeters of one another; therefore it is unlikely that temperature differences caused a factor of 2 difference in Mg content. The origin and significance of the high-Mg ilmenite is unknown.
Geothermometry and Cooling Rate Plagiclase-melt equilibria calculations [Drake, 19761 for
samples 5-7A and 8-2 indicate that the phenocrysts and microphenocrysts in the host lava are in equilibrium with a dry melt in the temperature range of 120O0-125O0C. The pres- ence of water in the melt increases the An content of plagio- clase [Johannes, 19781 and results in calculation of anoma- lously high temperatures ; hence the plagioclase-melt equilibria temperatures for a dry melt are maximum temperature esti- mates, although the low volatile content estimates in normal MORB [Delaney et al., 19781 and ferrobasalt [Byers et al., 1983, 19841 suggest that water in the melt should not have significantly affected plagioclase equilibrium.
Use of the Lindsley [1983] graphical geothermometer for augite in type II xenoliths yields estimates of crystallization temperatures of 1 10O0-12OO0C. The temperature range for phenocrysts and microphenocrysts is 1100"-1300"C; these es- timates are not reliable because of quenching control of C a 0 content. Subsolidus equilibrium temperatures can be esti- mated by using coexisting orthopyroxene-augite-pigeonite as- semblages found in inverted pigeonite. Compositions of host- lamellae pairs in sample 5-8B and 5-7A yield temperature estimates of 1100"-1150"C and 1 13OoC, respectively. Nonin- verted pigeonite in sample 5-7B also yields a temperature of 1130°C. High-Fe augite in sample 5-72 gives a temperature of 1090°C.
The presence of exsolved Ca-rich pyroxene in pigeonite in- dicates slow cooling. The character of exsolution lamellae in pyroxene reflect bulk composition, maximum temperature, and cooling rate [Robinson, 19801. Inverted pigeonite with blebby augite, similar to inverted pigeonite in the Juan de Fuca xenoliths, has been called "Kintoki-San type" [Kuno,
t showed that the preference of Mg for the rhombohedral phase
*'
Fig. 9. (opposite) Photomicrographs of textures found in type III xenoliths. (u) Sample 5-8B; intergrowth texture of augite and plagio- clase. Crossed nicols. (b) Sample 5-7A; blebby exsolution texture in inverted pigeonite. Plagioclase is medium grey with albite twinning in the upper part of the photo. Orthopyroxene is dark grey in the center of the pyroxene. Augite is light grey in the central right of the photo. Crossed nicols. (c) Sample 5-8B; blebby exsolution texture in inverted pigeonite. Augite is light grey and orthopyroxene is dark grey. Exsol- ution more aligned along crystallographic planes than in other pigeonites. Crossed nicols. (d) Sample 5-7A; blebby exsolution texture in inverted pigeonite. This sample shows the great variability in bleb width. A core of pigeonite remains in the upper central part of the photo. Crossed nicols. (e) and (f) Samples 5-7A and 5-8B; anhedral oxides (white) in interstitial glass (grey). Photomicrographs were taken with half reflected and half transmitted light to show position of oxides within interstitial glass. (9) Sample 5-8B; melt-filled fracture through olivine crystal indicating a stage of brittle deformation. Oli- vine has subtle extinction discontinuity which runs approximately through the center of the photo. Olivine below the discontinuity is slightly darker grey than above: Box defines area of Figure 9i. Crossed nicols. (h) Sample 5-8B; melt-filled fracture through augite and plagioclase. Augite and plagioclase have started to react with the melt. Crossed nicols. (i) Sample 5-8B; close-up of fracture in Figure 99. Reaction between plagioclase, olivine, and melt can be seen by the ragged crystal-melt boundaries. Crossed nicols.
19661 and has been found in plutonic [Brown, 19571 and hy- pabyssal [Zsliii, 19731 environments. Ishii and Takeda [ 19741 suggest that the blebby texture is produced when pigeonite undergoes eutectoidal decomposition into orthopyroxene and augite at the temperature of the pigeonite eutectoid reaction point.
Mimimum stability temperatures for pigeonite in the xeno- liths can be derived graphically from a plot of minimum sta- bility for pure Ca-Mg-Fe pigeonite, relative to augite and or- thopyroxene, as a function of X = FeZ+/(Fe2+ + Mg) [Linds- ley, 19831 and give an estimate of 1150" & 30°C. The use of minimum temperature of stability curves at low pressures of natural pigeonite, instead of pure Ca-Mg-Fe pigeonite [Ross and Huebner, 19791, results in a slightly higher estimate of 1180°C. A minimum temperature of stability of approximately 1150°C is consistent with subsolidus temperatures of 1100"- 1150°C for orthopyroxene-augite pairs in inverted pigeonite.
Inverted pigeonite with blebby exsolution of augite occurs in a two-pyroxene gabbro recovered at DSDP site 334. Pi- geonite from site 334 gabbro has complex exsolution patterns because equilibration to low temperatures resulted in multiple sets of exsolution lamellae [Hodges and Papike, 1976j. Pigeon- ite in Juan de Fuca gabbro xenoliths has simple exsolution patterns reflecting the arrested equilibrium at higher temper- atures. Partly inverted pigeonite has been observed in terres- trial hypabyssal rocks, such as the Palisades Sill [Walker et al., 19731 and the Kintoki-San dike in Hakone Volcano [lshii and Takeda, 19741, and in lunar and meteoric pyroxenes [Papike and Bence, 1972; Ghose et al., 1973; Harlow et al., 19791. We assume that inversion of pigeonite and other sub- solidus equilibration reactions in the xenoliths would have proceeded to completion had eruption and quenching not ab- ruptly changed the rate of cooling. Therefore the similarity in texture between pigeonite from the xenoliths and that from the Palisades Sill implies that the rate of cooling of the Palis- ades Sill was greater than that of the magma chamber source of the xenoliths.
Estimates of temperature and logf,, using the Stormer cal- culation method for composite Fe-Ti oxides are 1027°C and - 10.47 in sample 5-8b (Pair 1 + 3) and 1054°C and -9.92 in sample 5-7a (pair 6 + 9). The composite grains should be the most reliable T and fo,indicators. Calculations based on Car- michuel [1967] and Lindsley and Spencer [1982] yield T esti- mates consistently lower by 40"-60"C and logf,, lower by up to 1.30. Scatter in the estimates increases with increasing minor element contents. The use of high-Mg ilmenite in the magnetite-ilmenite mineral pair results in lower temperature estimates (859'-919"C) and lower logf,, estimates (- 12.5 to - 14.0). Maximum and minimum temperature and foz esti- mates are shown in Table 6. Lack of optically resolvable Fe-Ti oxide exsolution indicates quenching without significant slow cooling after oxides formed.
Discussion Textural evidence from the Juan de Fuca Ridge xenoliths
suggests that the xenoliths formed by in situ crystallization near the margin of a magma chamber. Xenoliths from Juan de Fuca are characterized by random orientation of grains, wide range of grain sizes, zoning deep within the crystals in the more crystalline xenoliths, and abundant intergrowth textures. Textures characteristic of cumulate gabbros, such as homoge- neous cumulate phases, limited grain size variation, and edge zoning, are not present. The Juan de Fuca Ridge xenoliths have textures similar to, except for the abundance of glass, those of high-level isotropic gabbro from the Samail ophiolite [Pallister and Hopson, 19813. The sympathetic variation of interstitial glass, glass inclusion, and mineral compositions

3814
l o I l I
O o Phenocrysts in 8-2 o o Microphenocrysts
1.2 - -
- 1 0 - o o Augite -
00 u - -
Inverted Pigeonite - 2 0.8 - A Pigeonite
1 + Orthopyroxene -
e 0.6 - o o
3 - I @ Augite
u o -
- - % :*
8 0.4 - -
- -
0.2 - * f * ** -
- o. 08, +@ O I , I o+ =? ,$&+.$*A% 1 l a + I + O + -
DIXON ET AL. : GABBRO A N D FERROBASALT, JUAN DE FUCA RIDGE
0.2 I I I I
o
I I I I l 10 15 20 25 30 35
100 x (Fe/Fe+Mgl
Fig. 10. Minor element variation diagram for pyroxene in host lava and xenoliths. Augite from the xenoliths (solid circles) exhibits a systematic decrease in Cr,O, and A1,0, and increase in Tioz with increasing Fe,'(Fe i- Mg) and can be related to a single fractionation trend. Scatter in Tio, and A1,0, contents in phenocrysts and microphenocrysts is a result of disequilibrium crystallization during rapid cooling.
support the interpretation of in situ crystallization and docu- ment the changing composition of the interstitial liquid.
Several lines of evidence indicate that the Juan de Fuca xenoliths formed by quenching of a not yet holocrystalline mush and not by partial melting of a holocrystalline gabbro. Examination of the entire textural suite shows that for the more open-textured xenoliths, euhedral grains are set in a matrix of glass. The grain size and crystallinity increase at the expense of interstitial glass. An interstitial origin for the glass in the more crystalline xenoliths is indicated by the location of glass in interstitial areas a t grain contacts, homogeneity of glass within a given xenolith regardless of adjacent mineral phases, and absence of reaction textures at interstitial glass- mineral contracts.
In contrast to the sharp interstitial glass-mineral bound- aries, evidence of disequilibrium between melt and xenolith minerals occurs at host lava-xenolith mineral and injected melt-xenolith mineral boundaries for the most differentiated type III xenoliths. Thus some reaction between xenoliths and host lava occurred between the time of entrainment and the time of quenching on the seafloor, but evidence of partial melting to produce the interstitial glass is not present.
The response of the xenoliths to stress is a function of their texture and temperature at the time of deformation. Xenolith 17-1 has swirls of melt around the crystals, while xenoliths 5-7A and 5-SB are crosscut by melt-filled fractures. Based on
the previous discussion of geothermometry, these type III xenoliths equilibrated to temperatures of approximately 1OOO'C but no lower before they were quenched at the surface. The confining pressure during fracturing is difficult to con- strain because fracturing could have occurred in the magma chamber as the fragment was ripped from the wall rock, during transport to the surface. or during eruption. Nonethe- less, the gabbro xenoliths were brittle enough to be fractured. Fracturing has also been documented in Cayman Trough gabbros, where Malcolm C198 11 interpreted veins of clinopy- roxene a:id brown hornblende as residual magmatic fluid in- jected into fractures in the gabbros near their solidus temper- ature.
The most striking features of the xenoliths are their evolved composition with respect to the host lava and the sharp tex- tural contrast between the xenoliths and the nearly aphyric host lava. Crystal clots less evolved than the host lava have been found in Iceland [Larsen. 19791 and International Pro- gram of Ocean Drilling (IPOD) leg 46 site 396B [Saro er ul., 19781 and are interpreted to be cognate xenoliths. Gabbro xenoliths from Iceland are most common in porphyritic basalt and can be explained by a single episode of crystallization. A large gabbroic xenolith with composition more evolved than the host melt occurs in basalt from DSDP site 504B near the Costa Rica Rift [Nntland, 19831. This single xenolith was in- terpreted to be a fragment removed from the walls of a

DIXON ET AL.: GABBRO AND FERROBASALT, JUAN DE FUCA RIDGE 3815
TABLE 6. Fe-Ti Oxide Analyses
Sample 5-8B Sample 5-7A
1 2 3 4 5 6 7 8 9 10 11 12 13
Si Ti AI V Cr Fef3 Fe+’ Mn
Total Mg
mag
(4)
0.01
2.53 1.12 0.05
20.6
26.8 45.8 0.47 2.82
100.2
0.000 0.564 0.109 0.033 0.001 0.729 1.401 0.014 0.149
3.000
mag
(1)
0.03
2.51 1.06 0.09
20.1
27.8 44.4 0.38 3.51
99.9
0.001 0.548 0.108 0.031 0.003 0.760 1.348 0.012 O. 190
3.001
ilm
(3)
0.00
0.32 0.43 0.01
48.0
10.6 36.2 0.46 3.67
99.7
0.000 0.893 0.009 0.009 0.000 0.197 0.748 0.0 1 o 0.135
2.001
ilm hi-Mg mag mag mag ilm
(1) (1) (2) (3) (2) Recalculated Analyses [Carmickael. 196q
0.00 0.00 0.03 0.01 0.01 48.4 51.6 20.2 21.2 20.2 0.45 0.41 2.67 2.61 3.36 0.37 0.84 1.25 0.88 1.30 0.00 0.06 0.02 0.01 0.05
10.2 7.31 27.3 26.0 27.3 34.5 31.0 45.1 45.8 43.5 0.38 0.36 0.44 0.46 0.39 4.86 8.44 3.20 3.32 4.37
99.2 100.0 100.2 100.3 100.5
Cations Per Formula Unit (Sp . = 3, Rh. = 2) 0.000 0.000 0.001 0.000 0.000 0.895 0.921 0.551 0.577 0.543 0.013 0.012 0.114 0.111 0.141 0.007 0.016 0.036 0.026 0.037 o.Oo0 0.001 0.001 0.000 0.001 0.189 0.130 0.745 0.709 0.733 0.709 0.615 1.366 1.384 1.299 0.008 0.007 0.014 0.014 0.012 0.178 0.298 0.173 0.179 0.233
1.999 2.000 3.001 3 . W 2.999
ilm
(2)
0.00
0.56 0.45 0.00
48.9
11.5 31.4 0.36 6.89
100.1
0.000 0.884 0.016 0.009 0.000 0.208 0.630 0.008 0.247
2.002
ilm
(3)
0.00
0.41 0.74 0.00
48.7
10.3 33.8 0.40 5.38
99.7
O.OO0 0.892 0.012 0.015 0.000 0.189 0.688 0.008 0.195
1.999
ilm
(3)
0.01
0.47 0.86 0.02
49.1
10.1 32.2 0.37 6.54
99.7
0 .W 0.893 0.013 0.017 0.000 0.184 0.650 0.008 0.236
2.001
hi-Mg ilm (2)
0.00
0.45 0.95 0.03 9.26
0.34 8.52
50.5
29.9
100.0
0.000 0.902 0.013 0.018 0.001 0.165 0.593 0.007 0.302
2.001
hi-Mg ilm (1)
0.00
0.38 0.69 0.16 5.72
0.42 7.82
51.6
32.1
98.9
0.000 0.935 0.011 0.013 0.003 0.104 0.646 0.009 0.281
2.002
Recalculated Mole Fractions
usp usp ilm ilm ilm usp usp usp ilm ilm ilm ilm ilm
Storiner [1983] 0.624 0.598 0.892 0.894 0.920 0.610 0.630 0.609 0.878 0.892 0.892 0.898 0.938 Anders011 [1968] 0.582 0.554 0.884 0.882 0.904 0.566 0.588 0.553 0.859 0.879 0.876 0.878 0.926 Carrnichael Cl9671 0.564 0.549 0.893 0.895 0.921 0.552 0.577 0.544 0.884 0.894 0.893 0.902 0.935 Lindsley and Spencer [1982] 0.604 0.588 0.900 0.904 0.934 0.594 0.617 0.595 0.895 0.904 0.907 0.916 0.947
Mineral Pair Calculations (mag + ilm)
(1 + 3) (2 + 4) (2 + 5) (6 + 9) 17 + 9) (8 + 10) (8 + 13)
T fo, T fo, T fo, T fo, T fo, T fo* T foz ~~~ ~ ~ ~ ~
Stormer 119831 1027 -10.47 1001 -10.82 919 -12.51 1054 -9.92 1072 -9.70 1015 -10.61 859 -13.98 Anderson Cl9681 1015 -10.47 996 -10.68 938 -11.84 1058 -9.60 1078 -9.39 1002 -10.55 869 -13.43 Curmichael 119671 978 -11.08 959 -11.38 884 -13.03 990 -10.78 1010 -10.53 963 -11.27 830 -14.35 Lindsley and Spencer 119821 988 -11.10 963 -11.51 861 -13.81 994 -10.92 1013 - 10.68 970 -11.41 806 -15.30
Analyses 1 and 3 are from a composite grain, as are 6 and 9. Fe-Ti oxide data were obtained using an ARL-SEMQ automated nine-channel microprobe and reduced using the matrix correction program of Bence and Albee [1968]. Standards used in the analysis of Fe-Ti oxides were synthetic V-doped diopside for Si and V; Fe,O, Fe; Tio, for Ti; synthetic spinel for Mg and AI; Mn,O, for Mn and Tiebaghi chromite for Cr. Sample current was 20 nA. The vanadium intensity (k-alpha) was calculated by subtracting the Tiky8 peak from the measured total intensity.
magma chamber or shallow conduit system that originally contained more fractionated melt. The abundance of glass and a broad spectrum of texture and compositions in the Juan de Fuca xenolith suite suggest that formation of the gabbros is intimately involved with the magma chamber and not the product of crystallization in a small isolated magma pocket. The evolved compositions suggest the existence of melt more evolved than the host melt in the magma chamber.
HAWAIIAN LAVA LAKES: AN ANALOGY
A puzzling aspect of the xenoliths is the large variability in mineral modes (Table 10). Estimated bulk xenolith compo- sitions d o not, in general, reflect lava compositions. Also the dominance of augite + plagioclase xenoliths is contrary to
what one would expect from simple crystallization along a liquid line of descent, which requires olivine in addition to augite -k plagioclase. The problem may be one of scale. The large-scale view is one of in situ crystallization at the top of a cooling magma body, while in detail the actual processes may be extremely complex. Drill core studies of Hawaiian lava lakes; such as Kilauea Iki [Richter and Moore, 1966; Helz, 19801, Makaopuhi [Wright aiad Okamura, 19771, and Alae [Wright and Peck, 19781, document the small-scale com- plexities of crystallization in a cooling magma body.
A feature common to all the studied lava lakes in Hawaii is the presence of zones of relatively coarse-grained, glassy, ves- icular segregation veins that appear to fill fractures and have high differentiated compositions [Wright and Oliamura, 19771. These segregation veins form by physical segregation of differ-

3816 DIXON ET AL.: GABBRO AND FERRORASALT, JUAN DE FUCA RIDGE
TABLE 7. Average Interstitial Glass Analyses
Type I Type IT Type IT1
17-7 17-69 17-IA 5-0 5-1 5-72 5-7B 26-IA 16-7A 17-3 5-8B
(3)
50.6 13.7 12.2
10.9 6.78
2.58 0.18 1.92 0.18 0.19 0.16
99.4
51.0 1.62
( 2 )
50.6 14.1 12.3
10.8 6.65
2.70 0.18 1.90 0.20 0.19 0.15
99.8
50.3 1.67
(41
51.4 13.7 12.9
10.3 6.21
2.86 0.22 2.10 0.22 0.20 0.17
100.3
47.5 1.87
(4) (3)
50.8 51.6 13.7 14.0 13.5 14.0 5.77 5.65
10.1 9.62 3.02 3.17 0.22 0.23 2.36 2.41 0.26 0.27 0.22 0.21 0.17 0.19
100.1 101.4
44.6 43.1 2.11 2.24
(5)
51.1 14.5 14.1 4.90
10.0 3.06 0.21 2.44 0.23 0.21 0.20
101.0
39.5 2.59
51.3 51.7 51.4 51.3 52.7 13.4 13.9 13.6 13.2 13.1 13.5 12.9 14.2 15.0 13.2 6.25 5.42 5.17 5.04 3.51
10.2 9.83 9.25 9.33 8.05 2.81 3.05 3.04 3.03 3.69 0.29 0.30 0.30 0.27 0.64 2.46 2.55 2.93 2.97 2.96 0.29 0.30 0.37 0.33 0.84 0.22 0.20 0.22 0.23 0.23 0.1.5 0.17 0.19 0.20 0.11
1011.9 100.3 100.7 100.9 99.0
46.5 44.1 40.5 38.7 33.2 1.94 2.14 2.48 2.68 3.38
Anal>tical procedure for intersertal glasses was the same as the procedure for glassy rims, except that counting time was 120 s.
*Feo* = total Fe calculated as Feo. ?Fe0 MgO calculated using 0.9 x Feo*.
entiated melt by filter pressing from a rigid crystal framework. Melt, as defined by drilling, is a crystal-liquid mush too fluid to support the weight of the drill string. a condition reached when the magma contains approximately 45”<) glass and 55?,, crystals [Hel;, 19801. Wriglir und Peck [1978] also note that the composition of the liquid will vary in composition accord- ing to the eficiency of the filter press in separating liquid from crystals. Differences in the ratios of minerals brought in will produce a differentiate that does not lie on a “liquid line of descent.” Heir [ 19801 documents that the total thickness of segregation veins in Kilauea Iki, the largest and most complex of the Hawaiian lava lakes. is 3-6 m in the central part of the lake. corresponding to 6-1 l c r a L of the upper crust. Formation of segregation veins in the crystallizing zone a b m e the south- ern Juan de Fuca Ridge magma chamber can explain the
highly variable hulk compositions of the xenoliths and the dmiation from a simple liquid line of descent.
Segregation \eins need fractures to form. Fracturing in lava lakes. which are static bodies. may be associated with degass- ing of labs and partially molten crust. Additional large hori- zontal fractures may form when the upper crust hecomes more or less supported by the rvalls of thr crater and fails to track the lens of melt as it cools and solidifies [Wright utid Okuniuru, 19771. Mid-ocean ridge magma chambers differ from Ha- waiian I a a I d e s in that volatiles are kept in solution by high hydrostatic and lithostatic loads. The absence of volatile re- lease as a fracturing mechani\m. honeler. is more than com- pensated for by acthe tectonics at mid-ocean ridges. Lava lake studies show that fracturing can be sustained down to the crust-melt interface. Similarly. rifting at the ridge crest in the
TABLE 8. Aberage Glass Inclusion Anal)ses
Type I Type 11 Type III Type I Type III Type 11 Type II1
1 1 3 4 5 6 7 8 9 10 11 12 13 14 15 16 I7 14 d
Sample 17-12 5-17 5-15 5-11 26-1A 16-7.4 16-7B 17-3 17-12 5-17 26-IA 16-78 5-11 5-15 16-7A 17-3 26-IA 16-7B Host hjineral plag plag plag plag plag plag plag plag 01 nl ol ol aug aug aug aug aug aug Number of ( 2 ) (3) ( I I (3) (3) (31 ( 6 ) I31 (3 (31 ( I I (21 (31 (4) (2) (31 (21 ( I I
SiO, 50.6 47.5 48.1 51.3 47.4 50.8 44.6 51.1 50.2 51.2 51.2 53.2 51.3 52.4 50.5 50.9 54.9 52.0 Alzo , 8.34 7.76 4.93 13.8 6.68 12.3 3.93 12.9 14.6 13.7 14.2 13.9 12.7 16.9 10.6 14.6 17.1 16.6 Feo* 16.5 20.9 19.9 12.6 21.3 14.2 27.5 15.3 11.7 13.8 14.2 14.3 13.5 13.2 15.1 13.8 10.6 13.1 M g 0 9.0s 9.02 10.9 5.71 9.25 5.55 9.28 4.28 3.95 3.53 3.22 1.71 5.50 2.54 7.10 3.96 2.15 1.09
N¿@ 1.15 1.04 0.81 2.26 1.19 2.62 0.67 3.02 2.67 2.75 2.82 3.38 2.61 3.36 2.28 3.23 4.33 4.26
,*-r analyses
Ca0 10.3 9.50 10.1 10.3 9.04 9.38 8.56 8.69 12.7 10.7 11.3 9.54 10.3 7.37 9.76 4.6~ 6.77 6.10
TioZ 2.04 2.96 3.51 2.25 3.24 2.32 3.81 2.82 2.09 2.59 2.16 2.85 2.51 2.33 2.82 2.84 2.40 3.77 PIOS 0.15 0.28 n.28 0.23 0.24 0.30 0.24 o . 2 ~ 0.14 0.22 o.21 0.22 0.26 o.19 0.34 0.26 0.37 0.40 MnO 0.25 0.39 0.37 0.20 0.32 0.26 0.44 0.24 0.21 0.21 0.18 0.21 0.18 0.20 0.27 (1.19 o.16 0.21
Total 98.4 99.4 98.1) 98.7 98.7 97.7 99.0 98.6 99.3 98.7 99.5 99.3 98.9 98.5 98.8 98.4 98.8 97.6
Feo* C a 0 1.6O 2.20 1.97 1.22 2.36 1.51 3.21 1.76 0.92 1.29 1.26 1.50 1.31 1.79 1.55 1.59 1.57 2.15 Feo* MgO 1.82 2.31 1.83 2.21 2.3U 2.56 2.96 3.57 7.96 3.91 4.41 8.36 2.45 5.20 2.13 3.48 4.93 12.0 Ca0 hlgO 1.13 1.05 0.93 1.80 0.98 1.69 0.9‘ 2.03 3.22 3.03 3.51 5.58 1.87 :.YO 1.37 2.19 3.15 5.60
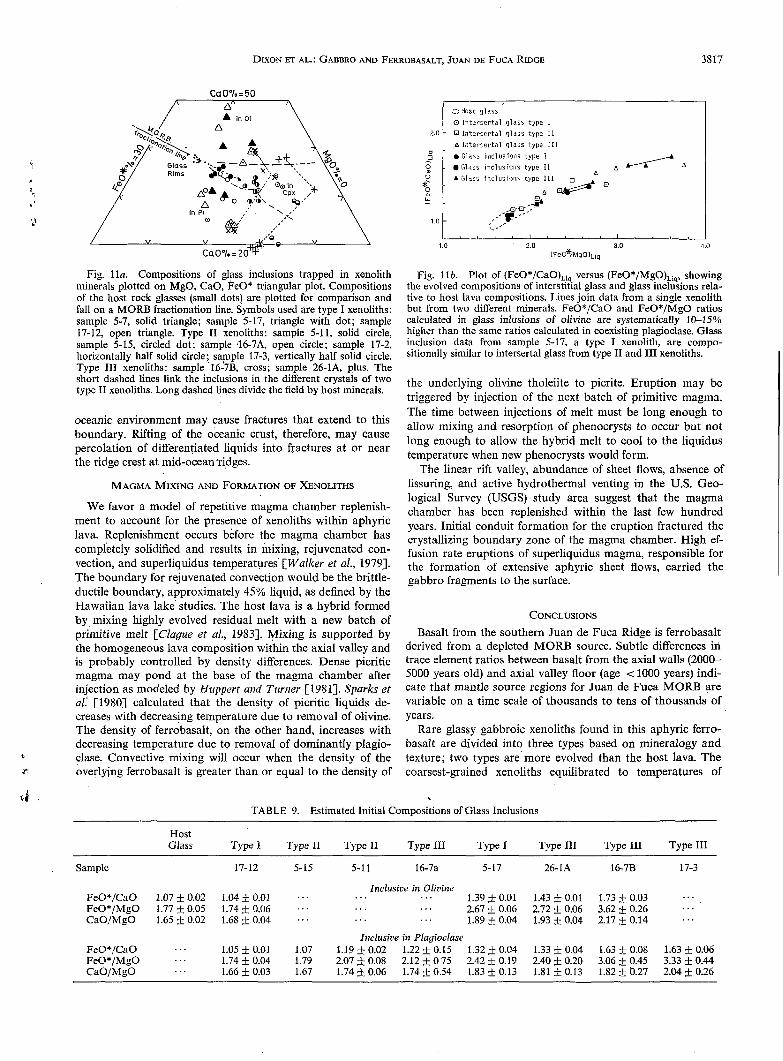
DIXON ET A L : GABBRO AND FERROBASALT, JUAN DE FUCA RIDGE 3817
2.0
4 2 *' - o - .
1.0
Ca0%=50 AA A in 01
C; Host glass O Int.erserta1 glass type I o Intersertal qldss type I I D Intersertai q l a s s type I l i 01à1as5 inclusions type I
-
D / Q . G1.1ss inclusions type 11 . A 'ilars inLlurio~i; t ype I11 +A l3
*mcr:,-p ,,**-,- 1 ,
- t-.'
I . I , t I , , , .
t
c
3 ' \ ' x in PI %,'' ,,,' \
/ V V ...-oc " / CaO%=20@
Fig. l l a . Compositions of glass inclusions trapped in xenolith minerals plotted on MgO, Cao, Feo* triangular plot. Compositions of the host rock glasses (small dots) are plotted for comparison and fall on a MORB fractionation line. Symbols used are type I xenoliths: sample 5-7, solid triangle; sample 5-17, triangle with dot; sample 17-12, open triangle. Type II xenoliths: sample 5-11, solid circle, sample 5-15, circled dot; sample 16-7A, open circle; sample 17-2, horizontally half solid circle; sample 17-3, vertically half solid circle. Type III xenoliths: sample 16:7B, cross; sample 26-1A, plus. The short dashed lines link the inclusions in the different crystals of two type II xenoliths. Long dashed liqes divide the field by host minerals.
oceanic environment may cause fractures that extend to this boundary. Rifting of the oceanic crust, therefore, may cause percolation of differentiated liquids into fractures at or near the ridge crest at mid-ocean.ridges.
MAGMA MIXING AND FORMATION OF XENOLITHS
We favor a model of repetitive magma chamber replenish- ment to account for the presence of xenoliths within aphyric lava. Replenishment occurs before the magma chamber has completely solidified and resuk- in mixing, rejuvenated con- vection, and superliquidus temperatures [Walker et al., 19791. The boundary for rejuvenated convection would be the brittle- ductile boundary, approximately 45% liquid, as defined by the Hawaiian lava lake studies. The host lava is a hybrid formed by mixing highly evolved residual melt with a new batch of primitive melt [Clague et al., 19831. Mixing is supported by the homogeneous lava composition within the axial valley and is probably controlled by density differences. Dense picritic magma may pond at the base of the magma chamber after injection as modeled by Huppert and Turner [1981]. Sparks et al. [1980] calculated that the density of picritic liquids de- creases with decreasing temperature due to removal of olivine. The density of ferrobasalt, on the other hand, increases with decreasing temperature due to removal of dominantly plagio- clase. Convective mixing will occur when the density of the overlying ferrobasalt is greater than or equal to the density of
the underlying olivine tholeiite to picrite. Eruption may be triggered by injection of the next batch of primitive magma. The time between injections of melt must be long enough to allow mixing and resorption of phenocrysts to occur but not long enough to allow the hybrid melt to cool to the liquidus temperature when new phenocrysts would form.
The linear rift valley, abundance of sheet flows, absence of fissuring, and active hydrothermal venting in the U.S. Geo- logical Survey (USGS) study area suggest that the magma chamber has been replenished within the last few hundred years. Initial conduit formation for the eruption fractured the crystallizing boundary zone of the magma chamber. High ef- fusion rate eruptions of superliquidus magma, responsible for the formation of extensive aphyric sheet flows, carried the gabbro fragments to the surface.
CONCLUSIONS Basalt from the southern Juan de Fuca Ridge is ferrobasalt
derived from a depleted MORB source. Subtle differences in trace element ratios between basalt from the axial walls (2000- 5000 years old) and axial valley floor (age < 1000 years) indi- cate that mantle source regions for Juan de Fuca MORB are variable on a time scale of thousands to tens of thousands of years.
Rare glassy gabbroic xenoliths found in this aphyric ferro- basalt are divided into three types based on mineralogy and texture; two types are more evolved than the host lava. The coarsest-grained xenoliths equilibrated to temperatures of
TABLE 9. Estimated Initial Compositions of Glass Inclusions
Host Glass Type 1 Type I1 Type II Type III Type I Type III Type ILI Type III
Sample 17-12 5-15 5-11 16-7a 5-17 26-1.4 16-7B 17-3
Inclusive in Olivine ... 1.39 f 0.01 1.43 f 0.01 1.73 & 0.03 2.67 k 0.06 2.72 & 0.06 3.62 f 0.26
FeO*/CaO 1.07 & 0.02 1.04 & 0.01 . . . 1.. ... FeO*/MrO 1.77 + 0.05 1.74 & 0.06 . . . ... ... ... CaO/MgO 1.65 f 0.02 1.68 & 0.04 . . . ... ... 1.89 0.04 1.93 0.04 2.17 3 0.14 ...
Inclusive in Plagioclase FeO*/CaO ... 1.05 & 0.01 1.07 1.19 0.02 1.22 & 0.15 1.32 & 0.04 1.33 & 0.04 1.63 f 0.08 1.63 & 0.06 FeO*/MgO ... 1.74 -1- 0.04 1.79 2.07 & 0.08 2.12 & O 75 2.42 & 0.19 2.40 f 0.20 3.06 f 0.45 3.33 f 0.44 CaO/MgO ... 1.66 & 0.03 1.67 1.74 & 0.06 1.74 f 0.54 1.83 f 0.13 1.81 & 0.13 1.82 0.27 2.04 3. 0.26
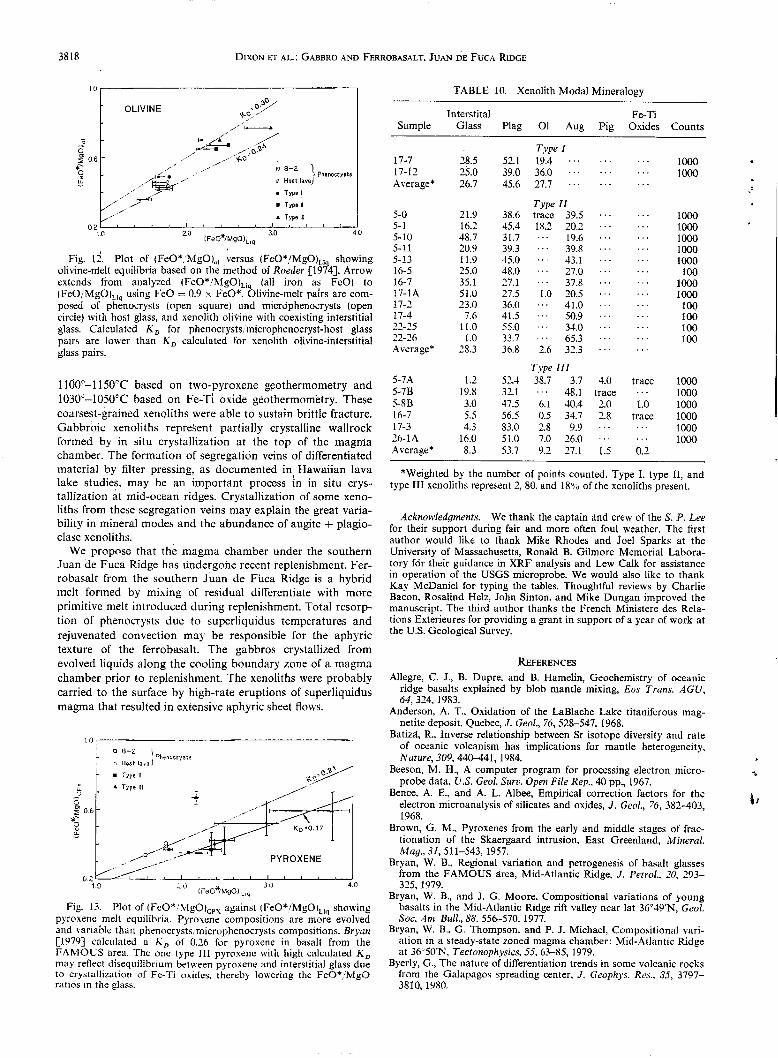
3818 DIXON ET AL. : GABBRO AND FFRROBASALT. JUAN DE FUCA RIDGE
I O , I
OLIVINE i Phenocrysts
Host Inva
TYP I Type II
A Type 111
Fig. 12. Plot of (Feo*, MgO),, versus (FeO*:MgO),,, showing olivine-rtielt equilibria based on the method of Roeder [1974]. Arrow extends from analyzed (FeO*'MgO),, (all iron as Feo) to (Fe0 'MgO),,, using F e 0 = 0.9 x Feo*. blii-ine-melt pairs are com- posed of phenocrysts (open square) and microphenocrysts (open circle) with host glass, and xenolith olivine with coexisting interstitial glass. Calculated I(, for phenocrysts. microphenocryst-host glass pairs are lower than K, calculated for xenolith olivine-interstitial glass pairs.
1 100'-1150"C based on two-pyroxene geothermometry and 1030-1050°C based on Fe-Ti oxide geothermometry. These coarsest-grained Xenoliths were able t o sustain brittle fracture. Gabbroic xenoliths represent partially crystalline wallrock formed by in situ crystallization a t the top of the magma chamber. The formation of segregation veins of differentiated material by filter pressing, as documented in, Hawaiian lava lake studies, may be an important process in in situ crys- tallization a t mid-ocean ridges. Crystallization of some xeno- liths from these segregation veins may explain the great varia- bility in mineral modes and the abundance of augite + plagio- clase xenoliths.
We propose that the magma chamber under the southern Juan de Fuca Ridge has undergone recent replenishment. Fer- rohasalt from the southern Juan de Fuca Ridge is a hybrid melt formed by mixing of residual differentiate with more primitive melt introduced during replenishment. Total resorp- tion of phenocrysts due to superliquidus temperatures and rejuvenated convection may be responsible for the aphyric texture of the ferrobasalt. The gabbros crystallized from evolved liquids along the cooling boundary zone of a magma chamber prior to replenishment. The xenoliths were probably carried to the surface by high-rate eruptions of superliquidus magma that resulted in extensive aphyric sheet flows.
- % L L . d L - - L I 4 0
o, 3 11
[Fd?bieOl L,,l 1.0 :.o
Fig. l j . Plot of (Feo* MgO),,, against [Feo* MgO),,, showing pyroxene melt equilihria. Pyroxene compositions are more evolved and tariahle than phenocrysts microphenocrysts compositions. Bryan Cl9791 calculated a h', o1 0.26 for pyroxene in basalt from the FAMOLS Brea. The one type III pyroxene with high calculated K, map reflect disequilibrium between pyrosene and interstitial glass due to crystallization of Fe-Ti osides. therehy lowering the FeO*.MgO mtios in the glas.
TABLE 10. Xenolith Modal Mineralogy
lnterstital Fe-Ti Sample Glass Plag O1 Aug Pig Oxides Counts
Type I 17-7 28.5 52.1 19.4 . . . . . . lo00 17-12 25.0 39.0 36.0 . . . . . . lo00 Arerage* 26.7 45.6 27.7 . . . . . . ...
...
...
5-0 21.9 38.6 5-1 16.2 45.4 5-10 48.7 31.7 5-11 20.4 39.3 5-13 11.9 45.0 16-5 25.0 48.0 16-7 35.1 27.1 17-1A 51.0 27.5 17-2 23.0 36.0 17-4 7.6 41.5 21-25 11.0 55.0 && 71-76 ,.. 1.0 33.7 Average* 28.3 36.8
Type I I trace 39.5 18.2 20.2
19.6 39.8 43.1 27.0
1.0 20.5 41 .O 50.9 34.0 65.3
2.6 32.3
...
...
...
...
. . . 372
...
...
...
...
... ...
... ...
... ...
... ...
... ...
... ...
... ...
... ...
... ...
... ...
... ...
... ...
... ...
lo00 1 0 0 lo00 1000 1000 100
lo00 loo0 100 100 100 100
Type I I I 5-7A 1.1 52.4 38.7 3.7 4.0 trace lo00 5-7B 19.8 32.1 I . ' 48.1 trace ... 1000 5-8ß 3.0 47.5 6.1 40.4 1.0 1.0 1000 16-7 5 3 56.5 0.5 34.7 2.8 trace 1000 17-3 4.3 83.0 2.8 9.9 1000 26- 1 'i 16.0 51.0 7.0 26.0 ... lo00 Alerage* 8.3 S3.7 9.2 27.1 1.5 0.2
... ... ...
*Weighted by the number of points counted. Type I. type II, and type III xenoliths represent 2, 80. and 1 8 " ~ of the xenoliths present.
Acknowledgments. We thank the captain and cres of the S. P. Lee for their support during fair and more often foul weather. The first author would like to thank Mike Rhodes and Joel Sparks at the University of Massachusetts, Ronald ß. Gilmore Memorial Labora- tory for their guidance in XRF analysis and Lew Calk for assistance in operation of the USGS microprobe. We would also like to thank Kay McDaniel for typing the tables. Thoughtful reviews by Charlie Bacon, Rosalind Helz, John Sinton. and Mike Dungan improved the manuscript. The third author thanks the French Ministere des Rela- tions Exterieures for providing a grant in support of a year of work at the US. Geological Survey.
REFERENCES Allegre, C. J., B. Dupre. and B. Hamelin, Geochemistry of oceanic
ridge basalts explained by blob mantle mixing, Eos Trans. AGLI, 64, 324, 1983.
Anderson, A. T.. Oxidation of the LaBlache Lake titaniferous mag- netite deposit. Quebec, J . Geol., 76, 528-547, 1968.
Batizri, R.. Inverse relationship between Sr isotope diversity and rate of oceanic volcanism has implications for mantle heterogeneity. Nature, 309,440-441, 1984.
Beeson, M. H., A computer program for processing electron micro- probe data, V.S. Geol. Suro. Open File Rep.. 40 pp., 1967.
Bence. A. E., and A. L. Albee, Empirical correction factors for the electron microanalysis of silicates and oxides, J . Geol., 76, 382-403, 1968.
Brown, G. kl.. Pyroxenes from the early and middle stages of frac- tionation of the Skaergaard intrusion. East Greenland, Minerul.
Bryan, W. B.. Regional variation and petrogenesis of basalt glasses from the FAMOUS sirea, Mid-Atlantic Ridge. J . Petrol., 20, 293- 325,1979.
Bryan, W. B., and J. G. Moore. Compositional variations of young basalts in the Mid-Atlantic Ridge rift valley near lat 36'49'N, Geul. SOC. Am. Bull., 88. 556-570, 1977.
ßryan, W. B., G. Thompson, and P. J. Michael, Compositional vari- ation in a steady-state zoned magma chamber: Mid-Atlantic Ridge at 36'50". Tectnnophysirs. 55. 63-85, 1979.
Byerly, G., The nature of differentiation trends in some volcanic rocks from the Galapagos spreading center. J . Geophys. Res., 55. 3797- 3810,1980.
Blag., 31,511-543, 1957.
'L
S J

DIXON ET AL. : GABBRO AND FERRORASALT, JUAN DE FUCA RIDGE 3819
Byerly, G. R., W. G. Melson, and P. R. Vogt, Rhyodacites, andesites. ferrobasalts and ocean tholeiites from the Galapagos spreading center, Earrh Planet. Sci. Lett., 30,215-221, 1976.
Byers, C. D., D. W. Muenow, and M. O. Garcia, Volatilgs in basalts and andesites from the Galapagos Spreading Center, 85" to 86'W, Geochim. Cosmochim. Acta. 47,1551-1558,1983.
Byers, C. D., D. M. Christie, D. W. Muenow, and J. M. Sinton. Volatile contents and ferric-ferrous ratips of basalt, ferrobasalt, an- desite and rhyodacite glasses from the Galapagos 95.5" W propagat- ing rift, Geochim. Cosmoehim. Acra, 48,2239-2245. 1984.
Carmichael, I. S. E., The iron-titanium oxides of salic volcanic rocks and their associated ferromagnesian silicates, Contrih. Mineral. Petrol., 14, 3664, 1967.
Carstens, H.. Note on the distribution of some minor elements in coexisting ortho- and clinopyroxene, Nor. Geol. Tidsskr., 38, 257- 260,1958.
CAYTROUGH. Geological and geophysical investigation of the Mid-Cayman Rise spreading center: Initial results and observa- tions, in Deep Drilling Results in the Atlantic Ocean: Oceun Crusr Maurice Ewing Ser., vol. 2. Edited by M. Talwani, C. E. Harrison, and D. E. Hayes, pp. 66-95, AGU, Washington, D. C., 1979.
Clague, D. A., and T. E. Bunch, Formation of ferrobasalt at East Pacific midocean spreading centers, J . Geophys. Res., 81, 4247- 4256,1976.
Clague, D. A., F. A. Frey, G. Thompson. and S. Rindge, Minor and trace element geochemistry of volcanic rocks dredged from the Ga- lapagos spreading center: Role of crystal fractionation and mantle heterogeneity, J . Geophys. Res., 86,9469-9482, 1981.
Clague, D. A., J. S. Eaby, and J. R. Delaney, Petrologic evidence for long-lived axial magma chambers on- the Juan de Fuca Ridge, paper presented at the Fifth Annual Geodynamics Research Sym- posium on Oceanic Lithosphere: Origin, Structure. and Dynamics, Tex. A&M Univ.. College Station, Tex., 1983.
Clocchiatti. R,, Les liquidus silicates pieges dans Ise cristaux d'olivine, de plagioclase et de pyroxene: prise d'essai du magma. Application a un basalte a affinite tholeitique de la ride oceanique emergee d'Asal, C. R . Ilebd. Seances Acad. Sci.. 284,2203-2206, 1977.
Clocchiatti, R., Glassy inclusions in plagioclase and pyroxene pheno- crysts in the chilled margin of a pillow lava from hole 417D, Deep Sea Drilling Project, Iniriul Rep. Deep Sea Drill. Prqi., 51-53, part 2,
Cohen, R. S.. and R. K. ONions. The lead, neodymium and stron- tium isotopic structure of ocean ridge basalts, .I. Petrol., 23, 299- 324. 1982.
Delaney, J. R., D. W. Muenoa. and D. G. Graham, Abundance and distributions of water, carbon and sulfur in the glassy rims of sub- marine pillow basalts, Geochim. Cosmochim. Acta, 4-7, 581-594. 1978.
Delaney, J. R., J. L. Karsten, and D. A. Clague, Geochemistry of Juan de Fuca Ridge basaltic glasses, Eos T r a m AGU. 63. 1147, 1982.
Detrick. R. S.. and W. S . Lynn, The origin of high-amplitude magnetic anomalies at the intersection of the Juan de Fuca Ridge and Blanco Fracture Zone, Eurth Pluner. Sci. Lett.. -76. 105-1 13, 1975.
Devore, G. W., Crystal growth and the distribution of elements, J . Geol.. 63, 471-494, 1955.
Devore, G. W., The association of strongly polarizing cations with weakly polarizing cations as a major influence in element distri- bution, mineral composition, and crystal growth, J . Genl., 65, 178- 195, 1957.
Drake, M. J., Plagioclase-melt equilibria, Geochim. Cosmochim. Acta. 40,457-465, 1976.
Dungan. M. A., and J. M. Rhodes. Residual glasses and melt in- clusions in basalts from DSDP legs 45 and 46: Evidence for magma mixing, Conrrib. Mineral. Petrol., 67.417431. 1978.
Eahy. J. S., and D. A. Clague. Preliminary description of basalt from the southern Juan de Fuca Ridge, U.S. Geal. Suri). Open File Rep.,
Eaby. J., D. A. Clague, and J. R. Delaney, Sr isotopic variations along the Juan de Fuca Ridge. . I . Geo I Res., 89.7883-7890,1984.
Engel, C. G., and R. L. Fisher, G to ultramafic rock complexes of the Indian Ocean ridge system. western Indian Ocean. Geol. Soc. .4m. Bull.. R6, 1553-1578, 1975.
Flower, M. F. J.. Cryptocumulate tholeiite as e\idence for magma mixing at an intermediate-rate spreading axis. Nature, IIY, 542- 545. 1982.
Fornari. D. J., M. R. Perfit, A. Malahoff, and R. Embley, Geochemical studies of abyssal lavas recovered by DSRV Alvin from eastern Galapagos rift. Inca transform. and Ecuador rift. I , Major elemcnt
1063-1067,1980.
Iy-.?OOC, 17 pp.. 1982.
variations in natural glasses and spacial distribution of lavas, J .
Fox, P. J.. and J. R. Stroup The plutonic foundation of the oceanic crust, in The Sea, vol. 7, The pceunic Lithosphere, edited by C. Emiliani, pp. 119-218, Wiley-Interscience, New York, 1981.
Ghose. S., I. S. McCallum, and E. Tidy, Luna 20 pyroxenes: Exsolu- tion and phase transfomation as indicators of petrologic history, Geochim. Cosmochim. Acta, 37, 831-839, 1973.
Haggerty, S. E., Opaque' mineral oxides in terrestrial igneous rocks, Short Coirrsc Notes Mirieral. Soc. Am., 3, H-101-H-169, 1976.
Harlow, G. E., C. E. Nehru, M. Prinz, G. J. Taylor, and K. Keil, Pyroxenes in Serra dk Mage: Cooling history in comparison with Moama and Moore County. Earth Planet. Sci. Lett., 43, 173-181, 1979.
Hebert, R., D. Biheau, and R. Hekinian, Ultramafic and mafic rocks from the Garret Transform fault near 13-30's on the East Pacific Rise: igneous petrology. Earth Planet. Sci. Lett., 65, 107-125, 1983.
Hekinian, R., and M. Hoffert. Rate of palagonitization and manga- nese coating on basaltic rocks from the rift valley in the Atlantic ocean near 3v50' north, Afar. Geol., I V , 91-109, 1975.
Helz. R. T., Crystallization history of Kilauea Iki lava lake as seen in drill core recovered in 1967-1979, Bull. I'olcanol.. 43. 675-701, 1980.
Hess, H. H., Stillwater igneous complex, Montana: A quantitative mineralogical study. Mem. Geol. Soc. Am., 80, 230 pp., 1960.
Hodges. F. N.. and J. J. Papike. DSDP site 334: Magmatic cumulates from oceanic layer 3, .I. Geophys. Rcs., 81. 41354151, 1976.
Huppert, H. E., and J. S. Turner, A laboratory model of a replenished magma chamber, Eurth Plnntv. Sci. Lett., 54. 144-152,' 1981.
Ishii. T., Zoning, exsolution and phase equilibria in the Kintoki-san pyroxenes, Hakone volcano, paper presented at 80th Annual Meet- ing, Geol. Soc. of Jpn., Sendai. 1973.
Ishii, T.. and H. Takeda, Inversion, decomposition and exsolution phenomena of terreatrial and extraterrestrial pigeonites. Geol. Soc.
Johannes, W.. Melting of plagioclase in the systems Ab-An-H,O and Qz-Ab-An-H,O at PH,O = 5 kbars: An equilibrium problem, Contrih. Minercil. Petrol.. 66, 295-303, 1978.
Kay, R., N. J. Hubbard, and P. W. Gast. Chemical characteristics and origin of oceanic ridge volcanic rocks, J . Geophps. Res., 75, 158.5- 1613, 1970.
Koski, R. A., R. Goodfellow, and R. M. Bouse, Preliminary descrip- tion of massive sulfide samples from the Juan de Fuca Ridge, U.S. G t d . Suri,. Open File Rep., 82-2008, 21 pp., 1982.
Kuno. H.. Review of pyroxene relations in terrestrial rocks in the light of recent expenmeqtal works. i21incruL J.. 5, 2143. 1966.
Larsen, J. G., Glass-hearing gabbro inclusions in hyaloclastites from Tindfjallajokull, Iceland. Lithos. II , 289-302, 1979.
LeRoex, A. P., H: J. B. Dick. A. J. Erlank, A. M. Reid. F. A. Frey, and S. R. Hart, Geochemistry, mineralogy and petrogenesis of lavas erupted along the southwest Indian ridge between the Bouvet triple junction and 11 degrees east. J . Pctrol., 24,267-318, 1983.
Lichtman. G. S.. W. R. Normark, J. R. Delaney, J. L. Morton, H. P. Johnson. and J. L. Karsten. Photogeology and evolution of the luan de Fuca Ridge. U.S. Geol. Surr. Open F ~ P Rep. 83-464, 14 pp.. 1983.
Liias. R. A.. and J. M. Rhodes, Evolution of basaltic magma along the Juan de Fuca Ridge. Eos Trczns. .4GU, 63, 1147, 1981.
Lindsley. D. H.. Pyroxene thermometry. Am. Nineral., 68, 477-493, 1983.
Lindsley. D. H.. and D. J. Andersen. A two-pyroxene thermometer, Proc. Luriur Planft. Sci. Co?$ 13rh. Part 2. J . Geophys. Res., 88. SUPPI.. A887-A906. 1983.
Lindsley. D. H., and K. J. Spencer, Fe-Ti oxide geothermometry: Reducing analyses of coexisting Ti-magnetite (Mt) and ilmenitc (Ilml, Eo.< Trma. .4GLr, 63, 471, 1982.
Macdonald, K. C., Mid-ocean ridges: Fjne scale tectonic, volcanic and hydrothermal processes within the plate boundary z,one, Annu. Rev. Earrh Planer. Sci., 10. 155-196. 1982.
Malcolm. F. L., Microstructures of the Cayman Trough gabbros, .I.
Mattey, D. P., and I. D. Muir. Genchemistry and mineralogy of ha- salts from the Galapagos spreading center. Deep Sea Drilling Proj- ect leg 54, Iniriol R ty . Deep Sca Drill. Proi., 54. 755-772, 1980.
Mazzullo. L. J., and A. E. Bence, Abyssal tholeiites from DSDP leg 34: The Nazca plate. J . Gcophja. REL. SI. 43274351. 1976.
Miyashiro. A.. and F. Shido. Differentiation of gabbros in the Mid- Atlantic Ridge near 24' N. Gsnchem. J . . 14. 145-154, 1980.
Gt7ophys. Res.. 88, 10,519-10,529, 1983.
Jpn. MC^., I I . 19-36, 1974.
G t d . , 89, 675-688, 1981.

3820 DIXON ET AL.: GABBRO AND FERROBASALT. JUAN DE FUCA RIDGE
Morton, J. L., Oceanic spreading centers: Axial magma chambers, thermal structure, and small scale ridge jumps, Ph. D. thesis, 101 pp., Stanford Univ., Stanford, Calif., 1984.
Morton, J. L., J. S. Eaby, W. R. Normark, J.-P. Eissen, M. Golan-Bac, J. B. Rapp, and J. M. Been, Basalt samples and water- column samples from the southern Juan de Fuca Ridge: Preliminary results of cruise L13-82-WF, US. Geol. Sura. Open File Rep., 83-827, 15 pp., 1983.
Natland, J. H., Effect of axial magma chambers beneath spreading centers on the compositions of basaltic rocks, Initial Rep. Deep Seu Drill. Proj., 54, 833-850, 1980.
Natland, J. H., A compositionally nearly steady-state magma chamber at the Costa Rica Rift: Evidence from basalt glass and mineral data, Deep Sea Drilling Project sites 501, 504, 505, Initial Rep. Deep Seu Drill. Proj., 69, 81 1-858, 1983.
Normark, W. R., J. E. Lupton, J. W. Murray, R. A. Koski, D. A. Clague, J. L. Morton, J. R. Delaney, and H. P. Johnson, Poly- metallic sulfide deposits and water-column tracers of active hy- drothermal vents on the southern Juan de Fuca Ridge, Mar. Tech- nol. Soc. J . , 16,4653, 1982.
O’Hara, M. J., Geochemical evolution during fractional crys- tallization of a peridically refilled magma chamber, Nature, 266,
Pallister, J. S., and C. A. Hopson, Samail ophiolite plutonic suite: Field relations, phase variation, cryptic variation and layering, and a model of a spreading ridge magma chamber, J . Geophys. Res., 86,
Papike, J. J., and A. E. Bence, Apollo 14 inverted pigeonites: Possible samples of lunar plutonic rocks, Earth Planet. Sci. Lett., 14, 176- 182,1972.
Perfit, M. R., and D. J. Fornari, Geochemical studies of abyssal lavas recovered by DSRV Alvin from eastern Galapagos rift, Inca trans- form, and Ecuador rift, 2, Phase chemistry and crystallization his- tory, J . Geophys. Res., 88, 10,530-10,550, 1983.
Perfit, M. R., D. J. Fornari, A. Malahoff, and R. W. Embley, Geo- chemical studies of abyssal lavas recovered by DSRV Aluiit from eastern Galapagos rift, Inca transform, and Ecuador rift, 3, Trace element abundances and petrogenesis, J . Geophys. Res., 88, 10,551-
i
503-508,1977.
3593-2644.1981.
- - .~ 10,572, 1983.
Pincknev, L. R., and D. H. Lindsley, Effects of magnesium on iron- titani;m oxides, Geol. Soc. Am A&. Programs, 8 7051, 1976.
Richter, D. H., and J. G. Moore, Petrology of the Kilauea Iki lava lake, Hawaii, US. Geol. Surv. Prof. Pap., 537-B,26 pp., 1966.
Robinson, P., The composition space of terrestrial pyroxenes- Internal and external limits, in Pyroxenes, Rev. Mineral., vol. 7, edited by C. T. Prewitt, pp. 419-475, Mineralogical Society of America, Washington, D. C., 1980.
Roedder, E., Origin and significance of magmatic inclusions, Bull. Mineral., 102,487-520, 1979.
Roeder, P. L., Activity of iron and olivine solubility in basaltic liquids, Earth Planet. Sci. Lett., 23, 397410, 1974.
Ross, M., and J. S. Huebner, Temperature-composition relationships between naturally occurring augite, pigeonite and orthopyroxene at one bar pressure. Am. Mineral., 64, 1133-1155, 1979.
Sato, H., K. Aoki, K. Odamoto, and B. Fujita, Petrology and chemis- try of basaltic rocks from hole 396B, IPOD/DSDP leg 46, Initial Rep. Deep Sea Drill. Proj., 46, 115-141, 1978.
Scheidegger, K. F., Temperatures and compositions of magmas ascending along midocean ridges, J . Geophys. Res., 78, 3340-3355, 1973.
Schilling, J.-G., G. Cousens, R. L. Chase, and J. R. Delaney, Juan de Fuca-Explorer Ridge: Rare earth contents, Eos Trans. AGU, 63, 1154,1982.
Sinton, J. M., D. S. Wilson, D. M. Christie, R. N. Hey, and J. R. Delaney, Petrologic consequences of rift propagation on oceanic spreading ridges, Earth Planet. Sci. Lett., 62, 193-207, 1983.
Sobolev, V. S., and V. P. Kostyuck, Magmatic crystallisation based on a study of melt inclusions (in Russian), Nauka Press, Novosi- birsk, 1975. (Translated in part in Fluid Inclttsion Res., 9, 182-253, 1975.)
3 c
Sparks, R. S. J., P. Meyer, and H. Sigurdsson, Density variation amongst mid-ocean ridge basalts: Implications for magma mixing and the scarcity of primitive lavas, Earth Planet. Sci. Lett., 46, 419430,1980.
Stakes, D. S., J. W. Shervais, and C, A. Hopson, The volcanic- tec- tonic cycle of the FAMOUS and AMAR valleys, Mid-Atlantic Ridge (36“47”): Evidence from basalt glass and phenocrysts com- positional variations for a steady state magma chamber beneath the valley midsections, AMAR 3, J . Geophys. Res., 89, 6995-7028, 1984.
Stormer, J. C., Jr., The effects of recalculation on estiamtes of temper- ature and oxygen fugacity from analyses of multicomponent iron- titanium oxides, Am. Mineral., 68, 586-594, 1983.
Tiezzi, L. J., and R. B. Scott, Crystal Fractionation in a cumulate gabbro, Mid-Atlantic Ridge, 26”N, J . Geophys. Res., 85, 5438-5454, 1980.
Truter, F. C., Modern concepts of the Bushveld Igneous Complex, Rep. I , pp. 77-92, Comm. for Tech. Coop. in Afr., South. Reg. Comm. of Geol., Salisbury, 1955.
Usselman, T. M., and D. S. Hodge, Thermal control of low-pressure fractionation processes, J . Volcanol. Geothernt. Res., 4, 265-281, 1978.
van Andel, T. H., and R. D. Ballard, The Galapagos Rift at 86’W, 2, Volcanism, structure, and evolution of the rift valley, J . Geophys. Res., 84, 5390-5406, 1979.
Vanko, D. A., and R. Batiza, Gabbroic rocks from the Mathematician Ridge failed rift, Nature, 300,742-744, 1982.
Verma, S . P., and J.-G. Schilling, Galapagos hot spot-spreading center system, 2, 87Sr/86Sr and large ion lithophile element vari- ations (85’W-1Ol0W), J . Geophys. Res., 87, 10,838-10,856, 1982.
Vogt, P. R., and G. R. Byerly, Magnetic anomalies and basalt compo- sition in the Juan de Fuca-Gorda Ridge Area, Earth Planet. Sci. Lett., 33, 185-207, 1976.
Wager. L. R., and W. A. Deer, Geological investigations in East Greenland, III, The petrology of the Skaergaard intrusion, Kangerdlugssuaq, East Greenland, Medd. Gronl., 105, 1-352, 1939.
Wakeham, S . E., Petrochemical patterns in young pillow basalts dredged from Juan de Fuca and Gorda ridges, MT S . thesis, Oreg. State Univ., Corvallis, 1977.
Walker, D., T. Shibata, and S. E. DeLong, Abyssal tholeiites from the Oceanographer Fracture Zone, II, Phase -equilibria and mixing, Contrib. Mineral. Petrol., 70, 111-125, 1979.
Walker, K. R., N. G. Ware, and J. F. Lovering; Compositional vari- ations in the pyroxenes of differentiated Palisades Sill, New Jersey, Geol. Soc. Am. Bull., 84,89-110, 1973.
Watson, E. B., Glass inclusions as samples of early magmatic liquid: Determinative method and application to a South Atlantic basalt, J . Volcanol. Geothenn. Res., I , 73-84, 1976.
Wilson, D. S., R. N. Hey, and C. Nishimura, Propagation as a mecha- nism of reorientation of the Juan de Fuca Ridge, J . Geophjw. Res.,
Wright, T. L., and R. T. Okamura, Coaling and crystallization of tholeiitic basalt, 1965 Makopuhi lava lake, Hawaii, U.S. Geol. Stiro. Prof: Pap., 1004,78 pp.. 1977.
Wright, T. L., and D. L. Peck, Crystallization and differentiation of the Alae magma, Alae lava lake, Hawaii, U.S. Geol. Surc. Prof. Pap.,
89,9215-9225, 1984.
935-C,20 pp., 1978.
D. A. Clague, US. Geological Survey, 345 Middlefield Road,
J. E. Dixon, Division of Geological and Planetary Sciences, 170-25,
J.-P. Eissen, ORSTOM, B.P. A5, Noumea, New Caledonia.
MSJ999, Menlo Park, CA 94025.
California Institute of Technology, Pasadena, CA 91 125.
(Received July 22, 1985; revised October 15, 1985;
accepted November 1, 1985.)