gabon: issues and'options in the energy...
TRANSCRIPT

Report No. 6915-C;A
Gabon: Issues and'Optionsin the Energy -Sector
July 1988 .o 29> ' "' 'O
r. Jg,
H }/1'' > ; is
Pub
lic D
iscl
osur
e A
utho
rized
Pub
lic D
iscl
osur
e A
utho
rized
Pub
lic D
iscl
osur
e A
utho
rized
Pub
lic D
iscl
osur
e A
utho
rized

JOINT URDPIVORLD BANK 8ENEGY SCWTOR ASSESSN3NT PROGANM
Reports Already Issued
Country Date Npmber
Indonesia November 1981 3543 JDMauritius December 1981 3510-MASKenya May 1982 3800-KESri Lanka May 1982 3792-CEZimbabwe June 1482 3765-ZIMHaiti June 1982 3672-BAPapua New Guinea June 1982 3882-PNGBurundi June 1982 3778-BURwanda June 1982 3779-RWMalawi August 1982 3903-MALBangladesh October 1982 3873-BDZambia January 1983 4110-ZATurkey March 1983 3877-TUBolivia April 1983 4213-BOFiji June 1983 4462-FIJSolomon Islands. June 1983 4404-SOLSenegal July 1983 4182-SESudan July 1983 4511-SUUganda July 1983 4453-UCNigeria August 1983 4440-UNINepal August 1983 4474-NEPThe Gambia November 1983 4743-CMPeru January 1984 4677-PECosta Rica January 1984 4655-CRLesotho January 1984 4676-LSOSeychelles January 1984 - 4693-SEYMorocco March 1984 4157-MORPortugal April 1984 4824-PONiger May 1984 4642-NIREthiopia July 1984 4741-ETCape Verde August 1984 5073-CVGuinea Bissau August 1984 5083-GUBBotswana September 1984 4998-BTSt. Vincent andthe Grenadines September 1984 5103-STV
St. Lucia September 1984 5111-SLUParaguay October 1984 5145-PATanzania November 1984 4969-TAYemen Arab Republic December 1984 4892-YARLiberia December 1984 5279-LBRIslamic Republic ofMauritania April 1985 5224-MAU
Jamaica April 1985 5466-JMC8te d'Ivoire April 1985 5250-IVCBenin June 1985 5222-BEN
Continued on inside back cover

FOR OFFICIAL USE
Report No. 6915-CA
GABON
ISSUES AND OPTIONS IN THE ENERGY SECTOR
JULY 1988
This is one of a series of reports of the Joint UNDP/World Bank EnergySector Assessment Program. Finance for this work has been provided, inpart, by the UNDP Energy Account, and the work has been carried out bythe World Bank. This report has a restricted distribution. Its contentsmay not be disclosed without authorization from the Government, the UNDPor the Vorld Bank.

3
Gabon possesses significant petroleum, natural gas,hydroelectric and forestry resourceso. The commercial energy consumptionper capita (600 kgoe in 1985) is high compared to other countries of Sub-Saharan Africa. The mission preliminary estimates of the total fuelwoodconsumption per capita was about 390 kgoe, making the total per capitaenergy consumption per capita in 1985 990 kgoe.
The mission reviewed energy sector development and investmentplans following the drop in 1986 in international oil prices. As agreedwith the government, the present report focuses mainly on petroleum andelectricity subsectors which were the most affected by oil pricedecline. Utilization of natural gas has also become ' priority issuesince the discovery of large resources.
The report addresses other issues and evaluates options relatedto (a) optimization of oil production so as to sustain economic recovery;(b) a restricted power investment plan; and (c) development of coherentpricing policies to promote efficient energy supply and consumption.Finally, it recommends institutional reforms pertaining to energy sectorplanning, management and coordination.

BEICIP Bureau d'8tudes Industrielles et de Cooperation del'institut frangais du p6trole
COGER Compagnie Gabon Elf de RaffinageDG8 Directorate General of EnergyDCH Directorate General of HydrocarbonsGPP Groupement Professionnel des PktrolidrsIMP International Monetary FundMEER Ministry of Energy and Hydraulic Resources- -MHBP Ministry of Pinance, Budget and ParticipationsMMH Ministry of Mines and HydrocarbonsMPg Ministry of Planning and EconomyOPEC Organisation of Petroleum Exporting CountriesPetrogeb Soci4te Nationale P6troli4re Gabwaaise8ggG Soci6t6 d'Energie et d'Eau du CabonSGEPP Soci6t6 Gabonaise d'Entreposage des Produits
p6troliersSNgA Soci6t6 Nationale Elf AquitaineSOBRAGA Soci6t6 des brasseries tu GabonSOGARA Soci6t6 Cabonaise de RaffinageSPA!E Societe des P6troles 4e l'Afrique EquatorialeUNDP United Nations Development Programme

bbl barrelb/d barrel(s) per daybly barrels(s) per yearBSCV billion standard cubic feetBTU British Thermal UnitCIP cost, insurance, freightDER Directorate of Regional ExploitationsPCV FrancevilleGOP gross domestic productGWh gigawatt-hourha hectarehi hectoliterRV high voltagekcal kilocaloriekg kilogramkgoe kilograms of oil equivalentkm kilometerkm' square kilometerktoo thousands tons of oil equivalentkVA kilovolt-amperekY kilovoltkV kilowattkWh kilowatt-hour1 literLIV LibrevilleLPC liquefied petroleum gasLV low voltagem meter23 cubic meterNCP thousand cubic feetNHBTU million British Thermal UnitsWYA megavolt-ampereNV medium voltageM3 megawattjjm3 nortal cubic meterMR! Northwest EuropePOC Port-Gentiltoe tons of oil equivalentton metric tonyr year

aURUC D AMF EQUnIVALUS
Currency Unit - CPA Franc (CFAF)Lichange PAte: 350 CFAF/US$ 1 a/
Fuel Calorific Velue too
(million kcal/ton)
Crude Oil 10.2 1LPB (Butaer) 10.8 1.059Gasollne 10.5 1.029Jet Fuel 10.4 1.020Kweosene 10.3 1.007Gas ol1 10,2 1Fuel 011 9.7 0.951Firewood 3.5 0.343Charcoal 7.0 0.6863Natural gas 253.0 k/ 22.84 S/
Elect&rcitX4000 kWh a 1 toe for hydroelectrlc supply on a thermal replacement basis(thermal officlency 34.04).
1 GMh u 86 toe (thermal replacement value).
a/ Exchange rate at tl.e of mission. Rate used In the roport, unlessotherI se noted .
bl MIIIIon kcal W6f;/ tce/W4MF

TAML Or COUT11111
Page
SUMMARY AND RECOIMONDATIONS..........*.......................... i
I. THE KERGY SECTOR IN G ... 1
The goog.............. ......... .e.e ceeco....c c .e.c......... 1Initial Impact of the Oil Price Decline................ 2
Energy 2esources .................. ecc..... 2Energy Consumption4 ......... ...... ;c.......... ..... 4
II. HYDROCARRON EXPLORATION AND DEVEL0PMHKT..**................. 8Background .... * ..................................... 0*6 8
Geology of the Region .......... .. e8.e.c..... c cec- 8Exploration and Production History........o...........e.. 9Past Activities..oeeocoo..oocoe..o.t.o.eceooe. e.ccc.eo 9Current Activities.................................... 10
Future Petroleum Production Prospects*.***..*..**o*.****. 11Development of Proven Reserves... ..-.-..... 11.Oil Production Scenarios.o ...c.e....... 12
Legal and Fiscal Framework ......................... *...... 13Sector Organization... .. o.oo............... *.e.c.... . 15Potential for Natural Gas Development.*o0 ......... .... 16
III. PETROLEUM SUPPLY AND DISTRIBUTION ... 19Petroleum Product Demando. .................... o.......... 19Petroleum Refiningz.eo.o....o. o......e. *e oo.....o..e.co 20Supply Arrangements for Crude Oilile.ce.ccceceeo..e.e.. 21
Product Marketing and Distribution ....................... 22Marketing Ar rang anntgements................... 22Financial Difficulties of PIZO. I ZO...............000.. 22Product Distribution Strategy...........to............. 24
Institutional Issueso..o........... .soo .c e..oc.oe.e..00.0 26Petroleum Product Pricing.c. 28Ex-Refinery Prices...eo....o.o...o.o ......... ..-.oo... 28Retail Price Structuresoo..... *oe ......cc....c.c...co.. 32

IV. ELECTRIC .Oge................. .. ............. 37Introductior...... #&..... **oo9O**....a as .eeaa ..s***eae 37Main System Characteristics.............. .... .... *..... 37Generation and Tran s mi ssion.............................. 38Distribution........................ee...........e..... 40
Demand Characteristic. 40Demand P isf i l e s 40Demand Forecasts r e c a s ts..........................e.... 41
Medium-Term System tievelopment: 1987-19957............... 42Long-Term System Development 45Interconnection of LBV and POG 45
Other Subsector Isus*.......*49Electricity Tari ffs 49Reform of Public Service Regulations................... 53S8EG's Financial Si tia t i o n 55
TABLES
1.1: Gabon - Indicators of Commercial Energy Consumption1978 - 1 6
1.2: Gabon Energy Balance, 1985 72.1: Annual Petroleum Production by Operator, 1976-1986....... 102.2: Projected Annual Output of Fields Currently in
Productionoo*ee**ooooeo*******ooo.ooooosoo*ooo*oo*****# 112.3: Projected Oil Production, 1986-l992.*$o.................. 132.4: Projected Development Expenditures, 1986-1991,......... 143.1: Domestic Petroleum Product Sales, 1980-1985...........*. 193.2: SOCARA Refinery Characteristics ......................... 213.3: Domestic Market Shares of the Distribution
Companies by Product, 1985 233.4: Retail Market Indicators for Petroleum Products,
1985....... .......... g.e...... e.g.................. .... 263.5: Suggested Investment Program 1987-1991.7-1991*0006*060600 273.6: Comparison of Ex-Refinery Prices and Import
Parity, 1986 303.7: Major Components of the Petroleum Froduct Price
S t r u c t u re................. ........... ................. 333.8: Evolution of Taxes and Subsidies on Petroleum
Product Prices 354.1: Main SEEG System Characteristics, 1985....9 8 S............ 384.2: Cabon Electricity Sales - 1985.... 414.3: Revised Electricity Demand Forecasts: 1986-1995.......... 434.4: Potential Hydroelectric Plants near Libreville........... 464.5: Projected Investment Program for Electricity
Subsector 1987-1995 484.6: SEEG Tariff Study - Low Voltage.......................... 514.7: SEWG Tariff Study - Transmission and Medium Voltage...... 524.8: Arrears Payable on SEEG Accounts...............o........ 55

1 Gabon: Commercial Energy Consumption..................... 582 Investment Expenditures for Petroleum Exploration,
1977-1985 ....... S . 93 Gabon - Well Drilling History, 1976-1985................. 604 Investment Expenditures for Petroleum Development,
1 9 7 6 - 1 9 85............ Ge...... ........ CC G#O***9O** CCC *00 615 Natural Gas Utilization Feasibility Study -
Draft Terms of Reference . ..................... 626 Gabon: SOGARA Production 1975-1985....................... 657 BEICIP Scenarios for Petroleum Product Demand*........... 668 Petroleum Product Demand and Investment Requirements ..... 679 Regional Petroleum Product Price Structure .............. 6910 Petroleum Product Transport Costs........................ 7411 Price Structure for Butane sold in Libreville
and Port-Gentil, March 18,1985......................... 7712 Electricity System Data . ................ .. eee. 7813 Electricity Demand: l9801985...e...... .... .eee 8114 Characteristics of Instalied Hydro and Thermal Plante.... 8215 Electricity Consumption and Sales by Voltage and
Type of Consumer, 1985.... ... ...... ..... 8316 BERG Demand Forecast - 1984L817 H ydraulic Potential.......e ..... e.....ea 8818 BUG-Personnel ...................... e.. 8919 8EEG Customers - l975l9BSe................ ..e 9020 SREG Operational Expenditures.........................****.. 9121 SBEG: Past Investments . .e. ee. 9222 SEEG Organization Chart....... * ..... ...... 9423 SBEG Tariffs ......................... .... .. 9e..e 9524 Household Energy Draft Terms of Reference ........ .e.. 99

S8_MAY MD
Scope of Inquiry
1. This Energy Assessment Report summarizes the findings of amission fielded in October/November 1986. 1/ The mission coincided with aperiod of marked uncertainty for the Gaboneose authorittes. its variouseconomic development and investment plans were being revised following asevere drop in international oil prices. Although a comprohensive reviewof the entire energy sector had been planned, the anticipated macro-economic repercussions of the oil price decline (para. 1.6-1.7) modifiedGovernment priorities, as well as those of the mission. Consequently,the mission chose, with the agreement of the Government, to highlight,issues whose key parameters had been altered by 'the oil price decline,thereby affecting short- and medium-term decisions.
2. As a result, this report Ifocuses mainly on the petroleum andelectricity subsectors. Utilization of natural gas as a long-term optionof electricity generation (para. 4.27-4.31) has also bocome a priorityissue since the discovery of large reserves which will allow for thesupply of natural gas to the Socisto d'Energie et d'Eau du Gabon (SERG)at competitive costs. A decision regarding natural gas is important inthe short term. Terms of Reference for an in-depth gea fesibilitysLudy, to be undertaken immediately, are given in Annex 5.
3. The remaining issues addressed by the mission fall into thefollowing general groupings:
(a) the best strategy to simultaneously maximize the present valueof remaining petroleum reserves and optimize current crude oilproduction so as to sustain economic recovery, with emphasis oncontractual arrangements to provide incentives for explorationand development;
(b) competitivity and efficiency of petroleum product supply to thedomestic market, including arrangements for procuring crude oil
1/ Members of the assessment team were: Abderreazak Ferroukhi (MissionLeader, Senior Energy Economist), Lori A. Perine (Economist),P. Vernet (Energy Economist, Consultant), G.R. Rhoury-Haddad(Consultant, Petroleum Exploration and Production), L. Ceccaldi(Consultant, Petroleum Refining and Distribution), and D. Dufrenoy(Consultant, Electric Power). Ms. Wline Talon assisted intranslating sections of the report and was responsible for reportprocessing. Ms. Perine was the principal author of the report.

- ii -
and refined products, and product distribution and storagerequirementsg
(c) priorities for revising and scheduling electric powerinvestment requirements in the short- to medium-term, as wellas long-term considerations;
(d) development of coherent pricing structures and policies tepromte efficient energy supply and consumption; and
(e) requirements for institutional reform to enhance sectorcoordination and planning, and to address various financialmanagement problems.
4. Several other issues normally found in an energy assessmentreport were excluded from this exercise. These include: householdenergy; supply and demand of woodfuelsl; ad utilization of agricultur&lresiduei and other non-conventional energy resources. Gabon has verylittle information on these areas at present. The Ministry of Energy andHydraulic Resources (MEMR) has commissioned a study of household energy,and its results were expected in late 1987. Based on a review of theterms of reference, it seems that the study will give a rough estimate ofglobal household demand. It will not, however, categorize the extent towhich particular fuels are consumed, or the purposes for which they areused. Nor will there be a systematic examination of the supply networksfor household fuels (most importantly woodfuels). The mission hasannexed to this report (Annex 24) draft Terms of Reference for a house-hold energy survey which would provide such information. In order toround out its energy data base, ths Government should consider launchingsimilar inquiries within the agriculture sector and among small indus-trial consumers to gather information on the use of non-conventionalfuels in other sectors. Both surveys can be postponed for the mediumterm.
Overview of Energy and the Economy
5. The Gabonese Republic possesses significant petroleum, naturalgas, hydroelectric, and forestry resources. Proven petroleum reserves,at present, are almost 961 million barrels (bbls) (para. 1.9).Associated natural gas production was estimated at 2.0 billion Nm in1985. It will substantially increase after the development of thediscoveries, confirmed in 1987: Rabi and Coucal particularly. TheOgoou4 River and its tributaries provide the country with a hydroelectricpotential of 5OOOO Clh/yr, only 1X of which is developed. Densetropical rain forests cover over 22 million hectares (ha), or 80X ofGabonese territory.
6. Per capita commercial energy consumption was estimated as600 kilograms of oil equivalent (kgoe) in 1985. The addition of mission

- iii -
estimates of fuelwood consumption among the rural populace (less thanhalf the total population) increases this figure to almost 990 kgoe,which is high compared to the neighboring countries of West Africa.Petroleum products account for over 73% of net domestic consumption(excluding primary consumption of crude oil and natural gas by thepetroleum industry), while woodfuels -snd electricity account for 161 and10 respectively. Natural gas is used exclusively for the production ofsecondary energy (electricity) or in petroleum production, and so doesnot enter the national energy accounts under net domestic consumption(Table 1.2). The petroleum industry is the largest energy consumingsector in Gabon, although most of its consumption is in the form ofprimary energy (associated natural gas reinjected ror crude productionand crude oil consumed in refining operations). The structure of finaldemand is 33X households, 281 nonoil industry and 171 transport, 81petroleum industry, and 111 public sector/civil works.
7. The energy sector has played a crucial role in the developmentof Gabon since the early 1970s, when petroleum output emerged as themajor determinant of national economic activity. Following a rapidexpansion resulting from accelerated oil production and increasing oilprices, heavy external borrowing in the late 1970s to support anambitious public investment program led to an external debt and liquiditycrisis. The crisis lasted for about two years (1977-78) before thesecond *.nternational oil price increase helped fuel economic recoveryfrom 1530 to 1984. The petroleum sector represented 45X of GDP andpetroleum revenues made up 661 of total government receipts.
8. The economy grew sluggish in early 1985, then was shakenconsiderably by the drop in oil prices at the end of the year. Althoughshort-term projections to 1990 indicate continued economic difficulties,the picture is likely to improve substantially by the mi4-1990s,fundamentally due to increased oil production and improved oil prices.In the short run, however, oil revenues could top 200 billion CFAF(constant 1985 prices), but this is still only about 551 of 1985levels. The potential for significant increases in government revenuesfrom other sectors during this period is limited. Thus the Governmentwill be forced to curtail recurrent expenditures and all but essentialinvestments.
Priority Petroleum Subsector Issues
Optimizing Production of Crude Oil
9. Most petroleum fields currently in production have been fullydeveloped and now are undergoing a natural decline in output. Theircombined annual output will not be enough to sustain current productionlevels (8 million tons) until 1990 (Table 2.2). The development ofcrucial new discoveries, such as the Rabi field (para. 2.10-2.11), aswell as the Coucal field (para. 2.12), also would be necessary to sustain

- iv -
production. The projections of annual oil production .n Table 2.3indicate that development of Rabi will be essential to maintainingproduction levels above the 8 million tons/yr threshold after 1990.These projections do not. take into account the possibility that fieldsother than Rabi and Coucal could be developed and brought intoproduction. However, they do emphasize the importance of Rabils outputfor the short- to medium-term recovery of the e^onomys without thisproduction, oil revenues have little chance of regaining pre-1905 levels.
10. The strategy adopted by the Government in order tosimultaneously approach these two goals should consist principally ofproviding the proper fiscal and legal framework for encouragingdevelopment, especially during periods of oil price uncertainty such asoccurred in late 1985/early 1986. The Government should take advantageof its expanded role under newly adopted production-sharing contracts'(para. 2.18-2.21) to: (a) improve monitoring of upstream petroleumactivities; and (b) develop relevant fiscal and investment policies(para. 2.21).
11. The Directorate General of Hydrocarbons (DGH) has been thebeneficiary of long-term technical assistance by well-qualifiedinternational experts who should design and implement an intensivetraining program in this area (para. 2.23). A review and possiblerevision of the experts' terms of reference should ensure that they areinstructed to: (a) advise the DGU on the best arrangements tosystematically monitor petroleum operations; (b) provide on-the-jobtraining for the senior professional DGH staff selected for thisfunction; (c) advise the DGH, as the need arises, on specific monitoringissues requiring inputs from technical specialists; and (d) train DGHstaff to audit the oil company accounts under both types of explorationcontracts (para. 2.17-2.20).
12. In the short term, the Government should establish thepetroleum production profile for Gabon based on reserve/production ratioand oil export revenues. It would serve as the principal element inlong-term planning for the national economy, antd should be updatedregularly.
Supply Arrangements for Crude Oil
13. Gabon' s oil refinery, the Socidt6 Gabonaise de Raffinage(SOCARA), is the principal supplier of finished products to the domesticmarket. It is obligated by statute to refine the locally produced crude,and all companies producing in Gabon must sell a fraction of their (aftertax) production to the refinery. The crude is purchased from Elf-Gabonat a set price (para. 19), but up until 1984, payments were made throughPetrogab, the national oil company (para. 2.24). Petrogab was liquidatedin late 1987 (para. 2.26). As a result, direct invoicing by tlf-Gaboncould be re-established. The transaction could be monitored periodicallyby the DGH (para. 3.8).

Product Distribution StrategS
14. Gabon's infrastructure requirements and associated investmentsin the storage and transport of petroleum products were the subject of astudy in early 1983 (para. 3.13-3.14). Taking into account loweractivity scenarios following the oil price declinet the mission modifiedthe study's recommendations in two areas, First, Gabon should minimiseits storage investments by adopting a commercial inventory of less than45 days, 25 days being the proposed reserve level. The Government maychoose a slightly higher levelt if 25 days is considered inadequate forstrategic reasons (para. 3.14). Second, the recommended establishment ofadditional service stations in the interior does not appear to be themost economic interim strategy. Other solutions, such as using drumsupply in conjunction with hand pumps, should be considered (para. 3.17).
15. The study by the French Petroleum Institute's Bureau d'8tudegIndustrielles et de Coop6ration (BBICIP) recommended that two 2,000 ebutane spheres be installed at Owendo in order to improve the supplycosts of butane. The mission agrees that one of these s)heres should beinstalled immediately, on condition that the payback period is less thantwo years. In the short term, the Government should undertake a fullanalysis of butane demand and supply. This analysis could be included aspart of the development of a household energy strategy, and should takeinto account the conclusions of the petroleum pricing study (para. 3.16).
Petroleum Subsector Institutiocis
16. Of the six petroleum product marketing companies operating inGabon until 1987, all were private companies (Government share: 101),with the exception of the national marketing company, PIZO. PIZO(Government shareS 50%) was created to ensure that all regions of thecountry have access to petroleum products and, as recently as 1985, wasthe market leader for inland product sales (para. 3.9). As a result ofits public service mandate and its high proportion of public sectorcustomers, PIZO found itself saddled with numerous financial problems(para. 3.10-3.11). The Government decided that these problems would bestbe resolved by liquidating the company and selling its assets. The finalliquidation plans, which will shortly go into effect, should includeclear provisions for the payment and/or cancellation of PIZO's debts andaccounts payable by clients before it is implemented.
17. There are two key institutions involved in the supervision ofoperations, investments, planning and pricing in the petroleum sub-sectors the Ministry of Finance, Budget and Participations (MPBP), andthe Ministry of Planning and Economy (MPH) (para. 2.23-2.26; and 3.18-3.22). Although their responsibilities are defined in legal texts, thereis considerable duplication in these documents. A "de facto" division ofresponsibilities permits the subsector to operate without majordifficulties. However, lack of clear distinction of responsibilitiesrestricts coordination between the ministries and leaves gaps in theexercise of supervisory functions.

- vi -
18. A comprehensive institutional study has been recommended forthe subsector to confirm the proper roles of the DGH, MEHR, MPBP and MPEand develop recommendations to strengthen them in these roles. Theprincipal tasks to be undertaken in the study are: (a) fully assess theeffectiveness of each institution in its current "de facto" roles; (b)make a thorough accounting of major operational and supervisory responsi-bilities which are not exercised or poorly executed under the currentsystem; (c) evaluate the capabilities and resources of the variousinstitutions relative to (a) and (b); (d) identify appropriate divisionsof responsibilities and modify legal texts accordingly; and (e) determinenew staffing, training, and resource requirements where needed anddevelop a plan to implement proposed changes (para. 3.22).
Product Pricing
19. Under the current system, ex-refinery prices are set by theMFBP. The price is based on the NPBP's assessed value of crude oil plusa margin calculated to both cover SOGARA's costs and provide a smallprofit (para. 3.24-3.251 3.28). The price at which SOGARA actuallypurchases the crude, the official price of the Organisation of PetroleumExporting Countries (OPEC) at the time of pumping, can differsubstantially from the MFBP assessed value (para. 3.26). That final ex-refinery prices are substantially higher than import parity indicatesthat local refining might not be the most economic source of petroleumproduct supply. In fact, the cost-plus system of determining ex-refineryprices offers little incentive to reduce costs (para. 3.29-3.30;Table 3.5). In ordcr to encourage a more economic supply of productsthrough local refining, the Government should return to import paritypricing (as was the case prior to 1981) as the basis for ex-refineryprices (para. 3.31).
20. The MPBP sets prices at the retail level, also. Prices arecalculated according to a complex structure which includes the ex-refinery price, transport costs, distributors' renumeration, financialcosts, retail margins, and various taxes and subsidies (para. 3.33-3.38). The structure should be simplified to five major cost components(para. 3.43). Adjustments made to retail prices in April 1986 reflectthe lower cost of crude oil and changes to fiscal policy (para. 3.39-3.40). The mission recommends that, as a first phase, the retail priceof gas oil be increased (possibly by applying a larger "taxecomplementaire") so that all retail prices more closely approximate theirrelative economic costs (para. 3.41-3.42). The advantage of thatsolution is also its fiscal implications.
21. In the second phase, all the mechanisms for pricing petroleumproducts from the refinery to the final customer are in need of review.Price adjustments are infrequent, and it does not appear that regularconsultations are held with all relevant parties to ensure that pricesreflect economic costs (para. 3.25-3.27; 3.34). The reforms to thepricing system should be precisely defined within the context of arefining and product pricing srudy, which would include three main

- vii -
components: (a) the examination of the systems and the costs ofsupplying crude oil and petroleum products to the country; (b) adiagnostic evaluation of refinery operations and a management audit ofSOCARA; and (c) a review of the product dis'cribution strategy and of thepricing system (para. 3.31). Institutional arrangements for productpricing should be consistent with the recommendations of the subsectorinstitutional study (para. 18).
Priority Electricity Subsector Issues
8lectricity Demand Forecasts
22. In 1984, Societ6 d'Energie et d'Eau du Gabon (SEG) calculateda detailed long-term forecast of electricity consumption throughout thesystem (Annex 16), upon which it based its long-term development plan(para. 24). The forecasts were revised in early 1986 to reflect moremoderate growth after the oil price decline (para. 4.17-4.18;Table 4.3). The mission felt that neither forecast was adequate forinput to the long-term system development plan, however, as they werecalculated using demand trend assessment methods (para. 4.19). Thus, itwas recommended that BEEG revise its demand forecasts (particularly thosefor low voltage consumption) according to a more appropriate methodology,to include: (a) a disaggregated market survey of each major class ofconsumer (in addition to surveys of large industrial individualconsumers) for each of the subsystems; and (b) a macroeconomicconsistency check, based on the most recent macroeconomic projections tobe provided by the MPE. A new scenario, which predicts a recession inthe electricity subsector, was constructed in early 1987, using asynthetic analytic approach (para. 4.20). These forecasts should be usedto define the least-cost long-term development plan (para. 4.27).
Medium-Term System Development to 1995
23. The revised 1987 forecasts for electricity demand confirm theconclusion that the existing generating capacity in the three large loadcenters (Libreville, Port-Gentil, and Franceville) will be sufficient tomeet demand until t.he early 1990s (para. 4.21). A complementary 12 MSgas turbine could prove necessary in Franceville after 1992 to decreasethe risks of shortages in dry years. The final decision should be madein 1988-1989 (para. 4.22). Previous plans for installation of gasturbines at Port-Gentil in 1992-1994 (para. 4.23) should be reviewed,once a scenario including the Libreville-Port-Gentil interconnection(para. 4.28-4.29) is re-evaluated. No new generating capacity will beneeded for either of these subsystems before 1996, in any case.
24. In early 1986, SEEC reduced its original development programfor the isolated centers (DER) from 24 to 15 target load centers(para. 4.23). After decreasing the scope of the planned program oncemore, the Government finalized the conditions for executing the

- viii -
readjusted program in 1987, with financing provided by the Canadians.The Government is still negotiating with the French Government forequipment for centers not included in the Canadian program. 8130 shouldsubject each project remaining in the development program to a fulleconomic and financial analysis so that they can be prioritised and theprogram continued according to an extended schedule (para. 4.25).
Long-Term System Development
25. The interconnection of the Libreville-Port-Gentil subsystemswas the principal element of the initial long-term development planformulated by SEEG in 1984. The interconnection was to be put in servicein 1990-1991, and would have been followed by the installation of two 21KW gas turbines at Port-Gentil. The third element of the plan includeddevelopment of a hydroelectric site near Libreville, to be commissionedin the mid-1990s (para. 4.28-4.30). The plan was revised in 1987 to takeinto account SBEG's new demand forecasts and uncertainties concerning theavailability of natural gas and financial resources. The revisedstrategy consists of separate development of the LBV and the POG networks(para. 4.23; 4.27).
26. SERG should begin imediately to examine again its long-termdevelopment plan. New scenarios will have to be evaluated under revisedassumptions for key parameters, including: (a) demand forecasts andanticipated consumption growth rates (para. 22); (b) projectedconsumption of natural gas, natural gas availability and natural gasprices; (c) trends in fuel prices; and (d) discount rates. Complementarysoil investigations for potential hydro sites should be completedimmediately so that full information will be available for taking adecision regarding the first major investment by late 1989. This date iscrucial, as the lead times are six years for the hydroelectric optionsand four years for the interconnection. If the interconnection is foundto still be the optimal first stage in the development plan, constructionshould begin in 1992, but no later than 1994 (para. 4.31).
27. The timing for deciding on the appropriate sequence for systemdevelopment is less crucial for the other subsystems. In Franceville, adecision concerning the timing of new hydroelectric capacity, possibly in1996 or 1997, will be needed by 1992 (para. 4132). The projected econo-mic conditions up to mid-1995 should constrain any return to full-scaledevelopment of DIR until 1996, as investments required in other sub-systems will take priority over these. The Government should take advan-tage of the period of slowed development to: (a) clearly define itsdevelopment strategy for the DER; (b) re-assess the energy needs in tar-geted load centers; (c) identify economic interim solutions; and (d) seekalternatives for financing these solutions (para. 4.33).
Other Issues
28. Tariffs. The 8ERG undertook a detailed tariff study in 1984 tocomplement itsinvestment plans. The proposed tariffs are based on the

- ix -
long-run marginal costs of supply (under the old development plan), sub-ject to the constraints of: (a) public service policies, much as geogra-phic cross-subsidies; and (b) revenue generation requirements, to ensurea sufficient gross margin to support the financing of future invest-ments. The study appears to be methodologically sound (para. 4.39). Thetariffs will have to be updated to incorporates (a) the re-optimizedsystem development plans and (b) modifications to the load curve andconsumption patterns envisaged following the economic slowdown and duringthe recovery period (para. 4.42). In the interim, the proposed tariffstructure should be implemented, although tariff levels will need to beadjusted after the study has been updated.
29. Public Service Reform. The MERR has considered a proposal toreform the public service arrangements for electricity and water. Underthis reform, SEEG would be converted from a parastatal enterprise(Government share: 63X) to a completely public enterprise. Uponconversion, all buildings and equipment owned or used by SEEG wouldbecome state property, and SEEG's only retained responsibility would bemanaging system operations (para. 4.44-4.45). The mission identifiedseveral disadvantages to this proposal (para. 4.46), and recommends thatprivate shareholders remain active in SEEG ownership in the short term(para. 4.47). Investment by other entities or individuals should also beencouraged. If some private participation in ownership is maintained,preferential tariffs for large consumers who are also shareholders shouldbe reviewed; instead, shareholders should be the beneficiaries of anyprofit realized from 888G operations (para. 4.47). In the interim, allproposals for reforming or restructuring the subsector should bereviewed, preferably within the contest of an in-depth examination ofSEEG's financial situation and a management audit of the electricitysubsector.
30. Financial Status. Like many parastatal enterprises indeveloping countries with a public service mandate, SEEG has a severecash balance problem caused by 4 months arrears and/or non-payments(about FCFA 15 billion in 1985). The structure of the arrears-85X ofoutstanding billings attributable to public sector bodies--is such thateven vigorous collection programs are not sufficient to tackle theproblem (para. 4.49-4.51). A full examination of SEEG's financialsituation and of subsector management should be undertaken immediately,with the ultimate objective being the scope for financial andorganizational restructuring of SEE1 vis-A-vis the Government. Thetransfer of assets, or a debt-to-equity exchange, would clear upGovernment debt and give SEW1 more financial autonomy (para. 4.52). Areview of operating costs may also yield some potential for costreductions (para. 4.53). The company is pursuing all efforts to bringits operating costs under control.

Summary of Priority Recommendations
31. The key recommendations of the previous sections are presentedbelow according to their priority for implementation.
Core Program for Public Investment
32. The following projects should -ieceive absolute priority infuture investment budgets:
(a) investments for butane and reduced storage investments forother petroleum products (Table 3.5): 1.86 million CFAF;
(b) improvements to electricity distribution in Libreville andPranceville (Table 4.5): 6 billion CPA?t and
(c) the first phase of a scaled-down program for developing the DEBsubsystem (Table 4.5)s 4.5 billion CPAP;
33. Investments in transmission at Libreville, including theBissegue substation transformation capacity (2 billion CFAP) and a new225 kV overhead line connecting Kinguele to Libreville (5 billion CFAF)can be deferred to 1990. Further investments in the DER subsystem areanticipated at an annual rate of 1.5 billion CPAP until 1990.
Priority Investigations and Studies
34. The following studies are set for, or should be launched in,1987/1988:
(a) natural gas feasibility study, to be launched immediately(Annex 5): cost to be determined;
(b) least-cost system development plan, including the results ofthe gas utilization study: 1 billion CPAP;
(c) scope for financial restructuring of SIEG, and 8EUG's statusvis-&-vis the Government (para. 4.52): US$150,000 - 40 staffweeks (1985 US$);
(d) revisions to the electricity tariff study (para. 4.42); and
(e) a diagnostic evaluation of refinery operations and managementaudit of SOGARA;
35. The following studies should be scheduled after 1988, to becompleted no later than 19911
(a) comprehensive institutional review of the petroleum subsector(para. 3.22): cost to be determined;

- xi -
(b) second and third phases of petroleum product refining andpricing study (para. 3.31); and
(c) revised development policy and irvestment plans for DWR(para. 4.33): cost to be determined;
36. Further surveys of household energy and non-conventional fuelscould also be carried out during this period, as funding permits.
Institutional and Policy Reforms
37. The following reforms should be implemented immediately, or assoon as the studies upon which they are based are completeds
Petroleum Subsector
(a) the "taxe compl6mertaire" should be applied to gas oil pricesso that all retail prices more closely approximate theirrelative economic costs (para. 3.42);
(b) the terms of reference of in-house experts should bereviewed/revised to ensure proper intensive training ofnational counterparts in monitoring upstream petroleumoperations (para. 2.22);
(c) the retail price structure should be revised to include aboutfive components, rather than the 30-plus components of thecurrent structure (para. 3.43); and
(d) ex-refinery prices shQuld be established on the basis of importparity (para. 3.31).
Electricity Subsector
(e) private shareholders should remain active in SEEG ownership,and preferential tariffs should be eliminated. All proposalsfor institutional restructuring should be reviewed, following afull examination of subsector finances and management; and
General
(f) revision of legal texts following petroleum subsectorinstitutional review to eliminate duplication/ambiguities andfill in the gaps.
Manpower Planning and Training
38. In addition to training requirements identified in thereconmended studies, the following activities should be launched as soon

- ,ii -
as possible:
(a) an intensive training program in the DGU, supervised by foreigpexpertg already in-house, to develop the DCH's capacity tomonitor petroleum operations, and usefully utilize annualaccounting audits submitted to the DGH by operating oilcompanies (para. 2.23-2.26);
(b) technical assistance and training to the DCE for (i) collectionof energy data, (ii) analysis of energy/economy links, and(iii) constructing and maintaining national energy balances;
(c) after 1992, technical assistance and training to the DCE forthe consolidation of energy demand projections, and theelaboration of detailed five-year plans for energy demand andsupply.

I. TIIFN8GY SE1CTOI III GAl
Overview
1.1 The Gabonese Republic (Gabon) lies astride the equator alog800 km of the west African coast. The country extends over 267,000 km',three quarters of which is covered by tropical rain forests. The Ogoou6River and its tributaries traditionally have provided the majortransportation link to the interior.
1.2 Estimates place the total population of Gabon at aboutone million in 1985, including Europeans and non-Gabonese Africans. Worethan half of the population is estimated to live in urban areas. Theurban population growth rate is twice that of the total population(2.32/yr). By contrast, rural population growth is only O.9S/yr, due tothe relatively high pace of rural-to-urban migration (1.31/yr).
The Econoum
1.3 Since independence in 1960, economic giowth in Gabon has beenheavily dependent on the output of its extractive industries: petroleum,msanganese, uranium, and forestry. Forestry and mining, exclusive ofpetroleum, were the mainstays of the Gabonese ecowomy in the early 1970s(301 of GDP). By 1984, these two sectors accounted for only 4.31 ofCDP. Petroleum, on the other hand, represented 451 of GDP and 661 oftotal government revenues.
1.4 Agriculture's share of CDP has remained relatively constant ataround 4.51 for the past decade. Manufacturing and constructionrepresented 13.3Z of GDP in 1985, and public administration and taxesanother 151. The contribution of other sectors include 7.61 for non-government services, 6.61 for trade, and 3.81 for transport.
1.5 Petroleum output emerged in the early 1970s as the majordeterminant of Gabon's GDP. Economic development became highly dependenton the evolution of international petroleum markets. This linkage isevident in the three distinct periods of economic growth between 1970 and1983. From 1970 to 1976, the economy expanded rapidly (14.1X/yr onaverage) in conjunction with the increase in both oil production andinternational oil prices. Then in 1976-1979, heavy external borrowing tosupport an ambitious public investment program, coupled with stagnatingoil revenues contributed to an external debt and liquidity crisis.Consequently, the economy experienced a sharp contraction as real GDPfell by an annual rate of -12.61. In 1979, an IMF stabilization programwas adopted to diversify the economic structure, create conditions fornon-inflationary growth and reduce external debt. Its efficacy wasenhanced by the second international oil price increase. The otherwise

-2-
spectacular econome recovery which resulted during the period 1980-1984was sharply undercut by high rates of inflation. Although the economyexhibited strong growth in current terms (16.13Z/yr), annual real growthaveraged only 1.542.
Initial Impact of the Oil Price Decline
1.6 The economy grew sluggish in early 1985 and then was es 'kenconsiderably by the sharp drop in international oil prices at the et ofthat year. Oil production declined slightly (-1.21) and the apprecia"ionof the CFAP vis-&-vis the U.S. dollar failed to keep pace with therapidly decreasing dollar price per barrel. As a result, oil revenuesdeclined by more than 102. There was no accompanying moderation ofdomestic investment and consumption, which in fact grew by 17.3Z and6.92, respectively. As a consequence, GDP registered its first negativereal growth in a number of years (-2.52). The full impact on theGabonese economy will be felt in early 1987, when GDP is expected to dropto almost half its 1985 level. I/ Oil revenues are expected to dropfrom 632 to 231 of total government revepues, causing the budget to alsobe halved and bringing about the curtailment of government expendituresand all-but-essential investments.
1.7 Short-term projections of economic growth indicate a very slowrecovery. The most conservative hypothesis assumes that oil prices willrise very slowly to only $16/bbl in 1990. This hypothesis has alreadybeen surpassed, oil prices having rebound to $20/bbl by mid-1987. Shouldprices continue at this level, government oil revenues- could reach over200 billion CFAP (constant 1985 prices) in 1990. This is still onlyabout SS of its 1985 level. Real GDP will grow only marginally, aot toregain previous levels until well into the 19909.
8nergy Resources
1.8 Gabon has a number of indigenous energy resources, includingpetroleum, natural gas, hydroelectricity, wood, uranium and solar. Onlypart of potentially exploitable resources have been developed for energyuse, both for domestic consumption and for export. To date, the Gabonesehave been quite prudent in developing their energy resources. As aresult, the country largely is self-sufficient in energy, with theexception of some petroleum product imports.
1/ This one year delay occurs because petroleum sector revenues in anygiven year are accrued by the Government in the following year.

-3-
1.9 In 1987, Cabon's proven petroleum reserves amounted to133.4 million tons (961 million bbls). This quantity reflected theincrease in reserves following new discoveries in 1986 and 1987(para. 2.10-2.11).
1.10 Natural gas pro 4uction in association with petroleum wasestimated at 2.0 billion Mm in 1985. Only a raction of this productionis consumed for electricity generation and petroleum production and therest is flared. Official estimates place total proven reserves, between40 and 45 billion Nm . Most of these reserves are associated, althoughthere have been minor non-associated discoveries. Economic recovery ofnatural gas on a large-scale basis poses a number of difficulties, as thegas in found in numerous offshore reservoirs scattered along 400 km ofcoastline. This situation has improved recently, thanks to Shell'sdiscovery of additional gas reserves. Shell is proposing a conservationpolicy (reinjection) in the development plans submitted to theGovernment.
1.11 The total exploitable potential of Gabon's hydraulic resourceshas been estimated at 50,000 GWh/yr. Slightly more than 1X of thispotential is developed; annual hydroelectric production in 1985 was668 CUh. This quantity accounts for just under 80% of total electricitygeneration in the country. Total installed hydroelectric capacity nowstands at 161 MV (para. 4.3; Table 4.1).
1.12 Over 22 million ha, 801 of the Gabonese territory, is coveredby rain forests. Approximately 8 million ha if forest cover is exploitedfor an annual production of 1.5 million m of industrial wood. Anestimated 3 million ml (720 ktoe) of unutilized wood wastes is generatedannually as a by-product of forestry operations and wood processingindustries.
1.13 As there is a relative abundance of economic energy resources,low priority has been given to exploiting the potential for nuclear andsolar energy. Gabon has the capacity to produce up to 1,500 tons/yr ofyellow cake uranium. Produciion in 1985 was only 900 tons, and isexpected to decrease to 700 tons in the next few years as a result of theinternational economic slowdown. Authorities at one time consideredusing this potential for producing electricity, but the utilization ofnuclear energy remains limited to small technological applications. Thecountry's high degree of insolation would make it an ideal candidate forsolar applications, especially in remote rural areas. To date, there hasbeen only minor research to adapt current solar technologies to localneeds and conditions.

-4-
Snergy Consumption
1.14 Total energy consumption in Gabon is difficult to estimatebecause of the total lack of information on consumption patterns offuelvood, charcoal, and other non-commercial fuels. Rough estimatesplace the per capita consumption of coimercial energy marketed in Gabon(petroleum products, natural gas, and electricity) at 600 ktoe in 1983.If use of natural gas and crude oil in petroleum production is included,this figure increases to over 870 ktoe. 2/ By contrast, the commercialenergy consumption in Cbte d'lvoire is only 170 ktoe, and in the Congo,it is 150 ktoe. This is exceptionally high for sub-Saharan Africa andindicative of Gabon's relative prosperity. With the addition of fuelwoodconsumption among the rural populace, total energy consumption per capitais almost 990 kgoe, according to mission estimates.
1.15 The historic consumption of commercial energy is presented inTable 1.1. Consumption grew at an average annual rate of almost 6.0Xbetween 1978 and 1985, before dropping sharply in the aftermath of theoil price drop. Per capita consumption also displayed steady growth ofS8X/yr. Annual fluctuations in the growth rates during this periodreflect the relative weight of petroleum products, which account for 862of commercial energy consumption. The demand for petroleum products is,in turn, closely linked to the economic situation.
1.16 The 1985 energy balance for Gabon (Table 1.2) shows the currentstructure of energy demand. The consumption of traditional woodfuels bythe rural population has been very conservatively estimated at just over76 ktoe annually; other statistics show a moderate consumption offuelwood by sawmills for industrial heat and electricity generation(24.7 ktoe/yr). When these figures are taken into account, as well asprimary consumption of natural gas and crude oil by the petroleumindustry, the three largest energy consuming sectors are the petroleumindustry (342), households (242), and other industries including mining(202). Transport and public sector/civil works follow, with 12X and 8Xrespectively. 3/ Petroleum products represent 532 of the net domesticconsumption, natural gas 242, fuelwood 122, and electricity only 82.
2/ Since these quantities do not enter the domestic retail market, theyare not usually counted among the Government's domestic consumptionfigures.
3/ Vell over 502 of the energy demand in the public sector/civil workssector is attributable to construction of the Transgabonesorailroad.

1.17 It should be noted that exclusion of natural gas and crude oilconsumption totally changes the ranking of sectors according to energydemand. Households (331), other industry (281), and transport (17X)become the top consumers in this case, with the petroleum industryrelegated to fifth place (8X), just behind public sector/civil works(liz).

Table 1.1: GAON - INDICATORS OF COMERCIAL 0EM6Y COONSUITION1978 - 1986
Idicateor 1978 1979 1980 1981 1982 1983 1984 196S 1966 a/
Total Commerclal EnergyConsumptIon ('000 toe) 350.79 352.93 400.17 437.74 443.77 459.83 489.27 523.29 474.56
Electricity 42.24 45.99 48.72 52.61 57.36 62.69 68.36 74.07 75.08
Petroleum Products 308.55 306.94 351.45 385.12 386.39 397.13 420.89 449.22 399.48
6;Commercial Energy GrowthRate (%/yr) 0.61 13.39 9.39 1.38 3.62 6.40 6.96 -9.31 1
Per Capita Consumption(kgoe) 473.03 465.21 515.62 S51.34 546.38 553.42 575.61 601.80 533.48
Electricity 56.96 60.62 62.77 66.27 70.65 75.45 80.45 85.18 84.40
Petroleum Produets 416.06 404.58 452.85 485.07 475.73 477.96 495.16 516.61 449.08
Growth of Per CapitaConsumption (%/yr) -1.65 10.84 6.93 -0.90 1.29 4.01 4.55 -11.35
Energy Intensity(kgoe per CFAF) b/ 0.29 0.28 0.25 0.28 0.27 0.28 0.29 0.32 0.38
Energy Coefficient c/ 0.12 0.55 49.69 0.44 -2.38 1.44 -2.80 0.38
a/ Preliminary estimates.b/ GMR In 1985 CFAF.c/ Ratio of GOP growth to growth of commercial energy.
Sources Mission estimates, WIP, MEP.

Table 1.2t cam0l c BaLICE. 1965
(000 TMO)
Primary Bner Pagoleo
Uatural Crad Ilctetl- Gao- Karo- Jot Ca Fuel Tot. Pet.Fuelgod Ga" Hfdro Oil clity 1II a Ful on 0t1 AOlal LPG Other Produts TOAU.
Gauss SupplyProduato. 821.20 1,382.40 166.90 8,626.00 10,996.50reports 13.U5 10.75 1.80 26.38 26.38PrImary Zapasts (7,984.79) (7,984.9)Priary Cons. bi (207.56) (28.00) (235.56)Unut lied cl (720.00) (1.114.21) (1,834.21)Stock Cbnges di 1.26 1.26
Tot. Avail. Supply 101.20 60.83 166.90 614.47 13.85 10.75 1.80 26.38 969.77
Beff"fjo (614.47) 63.53 88.07 228.19 15U.92 2.61 7.75 21.46 5"S 52 (18.96) .1Semal GC. (60.83) 16.45 (11.34) (11.U0) (s5.n) *1Hydro Cen. (166.90) 57.41 (109.49) ofAunoproductiom f 0.20 (0.99) (0.99) (0.79) ofTrans. and Dist.
Loses g/ (8.97) (b.97) ofStock Chsnes hi 2.96 (2.80) 14.49 i5.98 0.00 (0.10) 40.51 40.31
Net Supply 101.20 65.09 66.47 99.12 241.09 209.90 2.61 9.45 21.46 650.09 816.57 _---------------------- ----- ---------------- --------- -
Secondary mports (1.17) (1.06) (124.35) (0.75) (15.97) (143.30) (143.30)Bunker Sales (5.55) (48.63) ($3.96) (53.96)
…………---- - --------- ---- ---- ---- --- ……--- -- --------- - -
net Dmestlc Cmen. 101.20 65.09 65.50 15." 83.13 234.70 56.92 1.86 9.43 5.49 452.82 619.11HouseholdlCm 76.50 24.g9 59.42 10.87 30.51 100.81 202.50Transprt 0.12 83.13 17.84 1.86 103.55 103.55Petrolems End. 0.26 51.63 51.90 51.90Other Industry 24.70 34.89 2.55 0.80 55.8s 36.92 9.43 5.49 11.98 171.57Agriculture 0.39 18.07 18.46 18.46Publiclcivil IIo*a 5.21 1.96 4.32 59.85 66.12 n.33
*J 3ydraalaettic supply oc _erted oen a thermal replasemet b is, asuaLag 34.41 efflioscy.bi Couuption of natural ga reinjected for petrlam productoin, and cGude oil ud is ref inin.
Although consuad on natLonal territory, tbea quantities to not reach the domastic market.cl For fuelvood, quntties of wood wastes generated aally which go utilised, but could be tapped as a potential eneg resoure.
For natul gS", quantitles of gS asiated with annual petrolai production which currently are flard, but potentially -uldbe tapped in part for consption.
dl Additions to (negative) or wlthdrawal. from (positive) SOGAR stocks.*I ConersLxo lo0ses asolated with tramfrxstio frm primary to secondary nergy.fl Purases frm Sh1LL-1anbe for tbe national grid.g/ Differsece bet Swe8 net productin and SM sales.hi Additions to (negative) or withdrawals from (positlve) distributio stooks.il Assumes ru&al population comes an average 200 kgoeicapitalyr. stimate sbold be vy low, given the high oisrture eontnt of wood.
Source: mission estimtes, SW, DGB, Sogera, MB.

II. Wn5l"SluSDo IA3ATRIOC AND D slOw'HUET
Background
2.1 The medium-term evolution of Gabon's economy will dependprimarily upon the evolutiwn of oil prices, the prospects for continuedinvestment in the oil sector, and the exploitation pattern of recentlydiscovered oil deposits. This heavy reliance of the economy on oilactivities underscores the key issues facing the sector:
(a) the optimum petroleum production profile which will ensure themaximization of the present value of remaining reserves;
(b) the level at which investments should be maintained in bothexploration and development activities to offset declining oilproduction and expand the hydrocarbon reserve Uase; ond
(c) the modifications needed to the fiscal and legal frameworkgoverning the activities of the petroleum copanies in Gabon toencourage new investment.
Geology of the Region
2.2 Gabon's sedimentary basins cover a total area of 200 000 km2,which is divided between a small eastern basin (45,000 km) and acoastal/offshore basin (155,000 ki2). The coastal/of shore basin isfurther subdivided into a continental shelf (3,500 tm) with a waterdepth of le'ls than 200 m and a deep water (200-300 m) offshore area(120,000 kmn). The continental shelf contains all known commercialhydrocarbon accumulations.
2.3 The sedimentary basins consist of sequential layers rangingfrom mesozone to recent (predominantly shale/sand) formations, with somecarbonate intervals and a thick evaporate section. Reservoirs have beenfound at depths of 1,000-3,000 m and are mainly constituted by sands andsandstones of various ages and origins. The majority of hydrocarbonbearing traps in Gabon are salt-induced structures, although pre-saltreservoirs are generally tied to basement controlled structures.

-9-
Exploration and Production History
Past Activities
2.4 intermittent oil exploration began in 1928, but the firstdiscovery was not made until 1956 by the SociUt6 des Petroles del'Afrique Equatoriale (SPAPE), an affiliate of the French Elf Group.Output from the three 'newly discovered fields (Osouri, Pointe Clairette,and Port-Gentil) averaged 3,500 barrels per day (b/d) in 1957, equivalentto an annual rate of 177,000 tons. In 1959, Mobil and Shell joinedSPAPE, nq, known as Elf-Gabon, in a series of joint ventures in a25,000 bm area extending south to the Congo. As a result of theseefforts, 16 new fields had been discovered and brought on stream by 1964,pushing production to 20,000 b/d (1 million tons/yr).
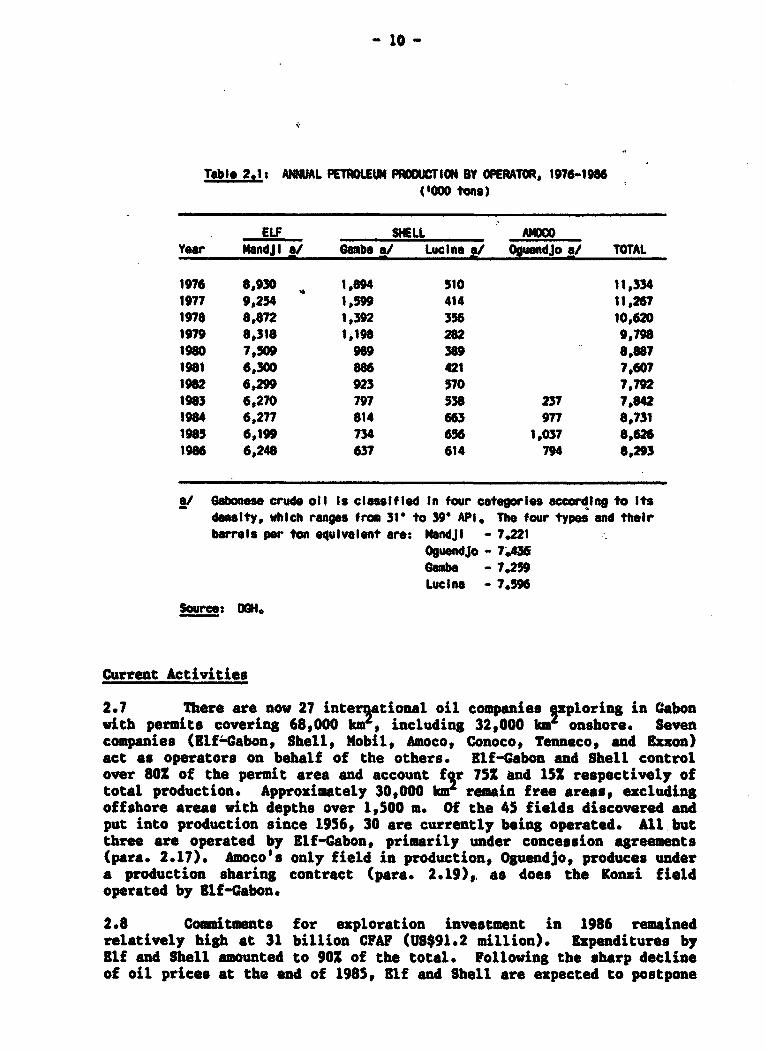
2.5 From 1965 to 1969, exploration slowed perceptibly as the oilcompanies concentrated their investments in development. Annualproduction increased five-fold during this period. Renewed explorationfrom 1970 to 1977 led to 15 new discoveties. Annual production soared toover 11 million tons in 1974, where it remained for over three yearsbefore declining. Output dropped below 8 million tons/yr in the early1980s, but since has been maintained above that threshold as new fieldshave been put into production. Table 2.1 shows the evolution ofproduction since 1976.
2.6 The high prospectivity of Gabon's sedimentary basin, coupledwith progressive Government policies in the oil sector, encouragedsubstantial exploration activity during the past decade. Investmentexpenditures for research and exploration were particularly large between1979 and 1982 (Annex 2), primarily due to the attractive terms offered inproduction contracts for that period. By the end of 1983, more than205,000 km of seismic lines were recorded and about 411 wildcat wells hadbeen drilled, totalling more than 925,000 m (Annex 3). The addition oftwo new discoveries brought into production at that time raised theestimate of remaining proven reserves to 467 million bbl (65 milliontons).
- 10o-
Table 2.1s ANNUAL PETROLEUM PRDOUCTION BY OPERATOR, 1976-1986('000 tons)
ELF SHELL AMOCOYear MandJI a/ camb" a/ Lucius I/ OguendJo a/ TOTAL
1976 8,930 1,894 510 11,3341977 9,254 1,5"9 414 11,2671978 8,872 1,392 356 10,6201979 8,318 1,196 282 9,7961980 7,509 989 389 8,8871981 6,300 886 421 7,6071982 6,299 923 570 7,7921963 6,270 797 538 237 7,8421984 6,277 814 663 977 8,7311085 6,199 734 656 1,037 8,6261966 6,248 637 614 794 8,293
a/ Sabonese crude oIl Is clessifled In four cotegorles according to Itsdensity, which ranges from 31t to 39 API. The four types and theirbarrels per ton equIvalent are: MandjI - 7.221
Oguendjo - 7.45Samba - 7,259Lucina - 7,596
Source: DONG
Current Activities
2.7 There are now 27 interjational oil companies 2xploring in Gabonwith permits covering 68,000 km', including 32,000 kmf onshore. Sevencompanies (Elf4Cabon, Shell, Mobil, Amoco, Conoco, Tenneco, and Exxon)act as operators on behalf of the others. Elf-Gabon and Shell controlover 801 of the permit area and account f5r 75X and 152 respectively oftotal production. Approximately 30,000 km remain free areas, excludingoffshore areas with depths over 1,500 a. Of the 45 fields discovered andput into production since 1956, 30 are currently being operated. All butthree are operated by Elf-Gabon, primarily under concession agreements(para. 2.17). Amoco's only field in production, Oguendjo, produces undera production sharing contract (para. 2.19), as does the Konsi fieldoperated by Elf-Gabon.
2.8 Commitments for exploration investment in 1986 remainedrelatively high at 31 billion CFAF (US$91.2 million). Expenditures byElf and Shell amounted to 90X of the total. Following the sharp declineof oil prices at the end of 1985, Elf and Shell are expected to postpone

- 11 -
some exploration expenditures and concentrate on developing their newdiscoveries (para. 2.10-2.12). Exploration investments in 1987 and 1988are expected to be around US$120 million and US$150 million respectively,approximately half of which will be by smaller operators who have onlyrecently begun prospecting in Cabon (Conoco, Agip, Tenneco and Sunoco)*Companies, especially those who have recently signed production sharingcontracts, have presented a very encouraging work program to theGovernment.
Future Petroleum Production Prospects
Development of Proven Reserves
2.9 Most fields currently in production have been fully developedand now are undergoing a natural decline in output. As a result, totalannual production is expected to drop below 8 million tons in 1987. Theanticipated addition to output from fields to be brought into productionby Tenneco and Amoco during 1987 and 1988 will be sufficient to sustaintotal production at this level (Table 2.2).
Tuble 2.2: PROJECTED ANNUAL OUTPUT OF FIELDS CURIENTLY IN PROOUCTION('000 tons)
Operotors 1986 1987 1988 1989 1990 1991 1992(actual)
Elf-Gabon 6.248 5,836 5,450 5,183 4,709 4,521 3,907SholI 1,251 1,157 958 795 659 546 455Amoco 794 682 922 719 562 440 344Tenneco a/ 169 707 749 5 78 224Total 8,293 7,846 8,037 7,446 6,485 5,893 4,930
nJ Developmsnt expenditures already toultted to bring three sualIfields Into productlon In the second half of 1987. Peak productlonanticipated In 1989.
Source: G, mission estimates.
2.10 The Rabi field, discovered by Shell in August 1985, constitutesa crucial element to sustaining short- to medium-term production levels.Vith recoverable reserves estimated at about 374 million barrels,299 million proven, Rabi is the largest discovery ever made in Gabon. Itis located onshore in the northern section of the Sette Cama block of theOgoou6 exploration permit, which is operated by Shell (42.5X) inassociation with Elf-Gabon (25.51), the Societe Vationale Elf-Aquitaine

- 12 -
(513*) (171) and the State (1S5). The southern section of the Rabi fieldis well defined and conceivably could be put into production two yearsafter a decision is made to invest in production facilities andinfrastructure. Negotiations with the Government have advancedsufficiently for production to begin by early 1989. The northernextension to the field has been confirmed and wilt require furtherdevelopment expenditures. Total costs for developing Aabi, 4/ includingdrilling, infrastructure, pipelines and modifications to Shell's Gambaterminal for evacuating the crude, were estimated at U8495 million inJune 1987. These investments would be phased over a six year period.
2.11 Shell's proposal for phased development of Rabi would start inthe southern section, with approximately 25 wells producing in successivephases 20,000 b/d, 60,000 b/d, and 80,000 b/d. The production levelwould build rapidly to a plateau of 10Q,000 b/d (4 million tons/yr) bythe first quarter of 1990 through the Gevelopment of other wells, for atotal of 58. The plateau could be maintained for approzimately fouryears.
2.12 Two other fields which could be developed are the Rousettefield and the Coucal field, operated by Elf-Cabon. Development of thesefields could be deferred if Blf-Cabon chooses not to support developmentinvestments for this field simulttAneously with its participation in theRabi development.
Oil Production Scenarios
2.13 The mission's estimates for future oil production are presentedin Table 2.3. The scenario assumes that Rabi and Coucal will bedeveloped and brought into production. It should be stressed that theprojections in Table 2.3 are merely indicative. They do not include thepossibility that new fields other than Rabi and Coucal could be developedand brought into production. Seventy-five to 114 exploration wells areexpected to be drilled between 1987 and 1991, and some of these arelikely to yield successful results. I 0
2.14 The mission has taken a conservative position in itsprojections to emphasize the importance of Rabi's output for the short-to medium-term. It cannot be automatically assoumed that maintainingproduction above the 8 million tons/yr threshold will prove to be thebest strategy for maximizing the present value of all production from thenew discoveriest current and future. Still, it is essential to therecovery of the Gabonese economy that high levels of production bemaintained. In order to meet both of these objectives, the Government'smedium-term strategy should consist principally of providing the properenvironment for encouraging ezploration and development, especially
4/ The project financing would include a government participation inaddition to investments by Shell, Elf-Gabon and 511A.

- 13 -
during periods of oil price uncertainty. The implications of this roleare discussed in the following section.
2.15 In the short term, the mission recommends that a profile ofoptimum petroleum production for Gabon be developed, based on oil priceprojections and estimates of remaining reserves, in order to maximize thepresent value of the country's petroleum reserves. This profile willserve as the principal slement in long-term planning of the nationaleconomy (by providing projections of petroleum revenues), and should beupdated regularly.
Table 2.3: PRJEC1I0 OIL PRCOUCTION, 1987-1992('000 tons)
ELF SHELLPresent Prsent
Year Fields Ooucal Fields Robi AMO TENECO Total
1987 5,836 1,157 682 169 7,8461988 5,450 958 922 707 8,0371989 5,1S3 795 1,060 719 749 8,5261990 4,709 659 3,712 562. 555 10,1971991 4,527 1,247 548 3,712 440 378 10,8521992 3,907 1,995 45S 3,953 344 224 10,878
Soure: 0OH, Oil companIes, mission estimlates.
Legal and Fiscal Framework
2.16 Two types of petroleum exploration and production contractscurrently are used in Gabon. Under the first type, the concessioncontract, oil companies are granted the exploration and exploitationrights to a particular concession for a certain period. The maximumperiod is five years for exploration, three-times renewable in blocks ofup to five years. Sxploitati9n rights are granted for 75 year periods,renewable in blocks of 25 years. Four companies operate under this typqof contracj, including Elf-Gabon and Shell. Approximately 29,500 km'(22,000 km' onshore) of the area currently under exploration is governedby concessionary agreements, most of which are due to expire in mid-1991.
2.17 The Government and the oil companies sign a "conventiond'6tablissement" (establishment agreement) governing the administrative,legal, fiscal and technical scope of company activities. As an OPECcountry, Gabon normally employs the fiscal provisions recommended by theorganization. The Government receives an after-tax profit equivalent to

- 14 -
its share in the capital of every producing company that operates under aconcessionary agreement. This share can reach 252 and can be taken inkind.
2.18 In line with a new policy, the Government signed its firstproduction-sharing contract in March 1977; pro-existing concessionaryagreements remained in force. Under these new agreements, the companyhas a "work and financial obligation" for exploration, valid for amaximum period of five years. Exploration risk is assumed entirely bythe oil company; exploration costo are reimbursed only it there is acomercial discovery. Companies recover their costs by taking up to 40Xor 50Z of production ("cost oil"), while the remaining 501 to 601("profit oil") is split between the Government and the company on asliding scale basis linked to field output. The company pays no taxesand is free to export its production share with minimal restriction. SIThe company's financial situation is audited each year by independentaccountants hired by the Government.
2.19 The Government initially awarded eight areas under production-sharing contracts to Elf-Gabon and several newly-created associations.Of the three discoveries made to date in these areas, two are currentlyin production (Konsi for Elf and Oguendjo operated by Amoco on behalf ofa consortium). A third, Obando marin (operated by Tenneco on bUhalf of aconsortium) came on-stream September 3, 1987t. Production-sharingcontracts account for about 26S of the total areas covered by explorationpermits and licenses, and about 151 of annual oil production.
2.20 Although existing permits granted to the oil companies remainvalid, the Government is expected to assume a greater role under the newproduction-sharing agreements. It currently is negotiating with a numberof companies to ensure maximum uniformity and cohesiveness in the fiscalconditions applied under its various contracts. Another round of bidstook place between spring and Vovember 1987.
2.21 The Government should continue to exercise sound judgement innegotiating under the provisions of the new contractual arrangements, andthat it act with the same prudence in its negotiations to ensure that theclimate of confidence, which traditionally has characterized explorationactivity in Gabon, is maintained. Specifically, the Government shouldtake advantage of the expanded role permitted under production sharingcontracts, which it has implemented, to:
(a) improve the monitoring of upstream petroleum activities; and
5/ Companies are required to sell a small fraction of their output tothe local refinery (para. 3.6).

- 1S -
(b) develop relevant fiscal policies which simultaneously (i) serveas incentives for continued exploration efforts byinternational concerns and (ii) optimise the conditions forgovernment take.
2.22 The team currently assigned to moni$or exploration activitieswithin the Directorate General of HydrocarboLa (DGH) is working in thisdirection. The mission recommends that their terms of reference bereviewed and amended to give them official responsibility andaccountability for (a) formulating appropriate policy and (b) identifyingpossible mechanisms for its implementation. The specific provisions tobe included should be determined in the context of the petroleum sub-sector institutional review recommended in Chapter III (para. 3.22). Theinstitutional review should also define the requirements for additionaltraining in this area.
Sector Organization
2.23 The Ministry of Mines & Hydrocarbons (HMM), through the DCI,monitors petroleum exploration and production activity in Gabon, as wellas domestic refining activities. The DCI also negotiates with the oilcompanies and represents the government interest in the companies'executive boards. The DCH's responsibilities are subdivided among threemain functions: technical, financial, and documentation. At the time ofthe mission, the DCI was being restructured with the help of long-termtechnical assistance from international experts. The mission recommendsthat the DCI take advantage of the presence of these internationalexperts to design and implement an intensive training program in ordertot
(a) increase its ability to monitor exploration and developmentactivities; and
(b) more importantly, take full responsibility for developing andmanaging petroleum sector fiscal and investment policies.
2.24 The Covernment created the national oil company Petrogab in1979 in order to coordinate more effectively its interest in thepetroleum sector. Petrogab's statutes were very broad, covering allaspects of hydrocarbon exploration and development, as well as productand crude transport and storage. Until 1983, Petrogab's primary duty wasto market 25S of the government share of Elf-Cabon's production. (Therest was marketed directly by the DCH.) Petrogab also served as anunremunerated intermediary between Elf-Gabon and the SOCARA refinery, forthe invoicing of purchases of crude oil (para. 3.7). This activityseemed to be redundant, as the refinery can be supplied directly by thecompanies.

- 16 -
2.25 Following an agreement between MMH and the oil companies in1983, Petrogab undertook a limited active role in exploration byacquiring a minor share in the Oguendjo and Olende fields. It has alsosecured an exploration permit through Gaborep (40X Petrogab, 601 PerrodoGroup), with work obligation of US$7 million in three years. This permitincludes an area relinquished by Shell (two wells tested, but thediscovery was not considered economical by Shell) and subsequentlyallocated to Gaborep.
2.26 Petrogab's role in the petroleum sub-sector has long beenpoorly defined. It was questionnable even if Petrogab need exercise someof the responsibilities it had been granted in official statutes, giventhat many were already performed quite satisfactorily by the DCH andother petroleum sector institutions (para. 3.18-3.21). Consequently, theGovernment decided in 1987 to liquidate Petrogab, a step which themission approves. The mission recommends that Petrogable formeractivities and responsi"bilities be thoroughly examined and revised withinthe context of an institutional review of the entire petroleum subsector,as defined in para. 3.22, and that the scope of these activities beprecisely attributed to other sub-sector institutions in amendments toofficial statutes.
Potential for Natural Gas Development
2.27 The Government has been investigating gas utilization since1968, when it formed its Gas Committee ("comite gas") (para. 2.19).There have been a number of limited studies since then to ascertain themagnitude of reserves and the feasibility of production for certainprojects. One such project was the production of ammonia, studied byPierre-Fite-Auby in 1973 and again by Voest Alpine in 1978; the projectwas scrapped in mid-construction after the latter study did not confirmits economic feasibility. Two important studies were conducted in theearly 1980s, one by Elf-Gabon (1981) and the other by Degolyer andMaciaughton/Sechtel (1984) to determine the feasibility of recovering gasfrom the Torpille (301 of remaining gas reserves) and Anguille fields,extracting the liquids and then storing the gas in the old Lopes Nord oilfield to be used at a later date. Elf-Gabon concluded that the projectwas not economic and that any attempt to exploit gas reserves forcom_ercial use could not be justified economically. Degolyer andNacNaughton/Bechtel, on the other hand, found the project marginallyeconomic at a price of US$1.56/MMBTU, if the gas is used mainly for powergeneeation.
2.28 There are three distinct points of view expressed by theprincipals involved in the development and utilization of natural gas.From the consumer side, the electric companyt SEEG, appears for themoment to be the only major potential user if gas is developed. SEW6would be interested in gas only if it could be delivered at a pricecompetitive with planned hydroelectric developments (para. 4.27-4.30),

- 17 -
and if the supply could be assured over the long term. From the producerside, the oil companies want to be assured that the gas price will covertheir coses of development and exploitation. Many are convinced at thispoint that tbere is no way to economically develop the quantities of gasneeded by 3EEG at prices required for thermal generation to becompetitive with hydroelectric power. The third view is held by thepromoters, who counsel that by use of their exploitation techniques,extracting the gas from certain fields and storing it in empty reservoirsfor later use would be marginally economic.
2.29 The Government has formed a Gas Committee to initiate andreview the studies and proposals for gas development and utilization, andto decide upon gas development priorities. Committee mmbers includerepresentatives from the MMH (both directorates), the Ministry of Energyand Hydraulic Resources (MERO), the Ministry of Planning and Economy(MPE), the Ministry of Pinance, Budget and Participations (MFBP) and thePresidence. The major conclusions drawn by the Committee in earlierdiscussions were that:
(a) The oil companies are not interested in gas development, sincethe price of gas will not cover their exploitation costs. Tomeet S33G's criteria, it is most likely that the "pris decession" would have to be fixed on a political basis, and notby the market.
(b) The results of recent studies are biased by the apparentconflicts of interest of the groups conducting them, and thusthe reliability of their findings is questionable.
(c) Although it would be impossible to develop all availablereserves due to the nature of the reservoirs (par&. 1.10),there are some fields which could be developed economicallyunder certain conditions.
(4) The only viable consumer for the gas is 9S33, which is veryskeptical about plans committing it to develop large, gas-basedthermal generating capacity. The Government would be willingto "encourage" development of marginally economic fields if9330 could guarantee that it would consume the quantitiesproduced.
2.30 In the aftermath of the 1985 oil price drop, natural gasdevelopment was accorded a low priority in national energy planning. Theonly major market identified to date, S33,, totally revised itsinvestment plans to take into account new demand forecasts and limitedavailability of natural gas (para. 4.17-4.19). The discovery of newhydrocarbon reserves call once again for the re-evaluation of gasutilization scenarios. Major reserves of natural gas-an estimated385 billion standard cubic feet (BSCF) of associated and 490 BSCF freegas-in-place- are associated with Shell's Rabi field (para. 2.10-2.12).Shell has already presented the Government with plans to conserve this

- 18 -
gas for future development through a reinjection program(5,150 million CPAP). In addition, Tenneco has mwde proposals fordevelopment of natural gas associated with its Obando Marin field.Approzimately 75 BYSP could be made available to 93KG at an estimatedcost of 12 CFAI'/m (about US(1.5/NBTU), based on jemand projectionssupplied by 833C. S33C currently pays about 24 CPAF/tm for its purchasesof natural gas.
2.31 The availability of competitively priced natural gas insufficient quantities substantially changes the options for medium- andlong-term electricity syutem development in the late 1990s and after.for this reason, the mission recommends that the options -for exploitingand developing natural gas be fulli. determined with minimal delay. Afeasibility study should be undertaken which will include:
(a) an evaluation of reserves using presently available data;
(b) a preliminary assessment of potential conventional markets(power, industrial, , residential and coumercial) andunconventional markets (tr4nsport, agriculture);
(c) an estimate of the investment costs to produce and transmit thegas to the main local markets;
(d) a preliminary analysis of pricing issues with respect to gas;and
(e) recommendations for future action.
The feasibility study would decermine whether it is justifiable toundertake an intensive utilization study aimed at optimization of the useof projected supplies, further analysis and comparison of investment andconversion and consideration of contract provisions (pricing andtaxation) which direct the interest of the Government's commercialpartners in the development of reserves. Detailed Terms of Reference forthe feasibility study are presented in Annex 5.

-19 -
III. SB"]LUI -SUPPLY AIM DizsuBTo
Petroleum Product Demand
3.1 The total domestic 'market for petroleum products in Gabon(1985) amounted to about 464,000 tons (Table 3.1). Gas oil comprisesmore than half of total sales; however, only 11 of total gas oil salesare made through retail outlets while the largest 11 customers accountfor half the sales. Jet fuel is the second most important product interms of sales volume (182); an estimated 572 is consumed by the nationalairline and the air force, with foreign airlines accounting for theremainder. Gasoline, which accounted for about 142 of total sales ispredominantly sold through the 99 petroleum product retail outlets acrossthe country. Fuel oil accounts for only about 82 of sales, and isentirely accounted for by two consumers - Cinents du Gabon (92Z) and theSOBRAGA Brewery (8%). Kerosene and butane, which account for only 22 and31 respectively of sales, are primarily household fuels. Kerosene i8sold through the petroleum companies' retail outlets and by peddlers inoutlying areas, while butane is predominantly an urban middle class-cooking fuel.
Table 3.1: OWESTIC PETRILEUM PRODUCT SALES, 1960-1985 a/('000 tons)
Average AnnualGrowth Rote
Product 1960 1961 1962 1963 1964 1965 1960-196
(in %)
Butane 6.1 6.7 7.3 863 8.9 8.9 7.8Aviation Gasoline 2.9 2.6 2.2 1.7 1.6 I.6 -9.16asollne 51.2 53.5 56.8 61 7 62.2 65.3 5.0Kerosene 9.7 10.0 10.7 12,0 14.7 15.6 10.2Jet Fuel 68.6 75.6 74.8 70.5 78.3 81.5 3.5Gas Oil 176.9 204.3 207.2 215,3 221.6 234.7 5.6Fuel 011 33.7 29.5 24.3 24.5 30.4 38.1 2.5Asphalt 6.8 5.4 8.4 _ 9.9 9.9 8.3 4.1Total 355.9 367.6 391.7 403,9 427.6 454.4 5.0
at Excluding lubricants.
Source: OHM OPP, 1EHR

- 20 -
3.2 The consumption of petroleum products is regionally skewed.Three of the country's nine provinces-Iutuaire (the Libreville region),Haut Ogooue (the upland mining region), and Ogoou6 Maritime (the oilproducing regiov)-accounted for 882 of gasoline consumption, 732 of thegas oil consumption, and 682 of the kerosene consumption. All the fueloil and butane consumption also occurred in these regions.
3.3 Overall petroleum product sales averaged 52 volume growthbetween 1980 and 1985, with growth in 1984-85 amounting to 6.3Z. Thefastest growing fuels have been household energy. fuelo--kerosene andbutane-which averaged 102 and 82 growth respectively over the 1980-85period, but these products still only account for 52 of total sales. Theconsumption of gasoline and gas oil averaged relatively steady growth of5X and 62 per annum respectively. Sales of Jet fuel grew at a somewhatlower rate of 42 per annum over the period., but year-to-year sales havefluctuated considerably, reflecting the tendency of internationalairlines to base their purchases on relative prices vis-a-vis neighboringcountries' airports.
Petroleum Refining
3.4 Gabon's oil refinery, the Soci6t6 Gabonaise de Raffinage(SOGARA), is the principal supplier of finished products to the domesticmarket. SOGARA is structured as a private company with national prioritystatus. The nine shareholders include the Government and variousmarketing companies operating in the country (para. 3.9). 6/ Itsactivities are heavily regulated by the DGH, within the MMB.
3.5 SOGARA's installations were integrated with those of the formerCOG B refinery in 1985, 7/ leaving it with a nominal distillationcapacity of 1.2 million tons annually. Cracking and reforming capacitieslimit its efficient production capacity to 700-75O,OOO tons/yr,however. In 1986, the refinery was operated at about 650,000 tonsthroughput, which sufficed to meet domestic demand for gasoline,kerosene, gas oil, and fuel oil. However, some imbalance remains betweendomestic demand and refinery output. About 100,000 tons of excess fueloil are sold on the international market, as well as occasional batches
6/ Government: 25.002, Elf: 18.752, Total: 18.75Z, Mobil: 11.62, Shell:11.392, Texaco: 5.62, Fina: 3.31, BP: 3.10X and Agips 2.502. TheGovernmnt has the option of increasing Ats share to 51.002.
7/ The Compagnie Gabon Elf de Raffinage (COGER) was owned by theGovernment (302) and Elf Gabon (702) and was operated as an export-oriented refinery from late 1976 until 1985. Part of COGER's1 million ton/yr capacity was leased to SOGARA before theinstallations were merged.
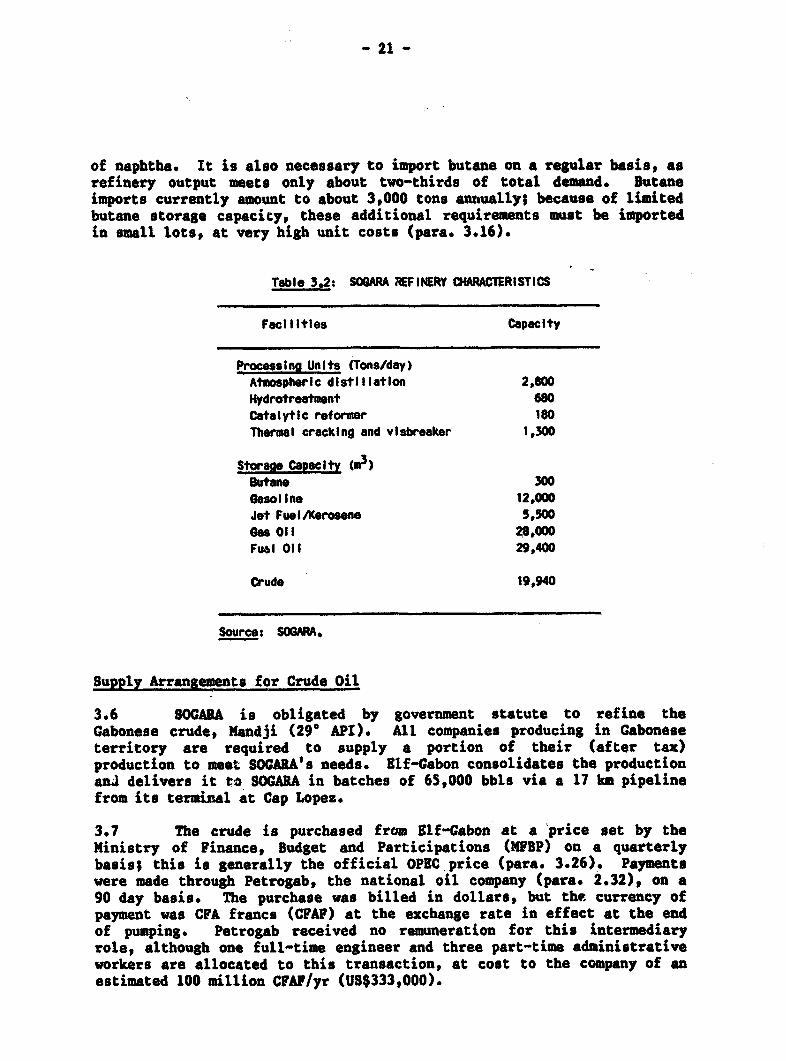
- 21 -
of naphtha. It is also necessary to import butane on a regular basisp asrefinery output meets only about two-thirds of total demand. Butaneimports currently amount to about 3,000 tons annually; because of limitedbutane storage capacity, these additional requirements must be importedin small lots, at very high unit costs (para. 3.16).
Table 3.2: SO¢ARA REFINERY CHARACTERISTICS
Facilities Capacity
Processing Units (Tons/day)Atmospheric distillation 2,800Hydrotreatmoent 680Catalytic reformer 180Thermal cracking and visbreaker 1,300
Storaes Capacity (03)Butane 300asoline 12,000Jet Fuel/Kerosene 5,500Gas Oil 28,000Fuel Oil 29,400
Crude 19,940
Source: SOARM.
Supply Arrangements for Crude Oil
3.6 SOGABA is obligated by government statute to refine theGabonese crude, Mandji (29' API). All companies producing in Gaboneseterritory are required to supply a portion of their (after tax)production to meet SOCARA's needs. Elf-Gabon consolidates the productionan4 delivers it to SOCARA in batches of 65,000 bbls via a 17 km pipelinefrom its terminal at Cap Lopez.
3.7 The crude is purchased from Elf-Gabon at a 'price set by theMinistry of Finance, Budget and Participations (MPBP) on a quarterlybasis; this is generally the official OPEC price (para. 3.26). Paymentswere made through Petrogab, the national oil company (para. 2.32), on a90 day basis. The purchase was billed in dollars, but the currency ofpayment was CFA francs (CPAP) at the exchange rate in effect at the endof pumping. Petrogab received no remuneration for this intermediaryrole, although one full-time engineer and three part-time administrativeworkers are allocated to this transaction, at cost to the company of anestimated 100 million CFAP/yr (US$333,000).

- 22 -
3.8 In view of the fact that Petrogab has been liquidated (para.2.26) direct invoicing by Elf-Gabon could be re-established. Such directarrangements have operated efficiently in the past. The transactioncould be subject to periodic, unannounced audits by the DCH as part ofits monitoring activities throughout the petroleum subsector.
Product Marketing and Distribution
Marketing Arrangements
3.9 Products deatined for the domestic market are delivered tostorage depots outside Port-Centil by the marketing companies and theSociAt& Gabonaise d'Kntreposage des Produits P6troliers (SGBPP). SG8PPis owned Jointly by the marketing companies operating in Gabon in 1986:BP, Agip, Mobil, Totalp Texaco and PIZO. The first five are affiliatesof major international petroleum companies, with the Government holding101 of their stock. PIZO, which because of financial difficulties wasliquidated by the end of 1987, (para. 3.12) was the national marketingcompany. It was owned by the Government (501), Shell (201), Elf (20X)and Agip (10Z) and was created to ensure that all regions oE the countryhave access to petroleum products. PIZO was the market leader in 1985,with 361 of the total inland product sales (Table 3.3).
financial Difficulties for PIZO
3.10 Almost all of the marketing companies service the interior ofthe country to some extent. The burden of supplying these (generally)low-volume demand centers has fallen disproportionately to PIZO becauseof its official mandate to supply the entire territory. Until 1986, PIZOoperated almost half of the retail outlets outside of Libreville andPort-Centil. The figures in Table 3.4 give some indication of PIZO'sretail market share relative to the number of its retail outlets, ascompared with other marketing companies.

- 23 -
Table 3.3:s OVESTIC ARKMET SIARWS OF THE DISThI9EUTION OI"PANIESBY pRODUcT, 198S a/
COWANIESProducts TOTAL MOBIL TEXACO BP PIZD ELF bl Retail Market c/
Oasollne d/ 24.0 18.9 6.9 13.9 36,3 - 91.0Koeosene 24.5 20.1 14.1 19.7 21.6 - 68.0as Oil 29.1 12.7 9*0 - 13*3 35*9 - 13.0Jet Fuel 9.8 30,9 - - 38.7 10.2 -
Fuel 011 20.3 19.5 4*0 14.9 41.3 --
LubrIcants 20.3 36,1 3*9 11.7 28.0 15.0
e/ Excluding sales to International bunkers and airIInes by Elf-Gabon and Shell.b/ Elf does not market ref med products within Gabon, except Jet fuel sold to the
national airline.c/ The prce ntep of products sold on the retail market, as opposed to wholesale or bulk
sales of produets to large customers, e.g. SEEG, Elf-Gabon, Transgabonals, the State.d/ CombIned regular and super.
Source: 6PP, WER, mission estiomtes.
Table 3.4: RETAIL ARKET INDICATORS FOR PETROLEUM PROOUCTS, 1985
TOTAL MOBIL TEXACO BP PIZD
Number of retaiI outlets TotalIbrevIlle nd Porl-GentlI 12 8 5 10 20 55Interior 5 9 7 5 18 44
Total 17 17 12 1S 38 99
Percent of retall sales6asollne a 21.3 20.9 7.4 14.5 35.8Gos oIl 29.3 19.6 9.9 13.9 27.1 b/Lubricants 26.8 41.8 11.5 9.3 10.7
Total Shareof Retail Market 25.8 27.4 9.6 12.6 24.5 cl
I/ Includes regular and super gasollnes./ Many of these sales are through the use of vouchers Issued for use by government
employees or employees of parastatal and public enterprises.cX Note that many of PIZ's sales were to bulk and/or preferentlal customers who do not
purchase products on the retall market.
Source: GPP, WM.

- 24 -
3.11 PIZO also handled most of the public sector market forproducts. Nearly 352 of PIZO's market in 1985 was comprised of thepublic administration and public sector enterprise. The Government didnot pay PIZ0 until at least 180 days after billing, and PI20 found itdifficult to recover the full amount billed even at that stage. Publicsector arrears to PIZO were commonly between nine and twelve months,amounting to a total 4 billion CFAF (US$13.3 million) by the end of1985. As a result, PIZO's average arrears were 120 days, as compared to35-40 days for Total, 38-40 days for Mobil, and 37 days for BP.
3.12 The severity of PIZO's financial difficulties led theGovernment to convene a technical working group in 1986 to address theproblem. The group, which is composed of representatives from the MMH,MUSK, M1P8, M8P and PIZ0, completed its evaluation in early 1987. Itsmain conelusion, based on a preliminary iecoomendation by the mission,was that PIZ0 should be liquidated and its assets sold to a privatecompany. Shell has formed a new marketing company, with the Governmentas a minority shareholder, which has purchased PIZO's assets. Acommittee was appointed to oversee the implementation of theliquidation. The mission recommends that (a) the final liquidation planinclude very clear provisions for the payment and/or cancellation of allor part of PIZO's debts and accounts payable before implementation isbegun; and (b) the Government explore and identify economic interimsolutions to ensure that remote areas are supplied followin; theliquidation of PIZ0 (para. 3.17).
Product Distribution Strategy
3.13 In early 1983, the consulting firm BUICIP (France) assessed thenational requirements for infrastructure investments in storage andtransport of petroleum products at the request of the Government.BEICIP's final recommendations were based on a medium growth hypothesisfor future demand, one of several alternative demand growth scenariosprepared in the report (Annex 7). The minimum investment strategyproposed by BEICIP is split almost evenly between additions to existingstorage capacity (7.5 billion CFAF) and transport investments(8.3 billion CFAF). The volume of the recommended additions to storagewas calculated on the basis of 45 days of consumption.
3.14 In light of the recent economic slowdown, the mission hasadopted a lower growth scenario (BEICIP's "low scenario") for productdemand, and modified BEICIP's proposal accordingly (Annex 8). Themission recommends that Gabon minimize its storage investments byadopting a commercial inventory reserve of less than 45 days. Anadequate reserve level could be 25 days, although the Government maychoose to increase this level, if it is considered inadequate forstrategic reasons.

- 25 -
3.15 The mission believes that a 25 day reserve would be adequatesince Gabon is an oil producer, has a refinery which is located near theoil fields, and has good storage capacity at the refinery. There is alsovery good product supply availability on the West African coast, whichwould present alternative sources of supply. 8/ Adopting a 25 dayreserve inventory, along with the low growth scenario for product demand,would imply total additional investment in product storage through 1992of 22tSOO m. at a cost of 1.5 billion CFAP. This would represept asubstantial potential savings over a 30 day i4ventory (32,000 m at2.1 billion CIA?) or a 45 day inventory (55,200 m? at 3.0 billion CPA?).
3.16 Regardless of the overall inventory level decided upon, thereis a need for major investment in butant storage facilities at Owendo.8UICIP has recommended that two 2,000 ml spheres be installed. Thesewould establish the required reserve inventory and be sufficient tohandle anticipated growth in butane demand, while also permitting asavings of up to 4150/ton due to the ability to purchase butane in moreeconomical volumes. for a demand of 3,000 tons per year, the annualsavings would amount to about $450,000. This would have a significantbeneficial impact on the current deficit in the equalization fund used tosubsidise butane imports (para 3.22). The mission therefore recommendsthat one butane sphere be installed immediately but only if thenvestment can be justified by showing a payback period of less than twoyears. With such justification, the project woulA prove to be the bestshort-term strategy for meeting the current butane demand. In themeantime, an analysis of butane demand growth and the options for meetingthis growth should be undertaken. This analysis could be included as acomponent of the household energy study proposed by the mission; inaddition, it should incorporate the conclusions of the petroleum pricingstudy (para. 3.43-3.44). The need to install a second sphere should beexamined around 1992, depending upon the growth in butane demand. Atimetable for these and the other storage investments is given inTable 3.4 below.
3.17 The BRICIP study also recommended the establishment ofadditional service stations. While the mission supports the need toensure that fuels are supplied to remote areas, it also feels that moreeconomic interim solutions-e.g., using drum supply in conjunction withhand pumps-should be considered.
S/ BRICIP's analysis indicates that additional imports represent a lesscostly alternative to augmenting domestic supplies during supplyinterruptions (due to planned refinery shutdowns, for instance) thandoes additional storage.

- 26 -
Table 3.5: SUGGESlED INVESTIENT PROOSAM 1967-1991(millon CPAF)
1987 1968 1989 1990 1991
TANKAGE
OwendoGasoline 200 200 -
Kerosse/Jot 232 -Gasol I - 200 232
LmbareneOsolIno & Kerosene -- 67Gasol I - - 133
NoandaGasol I - - - 200 -
Jet - 34 -
GUTANEsphere 1,50 - ,600Battles - 150 150 100 100'
ETAIL OUTLETS 20 20 20 20 20Total T1520 602 637 586 1,853
Source: Mission estimates.
Institutional Issues
3.18 The Ministry of Energy and Hydraulic Resources (MEHR), throughits Directorate General of Energy (DGE), is nominally the ministry whichoversees petroleum product marketing and distribution and ensures thedomestic supply of refined products. However, several governentministries intervene te monitor product imports and total supplies, fixprices, and participate in various downstream activities. Although theresponsibilities of the various ministries within the Government aredefined by statutet there is a tendency for them to overlap.
3.19 Legal texts give authority to supervise refinery operations toboth the DCH and the DCB. The DCG is also given authority to supervise"investment, marketing, policy land] prices'p, activities which areequally under the mandate of the MPBP and the 1P4.
3

- 27 -
3.20 In practice, the DCH supervises and monitors crude supply tothe refinery and refinery operations, while the DGt supervises allpetroleum sector operations not related to production. Both ministriesact only in an advisory capacity, however, to the MPBP and the MPH onmatters concerning annual investment and operating budgets (for SOGARA,PIZ0, SCEPP), the price at which crude oil is purchased by the refinery,ex-refinery prices and market prices for refined products.
3.21 While this "de facto" division of responsibilities permits thesystem to operate without major difficulties, it is not clear that it isconducive to the most efficient operation of the marketing anddistribution system. Under these arrangements, the MIHR's real authorityis effectively limited to the approval of new depots or retail outlets.Altbough there is some communication of data and statiatics from themarketing companies through the Groupement Professionnel des P6troliers(C??), it does not appear that the MEHR is kept regularly informed ofproduct imports. Their documentation of refined product supply isincomplete, at best. Nor does the MEOR participate directly in theprocess to establish retail prices (para. 3.32). In effect, the lack ofclear distinction of responsibilities not only restricts the coordinationof policy between the ministries, but also leaves gaps in the exercise ofsupervisory functions.
3.22 1We mission recommends that the Government review the existinglegislation to amend all duplication of responsibility among theinstitutions of the sub-sector. This review should take place followinga more extensive institutional review for the subsector to determine theproper roles for the DCHI, MIR, NIBP and MPH in product marketing anddistribution. The extensive review should include, but not be limitedto, the following tasks:
(a) fully assess the "de facto" roles of the various institutionsand their effectiveness in fulfilling said roles;
(b) make a thorough accounting of the major areas of operationaland supervisory responsibilities (some of which may already beaccounted for in the legal texts) which are not exercised orare ineffectively carried out under the current system;
(c) evaluate the capabilities and resources of the variousinstitutions relative to Mi) the tasks which they currentlyexercise, and (ii) those tasks for which they are legallyresponsible;
(d) identify the appropriate division of responsibilities among thevarious institutions based on the evaluations in (a), (b), and(c); and
(e) determine new staffing, training, and resource requirementswhere needed and develop a plan to implement proposed changes.

- 28 -
Petroleum Product Pricing
3.23 The Government of Gabon intervenes heavily in the pricing ofpetroleum products at both the ex-refinery and retail levels. Itsprincipal objective is to ensure relatively stable prices for petroleumproducts in the domestic market. Provision is also made through flexiblefiscal policies to cover costs while allowing a reasonable profit marginfor the refinery and the marketing and distribution companies. Changesin prices consequently take place only when there have been majorinternational price shifts.
Ex-Refinery Prices
3.24 Until 1981, ex-refinery prices were established according toimport parity (Caribbean) prices. Under the current system, the MFDPestimates the price at which crude oil will be purchased by SOCARA, thencalculates a margin which will both cover costs and provide a smallprofit to SOGARA. The margin is determined on the basis of a budgetpresented by SOCARA.
3.25 The MFBP's assessed value of crude oil is a reference pricebased on estimates of the average official OPEC price. Although itnormally is adjusted quarterly, adjustments were made monthly during thefi'rst two quarters of 1986 because of the rapid evolution in OPEC quotesfollowing the 1985 price drop. 9/ The MFBP's assessed value for thethird quarter 1986 crude price was fixed at $10.50/bbl.
3.26 The price at which SOCARA actually purchases the crude, theofficial OPEC price for Mandji, can differ substantially from the MFPassessed value. 10/ For example, the MFPl assessed value of crude usedin the price structure for the second quarter of 1986 (April 10, 1986)was $15/bbl at an exchange rate of 370 CFAE/UB$. The actual OPEC quotefor April was $13/bbl. During the first half of 1986, such differentialsresulted in a windfall profit for the refinery. For the month of April,the windfall would have-been equivalent to US$130,000 for delivery of one65,000 bbl batch (para. 3.6), or about US$1.3 million annually for a $2differential maintained throughout the year, not including the benefitsarising from fluctuations in the exchange rate.
9/ The OPEC price moved as follows during this period: January -$21/bbls February - $15/bbl; March - $14/bbl; April - $13/bbl; May -$13/bbl; and June - $12/bbl.
10/ As noted in para. 3.7, SOCARA's purchase price is billed in USdollars, payable in CPA francs using the exchange rate in effect atthe time of pumping.

- 29 -
3.27 The windfall profit to the refinery only occurs when the MFBPunderestimates the OPEC price. More commonly before the oil price drop,the quarterly price used by the MFBP in the pricing structureunderestimated crude costs. This, combined with margins inadequate tocover SOCAaA's actual operating costs, has led to losses which must beabsorbed by the refinery, seriously reducing its working capital forimproving operations.
3.28 The added margin covers operating costs, fixed and financialcharges and profit. Forecasts of annual product sales and exports areprepared by SOGARA and submitted for review with an associate operationalbudget to the MPBP. The per unit costs projected for 1986 (at anexchange rate of 340 CPAP/US$) were comprised of US$20.3/ton in variablecosts (including fuel), US$7.35/ton for transport, US$34/ton in overheadcosts-a total of US$61.50/ton for operating costs-plus US$5.20/ton andUS$8.60/ton for financial costs and depreciation, respectively. 11/Both operating and financial costs appear unusually high compared toindustry standards in West Africa.
3.29 The resulting ex-refinery prices. are considerably higher thanthe economic costs of refined products, which are represented by importparity prices in Table 3.5. Clearly, the differential between the actualcost of crude and the NFBP's assessed valEie contributes substantially tothe distortion of ex-refinery prices relative to import parity. Yet evenwhen adjusted for this differential, ex-refinert prices are 26X-52Xgreater than import parity. Civen that the ex-refinery prices presumablyreflect the actual costs of refining, SOCARA may not be the most economicsource of supp for the country. However, the mission was not able todetermine during its brief assessment the scope for bringing the costs oflocal refining more in line with the economic costs of supply, and a fulleconomic analysis of the refinery was outside of its mandate.
3.30 The cost-plus system of determining ex-refinery prices, basedon an assessed value of crude, offers little incentive for least costsupply of refined products. The problems inherent to the system wouldnot be alleviated simply by modifying the frequency of adjustments toMFBP's assessed value, as this appears to be only one of many factorscontributing to high ex-refinery prices.
11/ SOCARA's financial costs for 1986 total almost 20 billion CPAP.This can be broken down into debt burden (14.4 billion CFAP) plusthe net difference between receivables (16.8 billion CFAP) andaccounts payable (11.4 billion CPAP). The high figure forreceivables is primarily due to PIZO's outstanding debts(9 billion ClAP) to SOGARA.

- 30 -
Table 3.6: COMPARISON Of EX-EFINERY PRICES AND IMPORT PARITY, 198CUSS/ton)
lst Quarter 1986 4th Quarter 1986 clImwport Import Adjusted
Products Ex-Reftinory a/ ParIty 1/ Ratio Parity e/ Ratio Ratlo ft
Premium Gasoline 255 213 1.2 173.5 1.47 1.3Regular Gesollne 265 198 1,34 156.5 1.67 1.52Kerosene 239 244 0.96 170.0 1.41 1.26Gas Oil 225 212 1,06 142.0 1.58 1.41
/ Ex-refinery prices In price structure f fective April 10, 1986 (Annex 9).Exchange rate: 340 CFAF/SI.00.
b/ As of Apil 1, 1986, before nea price structure, Average spot value of KandJi -
S15.50/bb.-c@ As of October 23, 1986.
M/ E April 1966 plus Insurance and freight.gl tNiE October 1986 plus Insurance and freight.7/ Adjusted for "windfall codponent" In the ex-refInery price due to tho differenc
between the assessed value for MandJi In the ApriI 10 price structure (still In effectIn October) - S15hbbl - --*9iot market value of WandJt In late October 196IS11 .5fbb1 ).
Source: WEBP, mission estimates.
3.31 A restructuring committee has been formed to review thestructure of ex-refinery prices. Nonetheless, the mission recomsendsthat the Government return to import parity pricing as the basis fordetermining ex-refinery prices in order to encourage more economic supplyof products. The exact nature of the picing system should be define4 inthe context of an in-depth refining and product pricing diagnosticstudy. The three main objectives of this study will be to (a) undertakea diagnostic evaluation of refinery operations and a management audit ofSOGARA; (b) examine the arrangements and costs for supplying crude oiland refined products to the country; and (c) review the petroleum productdistribution strategy and pricing system. The study, which will follow-up a financial audit of SOGABA planned for the beginning of 1988 underthe MPE's supervision, should examine, but not be limited to, thefollowing:
(a) the efficiency and full costs of refining at SOGARA'sfacilities, including (i) a thorough evaluation and breakdownof all operational and financial costs and (ii) review ofmanagement practices which may affect refining costs;

- 31 -
(b) the scope for reducing refinery operating costs throughfinancial restructuring (e.g, debt to government equity) andimproving the technical, financial, marketing and managerialfactors as identified in (a), so as to ensure sustainedeconomic and financial viability;
(c) the optimal combination of cost reduction measures which wouldbring SOARA's costs closer to import parity costs;
(d) the costs of importing products from alternative sources(including other West African refineries) versus local refiningunder a scenario of cost reduction; the economic cost to theGabonese economy of choosing to supply itself from SOCARArather than from alternative sources;
(e) the levels for ex-refinery prices, using import parity as thebase, which will serve as an incentive for both (i) theimplementation of cost reduction measures by SOAMA, and(ii) economically efficient operation of refining facilities inthe future. The import supply alternative which is leaotcostly to the economy (determinated in (4)) should be used asreference. An appropriate formula for calculating the ex-refinery prices should include componnts representing thecosts of supplying the country from the next best supplysource; 12/
Cf) the appropriate institutional arrangements for monitoring andadjusting ex-refinery prices and the frequency with which theyshould be adjusted; and
Cg) the reforms necessary to simplify the retail price structure,and to institute a formal mechanism for regular consultationand revision of retail prices, as specified below (pare. 3.42-3.44).
3.32 SOCAM would be required to deliver products at the ex-refineryprices calculated under the import parity formula; its profit would bedetermined by the degree to which it can reduce its costs below thislevel.
12/ Principal elements of the formula thus defined would be: (a) freightand insurance; (b) terminalling, maintenance cost and operatorprofit; (c) port costs; and (d) capital recovery for investmentsrequired to allow efficient handling of products.

- 32 -
Retail Price Structure
3.33 The prices for all petroleum products in GabonT (exceptlubricants) are set officially. The MPBP calculates the prices accordingto a complex structure which includes the ex-refinery price, transportcosts, distributors' remuneration, financial costs, retail margins,various taxes and the requirements for various policy-based funds. Themain features of the resulting price structure are:
(a) cross-subsidization among products to benefit those considered"socially sensitive", either through ea-refinery price levels(butane) or through various taxes and levies (kerosene);
(b) stabilization of consumer prices over time with the objectiveto avoid frequent adjustments; and
(c) geographic cross-subsidization to minimize the differences inthe price of a given product throughout the nation.
3.34 The retail price structure has been adjusted infrequently andonly twize in the past three years. When the marketing companiesconsider a price adjustment is required, they make a request through theOPP. The request is made to the MBPIP, which reviews the merits of theproposal. For the most part, requests are kept under advisement untilthere is need to modify one of the major components of the structure.
3.35 Table 3.7 below shows the major structural elements of theprices in Libreville and Port-Gentil for the four main products: premiumgasoline, regular gasoline, gas oil and kerosene. The price structuresfor products sold in other localities (Annex 9) include additionalelements for transport, storage, and (further) geographic equalization(para. 3.32). The transport component is fixed by decree, withforeimburseme.t" to the distribution companies according to the type andquantity of products delivered and the distance travelled (Annex 10).The price of locally refined butane also is constructed according to arather complicated structure (Annex 11). The prices of other products,including fuel oil, jet fuel and asphalt, are set by decree.
5

- 33 -
Table 3.7: MAJOR COMPONENTS OF THE PETROLEUMPRODUCT PRICE STRUCTURE u/
(CFAF per 100 lIters)
GasollneCmwponent Premium Regular Keroene Gan Oil
Ex-refInery 6,436.4 6,433.6 6,44B.7 6,451.3Stabilizatlon FundTax 1,029.0 624.7 -2,860.4 37n.7
"Stabilized" cost 7,46$.4 7,256.3 3,568.3 6,629.0
Taxe Compl6mentalre 14,700.0 14,700.0 700.0 3,500.0Equalization FundTax 1,700.0 1,700.0 1,700.0 1,700.0
Other Taxes, Chorges,Margins 4,134.6 3,841.7 2,611.7 2,871.0
Retail Price 26,000.0 27,500.0 8,800.0 14,900.0Retail Price
per liter 280.0 275.0 68.0 149,0
It/ Libroevil and Port-entil, as of AprWi 10, tg96.
Source: Directeur GOn6ral des Calsses de StabiIlsation et deibr6quatlon.
3.36 Two of the most important components of the price structure arethe Stabilization and Equalization Funds, both administered by theMFBP. The Stabilization Fund was established in 1972 to ensure thestability of petroleum prices, at the distribution stage, over time.Originally, only gasoline was taxed to support the prices of kerosene andgas oil. In 1986, the gas oil subsidy was ended and now gas oil salesalso contribute to the fund. The Stabilization Fund covers thedifferential between the price of imported butane and the price oflocally refined butane. Until 1986, contributions to this fund amountedto 321 of the retail price of super gasoline and 33X for regulargasoline. The stabilization component is considerably less in the pricestructure put into effect in April 1986t 4X for super, 3X for regular and31 for gas oil. This dramatic shift is the result of policy changeswhich favor the "taxe compl6mentaire" (para. 3.39).
3.37 The Equalization Fund was created in 1968 (the currentstructure was put into effect in 1971) to minimise the difference in theselling prices of products throughout the nation. The objective of thefund is to keep prices of products sold in the outlying regions lowenough to (a) not represent a constraint on consumption and

- 34 -
(b) discourage black market trade with the Congo and Cameroon. A levy of17 CPAP per liter is collected on all clean products. This amount hasmore than doubled since 1983, when it varied from 5 CPA? per liter ofkerosene to 8.75 CPAF per liter of gas oil. It is now uniform for allproducts.
3.38 In 1985, both the Stabilization Fund and the Equalization Fundcarried deficits of about 1.5 billion CFAF each. In the case of theStabilization Fund, this was attributed in part to the large subsidies ongas oil until 1986. These subsidies encouraged rapid and wideospradsubstitution for the more costly gasoline, the sales of which were neededto support the subsidy. For the Equalization Fund, the old levies simplywere not sufficient to meet subsidization needs. In both cases, the MPFPestimated that under revised forecasts of petroleum product demand, thelevies carried in the new structure will permit the funds to recovertheir deficits and break even within the next two years. Since then, thesituation has improvedt the Stabilization Fund now has a surplus ofalmost 17 millioli CFAF, as a result of the increase in the taeacomplhentaire. The Equalization Fund still carries a deficit, but ithas decreased to 500 million CFAP.
3.39 The current price structure was put into effect in April 1986.13/ It implements certain adjustments to reflect falling crude oilprices--including a minimal adjustment to retail prices (from 2-5 CPAPper liter depending on the product) in order to pass some savings on tothe consumer-and reflects some policy changes in the- utilization oftaxes and subsidies. The principal adjustments were made in three areas:
(a) ex-refinery prices were reduced by nearly 501 to adjust forlower crude prices;
(b) the "taxe compl6mentaire" was increased radically to recoup forthe national treasury the rent which previously had beenabsorbed by the refinery; and
(c) the major subsidies, the Stabilization Fund and theSqualization Fund (paras. 3.36-3.37) were modified to correctfor deficits and to drop the subsidy on gas oil.
13/ The price adjustments made in April 1986 affected only the threemain products. Price levels and pricing structures for butane, fueloil and Jet fuel remain the same as in March 1985.

Table 3.8: EVOLUTION CF TAXES AND SUMSIDIES ON PETROLEUM PFR00UC PRICES a1
(CFAF per 100 liters)
PREMIUN_ REGULAR KEROSENE GAS OIL
1983 1985 1986 1983 1965 1986 t983 1965 1986 1983. 1985 1986
RetalI Price b/ 24,500 28,500 28,000 24,000 28,000 27,500 7,500 9,000 8,000 13,700 15,200 14,900
Taxe oomplimentalre 100 100 14,700 100 100 14,700 10p 100 700 100 100 3,500
Stabilization Fund c/ 7,783 9,179 1,029 7,773 9,232 825 (8,562) (9,885) (2,860) (1,688) (2,557) 378
Equalization FundC/ 775 1,390 1,700 775 1,390 1,700 5O0 1,390 1,700 875 1,390 1,700
Oter Direct Texesd/ 397 401 430 407 411 430 226 230 400 166 170 407
Taxes and subsidycontributions as percentof retall prlce 37% 39% 64% 38% 40% 64% - - - - - 40%
Taxes as percent ofretail price o/ 2.0% 1.8% 54% 2.1% 1.8% 55% 4.3% 3*7% 12.5% 1.9% 1,8% 26.2%
I-
1!, Based on price structures for Libreville dated Sept. 1, 1963, March 18, 1985 and April 10, 1986.
For 1986, price structure Is also applicable to Port-Centi I..
b/ For Libreville and Port-Gentil. Level of subsidies differs between the two In 1983 and 1985.
c/ Positive value Indicates levy to finance the fund. Negative value-In parenthesis-is subsidy provided by the
fund.d/ Includes port taxes, municipal taxes on distribution and storage charge,.
eJ Including the toxn copld.entalre.
Source: WOP, mIssion estimates.

- 36 -
3.40 The net result of these changes is a dramatic shift in therelative weights of taxes and subsidies in the price structure(Table 3.7). There is more emphasis on income generation through a moreaggressive fiscal policy (increased "taxe compl6mentaire") and lessemphasis on cross-subsidization among products. The Government canexpect to receive up to 167 million CPAP (US$0.5 million) from the "taxecompl6mentaire".
3.41 These shifts in policy are encouraging, as they indicate awillingness on the part of the Government to make more effective use oftaxes and subsidies. The mission believes, however, that there iofurther scope to simplify the system of taxes and subsidies, and to maketheir application more economically efficient. The case of gas oil is agood example. Although the product is no longer subsidized through theStabilization Fund, the final retail price is maintained at half theprice of premium gasoline by keeping the tax burden relatively low (26Xof the retail price, versus 551 for gasoline). Thus price discriminationin favor of gas oil continues. The objective of keeping the price of gasoil low is to assist small entrepreneurs, industries and transporters.However, given that a dozen large consumers account for almost half oftotal gas oil consumption, the policy of maintaining an artificially lowprice is a highly inefficient way of achieving this objective.
3.42 The mission recommends that, as a first phase, the officialretail price of gas oil be ad3usted (possibly by increasing the "tazecompl&mentaire" to match that of gasoline) in order that retail pricesmore closely reflect the relative economic costs of the products. Othermechanisms, such as special vouchers or fiscal measures, be explored totarget the intended beneficiaries of any preferential pricing of gasoil. The former action will allow the ratio of the retail prices for gasoil and for gasoline to more closely approximate their relative economiccosts, thus siding demand management of the two products. It should alsoprovide a source of additional government revenues. The mechanisms usedto benefit smaller users should be designed to complement the priceincrease.
3.43 As a second phase, and most !Lzportantly, the mission recommendsthat the Government simplify the current pricing structure, which isunnecessarily complex. This could be done by establishing five majorcost categories: ex-refinery price, fiscal levies, freight andEqualization Fund adjustments, Stabilization Fund adjustments, andmarketing margins. These items should all be examined under thepetroleum product pricing study recommended by the mission (para. 3.31).
3.44 The mission further reco.mends that the pricing system beimproved by instituting a formal mechanism to permit regular consultationand revision of product prices. In the process, the marketing companiesshould be more directly involved, through the GPP, to provide informationon the current marketing and distribution situation and their costs.

- 37 -
IV. 8LCIC POE
Introduction
4.1 The monopoly for generating and distributing electric power inGabon is held by the 8ociete d'8nergie et dEau du Gabon (SilG), which isalso responsible for water distribution. The bulk of BERG's activities,coats and revenues are related to electric power. The exact proportionis difficult to calculate as the management and operation of the dualwater/electricity systems are highly integrated within SERG.
4.2 SEG's operations are grouped according to four physicallyindependent transmission and distribution subsystems (para. 4.4-4.11)sLibrevillet Port-Centil, Franceville and the various isolated centers.In addition to the BERG system, there are a number of individual and/orsemi-collective generating facilities in remote villages and on somelarger farms. Most of these are relatively small in capacity, althoughat leapt one sugar mill has installed a large combined process heat andpower generation plant. The contribution of these facilities to totalelectricity generation in the country is minimal, however.
Main System Characteristics
4.3 The SBEG power system boasts a total installed capacity of285 MV. Hydroelectric plants account for 56X of this capacity. Totalnet generation of the system in 1985 amounted to 861 GCh, 78X of whichoriginated from hydroelectric plants. The proportion of hydro to thermalcapacity and generation varies markedly among the system's foursubsystems. The net generation in each subsystem, for all practicalpurposes, could be considered either totally hydroelectric or thermal(para. 4.4-4.10). Table 4.1 presents a summary of the maincharacteristics of the total system and each subsystem.

- 38 -
Table 4.1: MAIN SEEG SYSTEM CARACTERISTICS, 1985
SubsystemISV POG FCV DER Total
Available Capacity a/ (MW)Total 168 57 48 15 285H4ydro 126 0 38 0 161Thermal 42 57 10 15 124
Peak Load OV) 87 26 25 8 146 b/
Net GeneratIon (GWh)Total 531 158 137 35 861Hydro 530 0 137 0 668Thermal 0 158 0 35 194
192/1985 Averaee-oand Oro"t (S/year) 10,2 4,0 7,4 20,8 8,9
a/ In October 1986,y/ Sum of separated peak loads, Irrespective of any colncidence
factor.
Source: SEES.
Generation and Transmission
4.4 The Libreville subsystem (LBV) accounts for approximately 602of both the total installed capacity and the power generated by 8NUG.Two hydroelectri¶ generating plants on the Mbei river form the bulk ofinstalled capacity: Tchimbele, with a 220 million mJ reservoir, isequipped with three units of 22,800 kV each; Kinguele, downstream, has anegligible reservoir capacity and is equipped with two units of 9,600 kWand two units of 19,200 kW. The diesel-fired gas turbines (2 x 21 M4)have been installed at the Owendo port in Libreville and were brought on-line in 1986.
4.5 The transmission network from the hydro plants consists ofthree main components. A 225 kV overhead line connects Tchimbele toKinguele (40 km) and then to the Bissegue substation (Kinguele-Bissegue:104 km) on the outskirts of the capital. Kinguele is also connnected tothe Bissegue substation via N'Toum (Kinguele-N'Toum: 70 ki; N'Toum-Bissegue: 35 km) by means of a 90 kV overhead line. Finally, a 105 MVAtransformer bank (3 x 35 MVA single phase, plus 35 AWA standy) atBissegue feeds the 90 kV Libreville subtransmission system.

- 39 -
4.6 The maximum total output from Tchimbele and Kinguele combinedis 126 HU under normal conditions, and 108 NW during dry years (assuminga return period of at least 20 years). The average total energygenerated annually is 670 GWh, 490 GMh during dry years.
4,7 Under 1985/86 levels of demand (para. 4.13), the gas turbinesat Owendo would not be used unless there is a shortage of hydraulicallygenerated energy due to an extremely dry year, or there is need forbackup to cover a shortfall in hydroelectric capacity. A capacityshortfall technically could arise from electromechanical outages at oneof the hydro plants, or in the unlikely event that one of the 220 kVoverhead lines is tripped. In the latter case, LBV's emergency supplycapacity would be about 82 NW (40 NW through the 90 kV overhead line and42 NW from the gas turbines), which is nearly equivalent to the presentpeak demand.
4.8 SEG uses a simulation program, Mogador, for managing theoperation of the LBV hydro plants. Mogador features a medium-termcomponent for handling the yearly optimization of water use, and a short-term component with a time horizon of several hours for synchronizing theoutflows at Tchimbele with the inflows at Kinguele. Management of thereservoirs using Mogador has contributed to the high reliability of theLaV subsystem, and also to avoiding the use of expensive thermalgeneration.
4.9 The Port-Centil subsystem (POG) supplies the port city whichhouses the petroleum industry. Power is generated primarily by two 20.9NW gas turbines fired with natural gas piped in from offshore oilfields. This capacity easily covers the current peak demand(Table 4.1). An old 5 x 3 MW diesel plant is kept as backup. Thegenerating plant is located on the edge of the city, and thus there is notransmission network.
4.10 The Franceville subsystem (FCV) serves the major urban centerin the interior, Pranceville, and the mining industry at nearby Moanda.The generating plant consists primarily of the Poubara hydro plants,which include four units of 4,64 NW and two 9.6 MW units. The Moyabidiesel plant (5 x 2.2 NW) has been used only as backup since 1984, whenthe last of the Poubara units was commissioned. The FCV subsystem has a63 kV transmission network connecting Poubara to Franceville (21 km) andto Noanda (54 kn) via intermediary substations at Mvengue and Moyabi.
4.11 The isolated centers (DER) represent BERG's administrative andoperational grouping of 22 small, physically independent load centersscattered throughout the Gabonese territory. Distances between loadcenters are usually over 100 km. SERG is responsible for power supply toall of these centers with the exception of one, which is supplied byShell Gabon. Installed capacity at each point of the DER subsystemranges from a mere 120 kW to 1,800 ki; total installed capacity amountsto 10 MW.

- 40 -
Distribution
4.12 S11G has a total 620 km of 20 kY medium voltage (NV) lines inits distribution systems, 190 km of which are underground. In the DIBand FCV subsystems, about 200 km of 5.5 kV overhead lines are alsoused. The low voltage (LV) lines total 720 km in length, of which 50 kmare underground. There are 1,230 NV/LV substations, with total capacityof 363 NVA. All services are equipped with breakers.
Demand Characteristics
Demand Profiles
4.13 Total electricity sales in the 8L90 system amounted to 757 GIhin 1985. The LBV subsystem accounts for nearly 601 of total consumption,the DIR subsystem for only 71, and the balance is split evenly betweenPO0 and FCV. Systemwide, NV sales account for Just over half of totalsales. The proportion of HV sales varies widely among the subsystems,however, ranging from a high 881 of consumption in the PCV subsystem to alow 441 in both the LBV and DER subsystems; in the POG, the proportion isonly slightly higher than this latter figure, 521. The largest MVcustomers include the mining sector, the Pr6sidence" and the oil industry(Table 4.2). Consumption of LV electricity is predominantly in theresidential sector, although there is some usage by BERG itself and inindustry. From 1980 until 1986, electricity consumption increased at anaverage rate of almost 91/yr (Annex 13). LV customers registered thehighest growth rates, 14.5X/yr compared with 4.71/yr for NV customers.
4.14 Load Curve. In the LBV subsystem, the yearly load factor is0.69. The daily load curve features an evening peak between 7:00 p.m.and 11:00 p.m. which is 201-401 higher than the average daytimeconsumption. There is almost no variation in the daytime load until theevening peak. In the winter months, there is a noticeable post-peakreduction in the night loadt which falls to about 751 of the daytimeaverage. Seasonal modulation is small, although there is a loadreduction in the ummer; a 151 decline is recorded during the month ofAugust when many residential customers go on vacation.
4.15 In the POC and PCV subsystems, the daily load curves have thesame general shape, but fluctuate over a smaller range. The summer loadis reduced in proportions equal to that in LBV. Yearly load factors, are0.69 and 0.63, respectively.
4.16 The yearly load factor of operating plant in the DIR subsystemranges from 0.25 to 0.60. As a general rule, the larger the load center,the higher the load factor.

- 41 -
Table 4.2s GABON ELECTRICITY SALES - 1985
Llbreville Port-Osntil Franceville DER Total
(01h) (S) / (0G1h) (S) a/ (Gb) CS) I/ (6Wh) (C) I/ (SGO) (5) i/
NMdlu voltgp 211 28 75 10 104 14 7 1 396 53Low voltap 250 33 70 9 14 2 24 3 356 47Total 461 81 145 19 116 16 31 4 756 100
Number of Percent ofLow Voltae Categorles Customers Total Consumption
Rassdential 54,490 38.4Pubtlc Llghting 550 1.4Industrial 1,040 3.2Internal Use (Water) 210 2.1SEEG Personnel 1,660 2.3
a/ Percent of total sales.
Source: SEES, Annex 12, Annex 15.
Demand Forecasts
4.17 In 1984U, SlG calculated a detailed long-term forecast ofelectricity consumption throughout the system using several demand trendassessment methods (Annex 16). These forecat.s were revised in early1986 following the oil price drop at the end of 1985 (Table 4.3). Thenew forecasts indicated a stabilization of the demand in L8V, FCV andP0, followed by moderate growth after 1990. An actual decrease indemand in 1987-88 was possible, especially in the case of POG, whereelectricity consumption is closely linked to the oil industry, and inLBV, due to the induced macroeconomic effects of the oil price drop.Stag ation of electricity demand in ICV also was anticipated, even thoughdemand in this subsystem is more directly linked to the mining sectorthan to petroleum. The commissioning of the Transgabonese Railroad wouldhave the most direct impact in this subsystems the electric cablewaywhich transports 2 million tons of ore annually will no longer beoperated, thus redu-cing the power demand by 10 GMh/yr.
4.18 The S13G forecast for DER was based on the assumption thatthere will be no constraints placed on the introduction of new generatingcapacity in these areas. Under this assumption, electricity demand inDER would grow at about 15X annually (high scenario). The missionadopted the more realistic assumption that further development of

- 42 -
generating capacity would be reduced or halted in the medium term (lowscenario). Thus DU consumption would tend towards the maximum energyand demand which could be generated by existing equipment. It is evidentfrom these scenarios that the actual electricity consumption in DER maybe constrained, depending on the policy adopted by the Government forintroducing new generating capacity (para. 4.38-4.40).
4.19 The mission was of the opinion that the demand trend assessmentmethods used by SBEG in its demand forecasts were not adequate forprojecting future demand. This is because past economic performance, andtherefore electricity demand, have been heavily influenced by theevolution of the international petroleum market. The vagaries ofinternational oil prices in the past decade, including two dramatic priceincreases and the more recent crash, do not represent gross macro-economic/energy demand trends which are likely to repeat themselves inthe future. The mission therefore recommended that the BERG revise itsdeman forecasts according to a more appropriate methodology, to includet
(a) a 5isaggregated market survey of each major class of consumer,(in addition to the surveys of large industrial individualconsumers) for esch of the subsystems; and
(b) a macroeconomic consistency check, based on the most recentmacroeconomic projections to be provided by the NEP.
4.20 A new scenario, which predicts a recession in the electricitysubsector, was constructed in early 1987 using a synthetic approach whichexcludes use of tendencial models, the latter deemed ineffective in thecontext of Gabon's economic crisis. Nevertheless, BEIG would find itdifficult to implement the methodology recomuended by the mission. Thisis due, firstly, to the lack of analytic data on market segments; andsecondly, to the fact that the sector operators feel that the MPE's longterm economic projections are not made accessible to them. 8UG believesfurthermore that macroeconomic models are very difficult to elaboratebecause of lack of reliable data. A new investment plan, based on therevised (downward) growth scenario, takes into account the modificationof the major parameters (para. 4.23; 4.27).
Medium-Term System Development: 1987-1995
4.21 New Generating Capacitr. Taking into account the forecasts forelectricity demand used by the mission and presented in Table 4.3, theexisting generating capacity in the three large load centers (POG, LBV,and FCV) will be sufficient in the medium term to meet electricityneeds. SUG's 1987 revisions are even lower, and thus the conclusionremains valid. The available margin of power and energy for existinghydroelectric capacity in the LBV and PCV subsystems now stands at 26S

Table 4.3: REVISED ELECTRICITY E(KAND FCRECASTS: 1986-1995
1986 1967 1988 1969 1990 1991 1992 1993 1994 1995
(actual)
Librevi lIeNet Consumption (0Kb) 511 481 481 485 515 545 560 610 650 690
Peak Demand0 ) 8S 60 60 61 86 91 97 102 109 116
Port-Gent INot Consumption (0Kh) 169 158 158 160 165 170 180 190 I9 200
Peak Demond () 28 26.5 26.5 27 28 28.5 30 32 33 34
FrancevilleNet Consumption (6Oh) 143 140 140 140 150 160 175 190 205 220 Z
Peak Demand ONS) 26 25.4 25.4 25.4 27.3 29.0 31.5 34.5 37.2 40.0
DERHigh Scenario (Gob) 8/ 63 63 64 68 76 86 95 110 .120 135
Low Scenario (6hb) 63 55 55 55 58 60 61 63 64 64
a/ Assuming soe addition to generating capacity is possible.
bJ Assuming constrained consumption due to limits on generating capacity.
Source: SEEG, mission estimates.

- 44 -
and 201 respectively. With these margins, thermal generation is neededonly if there is a disturbance in generation or transmission, or underextremely poor hydrological conditions. Once the available margins havebeen utilised, it still would be possible to meet electricity demnd inthese subsystems through incremental use of existing thermal capacity.The maximum peak which thus could be accommodated would be 126 MS at LIVand 32 NW at FCV.
4.22 A complementary 12 MS gas turbine (1.2 billion CFAF) couldprove necessary for FCV after 1992 to decrease the risks of shortages indry years. Still, any significant new generating capacity will not berequired until after these dates. A final decision on this can bedelayed until 1988-89.
4.23 SEBG's 1985 system development plan called for the installationof two new 21 MW turbines in 1992-1994 for Port-Gentil. This reserve wasto constitute the second phase in a project to establish an inter-connection between the LBV and POC subsystems (para. 4.27). Under therevised 1987 forecasts, the interconnection was scrapped, and a newstrategy retained which foresaw separate development of the LBV and POGsubsystems. This strategy reflected the uncertainties in 1986/87 aboutthe price of natural gas and its availability at Port-Gentil. Recentnatural gas discoveries (para. 2.28-2.31) have made this strategyquestionable, and the mission advises that a new optimization of theinvestment plan be undertaken to incorporate this information (4.27-4.33).
4.24 A 32 billion CPAP development program for the DER subsystem,co-financed by Canada (C$ 32 million), France (4.5 billion CPAF) and theSEG (20 billion CPAP), had been initiated in 1985. The program includeddevelopment of the electric power and water supply systems in 24 isolatedcenters. The scope of the project was reduced to 15 centers in early1986, to include either electric power or water at each target point, butnot both.
4.25 After decreasing the scope of the planned program once more,the Government finalised the conditions for executing the readjustedprogram in 1987, with financing provided by the Canadians. TheGovernment is still negotiating with the French Government for equipmentfor centers not included in the Canadian program. The mission recoaendsnonetheless that the program be prioritized and continued according to anextended schedule. A full economic and financial analysis of the variousprojects which comprise the program should be undertaken 14/ and theenergy demand in targeted load centers re-evaluated (para. 4.J§) in orderto rank the projects accordingly for completion.
14/ Many of the projects contained in the program are significantlydifferent one another. Some are merely extension projects; others,such as Lebams, are small hydro projects which would displace dieselstations. Thus the analyses must be undertaken project b prect.

- 45 -
4.26 Transmission and Distribution. The principal investments toconsider in short-torm system development are in transmission anddistribution for the LBV subsystem. The Bissegue substationtransformation capacity at Libreville requires strengthening(2 billion CPAP). A new 225 kV overhead line connecting Kinguele toLibreville is also needed (5 billion CIA?). These investments areintended primarily to improve the reliability of supply. Since systemreliability is already quite high, the mission believes that they can bepostponed without incurring significant risks to subsystem operations.
Long-Term System Development
4.27 SUEG's initial long-term system development plans were based onthe original 1984 demand forecasts (Annex 16). The plan was revised in1987 to take into account changes in the key parameters and, inparticular, uncertainties surrounding availability of natural gas. Sincemany of the key parameters have changet substantially yet again in thepast 12 months, with the-discovery of major natural gas reserves, thisplan is not likely to be the best solution for system development. SEDGwill therefore have to review and re-optimize its existing plans toreflect new gas discoveries, economic constraints, and a new timing.
Interconnection of LIV and POG
4.28 Long-term development of the LBV and POO subsystems should onceagain be examined simultaneously, as the interconnection between the twois still an option, given the availability of natural gas at Port-Centil. The interconnection would follow an in-land route, for a totalof 407 km of overhead lines (225 WV). The substations would be developedin two stages, allowing a transmission capacity of 40 MS during the firststage and 80 MN during the second. Total cost of the project is36 billion CPAF (US$102.9 million).
4.29 The studies previously conducted during the planning stagesincluded detailed operation simulations under various scenarios ofdeveloping generating equipment. On the Libreville end, thisincorporated possible development of hydro sites along the M'Bei, Komoand Abanga rivers. The potential and costs associated with the threemost (economically) interesting sites are presented in Table 4.4. On thePort-Gentil end, the addition of two 21 NW gas turbines immediatelyfollowing construction of the interconnection was considered in some ofthe scenarios. 15/ The simulations showed that the interconnection
15/ Generating costs at Port-Centil were estimated at 15.5 CPAP/kWh inthe simulations, given a gas price of 30 CIA?. The total cost risesto between 20 and 25 CFAF/kVh once capital, operating andmaintenance costs are added, depending on the discount rate andplant factor used in the calculations.

- 46 -
would be used to transmit power in both directions, thereby delaying theneed for larger additions to capacity.
Table 4.4: POTENTIAL HYDROELECTRIC PLANTSNEAR LI9REVILLE
Kinguele Kingueledownstresm upstrem Ngoul msendJis
River M'SEI M'DEI KOmG
Installed capacity(NW) 30 40 100
investmnt costs a/(maillon CFAF) 50,000 U5,000 130.000
Nean energy(GWh/yr) 210 280 610
Firm energy(GBh/yr) 160 230 5Z/
Energy cost b/(CFAF/kWh) 37.5 44.4 30.0
Energy cost cl(CFAF/kWh) 28.6 36.4 25.6
a/ Including an Interest rate of 10%/year during constructlon.b/ On the basis of the firm energy and calculated with ywarly
capital and operation and malntenance costs equal to 12% ofInvestments costs, but without price nor taxes and duties.
c' The same as b/ but on the basIs of the men ergy.
Sources SEEG.
4.30 The principal parameters in these previous simulations andtheir evolution have been modified significantly. With regard to thegrowth of consumption, the new demand forecasts indicate that theimportance of the POC subsystem relative to LBV has decreased. However,future trends for gas prices, another major parameter, are more certainthan before, thanks to the oil companies' analyses giving estimates ofthe cost of supplying gas to SENG from the new discoveries. Purthermore,it has been shown that, once a timing for the interconnection has beenestablishld, gas will be available in the quantities needed (up to 2billion m /yr) for a sufficient period of time (at least 15 years).

- 47 -
4.31 Demand in Port-Gentil can be met with exioting capacity untilalmost 2000. However, demand forecasts indicate that new capacity willbe needed in the LBV subsystem by 1996/1997. Without the inter-connection, major investments in hydroelectric capacity would be neededin Libreville. The mission therefore recommends that S$EC re-optimizeits development plan to account for the availability of gas at Port-Gentil, in order to take a decision by 1989 on the first major investmentto be undertaken for system development. This date is crucial, as thelead times are six years for Kinguele downstream and Ngoulmendjim andfour years for the interconnection and Kinguele upstream. The lowerprice of fuel could make the possibility of thermal alternatives moreattractive, also, and this should be taken into consideration in therevised plan. If the interconnection is found to still be the optimalfirst stage for developing the LBV/POC subsystems, construction shouldbegin preferably in 1992, but no later than 1994. In the interim,complementary soil investigations for the hydro sites will have to becompleted immediately, so that full information is available for takingan optimal decision.
4.32 For the other subsystems, the timing for deciding on theappropriate sequence for system development is less crucial. The optimumforeseeable development in the FCV subsystem would include (a) a gasturbine operational around 1992 to provide back-up during dry yearsand/or during hydro/thermo-mechanical equipment outages, and (b) newhydro capacity (possibly Poubara 3) in 1996 or 1997. A decision for thelatter would be needed, at the latest, by 1992. In the case of the DERsubsystem, development will be a matter of general policy forelectrification of isolated centers. Projected economic and financialconditions in the medium- to long-term would prohibit return to any full-scale development of this subsystem before 1991. The investments neededin the other subsystems may push this date back to 1996.
4.33 The mission recommends that the Government review and clearlydefine its development strategy for isolated centers in the long-termwithin a sector-wide framework of investment priorities forelectrification. The Government should take advantage of this period ofslowed development to thoroughly re-assess the energy needs in targetedisolated centers, in conjunction with a full economic and financialanalysis of proposed projects in order to set development priorities(para. 4.25).
4.34 The mission estimated in Table 4.5 the investment program forthe electricity subsector with or without the Libreville/Port-Gentilinterconnection, plus the additional investments needed for developingthe isolated centers. Investments for the sector will be reducedsignificantly in the short-term, but will increase rapidly in the firsthalf of the next decade as existing generating capacity becomessaturated.

Table 4.5: PROJECTED INVESTRENT PI06RAN FOR ELECTRICITY SUBSECTOR 1987-1995
(billIon 1986 CFAF)
Total
1987 1988 1989 1g 1991 1992 1993 1994 1995 Investment
Generation and Transmission
Total with Intereonnectlon: 0 O.S 0.5 0 0 5 8 8 26 S8
LBV and P06- Special studies - O.S 0.5 - - - - - - 1- Interconnection overhead lines S substations - - - - - 2 8 8 6 a/ 36
- Next hydro plant - - - - - - - - 20b/ -
FCV- 6as turbine - - - - 1 2 - - - 3
Total without Interconnection: 0 O.S 0*5 0 5.5 13 10 1S 30 74.5
- Special studies - 0.5 O.S - - - - - - 1 o
- Kinjuele downstream - - - - 5.5 10 10 10 10 S/ SO
- Nebt hydro plant - - - - 5 20 d/ -
FCV- Gas turbine - - - - 1 2 - - - 3
Distribution 2.0 2.0 2.0 2.0 2.0 2.5 2.5 2.5 2.5 20
Libreville 1.5 1.5 1.5 1.5 1.5 1.5 1.5 1.5 1.S 13.5
Port-centi I 0 0 0 0 0 0.5 0.5 0.5 0.5 2.0
Franceville 0.5 0.5 0.5 O.S 0.5 0.5 0.5 0.5 0.5 4.5
Isolated eenters 1.5 1.5 1.S 1.5 4.0 4.4 4.8 5.3 5.9 30.4
a/ Complementary substatlon equlpment In 1996.b/ Timing assumes co.missioning In 1999 (gas turbine at Port-eentil to be comissioned beforehand, with first investments beginning
after 1995).c/ Last part of electromechanical ot lissioned In 1996.d/ In the development without interconnection, the next hydro plant would probably be other than Kinguele downstream.
Source: SEES, mission estimates.

- 49 -
Other Subsector Issues
Electricity Tariffs
4.35 The tariff structure currently used by 583G is characterized bya declining block rate structure which varies according to thesubsystem. One constant LV tariff throughout the BUKG system is thesocial" residential tariff, a two block rate for consumers with lowdemand. The range of the initial block in this tariff was doubled inApril 1986 (from 120 kVh to 240 kVh) in an effort to reduce electricitycosts of smaller residential consumers. The two NW tariffs include a"subscribed demand capacity" charge for all subsystems except LBV, whichinstead has peak and off-peak rates.
4.36 Tariff levels are the same in PCV and DEI, and generally higherin those subsystems than the tariff levels in LBV and POG. The averageprice per kWh in 1985, excluding all taxes and other contributions(para. 4.38) came to 42 ClAP. This increases to 43.5 CPAP/kWh ifequipment costs are included. By August 19860, the average price per kWhhad increased to 46 C8AP.
4.37 Annex 23 describes in detail the tariff structure and levels inuse at the time of the mission.
4.38 Although tariff levels are set to reflect the general costs ofelectricity supply in each subsystem, there is a certain amount of cross-subsidization and a number of specialized costs incorporated intoelectricity billing. In the LBV and POC subsystems, two line items areadded to the basic price of electricity. A "contribution d'6quipement"(equipment contribution) covers the capital costs related to theelectricity and water distribution networks, which are owned by themunicipalities. The "contribution speciale d'dquipement" (specialequipment contribution) is used to reimburse the municipality's expensesfor use of electricity, particularly public lighting. The customers ofthe LBV subsystem also are billed for a contribution to an 5E3G equipmentfund used to cover debt service and investments. This contribution iscalculated on the basis of hydro-generation at Kinguele (6.47 ClAP/kWh)and service charges of miscellaneous loans. Income from LV electricitysales in All subsystems except DU is allocated to the "fonds dep6r6quation" (equalization fund) and "fonde de compensation"(coupensation fund) to subsidize the costs of electricity supply in theDER subsystem. Both funds are managed by the Caisse Autonomed'Amortissement. Tariffs in all subsystems include an 8Z sales tax (tazesur le chiffre d'affaires) on consumption.
4.39 Tariff Reform. In 1984* S33G began a detailed tariff study tocomplement its 1984-1988 investment plan and further plans for systemdevelopment into the early 1990.. For LBV-POC, this included thecommissioning of the interconnection and two gas turbines during theinvestment period, plus development of one hydro plant (the timing of

- so -
which had not been determined) after 1988. Poubara 3 was planned forFCV, but no major generation projects were envisaged in the Dui. Thetariff structure which resulted from the study represents a vast simpli-fication of the current tariff structure. Tariff levels incorporate theprinciples of economic efficiency, subjeet to the constraints of(a) imposed public service policies, such as geographic cross-subsidies;and (b) revenue generation requirements, to ensure a sufficient grossmargin to support the financing of future investments. The study appearsto be methodologically sound.
4.40 The final general structure has two principal components, afixed demand capacity charge (prime mensuelle fixe A la puissance) and aproportional price (prix proportionel de l'energie consommee) for eachunit of energy consumed. The structure is further distinguishedaccording to the following criteria:
(a) the voltage category - HV transmission, MV distribution or LVdistribution;
(b) the period of consumption, or time-of-use. This distinction islimited to MV customers, and corresponds to periods determinedas peak and off-peak;
(c) the duration of usage of the subscribed demand capacity, bydefinition the ratio of the energy consumed during a certainperiod and the contracted demand capacity. In the Lv tariffs,this is retained only for customers subscribing ,6 demandcapacities of 18 kV or higher;
(d) the subscribed demand capacity (la puissance active souscrite),which is "monitored" through the use of single-setting loadlimiters, set at the maximum demand requested by thecustomer. This charge is used as an incentive for moreefficient utilization of the customers electric appliances; and
(e) the actual energy consumed. This is the only tariff criteriaapplied to LV customers who subscribe under the "socialtariff", with demand capacities of less than one kW.
4.41 Tables 4.6 and 4.7 present the proposed tariffs and the relatedLV marginal costs, as presented in the final report of the study(May 1985). Geographic cross-subsidization is maintained for LV tariffs,but eliminated for NV and RV. This action represents a practicalcompromise between economic and social objectives: the high long-runmarginal costs of supply in the DER and FCV are covered by NV and RVcustomers (who are generally the larger consumers) and large consumers ofLV electricity in LBV and POG-yet electricity remains accessible tosmaller consumers throughout the country. Once the long-run marginalcosts were dstermined, the basic tariff levels were adjusted according toa factor (le p6age) which takes into account the elements of the policyfor financing investments. The values in Tables 4.6 and 4.7 assume thatthis factor is equal to one.

Table 4.6: SM TARIFY STUDY - LO V0LTA¢Z at
3etlO.*l Tariff bI I LOng-1un Marginal Costs o
I - …PO K D
I L_________ _____ _____ -__ __ __
Dmand d ergy of I emnd di nergy el D_ed *! d Enery el Demand 4/ Suerg el
(CFAF1kM) (C1*1tb1h) I (CF*lkW) (C1*11bJh) (1AP*1W) (lCAMh) (C01/Ik) (C0F1*/kh)
Small ant Medium Capacity I
Social (1 kW) -- 60.i3 I -- 55.6 -- 70.13 -- 123.84
Comfort (3 or 6 kU) 1719 48.46 1 1650 43.87 2612 51.59 2204 108.22
Creat Comfort (9 or 12 2309 44.26 1 2222 39.83 3511 45.20 2958 102.82 1
Large Cpaity flI II
Short duration 81 1418 51.67 1 1369 46.96 2161 56.48 1821 112.33
IGeneral hi 2309 44.26 1 2222 39.83 3511 45.20 2958 102.82
ILong duration it 3315 40.07 1 3187 35.79 5042 38.82 4258 97.43
a* Marh 1985.bi New tariff reulting from the study, to be applied nationally. Based oan the long-run
marginal costs calculated In the study, equalized geographically and taking into account
the S lGovezramnt capaeity to finance investment plan versus cash generation from
from nev tariffs. Excludes the Governments share In certaln investment In the DER, the
consumption tax (TCA) and contributions to the special municipal funds.
of As calculated by SEEG according to the long-te generatim development plan for each
subsystem.d1 Monthly premium in 'CAFIkV of subscribed demand capacity.el Proportional price in CFAF per kWh consumed.fl Subscribed demand capacity s 18, 24, 30, 36 k or more.
gI Frie 0 to 120 hourslmonth usage of the subscrLbed demad capacity.h/ From 120 to 240 hours/month usage of the subscribed demand capacity.
if Over 240 hoursimonth usage of the subscribed demend capacity.
source: SEEN.

Table 4.7s SFF TARUFF STUDY - IRA*USSZION AND MEDUK VOLTAGE aIbl----- (CFUA)
Transmissioa Teriffs MdLua Voltage
W-mG ICY Dm I LlV-Il0 iCt Don
Very Short Duratlon (TCU) el I
Demnd Charge (per kY) 33899 36742 37710 1 40500 51199 42738Prsortional price (per khh)
Peak (7 - 11 p.m.) 90.68 95.78 251.08 1 107.27 133.4 280.45Off-peak 26.42 19.16 56.85 1 26.42 26.70 60.3s
Short duration (CU) d1 /
Demo Charte (per kI) 50730 55238 59650 f 60606 76971 67603ProportLonal price (per khh) I
Peak (7 - 11 p.m.) 49.36 46.56 151.27 J 57.68 64.87 167.34Off-peak 16.5S 9.31 56.85 1 18.91 12.98 60.33
General el 1
De d Charg (per kI) 63518 68952 72028 1 75884 96081 81633ProportiLonal price (per khh) I
Peak (7 - 11 p.m.) 34.47 28.90 115.45 1 39.89 40.27 126.74Off-peak 12." 5.79 56.85 I 14.68 8.06 60.33
Lane duration (LU) f /I
Dem_d Charge (per hI) 77853 84247 86489 1 93011 117392 96207Proportional price (per hbh) I
Peak (7 - 11 p.m.) 25.85 16.67 94.72 I 29.60 26.02 103.26Off-peak 10.93 3.96 56.85 I 12.22 5.20 60.33
a1 March 1985.b/ Does not include consunption tax (TCA) or contributions to the special mmicipal fLau.
These prices re not eqalie erdlly reflect the long amnrinia costssupplying electricty. Excludes the Go_veinsnt' she s certain Invstmts in the DBR.
o1 Prom 0 to 1000 eourslyear.d/ Froz 1000 to 2500 helrslyear.e/ From 2500 to 5000 hours/year.f£ Over 5000 eourslyear.
Scurce: SE=.

- 53 -
4.42 With demand forecasts now adjusted downward (para. 4.17-4.10),most of SEBG's system development plans will have to be re-optimized(para. 4.31-4.33). The mission recomends that the tariff study beupdated:
(a) to incorporate (i) the re-optimized system development plans(particularly as this relates to the calculation of short-runand long-run marginsal costs of supply) and (ii) modificationsto the load curve and consumption patterns envisaged followingthe 1986 economic slowdown; and
(b) to ensure adequate cash generation.
Reform of Public Service Reaulations
4.43 9HBG's present legal ststus is that of concessionaire for theoperation of the power system. The concession grantors are themunicipality, in the cases of LBV and PDG, and the state for the othersubsystems. The generating plant of the system is owned directly by theGovernment, which normally assumes responsibility for financing andconstructing the infrastructure needed by SBEG's operations, as well aspartially reimbursable loans. SEEG is a parastatal enterprise, with theGovernment holding 63X of its shares, and large private or semi-privatecompanies holding the remainder. No return is realized on BERG'scapital, although some large consumers who are also shareholders (¢OMUP,COMILOG) are beneficiaries of preferential (low) tariffs. The missionhas recommended that this situation be reversed, so that shareholderbenefits are realized through return on capital rather than throughtariffs (para. 4.47).
4.44 The major advantage of the current public service arrangementsis that the Libreville and Port-Gentil municipalities are able to monitorthe development of the electricity and water distribution networks withintheir jurisdictions. The major disadvantages stem from the overlycomplicated billing and accounting systems needed by 8BEG under thesearrangements. In general, customer bills are difficult to read. Chargesintended to cover investments are not easily decipherable, especially inLBV and POG, where the various funds complicate the billing. Theaccounting system adopted to keep track of subsystem disparities ischaracterized by (a) numerous circular inflows and outflows, and(b) imprecise valuation of assets, making it difficult to define theeconomic return on investments and debt servicing capacity.
4.45 In early 1986, the MOM1 considered a proposal to reform thepublic service arrangements for electricity and water. The primaryobjectives of the reform are to (a) further unify the electricitysubsector, and (b) transform 5EeG into an enterprise which will operatewith neither loss nor profit. The KKR1's proposal is comprised of threemain components:

- 54 -
(a) SEBG will be converted into a public enterprise with 100X ofcapital held by the Government.
(b) Upon this conversion, all buildings and equipment owned or usedby SERG will become state property.
(c) SEEG will be responsible only for, managing the system.
The legal difficulties inherent to these arrangements can be easilyaccommodated within the framework of the Gabonese law.
4.46 This proposal meets the objective for subsector unification,and should result in simplified accounting and billing of electricitythroughout the country. Several major difficulties could arise, however,from the transformation of BERG into a management company owned entirelyby the national Government.
(a) There is a risk that regional/load center-specific inputsneeded for efficient management and planning of subsystemdistribution will be lost if the municipalities are totallyexcluded.
(b) There is a risk that the creation of a publicly-owned monopolyfor electricity supply will not lend itself to efficient andleast-cost supply of power throughout the country. In fact,experience in other countries in Africa and elsewhere showsthat total nationalization of public utilities tends to distortincentives for efficient supply.
(c) Electricity investment is likely to become a heavy burden onthe Government budget, when some elements should be financedfrom other sources, especially by consumers.
(d) 8REG will become subject even further to Governmentadministrative rules (e.g., on staff-related issues) that maynot be appropriate to a commercial, revenue generatingenterprise.
4.47 In light of this, the mission recommends that all proposal forpublic service reforms within the electricity subsector be revised,preferably following a thorough examination of SEEG's financial situationand a management audit of subsector operations (para. 4.52). In themeantime, the mission advises that SEEG's parastatal status bemaintained. Shareholders other than the national government couldinclude the current shareholders, but should most certainly include theLibreville and Port-Gentil municipalities to insure their continuedparticipation in distribution issues. Investment by other entities orindividuals, private or public, could also be encouraged. If this statusis maintained, preferential tariffs for shareholders should beeliminated; instead, shareholders should be the beneficiaries of anyprofit realized from BEEG operations.

- 55 -
8OEG's Finmacial Situation
4.48 A severe cash balance problem caused by arrears and/or non-payment is the most important financial issue for the 8EEG in the shortterm. More than 852 of outstanding billings are attributable to nationaland local services and the national administration (Table 4.8). Althoughthis is not a recent phenomenon, the problem has mushroomed dramaticallysince 1981; by mid-1986, arrears amounted to almost 502 of the yearlybilling. As a result, SK3G's cash flow has decreased from about 40X ofthe .eombined electricity and water turnover in 1980/81 to only 27S in1985. The situation probably is much worse than it appears, since 8BEGowns no capital and pays no depreciation. The expected decrease inelectricity demand coupled with short-term difficulties for the nationaleconomy can only cause the situation to worsen.
Table 4.8: ARREARS PAYABLE ON SEES ACCOUNTS(ml IlIon CFAF)
Cusftos 1981 1982 1983 1984 1985
VIP 548 67g. 1,181 1,950 2,152Oter private 2,250 1,741 1,3t3 t,375 2,046Admlnlstrstlons under thestate budget 2,550 4,207 5,006 3,190 6,442Other eminalstratlons 1,959 2,547. 3,093 3,390 3,381-allpaeli[tles l Wommunitles(LIbr villo & Port-Gentilexcluded) 452 700 298 589 935Total 7,759 9,874 10,891 10,494 14,956tS of yearly billing) (36.4) (38.5) (36.7) (29.6) (32.9)
Source: SEES.
4.49 There are certain structural and operational problems inbirentto the system which contribute to SEEG's financial difficulties. Thedemand on the generating system is relatively small and dispersed; thusdistribution costs, even in the cities, are quite high. The lowgenerating costs of the hydroelectric plants are offset by the highinvestment costs of these plants, arising from difficult-access to thesites. The isolated centers represent a disproportionate fraction of theoverall SEW budget, relative to the size of installed capacity. Becauseit is entirely thermal and highly decentralized, the generating costs ofthis subsystem are more than three times those of the next most expensivesubsystem. It would be difficult, if not impossible, for BUKG to correctthese factors.

- 56 -
4.50 Several options are available to 83G to tackle its firtancialproblems. It has already launched a vigorous collection program forrecovering non-payments from small, private customers. This is only afraction of the problem however, as most of the arrears are attributableto governmental or parastatal bodies. Owing to the structure of thearrearages, the Government could opt to resorb some of the debt. Thiswould be the most politically expedient solution, but could leave S8tC iCan untenable position of financial instability.
4.51 Given the limitations inherent to undertaking a comprehensiv-review of the electricity subsector within a short period of time, themission was not able to explore this problem in more depth. The problemsseem to stem primarily from the financial structuring of SEUG relative tothe Government. It is an issue which should be given a high priority byGabonese authorities, as many questions remain unanswered in thisassessment. The mission recommends that a full examination of SUNG'sfinancial situation ani a management audit of subsector operations beundertaken immediately, the key areas of immediate concern being:
(a) to determine the net finAncial position of SEUG vis-&-vis theGovernment, taking into account direct and hidden subsidies,including Government-financed investments, operationalsubsidies, and preferential tariffs; and
(b) to define a plan for financial and managerial restructuring ofthe subsector (the former possibly by debt-to-equity exchangesor transfer of assets), with the objective of Mi) rectifyingthe financial situation, (ii) strengthening sNUG's accountingsystem to ensure that its accounts totally reflect the rate ofreturn on subsector investments and the economic costs ofgeneration, transmission and distribution, and (iii) optimizingthe level of autonomy exercised by SUNG in order to promoteefficient management and operation of the electricity supplysystem.
4.52 There does appear to be scope also for SNUG to improve itsimmediate cash balance through the reduction of some operating costs.Personnel costs, for instance, represent 451 of SNGC's operatingexpenses. This is a high percentage but can be explained by the capitalintensive nature of SNUG's operations (small outlays for fuel, linked toheavy use of hydroelectric generation) and also by the many non-connecteddistribution points scattered throughowut the system. The missionestimates that 500 MS are sold and 39 customers are served peremployee. 16/ The managerial and supervisory staff account for 401 of
16/ These figures cannot be calculated precisely since employees coverboth water and electricity operations, The mission's estimates are%ade using the assumption that 3/4 of personnel's activities aredevoted to electricity.

- 57 -
the total 2,040. This is partly due to the double staffing of about 50key positions with an expatriate and a national undergoing training. Theexpatriate staff (80 -regular employees) is paid according to the samescale as the nationals, but receives additional benefits for housing,home leave, etc. The additional cost represents about 5 of the totalpersonnel costs. The number of expatriates is being progressivelyreduced, which will produce savings in this area.
4.53 The mission recommends that in addition, all operating costs bereviewed to ascertain their scope for reduction. Other costs should alsobe examined: maintenance costs are relatively high, but in return thereliability of service in the 83G system is excellent. Some reductionin maintenance costs could be achieved without substantially lowering thesupply reliability. Miscellaneous costs included in Salm's budget suchas training (5) and public relations and missions (41) could also bereviewed to determine the scope, if any, for possible reduction. Thecompany is pursuing all effort to bring its operating costs undercontrol.

Tabl Is GABM8 0-MrCA EIIB; oasup
-- -- - -------------------------- - ---- - - -- - - --oo -s
1978 1979 190 191 1982 1983 1984 1985 1966 aI
PETMXRLEM PRODUCTS (000 tons)LPG 5.25 5.57 6.09 6.75 7.29 8.30 8.90 8.90 9.80
TOR equivalent 5.56 5.90 6.45 7.13 7.72 8.79 9.43 9.43 10.38Growth rate (X) 6.10 9.34 10.51 6.29 13.89 7.23 0.00 10.11
*vWs 4.81 4.21 2.91 2.60 2.20 1.70 1.60 1.80 1.30ToR equivalent 4.98 4.36 3.02 2.69 2.28 1.76 1.00 1.86 1.35Growth rate (X) -12.56 -30.71 -10.84 -15.32 -22.73 -5.68 12.50 -27.78
Jet Al 73.00 69.02 68.58 75.02 74.83 70.50 76.30 81.50 73.40TOR equivalent 74.46 70.40 69.95 ".13 76.33 n.91 79.87 83.13 74.87Growth rate (X) -5.46 -0.63 10.25 -1.05 -5.79 11.06 4.09 -9.94
Gasoli. 44.93 45.69 51.17 55.55 56.83 61.70 62.20 65.50 64.70TM0 equivalent 46.23 47.01 52.66 55.10 58.47 63.49 04.00 67.19 00.S8Growth gate (X) 1.69 12.01 4.64 6.12 8.58 0.81 4.99 -0.92.
Kerosene 10.03 8.97 9.68 10.05 10.71 12.00 14.70 15.80 16.60SOg equlialent 10.15 9.08 9.79 10.17 10.83 12.14 14.88 15.99 16.80Growth rgate (X) -10.55 7.80 3.79 6.S8 12.09 22.50 7.48 5.06
Gas oil 161.28 160.28 176.88 204.32 207.20 215.30 221.60 254.70 201.60 1TOE equivalent 161.28 160.28 176.88 204.32 207.20 21S.30 221.60 234.70 201.80Growth rate (X) -0.61 10.35 15.51 1.41 3.91 2.93 5.91 -14.02 us
Fuel oil 6.08 10.22 33.74 29.51 24.31 24.50 30.40 38.10 28.60 1TOR equlvalent 5.89 9.91 32.70 28.59 23.56 23.74 29.46 36.92 27.71Grofth rate (X) 08.27 230.11 -12.56 -17.00 0.78 24.08 25.33 -24.9
TOTAL 305.37 303.96 349.06 382.36 383.36 394.00 417.70 446.10 396.20TOe equivalent 308.55 306.94 351.45 385.12 386.39 397.13 420.89 449.22 399.48Growth rate (S) -0.46 14.84 9.54 0.26 2.77 6.02 6.80 -11.19
BLRenCTBZZ COWh)Total to Internl System 491.20 534.80 506.50 611.80 667.20 729.00 79.10 861.00 875.00
TOR equivlent 42.24 45.99 48.72 52.61 57.38 62.69 68.38 74.05 75.08Growth rate (S) 13.91 8.88 5.93 8.00 9.06 9.26 9.07 8.29 1.39
TOTAL CO 005I (000 TOR) 350.79 352.93 400.17 457.74 44S.77 459.8 489.27 523.27 474.56percent chane 0.61 13.59 9.39 1.3# 3.42 6.40 6.95 -9.31
aI Prelimiary estiotes.
Source: Mlislsi estimtes, DoE, SE,
Table 2s AlUll AJIAL CROT-( per year)
76-61 79-82 80-63 81-84 82-85 78- 79-85
sled 9.18 7.96 8.06 6.85 8.92 9.05 8.22Pet Prod 7.97 6.04 6.85 4.05 3.96 5.08 5.39Total 7.79 6.19 0.94 5.20 4.59 5.96 5.68
_______________---- - - - - - -- - - ______ ____________

59 - bnu Annex 2
INWESTMENT EXPENDITURES FOR PETRDLEUM EXPLORATION, 1977-1985(In a I IIon CfAF)
GULF VAULAR ELF SHELL INA BP BUNRAH AMOCO TENNECO ASIP CONOWO TOTAL
1977 15,260 2,258 17,5181978 699 13,482 2,290 164 590 17,2251979 2,487 18,612 924 3,845 766 3,266 29,9001960 1,49 125 21,465 1,644 3,197 3,700 3D,600i961 1,013 33,056 700 4,0Q7 7,852 6,524 33 53,1521982 58 43,799 1,943 2,962 7,623 268 2,404 59,0571983 369 36,330 3,906 2,512 1,824 1,385 123 46,4511984 32,733 13,006 3,816 11,239 8,952 1,104 70,8501965 33,290 12,700 1,611 7,454 36,794 467 92,316
Sources DO.
<

- 60 -
AuLe: 3
6A90N - WELL CRILLINW HISTORY, 1976-1985
WeiIs drliled _Htor IrIllIed Dry HolesYear Exploration Davelop.ant Exploration Development Total Exploratlon Deveolopmnt
1976 16 24 36,117 65,452 101,569 12 21977 17 13 40,132 39,239 79,362 1S 11978 15 15 35,155 33,160 68,315 10 21919 21 16 50,141 43,036 -93,177 13 21980 16 24 35,543 52,485 88,028 8 21981 27 41 69,113 90,262 159,375 20 71982 20 40 43,702 85,937 129,639 11 51983 18 33 36,716 70,062 106,798 10 11984 22 20 53,026 42,366 95,392 18 21985 31 16 77.279 40.191 117.470 27 2Total 203 22 476,924 562,201 1,039,125 144 26
RATIO 71% 11%
Source: 0GH.

- 61 -
INVESlNENT EXPENDITURES FOR PETROLEUM OEVELOPfENT, 1976-1965(ml I Ion CFAF) I/
ELF SHELL ANOCO TOTAL
1976 10,708 314 11,0221977 6,642 537 7,1791978 19,105 1,769 20,8741979 16,941 8,000 24,9411960 34,271 15,662 49,9331981 84,060 10,767 94,8271982 76,497 t0r18ss 7,462 94,1171963 65,515 22,346 33,460 141,3211984 51,625 17,533 20,421 89,5791985 46,954 32,896 8,962 88,832
a/ Averag y.p*jy exchange rates:1980 $1 3 211 CFAF1961 S1 a 272 CFAF192 51 * 326 CAF1963 51 a 380 FAF1984 S1 - 436 CFAF1985 S1 a 450 CFAf
Source: 06H

- 62 -Annex 5PaSe 1 of 3
NATURAL GA8 UTILIZATION VEASIBILITY SUWDY
DAFT TlIM OF REFIREIC
I. Reserve Evaluation
A. Review existing data to estimate the size of reserves by field.
B. Estimate investment requirements to appraise and develop thosereserves under different scenarios of reserve and productionlevels. (Alternatively, this could be undertaken in theengineering study under Part III.)
{I. Cas Market and Pricing Study
A. Market Survey
1. Industrial-Power Market
Investigate the present fuel consumption of the largeindustrial consumers within the supply zone. (Largeindustrial consumer is defined as a consumer with annualfuel consumption of about 2 million liters of fuel oilequivalent per year or more.)
The following information and data should be investigatedand gathered from the large industrial consumerst
(a) name, location, ownership;
(b) raw material and product; type and quantity;
(c) present fuel: heating value, price (specify any excisetaxes);
(d) storage capacity;
(e) type and general technical specification of the fuelconsuming equipment, i.e., boilers kiln, diesel engine,turbine, etc;
(f) fuel consumption: yearly, average daily, maximum daily,maximum hourly;
(g) specify the seasonal consumers, such as sugar factoriesand period of work;
(h) future expansion plan.

- 63 -
Annex 5Page 2 of 3
For medium sise and small industrial consumers, the aboveinformation should be provided for each category ofconsumer, such as brick kiln, foundries, workshops, etc.
2. Commercial and Household Sectors
(a) identify cities and townships within the supply sone,by location, population, general layout, type of housesand commercial units and development plante
(b) temperatureS mean maximum, mean minimumt seasonalchanges, degree days of heating and cooling;
(c) type of fuel and consumption of each sector; specifyLPG;
(d) breakdown of household consumption, i.e., spaceheating, water heating and cooling;
(e) determine the number of potential commercial gasconsumers by group, such as bakeries, hotels, etc; and
(f) number of LPG consumers.
B. Consumption Estimates
1. Using the data from the market study and considering thetechucial feasibility, conversion costs, time required forconversion, the value of gas ("net back"), and minimumreserves to cover project or plant life, estimate thepotential for gas consumption (a) for presentindustrial/power consumption and (b) industrial expansionand potential commercial and household consumption.
2. Also investigate the scope for use and the value of naturalgas as a transport fuel or feedstock for production ofammonia/fertilizers and petrochemicals, includingpreliminary estimates of attending investments required.
C. Pricins
1. Review the existing pricing structure for natural gas andcompeting energy resources.
2. Upon completion of the engineering study, recommend inbroad terms a natural gas pricing structure, taking intoaccount development and delivery costs, costs ofconversion, service connection and costs of competing
-- A* 01MPW.I._ a

- 64 -
Annex 5Page 3 of 3
III. Preliminary Engineering Design and Cost Estimates
A. Prepare a broad description and cost estimates of natural gasgathering, transmission, processing and separation and majordistribution systems (i.e., pipeline to industrial grid andspurlines to city gate station(s)), consistent with reservescenarios proposed in the reserve study and the market survey.
B. Estimate the unit and, if possible, marginal costs ofproducing, transmitting and distributing the gas for variousscenarios of reserves. s
C. Outline the steps required in implementing such investments.
IV. Feasibility Analysis and Recommendations
A. Evaluate the impact of the gas as a new source of energy in theoverall energy supply-demand context.
B. Analyze the petroleum products supply-demand situation beforeand after gas substitution and present a solution, i.e., byaxporting the excess petroleum products and/or changing therefinery's product pattern.
C. If justified, recommend an action plan for developing the gas,including an analysis of provisions concerning gas andcondensate in existing production sharing contracts andappropriate price levels for the gas to induce a commercial oilcompany to develop and produce the gas resources.

@mOU a 60A PET? 1*73-1965
----- -- ---- … ------ - ----- -…-------------------
1975 1976 1977 1978 1979 1980 1961 1982 1983 19S4 1985
V 000 tos) 906.27 980.97 644.64 970.72 743.20 794.36 689.63 616.88 519.91 580.65 642.47
1R3.BW P0OWCTS ('000 uS)LPG ('000 tons) 4.99 5.S6 3.97 5.80 S.14 4.69 4.5S 5.25 3.n9 5.64 7.30Ton equivalent 5.29 5.68 4.20 .14 3.32 4.96 4.82 5.56 4.16 5.97 7.73
Gasoline - Rgular 12.11 119.26 100.29 103.97 72.75 37.06 32.26 24.99 13.75 15.40 10.94Ton equival.nt 88.08 63.96 70.61 73.19 51.22 26.09 22.71 17.59 9.66 10.84 7.70TMN equivalent 90.63 66.39 72.65 75.32 52.70 26.84 23.37 18.10 9.96 11.15 7.92
Gasoline - PZMde 53.92 70.78 63.46 78.12 68.30 67.14 67.02 57.51 59.54 64.37 74.03Ton equivalent 39.S6 51.67 46.33 57.03 49.86 49.01 48.92 41.98 43.46 46.99 54.04TOR equivalent 40.50 3S.17 47.67 58.68 51.31 50.44 50.34 43.20 44.72 48.35 55.61
werose 121.26 130.94 108.97 131.06 113.40 101.60 110.93 113.73 85.51 102.62 109.87Ton equivalent f .52 104.23 86.74 104.S3 90.26 80.87 88.30 90.53 68.06 81.68 87.45TOE equlvalent 97.20 104.96 87.35 105.06 90.90 81.44 88.92 91.17 6.854 82.26 88.07
Jet ATon lequvalent 0.00 0.00 0.00 0.00 0.00 0.00 0.00 0.00 0.00 0.00 ' 0.00TOR equivalet 0.00 0.0 0.00 0.00 0.00 0.00 0.00 0.00 0.00 0.00 0.00°.°
Eaptba 0.88 15.71 11.45 12.27 17.69Ton eSivalent 0.00 0.00 0.00 0.00 0.00 0.00 0.64 11.42 8.32 8.92 12.86603 equvalent 0.00 0.00 0.00 0.00 0.00 0.00 0.66 11.76 8.57 9.18 13.23
0a 011 271.51 291.00 263.52 304.33 214.26 222.21 268.57 23O.70 212.65 229.47 265.34TM equivalent 233.50 250.26 226.63 261.72 184.26 191.10 230.97 198.40 182.88 197.34 226.19TO equivalent 23S.50 250.26 226.63 261.72 184.26 191.10 230.97 196.40 182.88 197.34 228.19
11 0au 391.45 480.64 361.31 395.3S 325.92 321.25 261.50 220.39 17.22 193.61 210.90Ton equvalent S52.31 432.58 325.17 355.62 293.33 289.13 23.35 19S.35 154.10 174.24 189.81TM3 equIvalent 341.39 419.17 315.09 S44.60 *84.23 280.16 228.05 192.20 149.32 168.84 183.92
8It ('000 taOn) 0.52 5.36 13.03 7.44 3.74 7.66 5.70 10.91 12.25 10.54 8.23STE equivaLen
Ten equivalent 615.28 9S3.42 772.47 865.13 675.81 648.57 437.15 574.43 482.68 536.21 595.58TON equivale 808.50 919.63 753.59 851.52 666.72 634.95 627.13 560.38 468.1S 523.10 584.68
IN r OSWWT!ON('000 taO) 51.'2 39.03 50.02 35.74 37.42 26.32 23.14 22.47 27.67 28.00
LOM83 ('000 tons) 39.2* 47.55 33.15 55.56 S1.66 108.37 26.17 19.32 14.76 16.97 18.89in percent of tlxousbput 4.33 4.85. 3.92 5.72 4.26 13.64 3.79 3.13 2.84 2.92 2.94
aI To Ausuat 31, 1986
Sour8e, misson estunte, Ml:, DOB.

- 66 -
Annex 7
BEICIP SCENRIWOS FOR PETROLEUM PROCUCr DEMAND
Table 1 DENMA PROJECTIONS FOR PETROLEUM PRIOUCTS -HIGH AND LOW GROWfi 3CENARIOS
1988 1995Product Unit 1963 Hlgh Low High Low
LPG t 8,313 12,200 10,940 19,600 15,510Resular 4 PremlumGasoline .) 81,777 110,000 93,500 130,000 103,000
Aviation Gas .3 2,422 2,000 2,000 1,500 1,500Jet Fuel M3 88,180 97,000 86,000 122,000 88,000Kerosene .3 16,000 17,850 18,450 16,000 16,350Gas o1 .3 254,500 286,600 234,600 385,400 294,800.Fuel OfI t 24,463 40,800 31,400 53,000 40,000Bitumens t 9,894 15,000 12,000 21,000 17,000Lubrifeicants t 8,935 10,000 8,500 12,000 10,040
Source: EEICIP.
Table 2: OEMAND PROJECTIONS FOR PETROLEUM PROUCTSMEDIUM GROWTH SCENARIO
Product Unit 1983 1965 1988 1990 1992 1995
LPG t 8,313 9,700 12,200 13,600 15,200 17,560Regular and Premium
gasolIne .3 81,777 92,000 110,000 114,500 119,100 126,500Aviation Oas *3 2,422 2,250 2,000 1,850 1,700 1,500Jet Fuel .3 88,180 91,600 97,000 99,200 101,500 105,000Kersesne 3 16,000 16,700 17,850 17,350 16,900 16,200Gas OfI .3 254,500 258,050 288,600 302,500 317,000 340,100Fuel OfI t 24,463 30,000 40,800 42,600 44,500. 47,900Bltumens t 9,894 11,700 15,000 16,050 17,200 19,000Lubriflcants 1 8,395 9,000 10,000 10,300 10,600 11,000
Source: BEICIP.

- 67 -
Annex 8Page 1 of 2
PETLEUM PRWJCT DEMAND AND INVESTMENT REQU I REMNTS
Table I- DEND EPrAJECTIMNS FOR PETROLEUM PRIFUCTSLOW GROWTH SCENMARIO
Prodct Unit 1988 1990 1992 1995
LPG t 10,940 12,100 13,350 15,510
R"ular and PremiumgasolIne 02 93,500 96,100 98,600 103,000
Aviation On .3 2,000 1,850 1,700 1,500
Jt Fuel M. 86,000 86,600 87,100 88,000
Kerosene .3 18,450 17,800 17,200 -6,350
on owI .3 234,600 246,750 264,300 294,800
Fuel Oil t 31,400 33,650 36,050 40,000
Bitummns t 12,000 13,250 14,600 17,000
Lubr ficfnts t 8,500 8,900 9.,300 10,000
Sourcet BEICIP.

Table 2: ESTIMATED STORAGE REUIIETS FOR SECtRITy INVENTOtyAND RESERVE INVENTORY
aquired Daily Practical Needed Extra Extra Storap Extra StraepSwe ity Peak Security Avallable Storage for 30 dap needed for 25 days needed forInventory V*oIm Invntoy Capacity Security Inv. Inventory 30 doa lnventory 25
(day) (.3/da) (a') Ce') (a) (MP) Cm') (GP) cm)
G6sol Iees 16 305.0 4,010 2,435 2,445 9,150 7,386 7,675 5,964Kerosene 16 50.0 600 - - 1,5 - - -
Jet 16 426.0 6,.$48 760 - 12.840 6.116 10,700 3.487Gas oil 16 472.0 7,5S2 5,925 - 14,160 9.03 11,800 6.S52Fuel 011 21 125.5 2,635 3,000 - 3,M75 841 3,125 137
iarmGasol Ines 9 25.5 229 255 - 765 561 637 420Kerosene 9 18.5 166 125 47 555 473 462 370Gas 01I 9 119.5 1,075 1,190 - 3,565 2,634 2,98 1,976
Ni'diolGasolInes 10 31.4 314 1,305 - 942 - 765 -Kerosene 10 21.6 216 535 - 648 124 540 - enGas Ol 10 113.0 1,130 6,715 - 3,390 - 540 -
NosadaGasolin s 9 37.4 336 1,435 - 1.122 - 935 -
Kerosene 9 14.4 129 - - 432 - 360 -
Jet 9 22.1 199 475 - 663 - 552 -
ans Oi 9 174,7 1,572 1,935 - 5,241 3,636 4,367 2,675
Gas OfI 25 8.1 202 250 - 243 - 202 -
Port-Gentl I I l
Gasoli Ines 9 106.0 954 1,435 - - - - - OSKerex"3n 9.5 48,4 460 ---- :__aJet 9.5 36.3 344 2,660 - - 4!Gosn o 7 653.0 4.571 7,645 - - - - -
i'S 60 3t00 0 1,600 300 2, 17,30 - -
Source: Nisslon estleates, iEICIP, DON.

- 69 -
Annew 9Page i of 5
RESIOAL PETROLEUM PROUCT PRICE STRUCTtR
Table 1: PRICE STRUCTURE FOR PROOUCTS PASSING THROUGH THE GAMBA DEPOTApril 10, 1986
(CFAF/hI)
Premium Regular Kerosone Gas O1I
1. Base Price Ex-Port-Gentil 26,607.00 26,307.00 7,607.00 13,707.002, Port-Geetil Hfrbor Fee 225.00 45.00 45.00 45.003. Tax on f2 (8%) 18.00 3.60 3.60 3.604. Port Tax 100.0Pi 100.00 100.00 100.00So Transport P4-Gaiba 1,408.00 1,408.00 1,408.00 1,406.006. Tax on 15 (6%) 112.64 112,64 112.64 112.647. User Fee - Gamb depot 354.00 354.00 354.00 354.006. Tax on 17 (8%) 26.32 26.32 26.32 26.329. Discharge/unloading 50.00 50.00 50.00 50.00
10. Equalization Subsidy/rax (1,495.96) (I.291.56) (1,401.56) (1,207.56)
iI. Price ex-amba Depot 27,607.00 27,117.00 8,307,00 14,607.0012. Delivory charge 225.00 225.00 225.00 225.0013. Tax on 112 (6S) 18.00 18.00 48.00 18.0014. Retall margin 6850.00 850.00 6 50.00
15. Retail price 26,700.00 26,210.00 9,400.00 15,700.0016. Price per lIter 287.00 262.00 94.00 157.00
Source: Directlon 08n6rale des Caisses de Stabillsation et de Pbr6quation.

- 70 -
Annex 9Page 2 0f 5
Tale 's PRICE STRUCTUE FOR PRODUCTS PASSING THROUGH TE SECONDARY DEPOT OF LANBAMNEAprIl 10, 1986
(CFAF/hI)
Premium Regular Kerosene GM f11
1. Base Price Ex-LBV/POB 26,607.00 26,307.00 7,607.00 13,707.002. Port-Gentil Harbor Fee -223.00 45.00 45.00 45.003. Tax on f2 (8O) 18.i0 3.60 3.60 3.604. Po"t Tax 100.00 100.00 100.00 100.00So Rlver Transport 1,072.50 1,072.50 1,072.30 1,072.506. Tax on J5 (8$) 8.080 83.60 86.80 85.807. CNI Tax on J5 & 16 (2%) 23.16 23,16 23.16 23.168. User Fee - Lsmbar6n6 303.88 303.U8 303.88 303.889. Tax on J8 (8%) 24.31 24.31 24.31 24.3110. Discharge/unloading SO.OO 50.00 50.00 50.0011. Equalization Subsidy/Tax (1.202.65) (1,148.25) (1,208.25) 1008! 2S)
12. Price ex-Lambar6n6 depot 27,307.00 26,817.00 8,107.00 14,407.0013. Delivery charges (to city) 223.00 225.00 225.00 225.0014. Tax on J13 (8%) 18.00 18.00 18.00 18.0015. MunicIpal Tax 250.00 250.00 2SO.00 250.0016. Retail margin 850.00 85000 859icO
17. Retail price 28,850.00 28,160.00 99,500.00 15,800.0018. PrIce per liter 288.00 282.00 94.50 138.00
Source: Direction G&6hrale des Cesies de Stabilisatlon et de P6r6quatlon.

- 71 -
Annex 9Pag8 3 of S
Table 3: PRICE STRCTWE FOR PRPDCT PASSIN TROM T MAYIJIA DEPOTApIl 10, 1986
(CFAFAIl)
Premlum agular Kerosene an off
1. a Pric Ex-Pbort-Gotil 26,807.00 26,307.00 7,607.00 13,707.002. Plort Awtil Harbor Fee 225.00 45.00 45.00 45.003. Tax on 12 (8S) 18.00 3o00 3.60 3.604. Pnrt Tax 100.00 100.00 100.00 100.00S. Transpot PiB-Msyubat 1,408.00 1,408.00 1,408.00 1,408.006. Tax on nS (8O) 112.64 112.64 112.64 112.647. User Fee - Nayuwba depot 553.12 553.12 553.12 553.128. Tax on f7 (8S) 44.24 44.24 44.24 44.249. Dischwr/unloadIng 50.00 50.00 50.00 50.00
10. EqualizatIon Subsidy/TaxNaysab (1.711.00) (I .La.A5 (1,516.60) (1,516.60)
il. Price Ex-NsayubM Depot 27,607?e0 27,017.00 8,407.00 14,50?.0012. Delilery charges to cIty 225.00 225.00 225.00 225.0013. Tax an #12 (8S) 18.00 18.00 18.00 18.0014. Retall margin 850.00 850.00 - 850.00 850.00
15. Retall price 28,700.00 28,110.00 9,500.00 15,600.0016. Price per lIter 287.00 281.00 95.00 156.00
Souros Direction Gb6Arale des Calses de Stabillsatlon et de Pir6quatlon.

- 72 -
Annex 9Page 4 of 5
Table 4: PRICE SlRUClEM FOR PRCCUCTS PASSING THFOUSO THE NDJOLE MEPOTApril 10, 1986
(CFAFAIi)
Premium Rsgular Kerosene Gas 01I
1. Base Price Ex-Port-Gentil 26,807.00 26,307.00 7,607.00 13,707,002. Port-Geatil Harbor Fee 223.00 4S.00 45.00 45.003. Tax on f2 (6%) 18.00 3.60 3.60 3.604. Port Tax 100.00 100.00 100.00 100.005. Rlver Transport 1,518.00 1,518.00 1,518.00 1,516.006. Tax on nS (8%) 121.44 121.44 121.44 121.447. CNI Tax on J5 + J6 (2%) 32.79 32.79 32.79 32.796. User Fee - NdJol6 303.88 30388 303.88 303.869. Tax on Os (6%) 24.31 24.31 24.31 24.3110. Dlscharge/unloading 50.00 50.00 50.00 SO.OO11. River Equalizatlon
Subsidy/Tax (1.593.42) (1.589.02) (1,599.02) (1,399.02)
12. Price Ex-NdJol6 depot 27,607.00 26,917.00 8,207.00 14,507.0013. DOelivery chargs 225.00 225.00 225.00 225.0014. Tax on J13 (8%) 18.00 16.00 16.00 16.0015. Retail margin 865000 850.00 850.00 650.00
16. Retall prIce 28,700.00 26,010.00 9,300.00 15,600.0017. Price Wer Itter 287.00 280.00 93.00 156.00
Source: Direction 06n6rale des Calses de Stebillsetlon et de P6r6quation.

- 73 -
Annex 9Page 5 of 5
Table si PRICE SlRWTUSE FOR PACDUCTS FROM MHANDA DEPOT THROUBH NDJOLEApril 10, 1986
(Cf0A/hI)
Premium Regular Kerosene Gas Oil
1. Cost Price (Ndjo*1) 27,607.00 26,917.00 8,207.00 14,507.002. TranspGrt NdJoi1-6oande 4,403.00 4,403.00 4,403.00 4,403.003. Tax on J2 (8O) 352.24 352.24 352.24 352.244. Losses In transit (on 01+2+3) 293.19 286.54 100.22 100.315. Financlal charge on security
stocks 13U t 60 JHT 566.24 550.92 213.30 349.946. Customs credit tax (5s) 10.02 10.02 3.347. User Fee - Moanda depot 400.90 400.90 400.908. Tax on J6 (8$) 32.07 32.07 32.07 32.079. Retail margln 850.00 850.00 850.00 850.0010. EqualIzatlon Subsidy/lax (6.157.46) (5.935.69) (5.505.07) (5.740.13)
11. Price ex-Moande depot 28,357.00 27,847.00 9,057.00 15,257.0012. Transport (depot to city) 225.00 225.00 225,00 225.0013. Tax on Jll (8S) 16.00 18.00 18.00 18.0014. Municipal Tax 2SOtO0 250.00 250.00 250.00
15. Retall price 28,850.00 28,360.00 9,550.00 15,757.0016. Price per liter 289.00 283.00 95.50 158.00
Souree: Direction O6nerale des Calsses de Stabillsation et de P&r6quatlon,

74 -
Annex 10Page I of 3
PETROLEUM PROCDUCT TRANSPORt COSTS
Table 1: REIMJRSBEM NT fROM THE NDJOLE DEPOT(CFAF/ lIter)
Transportcosts Resimburseoent
Towards: Dlstance (T.T.C.) Premium Regular Kerosene Gas OfI
(Km)
Akleni 623 62.44 60.01 58.01 58.51 60.01Aye 113 11.29 7.86 7.86 7.36 8.86
Site. 383 38.26 34.83 34.63 34.33 35.83
saue 247 24.68 21.25 21.25 20.75 22.25Franceville 536 53,53 51.12 49.12 49.62 51.12
Koulamoutou 364 38.36 36.93 36.93 34.43 35.93Lastourville 353 35.26 32.63 30.83 31.33 32.3Makokou 351 35.06 31.63 31.63 31.13 32.63Mekambo 526 52.S5 49.12 49.12 48.62 50.12MInvoul 423 42.26 37.83 38.63 38.33 39.63
mltzlc 190 18.98 13.5S 13.5S 15.05 16.55
Moends 476 47,55 60.75 58.53 54.25 S6.66Mougnue 462 46.15 43.72 41.72 42.22 43.72
OYeM 308 30.77 27.34 27.34 26,84 28.34
Source: WFBP.
Table 2: REIIMJRSEMENT FROM THE MAYUMBA DEPOT(CAF/I Iter)
Transportcosts Reimbursement
Towards: Distance (T.T.C.) Premium Regular Kerosene Gas Off
(Km)
Mibombe 239 23.88 21.45 21.45 21.45 21.45Mblgou 325 32.47 30.04 30.04 30.04 30.04Mimongo 347 34.67 32.34 32.34 32.34 32.34Noabi 204 20.38 17.95 17.95 17.95 17.95Moulla 280 27.97 25.54 25.54 25.54 25.54Ndende 204 20.38 17.95 17.95 17.95 17.95Tchlbanga 114 11.39 8.96 8.96 8.96 8.96
Source: WSP.

- 75 -
Annex 10
Paa-e 2 o f 3
Table 3: REINFURSEtT FOR TRANSPORT FROM THE OEPOTS AT MBINDA AND NOANDA(CPAF/I iter)
TransportFrom MBINDA costs ReimburseMenttowardst Distance (T.T.C.) Premium Regular Keroseno Gas Oil
(Km)
otanda 104 10,39 t8.06 18.05 14.62 15.95Cami log 104 10.39 6.79 6.09 6.89 6.89
From NOANDAtowards:
Akieni 149 14.89 11.46 11.46 10.98 11.46Sakumbe 53 5.49 2.06 2.06 2.06 2.06Somacngo 169 16.C8 13.45 13.45 12.95 13.05Fronceville 60 5.99 2.65 2.65 2.15 2.65KoouIamutow 193 19.28 15.8s 15.85 15.35 15.85'astourvI I Io 123 12.29 8.86 8.66 6.36 8,36Lekonu IB 15.78 12.35 12.35 11.85 12.35Soasbo SO 5.59 2.16 2.16 1.66 2.10
oMunano 20 2.00 (1.43) (1.43) (1.93) (1.43)"vengue 45 4.50 1.07 1.07 0.57 1.07
OkoudJa 248 24.77 21.34 zt .34 20.84 21.34Pane 283 28.?? 24.84 24.84 24.34 24.84
Soureet WBP.

- 76 -
Annex 10Page 3 of 3
Table 4: REINBURSEMENT FROM THE LNMAENE DEPOT(CFAF/IIter)
Transportcosts RAembursement
Towards Distance IT.T.C.) Preuium Regular Kerosene Gas Oil
(Km)
Foegamom 92 9.19 5.76 4.76 3.76 5.76
Mebamba 310 30.97 27.54 26.54 25.54 27.54MandJI 170 16.98 13.55 12.55 11.55 13.55
Mayumbs 477 47.65 44.22 43.22 42.22 44.22Mblgou 397 39.66 36.23 S5.23 34.23 36.23Mimongo Yeno 419 41.86 38.43 37.43 36.43 38.43Mlocngo Mbigou 475 47.45 44.02 43.02 42.02 44.02Moabl 291 29.07 25.04 24.ei4 23.64 25.64Moula 200 19.98 16,55 15.55 14.55 16.55Ndende 273 27.27 23.84 22.84 21.04 23.84Slndare 97 9.69 6.26 5.26 4.26 6.26Tchibanga 363 36.26 32.83 31.83 30.83 32.83
Source: IIBP.
Table 5: REIMBURSBENT FROM THE LIBESVILLE DEPOT(CFAF/liter)
Transportcosts Relmbur_sat
Towards: Distance (T.T.C.) Premlum Regular Kerosene Gas Off
(K)
Lambardn6 235 23.48 20.26 22.16 21.96 20.56Medouneu 218 21.78 10.85 10.75 9.55 10.15NdJol6 224 22.38 18.16 20.06 19.86 18.46
Source: WBHP.

-77-.
Annex 11
PRICE STRUCTEIRE .R BUTANE SOLD IN LIEEVILLE AND PORT-GENTIL"ercb 18, 1985
(CFAF/l)
1. Ex-reflnery price 99,000
2. LandIng Tax l,000
3. Dishehwr fie (2% of 1 + 2) 2,000
4. Entry duty (25% of 91) 24,730
5. Tax 10% of 91 and f4 12,375
6. "Taxe ocmpl6mentalren 5% of 11 4,950
?. Customs tax 0.8% of #1 792
8. Tresury tax 2% of 4, 5, 6 nd 7 86
9. Depot Users Fees 25,378
10. Tax S%ot f 9 2.030
11. Exit price at 46p8t 172,361
12. Bottle malntenance 34,363
13. Amortization of bottle oosts 34,320
14. Transport to city 9,781
15. Tax on transport to city 8% of 114 782
16. General charges 18,405
17. Financlot charges 1.2% of #4, 5, 6, 7 end 8 515
18. Profit 17,500
19. StabiIlzatIon subsidy 5,953
20. Wholesale price 294,000
21. RetaIl margin 26,000
22. RetaIl price per ton 320,000
23. Retail price per 12.5 kg bottle 4,000
Source: WBP,

-78 -
Ann" 12Page~ 1 of 3
ELECTRICITY SYSTEM DATA
Table Iv SIJSARY Of BASIC DATA
1975 1980 1985
Installed capeclty (14) 101.1 209.0 251.9Hydro 47.7 121.8 163.6Thermal 53,4 67. 88.1
osneration (0Mb) 253*0 566.5 461.3Hydro 143.3 415,l 667.7Thermal a/ 109*7 150.7 193.6
Losses 36.6 6864 104.4
Sales (MAPi) 216.4 498.1 756.9NV and WV 122.2 309.5 398.4LV 94.2 188.6 358.5
Custneurs 19,390 33,100 58,506N and MV 172 310 360LV (Total) 19,218 32,790 58,146
Residential 18,425 31,860 56,652Public Lighting 157 185 536Industrial 636 76'. 956
a/ Including purchases from Shell 6ambs (2.3 GNh In 1985).
Source: SEEG.

Table 2: MAIN POdER SYSTM CHARACTERISTICS, 1985
LIbreville Port-4entil FrancevIlle centers Total
AvIleable capacity 1' 0W) 168 57 48 5 285
Hydro 126 b/ 0 38 0 161
Thermal 42 57 10 15 124
1985 Peak Load ON) 87 26 25 8 cS -
Not Generation COMh) 531 158 137 35 861
Hydro 530 0 137 0 668
Thermal 0 158 0 35.d/ 194
Sales (COh) 461 e/ 146 119 31 _/ 757
HV & Y 211 75 104 7 398
LV 250 70 14 24 358
Number of customers 37,968 8,845 3,059 8,633 59,56
HYSNW 252 44 42 21 360
LV 37,716 8,801 3,017 8,612 58,146
Average Oemand Growth1982 to 1985 (S/yr) 10.2 4.0 7.4 20.8 8.9
a/ In October 1986.b/ Only 108 MM are available In dry yars.
c/ Sum of Individual peak loads; not occuring simultaneously.
d/ Including 2 GMh purchased from SHELL.
!/ Figures for N'Toum Included under Libreville totals.
Source: SEES.Io

Table 3: INSTALLED CAPACITY AND GEtERATION
1975 1976 1977 1978 1979 1980 1981 1982 1983 1984 1985
Total InstalIId CapacIty OW) 101.1 106.1 162.4 167.0 167.6 209.0 219.2 221.0 228.4 239.5 251.9Hydro 47.7 52.3 57.0 76.2 76.2 121.8 121.8 121.6 131.4 141.0 163,8Thermal 53.4 53.8 105.4 90.8 91.4 87.2 97.4 99.2 97.0 98.5 88.1
Total o.n.ration (GWh) 253.0 327.8 431.2 491.2 534.8 566.5 6t1.8 667.2 729.0 795.1 861.3Hydro 143.3 161.8 299.4 348.0 369.5 415.8 459.5 502.9 546.5 612.9 667.7Thermal 109.7 166.0 131.8 143.2 135.3 150.7 152.3 164.3 182.5 162.2 193.6
UBV Installed Capacity 05) 50.8 50.8 50.8 70.0 70.0 115.6 115.6 113.2 113.2 113.2 129.4Hydro 38.4 38.4 38.4 57.6 57.6 103.3 103.2 103.2 103.2 103.2 126.0Therami 12.4 12.4 12.4 12.4 12.4 12.4 12.4 10.0 10.0 10.0 3.4
LEV Generation (OWh) 131.8 164.4 250.5 293.9 313.4 328.7 367.2 396.2 434.9 483.2 442.3Hydro 128.2 161.3 241.2 283.5 309.6 326.7 356.4 396.0 4315 482.9 530.4Thermal 3.6 3.1 8.6 10.4 3.8 2.0 1.8 0.2 3.4 0.3 0.3
P06 Instel led Capacity a;/ ON) - - - 56.8 59.8 62.8 62.8 62.8 62.8 61.3 59.8Generation b/ (6Wh) 98.0 104.0 114.0 117.8 111.7 123.8 128.4 140.2 148.5 151.9 157.8
FCY Install d CapacIty 0NV) - - - - - - 31.2 33.8 42.0 51.6 47.8Hydra 9.3 18.6 18.6 18.6 18.6 18.6 18.6 18.6 28.2 37.8 37.8Thermal - - - - - - 12.6 15.2 13.8 13.8 10.0
FCV GeneratIon (CWh) - - - - - - 99.2 110.6 121.3 130.7 137.3Hydro 14.8 51.9 58.1 64.5 79.9 89,0 94.2 106.9 115.0 129.9 137.3Thermal (2) (2) (2) (2) (2) (2) 5.0 3.7 6.3 0.6 0.0
DER Install d Capacity a/ 0(N) - - - - - - 8.6 8.6 10.7 13.4 14.9Generation (GWh) 6.2 6.8 8.2 11.5 12.9 14.3 16.2 19.2 23.0 27.2 33.3
a/ All thermal.bJ Included In DER.
Source: SEE8.

CHARACTERISTICS OF INSTALLED HYDRO AND THERNAL iPLANT
Number Total Unavailability rates u/of Unit Installed Cammissioning Main- Forced
System Name Type of Units Units rating capacity Years tauance Outages Total
0N) Oi) (S) (S) (S)
lUY KINGELE ilydro 2 9.6 19.2 72 - 73 4.4 0.7 5.1
2 19.2 38.4 75 - 78 3.7 0.6 4.3
TCHlIRLE Hydro 3 22.8 68.4 80 - 85 3.6 1.6 5.2
OSANDA S.T. 2 20.8 41.6 86 - - -
POO Q 6.T. 2 20.9 41.8 77 7.2 0.6 6.0 co
- Diesel S b/ 3.0 15.0 69 - 76 2.7 2.7 5.41
FCV POUBARA I Hydro 4 4.64 18.56 75 - 76 3.9 O.S 4.3
POUBARA 2 Hydro 2 9A6 19.2 83 - 84 2.0 5.3 7.3
NOYABI Diesel 5 2.2 11.0 77 - - -
Dlesel 2 1.4 2.8 65 - 66 - - -
DER - Diesel - - 15 - - - -
a/ Neon value from ocumissioning to end of 1965 for hydro plants and meen value for 1985 for therml pisants.
b/ Six twin units out of which two have only one motor left avaltable,
Source: SEES.

ELECTRICITY EMEAPO: 1960-1965(oh)
Average Annual Srowtb1980 1981 1962 1963 1984 1985 80-85 82-85 84-85
(S) (M) (O
Total 496 533 S6u 639 697 757 8.7 8.9 8.6MV 309 332 347 367 383 399 5.2 4.8 4.2LV 189 201 229 273 314 358 13.6 16.1 14.0
Libreville 274 296 325 359 400 442 14.6 10.8 10.5mV 141 158 164 173 185 196 6.8 6.1 5.9LV 133 137 161 187 215 246 13.1 15.2 14.4
Port-Soothl 114 117 129 133 140 146 5.1 4.2 4.3 coNV 76 14 75 76 75 75 -0.3 -0.1 0.6LV 38 43 53 57 65 70 13.4 9.8 7.7
Francevile 81 91 100 110 114 119 6.0 5.7 3.7NV 74 83 91 100 103 104 7.2 4.5, 1.4LV 7 a 9 10 11 14 11.0 16.1 24.5
Isolated Cnteis 29 30 33 37 43 50 11.5 15.4 16.6MV 18 17 17 18 20 22 4.3 9.6 10.3LV 11 13 16 19 23 26 20.2 21.0 23.0
Source SEES,.

ELECTRICITY COIRlWPTICN ANO SALES BY VOLTAIE AND TYPE 'f W4UIMR, 1985 !
Nor Averagoof consupt lon Averae
Voltae Category Tortff cusoe b/ Sales per customer Invoicing KWh rate(billion
(1Knh) (S) (klh/year) CFAF) (S) (CFAF/kWh)
General tariff E4 305 93,145 12.3 306,400 5,042 15.9 54.1WY Special tariffs - 50 288,433 38.1 5,769,000 7,485 23.6 26.0
Internal sales - 5 16,916 2.2 3,383,000 - - -
Total - 360 398,497 52.6 1,106,900 12,527 39.6 31.4
Social residential ES 4,655 5,357 0.7 1,151 250 0.8 46.7Residential El*E2+E3*E9 49,835 285,031 37.7 5,719 17,129 54.1 60.1Public lighting E64E7 S45 10,720 1.4 19,670 504 1.6 47.1
LV Industrial E5.E8 1,040 24,352 3.2 23,415 1,189 3.8 48.8Internal sales - 215 15,555 2.1 72,349 - - -
SEES Personnel - 1,860 17,462 2.3 9,388 65 0.2 3.7Total - 58,145 358,475 47.4 6,165 19,137 60.4 53.4
TOTAL General Total - 58,505 756,972 100.0 12,940 31,664 100.0 41.8
a/ Taxes ond "contrlbutlonsn excluded.b/ Rounded to the narest multiples of 5.
Sowrco SEEG.
VI

-84
Annex 16Page 1 of 4
-1 DIP3 FO SD - 1984
In SRGC's 1984 demand foreca,tte several demand trend assessment methodswere used.
Al - Logarithmic extrapolation of past trends
A2 - Linear axtrapolation of past trends
A3 - Exponential extrapolation of past trends
a -Use of a log function, taking as a basis past trends, final`assessed consumption per consuesr and the forecasted trend oftbQ total class of consumers involved, actual and projected
C - Specific market surveys of large consumers
Three forecasts were worked out using different scenarios based on thelength of the recorded period used for the extrapolation, or the type ofextrapolation selected (Al, A2, or A3).
The tables in this annex present the general features of the forecastsbased on the "average" scenario. The phrase "service rate" means thenumber of service per one hundred inhabitants; "SEEG use" means both theconsumption by SEEG personnel and the SERG- own con;umption for tisoperations (water service).

-85-
Annex 16Page 2 of 4
Table 1: S£EQ FORCAST FOR LIERVILLE, 1984
Trendestimate 1988 1990 199
Population (103) - 273 295 359
ServIco rate - 10.8 11.5 13.0
Residential speclficconsumption Mbh/yoer) - 9.4 9.7 10.6
Total consumPtion (GIh) - 548 628 856
LV Consumption (Sb) - 321 381 559Residential B 276 330 494SEEG use A2 21 24 32Public llghting Al 8 8 9industrial A2 17 19 24
WV ConsumPtlon (0Mb) - 227 247 296Private use A2 214 233 281SEE use C 13 14 15
Source: SEEG,

- 86 -
Annex 16Pape 3 of 4
TbIe 2: SEEG FOlCAST FOR PORT4ENTIL, 1984
Trendestimate 19B 1990 199S
Populatlon (105) - 97 104 122
Service rate - 10.1 10.7 11.9
Rasidential swcificconsumption (M/"r) - 9.4 9.6 10.6
Total onmptlon ) - 173 191 242
LV Consumption (lnh) - 97 114 169Resldential 8 92 109 15SEEG use Al 3 3 3Public lightlg Al 1 1 1Industrial A2 1 1 1
Consumption (Wh) - 76 78 62Genral prIvato Al 15 16 193 large onpan Is C so so 58SEEG use C 3 4 5
Source: SEEC.

- 87 -
Annex 16age 4 of 4
Tble S $EG FOREAST FOR FRANCEVILLIL, 194
Trendntl1oto 1988 1990 1995
Totel conamtlon (0M1h) - 139.2 145.3 163.0
LV Conwwtlen (0h) - 13.6 15.2 19.1buldetletll A2 9.0 10.1 12.6SEEua A2 2.2 2.4 3.0PublC fighting Al 0.9 1.0 1.3Industrial A2 1. 1.7 2.2
-IV Consolo (Ih) - 125.6 130.1 143.9Suwal private Al 21.9 23.9 29.33 lage coweles C 103.7 106. 114.6
Source: SEES.
Table 4: SEEG FOlCAST FOR ISOLATED CER, 1964
Trend..tJ.t. 1966 1990 1995
Total consumption Incenters (O11) A3 67.2 97.8 246.3
Sources SEEG.

- 88 -
Anne 17
synAvuC 1onITh
The hydraulic potential of Gabon presently is assessed to be4,900 MN and 33,500 CWhlyear of which less than 200 MM and 1,000 GUb/yearcurrently are harnessed (less than 5S). -
A very large range of sites are available, from ones convenientfor micro or mini-power plants, up to sites khere several hundreds of MWpower plants can be installed.
The following tsble displays the most important sites wheresome studies have been undertaken.
Number ofmain sits Powr Enwe
(W) (h/yer)
Llbrev lo Realon 13 763 4,640River M9EI 3 121 610River NMO 5 312 1,980River ABANA 3 245 1,510Olers 2 85 540
South East qI a 638 47t0High "001£ 4 322 2,335Others 4 316 2,435
Other regions b/ 8 3,325 9,540
I/ Region of Francpel I le, South East of Lstourvi le.y/ MaInly In the center of the omuntry.
Source: SEES.

- 89 -
Annex 18
SEES PERSOMEL
Table 1: SEES PERSONNEL BY FUNCTION a/
Mbnagertal SupwvlsoryStaff Staff Labour Total
Total 231 530 1,279 20040E* ectrlclty 49 151 535 735water 13 35 206 254Both 169 344 538 1,051
Electricity Subsectoe 49 151 535 735Qeneration 33 98 179 310rFstrtbutlon 2 43 171 216l Ah 14 10 165 209
I/ September 1986
#urces SEE6.
Table 2: GEOGRHIC SREAKOOIIN OF SEED PERSONNEL
Managerial SupervisoryStaff Staff Labour Total
total 231 530 1,279 2,040Head offices 181 286 468 935Libreville 14 83 291 388Port-dent I 13 so 175 238Franceville 10 35 90 135Isolated Centers 13 76 255 344
Source: SEES.

- 90 -
Annex 19
SEEG CUSTONERS: 1975-1965
Table 1: NUM9ER OF MV CUSTOERS: 1975-1985
1975 1976 1977 1976 1979 1980 1981 1982 1963 19U4 1965
Llbreville 99 110 147 - 198 212 210 216 223 243 249Part-osntl l 45 46 47 - 44 42 39 39 36 43 44Freanceville - - - - - 34 42 41 42
55 59solated Centers - - - - - 28 22 24 25Total - - - - - 310 308. 318 323 351 360
Source: SEEQ.
Table 2: KUIUER OF LV CUSTOERS: 1975-1985(thwoeands)
1975 1976 1977 1978 1979 1980 1981 1982 1983 1964 1965
Librevl I I 12.0 14.6 18.9 - 19.8 21.7 23.2 26.8 30.9 34.5 37.7PoCt-4satl l 3.6 3.8 4.2 - 4.4 4.8 5.4 6.3 7.4 8.1 8.8Fracewi I le - - - - - 1.8 2.0 2.4 3.0
6.3 6.9laolated COters - - - - - 5.08 6.5 7.5 8.6Total - - - - - 32.8 35.6 40.7 46.8 52.4 58.1
Source: SEEG.

91 -
muex 20
SEEI OPERATIOtL EWKNDITUIES a/(ml l Ion ClF)
1964 1985
illIng (without tam) 36.764 49,027Electricity and water sales 31,594 37,83SEquipont contributions 2,633 4,478special contributions 1,701 2,439Nisoel lan works 1,690 2,923
lecI laneou actIvities 904 1,304
Oeational oxnses 28,129 34,301Procurement (Including fuel) 9,087 10,731Transportation 736 615Pers8onl 10,877 12,645sIC 332 412aeintenenco under the equipment
contribution 327 564Naintenance and consumption under
th special contribution 1,701 2,439Miscellaneous services 3,272 4,138Insurances end mIscellaneous contributions 515 691Taxes 600 674Interests 676 1,186
Bo "th water and eioctriclty.
Sorcs SEES.

- 92 -
Annex 21Page 1'of 2
The figures given in the tables below cover 93KG's investmentsfor both electricity and water supply. The mission estimates thatelectricity represents approximately 752 of total investments. Table 1show past investments undertaken by concession (outside the privateownership of SEW). Since these figures vary considerably from year toyear, a running four-year average is given so that general trends can bemore easily noted.
Table 1: PAST INVESTMENTS - CONCESSIONS(billIon CFAF)
1975 1976 1977 1978 1979 1980 1981 1962 1963 1984 1985
Current Valueof Investment 7.7 8.3 4.1 21.4 5.3 22.6 7.3 3.3 6.6 8.8 7.6
Present Value 17.6 18.5 8.4 42.3 9.3 36.9 10.9 4.3 8.0 9.4 7.6(1965 CFAF)
Average for Four Preceeding 9.8 13.6 11.6 21.7 19.6 24.2 24.8 15.4 15.0 6.1 7.3Years (1985 CFAF) -
Source: SEEG, mission estimates.
At the end of 1985, Sl8G's own assets (as opposed to thoseoperated by SE33 under concession arrangements) amounted to39 billion CPAP. Major capital investments in the past 10 years includethe installation of a gas turbine plant at Port-Gentil (the only largegenerating facility privately owned by SEWG) in 1976-1977(10 billion CPAF), and construction of new headquarters in Libreville andmiscellaneous office buildings in other towns in 1985 (18 billion CPAF).

Table 2: ELECTRICITY SUtCTOR INVESTlENT PROGRAM - 1987-199M
(bl lI ton CFAF)
TotalInvestuent 1987 1968 1989 1990 1991 1992 1993 1994 199S
GENERATION AM TRSMISSICN
With lnter_onmetion 0 0.5 0.5 0 0 5 8 a 26
Llbreville and Poct-entllSpecial studles 1 - 0.5 0.5 - - - - - -
InteroonnectIon overhead I [mes
and substet-ons 26 - 2 8 8 6 .
Next hydro plat - - - - - - - - - 20
Franceov I lees turbine 3 - - - - - 3 -- -
wltout ltwecoanectlon 0 0.5 O.S 0 5.5 13 10 15 30
Libreville and Fort-SentilSpeclal studles I - 0.5 0.5 - - - - -
Kilguo downstrm so - - - - 5.5 10 10 10 10 cJ
Nbt hdro plI nt - - - - - - - - 5 20 i/
Francevo leSs turblne 3 _ _ _ _ _ 3 _ _ _
DlSTRIDUTIONi 2.0 2.0 2.0 2.0 2.0 2.5 2.5 2.5 2,5
Libreville - 1.5 1.S 1.S 1.5 1.5 1.5 1.5 1.5 1,S
Port-Gentil - 0 0 0 0 0 0.5 0.5 0.5 O.S
Franeeville - O.5 0,5 0.S 0.5 0.5 0.5 0.5 0.5 0.5
ISOLATED CENTERS - 1.S 1.S 1.5 1.5 4.0 4.4 4.8 5.3 5.9
a/ Co.plem_ntary substation equipment In 1996. o
kX Assumption for commissioning In 1999 (ST at Port-Gentil to be commlsslaned beforehand, with first
Investments beyond 1995). 0 '
c/ Last part of electromechanical commissioned In 1996.
i/ Assumptlon. In the development without InterconnectIon, the next hydro plant would probably be another
than Kinguale downstreem.
SO,urce Mission estimates.

- 94 -
Anon 22
BU CRGANIZTIW CMT
The following organization chart displays past and peseatsituation. The figures on the right are the number of personnel, as ofSeptember 1986.
De Dliectlon g6n6rale (Gnal Maagment) 171
_ Etudes gnh6rales (Development studles) 7
-Oontrle de gestln (Monagnt suwprvislns) a
- Service Juridique (Lawer questions) 25
m so60
D DI I Direction de I 'informetique 42(Data ProcessIng)
Dlrectlon Tochnique de I'Equlpeuent t(Project Department)
r OAC | Direction Administrative, Ccmptable atFinanclre 38(Administration, accounting, fInance)
T DIC-7 Direction Commercialo (Saies) 271
r l DP, QDirection du Personnel 54
I OEX | Direction de I'Explotatlon (Operatlon) -
Common sorvices 209
Libroville 365
-Port-4snti I238
FrancevIlle 135
Isolated centers 3U2.040

- 95 -
Annex 23Page 1 of 4
BuG TARIM1(mid-1986)
"Tarif Social" (Social Tariff)
This LV tariff referred to as "85", applicable up to 4 kVA, isthe same all over the country. It features two blocks:
0 to 240 kWh/month .............. 37.04 CFAF/kVhOver 240 kVh/month .............. 76.39 CVAF/kWh
The bills are charged with the 8X TCA (income tax).
Other LV Residential Tariffs in Libreville
In Libreville, four other LV residential tariffs are used: 31,32, £3 and 39.
Tariff E9 is for air conditioning only, and is used byconsumers who also have tariff 31 for the other applications (in thesecases, the consumers have two meters). This system is being replacedprogressively by tariff E3 (with only one meter per consumer). Anothertariff, 32, also being phased out, is applicable for all domesticusages. Tariffs 1, 2 and 3 are block tariffs, each block being definedby a number of hours of utilization of the subscribed demand (limited bythe breaker setting). The kWh prices are as f4llows:
Block Basic tCA on basic Equipmant Specialprice price contrlbution contribution Total
El 0 - 40 h 75.27 6.02 4.01 - 85.3040 - 130 h 69.66 5.57 - 5.33 80.58over 130 h 49.31 3.91 - 5.35 36.60
E2 0 - 40e 75.27 6.02 4.01 - B5.3040 - 130 h 69.66 5.57 - 8.03 83.26over 130 h 41.40 3.91 - 8.03 52.74
E3 Sam prices as for E2, but with blocks 0-20h, 20-50h and over SOh.
E9 Single block 41.40 3.31 - 8.03 52.74

- 96 -
Annex 23Page 2 of 4
Other LV Residential Tariffs in Port-Gentil
In Port-Gentil, there is only one LV residential tariff otherthan the social tariff, tariff El, with two blocks onlys
Block Besic TCA on basic Equipment Speclalprice price contribution contributlon Total
El 0 - 125 h 08.13 7.05 5.76 - 100.94Over 125 h 39.65 3.17 5.76 5.76 54.34
Other LV Residential Tariffs in Pranceville and the Isolated Centers
Here also, tariff E1 is the only LV tariff other than thesocial tariff. The blocks are the same as in Port-Gentil, and there isno contribution. The prices are the same in Pranceville and the isolatedcenters: for the first block, 98.30 CFAP/kWh and for the second block,72.70 CPAP/kfh. The 82 slaes tax is added in the billing.
LV Industrial Use
This tariff "5" is a single block tariff with the followingprices (in CVAF/kIh):
Basic TCA on basic Equipment Specialprice price contributlon contribution Total
LIbrevi Ile 50.18 4J01 4.01 - 58.20Fort-OentiI 59.26 4.74 5.76 - 69.78
In Libreville and Port-Centil, there is no contribution, andthe common price is 84.80 CVAP/kVh.

97
Anrex 23Page 3 of 4
Specifie.L-Tariffr
The two following tariffs also are found, although they arebeing phased out.
In Port-Centil, tariff "87" for private settlements: basicprice 66.10 CPAP/kVh, sales tax: 5.29 CFAF/kPgh, equipment contribution:5.76 CPAF/kWh, special contribution: 5.76 CFAP/kWh, for a total of82.91 CFAF/kWh.
In Franceville and the isolated centers, tariff "18", for thefood industry, has a single block at 50 CPAC/Ikh.
NV General Tariff in Libreville
This tariff "14" is a time of the day tariff, without demandcharge. The prices are as follows:
Basic TCA on basic Equlpmnt Secialprice price contrlbutIon contribution Total
P-ak 62.18 2.49 3.05 3.05 70.77Out of peak 41.46 1.66 3.05 3.05 49.22
MV General Tariff in Port-Centil, Libreville and the Isolated Centers
Also referred to as "14", this tariff is a subscribed demandcharge tariff with single kWh price. The prices are as follows:
port4nt II Francoville andIsolated centers
Subscribed doend chrge 20,067.6 + 02.7 sales tax 20,756CFAFkWh/year a 20,870.3
kilh price (CFAF) 50.18 + 2.01 sales tax 75.40+ 0.87 specilo contribution
3 53.06

- 98 -
Annex 23Page 4 of 4
MV Special Tariffs
These tariffs (the most important in WV by the sold energy) arenegotiated case by case.

- 99 -
Annex 24Page I of 4
um*r 18e or U
These Terms of Reference are presented by the mission asinformation. A final version tailored to the characteristics of Gabon'senergy sector will have to be defined.
I. The household energy economist shouldt
(a) collect available and relevant economic data, evaluate existingenergy pricing policies, and advise the socio-economic surveyoron economic data to be gathered via the household survey;
(b) determine the economic and financial cost of demand-supplyscenarios for electricity, LPG, kerosene, charcoal, firewood,agricultural residues, etc;
(e) assess the economic price of the various fuels and recommendappropriate and phased measures to adjust prices to promotesubstitution and conservation;
(d) recommend pricing for the substitute fuels, evaluate thepricing of their required cooking equipment (including possiblesubsidies) and its impact of fuel demand, and determine thecost for each fuel on a per useful.NJ basis;
(e) analyze the likely impact of new prices (including subsidies)on disaggregated energy supply, demand, the family budget,foreign exchange, and government budget;
(f) determine the comparative economic benefits of local versusforeign manufacture of new cooking equipment;
(g) prepare economic and financial analyses of all recommendedoptions and policies, rank the options according to theirrelative economic and financial internal rates of return andnet present values, and determine the impact of the proposedpolicy (or package of policies) on government expenditure,revenues and balance of payments; and
(h) identify support required to ensure successful implementationof the household energy strategy.

- 100 -
Annex 24Page 2 of 4
II. The petroleum products/distribution specialist should:
(a) review existing and ongoing studies on LPG and kerosene for thehousehold sector;
(b) assess, in collaboration with the stove technologist and themarketing specialist, present supply, storage, distribution andmarketing arrangements for LPG and kerosene, and advise on therange and relative priority of technical options (separate aswell as in packages) to be considered in developing a programof substitution for LPG, and assess their costs and likelybenefits. Special attention should be given to reliability andappropriateness of the distribution system in relation toconsumers' fuel purchasing behavior;
(c) determine a phased investment plan required for procurement,processing, handling and distributing LPG and kerosene for thehousehold market, the size of which will be estimated incollaboration with the marketing specialist and the energyeconomist; and
(d) provide a description and cost estimate for any technicalassistance required for program implementation, includingsupervision of engineering, training of operators anddistributors.
III. The marketing specialist should:
(a) identify, in consultation with the stove technologist and localstaff, the survey sample and design a consumer acceptabilitystudy for improved cookstoves;
(b) train and supervise surveyors, carry out the survey, testsocial acceptability, and analyse results. Repeat the survey,if adaptations in stove design are indicated;
(c) select, in collaboration with the stove technologist and localstaff, the stove designs for dissemination;
(d) evaluate, together with the energy economist, the least-costfinancial and economic solutions for meeting cooking needs aswell as assess the inherent risks of each option;
(e) recommend, in collaboration with the energy economist, themeans of promoting the sale and use of substitute fuels anddefine their likely consumption area;
(f) evaluate the size, segmentation and location of the market foreach fuel; and

- 101 -
Annex 24Page 3 of 4
(g) implement the recommended program, training and other technicalassistance as needed to establish and maintain dissemination.
IV. The stove technologist should:
(a) advise on the range and relative ranking of appropriate stovesfor each fuel, as well as determine the need for adaptatiou ofexisting equipment or the development of new equipment. Ifteed be, develop in collaboration with local staff such adaptedor new stoves;
(b) determine the efficiency and durability of improved three-stonestoves and develop quality controls for construction and use;
(c) identify a small sample of appropriate stoves (based on items(b) and (c)), which will be field-tested in a small controlgroup of consumers to ascertain fuel consumption, time saving,safety, stability, and other consumer (male and female)reactions. The results of this survey will provide inputs ofmodifying the stove design, if need be, and for narrowing downthe range for the final selection of the most appropriatestoves. This survey may have to be repeated more than once;
(d) recommend means of production, procurement of constructionmaterials, provision of training and incentives toartisans/factory if local production is preferable. On theother hand, advise why import or assemblage of stoves is theleast-cost solution; and
(e) work in close consultation with the marketing specialist, aswell as local staff in the selection, adaptation, and/ordevelopment, quality control, market testing, and maintenanceof stoves.
V. The soci-economic surveyor should:
(a) review existing studies on household energy consumption andsupply, and prepare, in consultation with relevant teammembers, a detailed list of data requirements;
(b) assist local experts in design of the representativestatistical samples for the supply and demand surveys;
(c) design draft questionnaires, in consultation with local expertsand team members, for each survey;
(d) advise on the training aid supervision of interviewers;

- 102 -
Annex 24Fagie4 of 4
(e) monitor pilot testing and recommend modifications for thelarge-scale survey;
(f) assist in the design of machine tabulation requests and datacompilation;
Cg) analyse the results of each survey and supervise preparation offinal reports on household energy consumption and supplysystems
(h) develop an information system to keep track of the results ofthe studies and quality control by means of consumer controlgroups and permanent monitoring of stove manufacturing; and
(i) evaluate the actual impact of the program and its effect onimproving efficiency.
VI. The enerpy forester should:
(a) identify and describe any present de facto forestry and/orfiscal policy, institutional and planning arrangements drawingupon the material available in studies and from fieldinvestigations;
(b) examine the organization of fuelwood supply for each large cityin the country. This examination should include:(i) delimitation and mapping of areas for exploitation andthose to be protected, including access routes, within a 100-150 km radius about the cities; (ii) quotas for annualexploitation and an exploWtation schedule for each area, based-on local fuelwood demand and the availability of dead wood;(iii) exploitation specifications for each type of forestryformation, giving priority to collection of dead wood;(iv) potential organization of retailers: villageassociations, co-ops consisting of several villages, privatecompanies, etc.; (v) placement and management of markets ineach area, as well as quotas for each market; (vi) organizationof transport between the collection or cutting point and thecity markets; and (vii) the potential for- improving fuelwoodmarketing in cities;
(c) design and implement pilot projects among the rural populationfor promoting rational exploitation of wood resources in thebush; and
(d) calculate the revenues that will accrue as a result of theseactivities to the government and the village comunity andsuggest mechanisms for the possible use of these revenues to-improve the ovurall performance of the proposed managementsystem.

Continued from inside front cover
Reports Already Issued
Togo June 1985 5221-TOVanuatu June 1985 5577-VATonga June 1985 5498-TONWestern Samoa June 1985 5497-WSOBurma June 1985 5416-BAThailand September 1985 5793-THSao Tome and Principe October 1985 5803-STPEcuador Decemtkpr 1985 5865-ECSomalia December 1985 5796-SOBurkina January 1986 5730-BURZaire May 1986 5837-ZRSyria May 1986 5822-SYRGhana November 1986 6234-GHGuinea November 1986 6137-GUIMadagastar January 1987 5700-MAGMozambique January 1987 6128-MOZSwaziland Pebruary-1987 6262-SWHonduras August 1987 6476-HOSierra Leone October 1987 6597-SLComoros January 1988 7104-CONCongo January 1988 6420-COB
Energy Assessment Status Reports
Papua New Guinea Julyt 1983Mauritius October, 1983Sri Lanka January, 1984Malawi January, 1984Burundi February, 1984Bangladesh April, 1984Kenya May, 1984Rwanda May, 1984Zimbabwe August, 1984Uganda August, 1984Indonesia September, 1984Senegal October, 1984Sudan November, 1984Nepal January, 1985Zambia August, 1985Peru August, 1985Haiti August, 1985Paraguay September, 1985Morocco January, 1986Niger February, 1986