gage r&r metrics and their application - southern california...
TRANSCRIPT

Presented by:
ASQ Section 0700 ASQ Section 0701
ASQ Section 0702 ASQ Section 0706

Please support our gracious Sponsors:
Gold Level

Silver Level

Bronze Level

Measurement Systems AnalysisVARIABLE GAGE R&R METRICS, APPLICATIONS AND ROOT CAUSE
ANALYSIS
Created and presented by: Gabor Szabo

In the world of quality, there has always been a need for reliable data in order to make data-based decisions.
• Inspections – accepting or rejecting parts based on inspection results• Improvement activities and projects – process and other improvement
efforts/projects• Any measurement activity that has an impact on quality or the organization
Questions to ask:• How do you ensure that you can rely on your data and it reflects reality?• How does one define a measurement system?
Measurement Systems Analysis – Introduction

Objectives
By the end of this presentation we will have covered
• Basics of Measurement Systems Analysis• Overview of Variable Gage R&R Study Metrics• Application of Metrics• Root Cause Analysis, Tools

What – How – Who
• What: Characteristic of interestExamples: length, diameter, tensile strength, angle, waiting time, weight, number of cracks/voids (on part surface)
• How: Measurement method – includes the gage and the measurement procedure/technique
Examples: naked eye, steel ruler, caliper, CMM and automated measurement program, spectrometer, microscope
• Who: Inspectors/OperatorsExamples: receiving inspectors, engineers, technicians
Measurement System Definition
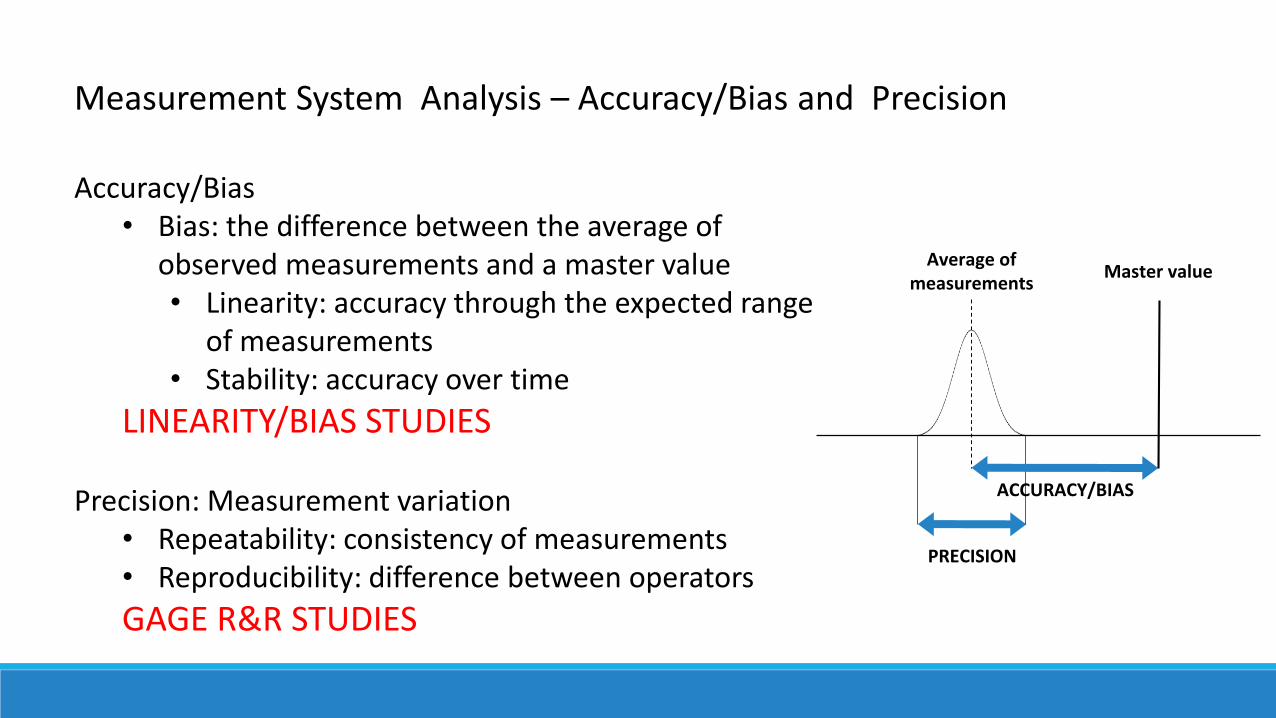
Accuracy/Bias• Bias: the difference between the average of
observed measurements and a master value• Linearity: accuracy through the expected range
of measurements• Stability: accuracy over time
LINEARITY/BIAS STUDIES
Precision: Measurement variation• Repeatability: consistency of measurements• Reproducibility: difference between operators
GAGE R&R STUDIES
Measurement System Analysis – Accuracy/Bias and Precision
Average of measurements
Master value
ACCURACY/BIAS
PRECISION

Accuracy – Precision
PreciseInaccurate
AccurateImprecise
AccuratePrecise
InaccurateImprecise
Mean of measurements Master value
Mean of measurementsMaster valueMaster value
Mean of measurements
Master valueMean of measurements

Studies Addressing Precision – Gage R&R Studies
• Planned studies to estimate variation attributed to the measurement system. Gage R&R Studies only assess precision (repeatability and reproducibility).• Study plan: samples, operators, trials
The multiply of the above study elements for a number of opportunities (or study sample size). Example: 10 samples x 3 operators x 3 trials.
• Types:• Variable – variable output (continuous numerical values)• Attribute – attribute output (pass/fail, good/bad etc.)
• History: Developed by automotive industry in the 1960’s. Initially the Average-Range method was used; the ANOVA method was developed later on (uses sum of squares to estimate standard deviation, which is a more accurate estimation than what the Average-Range method provides)
• Reference Book: AIAG MSA Reference Manual 4th edition
• Non-Destructive• Destructive

Measurement System Variation (Total GR&R)
Observed Part-To-Part Variation
Process meanLSL
True Part-To-Part Variation
USL
Tolerance
Components of Variation in a Variable Gage R&R Study
Observed Part-To-Part Variation
True Part-To-Part Variation
Measurement System Variation (Total GR&R)
Process mean ( )
also called Total Variation
Specification limits (LSL, USL)
Tolerance = USL - LSL
Reproducibility
Repeatability
Minitab
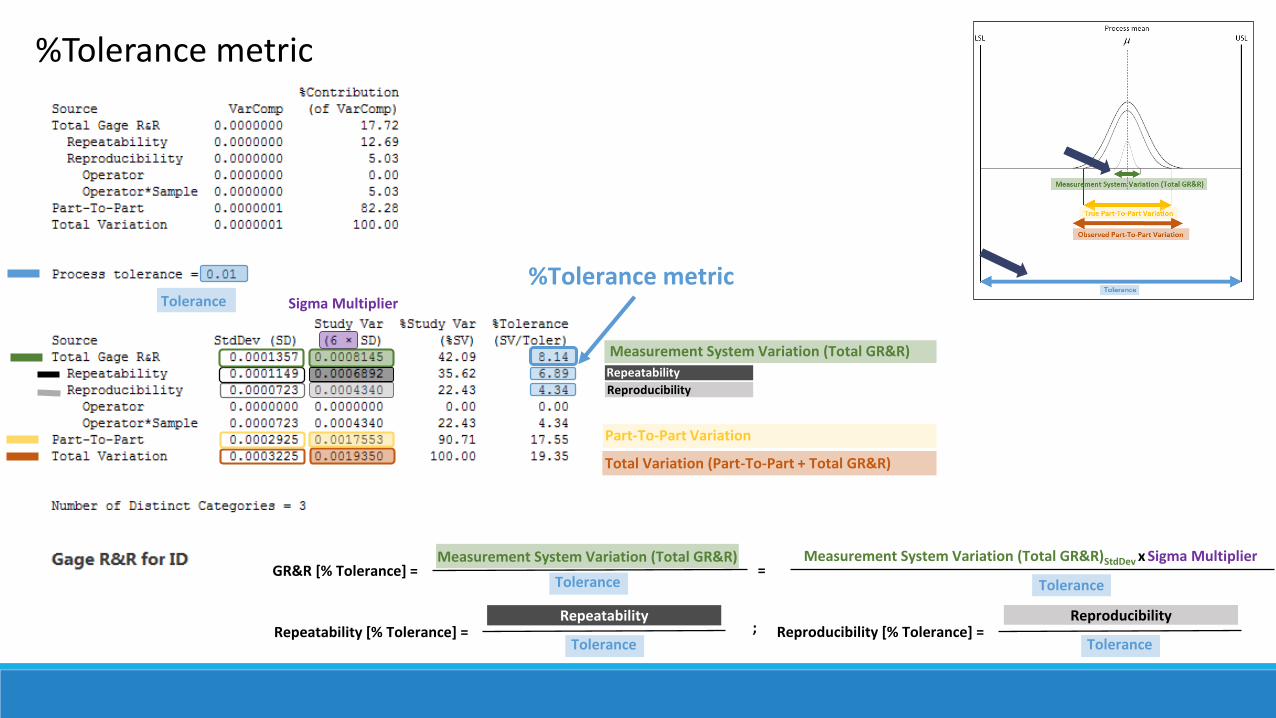
%Tolerance metric
Measurement System Variation (Total GR&R)
Tolerance
Total Variation (Part-To-Part + Total GR&R)
Part-To-Part Variation
%Tolerance metricSigma Multiplier
GR&R [% Tolerance] = Measurement System Variation (Total GR&R)
Tolerance=
Measurement System Variation (Total GR&R)StdDev x Sigma Multiplier
Tolerance
Reproducibility
Repeatability
Repeatability [% Tolerance] = Tolerance
RepeatabilityReproducibility [% Tolerance] =
Tolerance
Reproducibility;
Part-To-Part Variation
Me
asu
rem
en
t Sy
ste
m V
aria
tio
n
(To
tal G
R&
R)
Total Variation (Part-To-Part + Total GR&R)2 = Part-To-Part Variation2 + Total GR&R2
Total GR&R2 = Repeatability2 + Reproducibility2
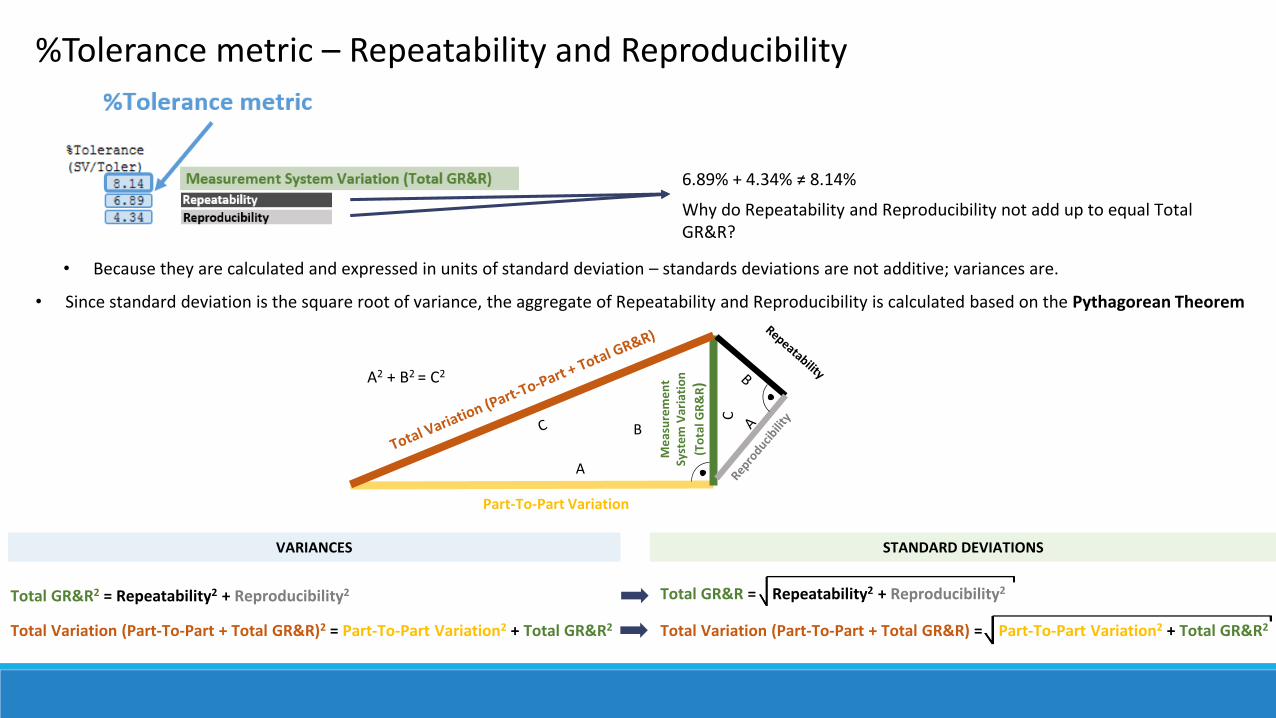
%Tolerance metric – Repeatability and Reproducibility
6.89% + 4.34% ≠ 8.14%
Why do Repeatability and Reproducibility not add up to equal Total GR&R?
• Because they are calculated and expressed in units of standard deviation – standards deviations are not additive; variances are.
• Since standard deviation is the square root of variance, the aggregate of Repeatability and Reproducibility is calculated based on the Pythagorean Theorem
Total GR&R = Repeatability2 + Reproducibility2
Total Variation (Part-To-Part + Total GR&R) = Part-To-Part Variation2 + Total GR&R2
VARIANCES STANDARD DEVIATIONS
B
A
C
A2 + B2 = C2

Area of Uncertainty
%Tolerance metric - Application
• Application: inspections where the inspection result is compared to a specification and an accept/reject decision is made.
Measurement System Variation
LSL USL
Tolerance
Area of Uncertainty
Measurement System Variation
GR&R [% Tolerance] = Measurement System Variation (Total GR&R)
Tolerance
• Sample selection: Since the Total Variation component is not part of the %Tolerance formula, sample selection does not have an affect on the %Tolerance result.
%Tolerance = 15%
• Acceptance criteria guidelines for %Tolerance per AIAG MSA Reference Manual 4th edition:
< 10% Acceptable measurement system.
10 – 30% May be acceptable for some applications. Decision should be based on feature criticality, cost of measurement device, etc.
> 30% Unacceptable measurement system. Every effort should be made to improve the measurement system.
Type I or II errors
Examples: inspection activities (receiving inspection, in-process inspections, etc.), capability studies

1.33
1.99
1.331.32
1.96
2.972.872.23 2.40
1.79
1.26
1.71
1.661.29
0.97 1.11
1.411.16
%Tolerance metric - Application
• Effect on process capability index Cp/Pp

%Study Variation metric
Measurement System Variation (Total GR&R)
Total Variation (Part-To-Part + Total GR&R)
Part-To-Part Variation
Sigma Multiplier
Reproducibility
Repeatability
Repeatability [% Study Variation] = Reproducibility [% Study Variation] = Reproducibility
%Study Variation metric
GR&R [% Study Variation] = Measurement System Variation (Total GR&R)
Total Variation (Part-To-Part + Total GR&R)=
Measurement System Variation (Total GR&R)StdDev x Sigma Multiplier
Total Variation (Part-To-Part + Total GR&R) StdDev x Sigma Multiplier
Total Variation (Part-To-Part + Total GR&R)
Repeatability
Total Variation (Part-To-Part + Total GR&R);

%Study Variation metric – Application
• Application: activities where process changes, shifts or drifts need to be identified or monitored.
Areas of Uncertainty
• Sample selection: Since the Total Variation component is part of the %Study Variation formula, the %Study Variation metric is affected by sample selection.
GR&R [% Study Variation] = Measurement System Variation (Total GR&R)
Total Variation (Part-To-Part + Total GR&R)
%Study Variation = 50%
• Acceptance criteria guidelines for %Study Variation per AIAG MSA Reference Manual 4th edition:
< 10% Acceptable measurement system. Measurement system able to distinguish parts or detect process shifts.
10 – 30% May be acceptable for some applications. Decision should be based on feature criticality, cost of measurement device, etc.
> 30% Unacceptable measurement system. Every effort should be made to improve the measurement system.
Type I or II errors
Examples: process/continuous improvement activities, such as SPC, Design of Experiments, etc.

%Study Variation vs. %Contribution metrics
17.72% 82.28%
12.69% 5.03%
100%
Tota
l GR
&R
42
.09
%
90.71%
Part-To-Part Variation
%Study Variation – uses standard deviations, non-additive
%Contribution – uses variances, additive
Acceptance criteria guidelines for %Contribution per AIAG MSA Reference Manual 4th edition:
< 1% Acceptable measurement system. Measurement system able to distinguish parts or detect process shifts.
1 – 9% May be acceptable for some applications. Decision should be based on feature criticality, cost of measurement device, etc.
> 9% Unacceptable measurement system. Every effort should be made to improve the measurement system.

ndc = 1: One part cannot be distinguished from others.
ndc = 2-4: The data can be split into 2-4 groups: e.g. high and low (2), low-middle-high (3)
ndc ≥ 5: Recommended. Measurement system capable of distinguishing parts from each other. Can be used for process control.
Number of Distinct Categories
Number of Distinct Categories (also called Discrimination Ratio)*
• It represents the number of non-overlapping confidence intervals that will span the range of product variation, i.e. it defines the number of groups within your process data that your measurement system can distinguish. “Effective gage resolution”
• The higher the number, the better the measurement system at distinguishing parts from one another
* Evaluating The Measurement Process, 1984 by Donald J. Wheeler and Richard W. Lyday
Formula:
Acceptance criteria guidelines per AIAG MSA Reference Manual 4th edition:
(rounded down to nearest whole number)
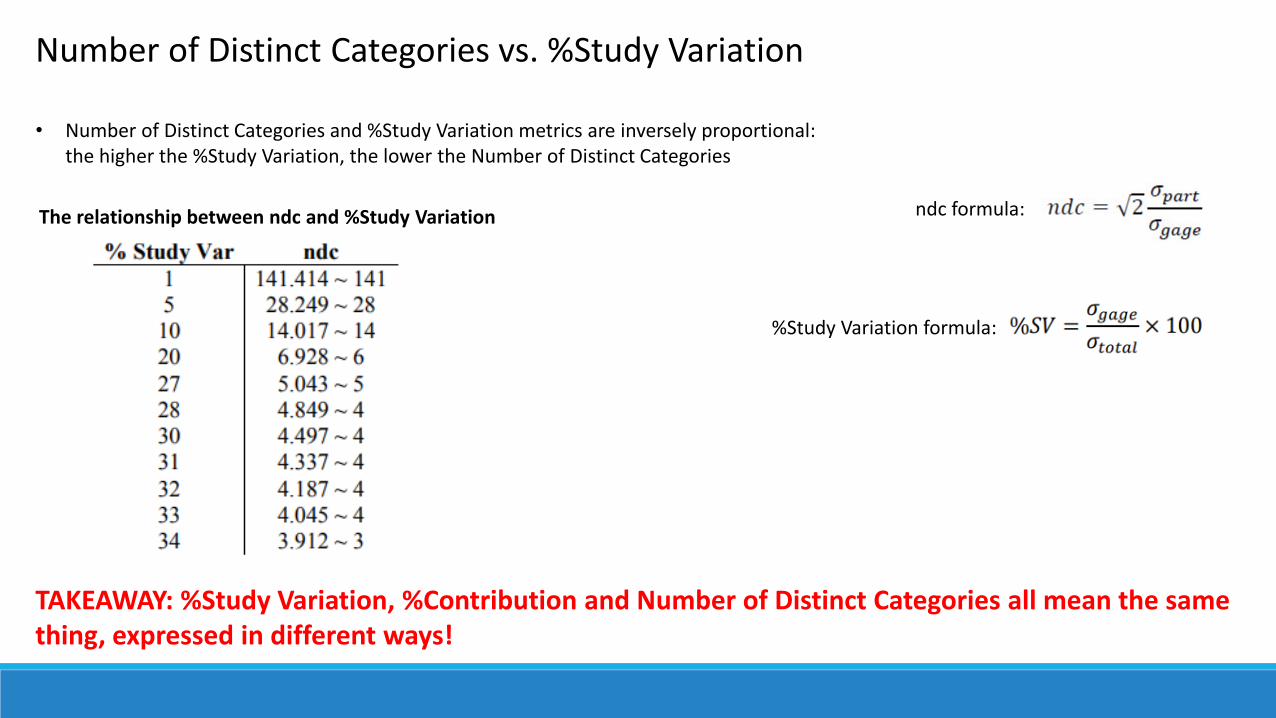
Number of Distinct Categories vs. %Study Variation
• Number of Distinct Categories and %Study Variation metrics are inversely proportional:the higher the %Study Variation, the lower the Number of Distinct Categories
ndc formula:The relationship between ndc and %Study Variation
TAKEAWAY: %Study Variation, %Contribution and Number of Distinct Categories all mean the same thing, expressed in different ways!
%Study Variation formula:

What if a Gage R&R Study fails? – Root Cause Analysis
• Potential root causes need to be investigated to determine what is causing excess measurement system variation
• Corrective action needs to be taken based on the root causes identified
• Root causes can be related to:• Gage• Method/Procedure• Samples• Inspection Fixture• Environment• Operators/Inspectors
• Root causes can affect• Repeatability• Reproducibility• Both

GageMethod/ProcedureEnvironment
ManPart
Gage linearity
Measurement System Variation
Gage stability
Calibration
Verification
Parameters
Sample clamping
Lighting
FocusEdge detection
Probe used
Zoom level
Measurement location/points Accuracy/Bias
Manual/Program
Elastic deformation
Glossy/Matte
Fixture
Fixture/Nest Design
Glossy/Matte
Adequate Datum(s)
Cleanliness
Skill
Experience
Training
Attitude
Procedure too vague / No procedure
Ambient temp.
Vibration
Lighting conditions
Humidity
Profile/Finish
Initial coordinates
Pattern detection
PM
Understanding Procedure/Drawing
Stress/Pressure
FatigueAdequate Datum(s)
Fixture/Nest Build
(Tolerances)
Potential Root Causes of Measurement System Variation

Example of Typical Root Causes:
• Measurement method/procedure not defined well enough so
operators may interpret it subjectively
• Measurement location not defined well enough
• Sample positioning not defined well enough
• Measurement parameters not defined well enough
• Too much inherent measurement system variation – measurement
system cannot be used for measurement application
• Inadequate clamping of sample in inspection fixture
• Insufficient gage resolution or rounded/truncated measurement
results (Rule of Ten)
• Difference in operator skills – experience and level of training
received
What if a Gage R&R Study fails? – Root Cause Analysis
What if a Gage R&R Study fails? – Root Cause Analysis Tools
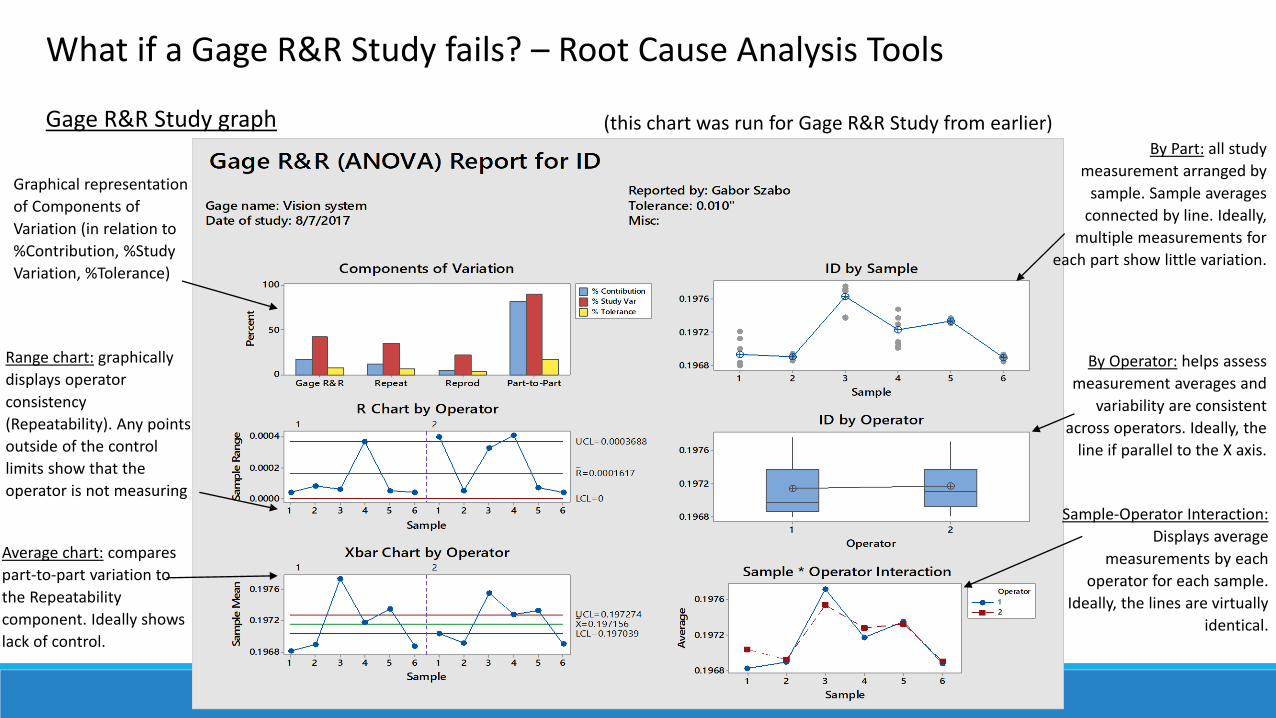
Gage R&R Study graph
Graphical representation
of Components of
Variation (in relation to
%Contribution, %Study
Variation, %Tolerance)
Range chart: graphically
displays operator
consistency
(Repeatability). Any points
outside of the control
limits show that the
operator is not measuring
Average chart: compares
part-to-part variation to
the Repeatability
component. Ideally shows
lack of control.
By Part: all study
measurement arranged by
sample. Sample averages
connected by line. Ideally,
multiple measurements for
each part show little variation.
By Operator: helps assess
measurement averages and
variability are consistent
across operators. Ideally, the
line if parallel to the X axis.
Sample-Operator Interaction:
Displays average
measurements by each
operator for each sample.
Ideally, the lines are virtually
identical.
(this chart was run for Gage R&R Study from earlier)
What if a Gage R&R Study fails? – Root Cause Analysis Tools
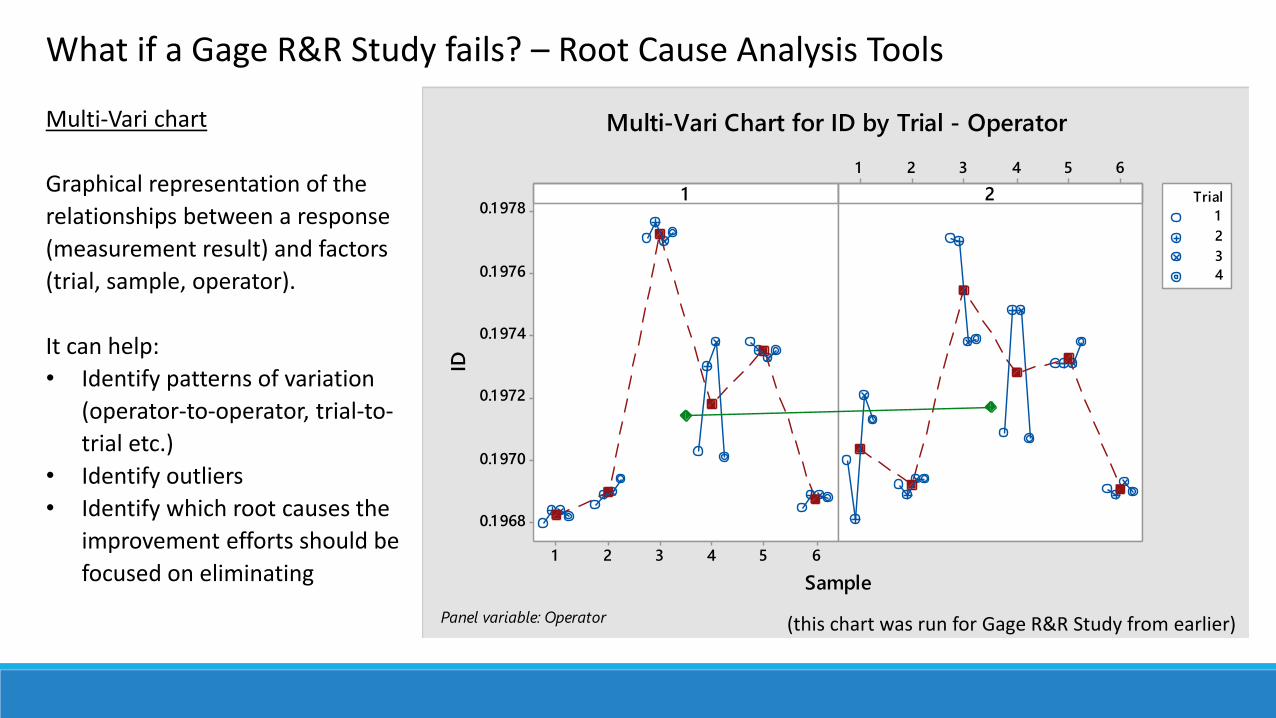
Multi-Vari chart
Graphical representation of the
relationships between a response
(measurement result) and factors
(trial, sample, operator).
It can help:
• Identify patterns of variation
(operator-to-operator, trial-to-
trial etc.)
• Identify outliers
• Identify which root causes the
improvement efforts should be
focused on eliminating654321
0.1 978
0.1 976
0.1 974
0.1 972
0.1 970
0.1 968
654321
1
Sample
ID
21
2
3
4
Trial
Multi-Vari Chart for ID by Trial - Operator
Panel variable: Operator (this chart was run for Gage R&R Study from earlier)
What if a Gage R&R Study fails? – Root Cause Analysis Tools
654321
0.204
0.202
0.200
0.1 98
0.1 96
0.1 94
654321
1
Sample
ID
21
2
3
4
Trial
Multi-Vari Chart for ID by Trial - Operator
Panel variable: Operator
654321
0.1 978
0.1 976
0.1 974
0.1 972
0.1 970
0.1 968
654321
1
Sample
ID
21
2
3
4
Trial
Multi-Vari Chart for ID by Trial - Operator
Panel variable: Operator
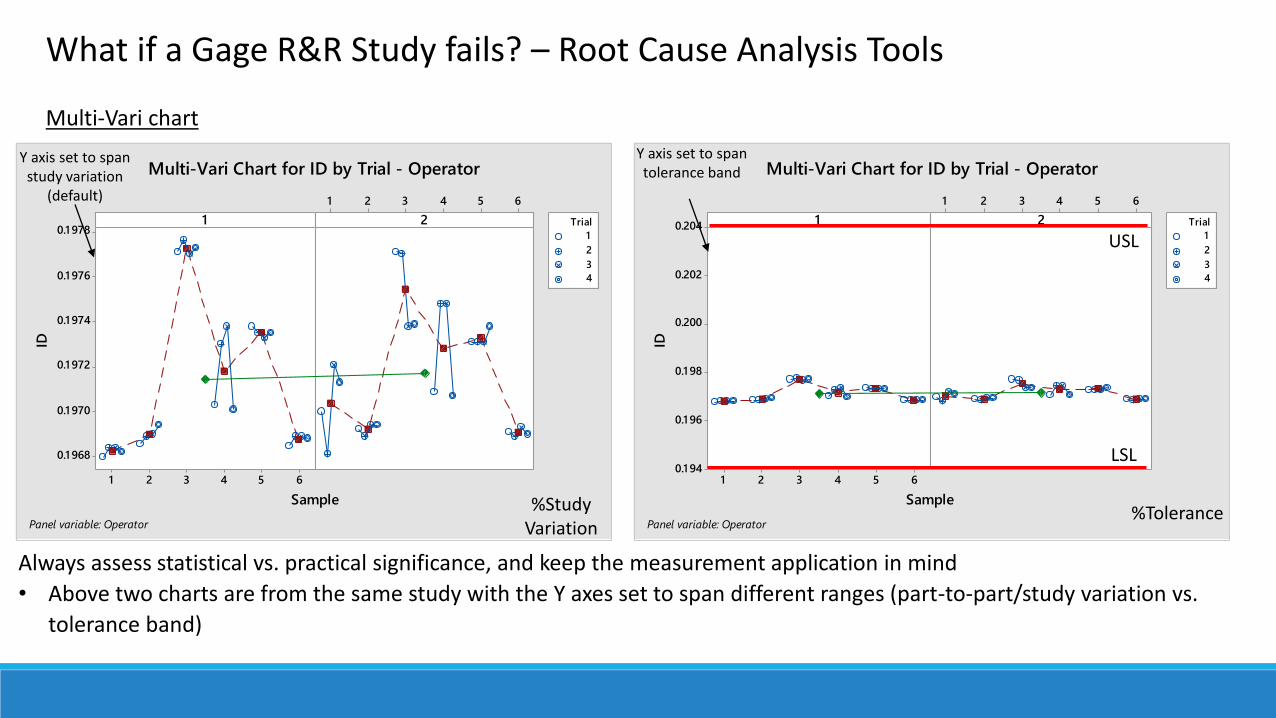
Multi-Vari chart
Always assess statistical vs. practical significance, and keep the measurement application in mind
• Above two charts are from the same study with the Y axes set to span different ranges (part-to-part/study variation vs.
tolerance band)
USL
LSL
Y axis set to span study variation
(default)
Y axis set to span tolerance band
%Study Variation
%Tolerance

What if a Gage R&R Study fails? – Root Cause Analysis Tools, Scenarios
• What is the potential issue?
1. Outlier – operator 2, sample 3:
repeatability issues
2. Reproducibility issues
• What are the potential root causes?
Typo (can only be removed from
dataset if proven), operator
error/fatigue, sample geometry,
measurement method
• How could the measurement system
be improved?
Verify sample geometry. Verify if
measurement procedure needs to be
improved. Re-measure.
321
0.573
0.572
0.571
0.570
0.569
0.568
0.567
0.566
0.565
321
1
Sample
Dim
9
21
2
3
4
Trial
Multi-Vari Chart for Dim 9 by Trial - Operator
Panel variable: Operator

987654321 01
0.0435
0.0430
0.0425
0.0420
0.041 5
0.041 0
0.0405
0.0400
987654321 01
EM
Parts
Dim
6
TN1
2
3
Trial
Multi-Vari Chart for Dim 6 by Trial - Operators
Panel variable: Operators
• What is the potential issue?
Data points from operator “EM” see
significantly more variation when
compared to those from operator “TN”
• What are the potential root causes?
Operator skills. Operator training.
Measurement procedure not specific
enough.
• How could the measurement system
be improved?
Provide adequate training. Improve
measurement procedure to be more
specific.
What if a Gage R&R Study fails? – Root Cause Analysis Tools, Scenarios

1 0 9 8 7 6 5 4 3 2 1
9.85
9.84
9.83
9.82
9.81
1 0 9 8 7 6 5 4 3 2 1
1 0 9 8 7 6 5 4 3 2 1
Jeremy
Part
Wid
th
Kenny Miguel
1
2
3
Trial
Multi-Vari Chart for Width by Trial - Operator
Panel variable: Operator
• What is the potential issue?
1. Repeatability – too much trial-to-trial
variation
2. Reproducibility – difference between
operator averages too big
• What are the potential root causes?
1. Too much inherent measurement
system variation
2. Operator training, skills
• How could the measurement system be
improved?
Provide adequate training.
Measurement system may not be suitable
for application. Improvements to current
system or implement new system.
What if a Gage R&R Study fails? – Root Cause Analysis Tools, Scenarios

Guard banding is used for mitigating risks
associated with measurement uncertainty to
protect against consumer’s risk.
• Guard band applied around
specification limits
• Guard band width equal to or a
fraction of measurement uncertainty
• Should be carefully considered as it
effectively reduces the acceptance
limits – potentially significant yield loss
What if a Gage R&R Study fails? – Guard Banding
Measurement System Variation
LSL USL
Tolerance
Area of Uncertainty
%Tolerance = 25%
Tightened acceptance limit
Tightened acceptance limit
GUARD-BANDED
AREA
GUARD-BANDED
AREA
25% of Tol. 25% of Tol.

Takeaways
• Know your metrics
• Know your measurement application and pick your metric accordingly
• Look for patterns of variation
• Identify root causes, improve measurement system if necessary
• Determine risks associated with measurement uncertainty
Any Questions?Gabor A. Szabo, CQE
(626) [email protected]

Our Planning/Leadership TeamC.G. MistryRole: Deputy Regional Director, ASQ Region 7
#SCQC Committee Chair
Vinay GoyalRole: Membership Chair, ASQ San Gabriel Valley (0702)
#SCQC Leadership Committee, Vice-Chair
Jean TedrowRole: Treasurer,ASQ San Gabriel Valley (0702)
#SCQC Committee Treasurer, Finance
Akhilesh GulatiRole: Programs Chair,ASQ San Gabriel Valley (0702)
#SCQC Programs Chair
Nagesh Malhotra
Role: Vice Chair, ASQ San Gabriel Valley (0702)
#SCQC Marketing Chair
Ron LombranoRole: Chair-Elect, ASQ Los Angeles (0700)
#SCQC ASQ 0700 Representative
Chen LowRole: Arrangements Chair,
ASQ Los Angeles (0700)
#SCQC Arrangements Chair
Chris AlexanderRole: Owner, Synergy Executive Education
#SCQC Special Advisor
Brijesh PatelRole: Chair, ASQ San Gabriel Valley (0702)
#SCQC Technology and
Registrations [email protected]
Jamie MarksRole: Chair, ASQ San Fernando Valley (0706)
#SCQC ASQ 0706 Representative

The Arrangements TeamChair: Chen Low
Volunteers:James AlexanderRon Lombrano
Harry OeiStanley Lim
Armen YeghioanJamie Marks
Mandana LotzarLilian Ore

To All ATTENDEES, SPONSORS AND VOLUNTEERS,
Without each of you, this event would not be a success.
Your contributions, time, and efforts are greatly appreciated.
The SCQC Leadership Team